Cities with the Highest Percentage of Immigrants from Caribbean in Georgia
RELATED REPORTS & OPTIONS
Caribbean
Georgia
Compare Cities
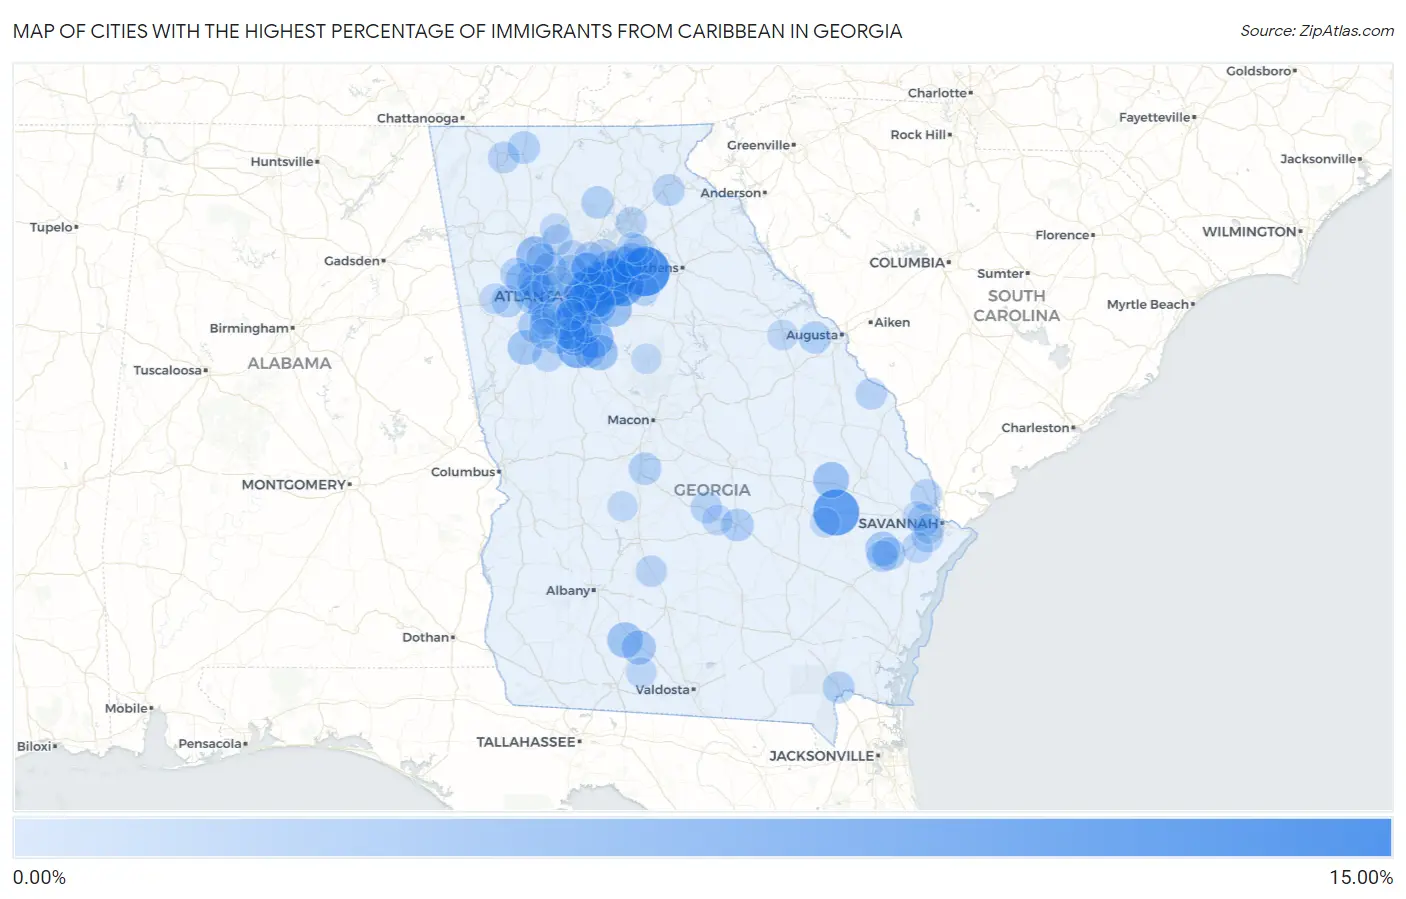
Map of Cities with the Highest Percentage of Immigrants from Caribbean in Georgia
0.00%
15.00%
Cities with the Highest Percentage of Immigrants from Caribbean in Georgia
| City | Caribbean | vs State | vs National | |
| 1. | Bethlehem | 10.37% | 1.09%(+9.27)#-1 | 1.37%(+9.00)#0 |
| 2. | Waynesville | 9.04% | 1.09%(+7.95)#0 | 1.37%(+7.67)#1 |
| 3. | Snellville | 8.95% | 1.09%(+7.85)#21 | 1.37%(+7.58)#1,445 |
| 4. | Manassas | 8.54% | 1.09%(+7.44)#22 | 1.37%(+7.16)#1,446 |
| 5. | Loganville | 6.92% | 1.09%(+5.83)#23 | 1.37%(+5.55)#1,447 |
| 6. | Stone Mountain | 6.84% | 1.09%(+5.74)#24 | 1.37%(+5.47)#1,448 |
| 7. | Panthersville | 6.42% | 1.09%(+5.32)#25 | 1.37%(+5.04)#1,449 |
| 8. | Hampton | 6.07% | 1.09%(+4.97)#26 | 1.37%(+4.69)#1,450 |
| 9. | Grayson | 5.77% | 1.09%(+4.68)#27 | 1.37%(+4.40)#1,451 |
| 10. | Redan | 5.76% | 1.09%(+4.66)#30 | 1.37%(+4.38)#1,936 |
| 11. | Gough | 5.22% | 1.09%(+4.12)#31 | 1.37%(+3.84)#1,937 |
| 12. | Mcdonough | 5.16% | 1.09%(+4.06)#32 | 1.37%(+3.78)#1,938 |
| 13. | Stonecrest | 4.89% | 1.09%(+3.79)#33 | 1.37%(+3.52)#1,939 |
| 14. | Acworth | 4.22% | 1.09%(+3.12)#34 | 1.37%(+2.84)#1,940 |
| 15. | Lawrenceville | 3.96% | 1.09%(+2.87)#35 | 1.37%(+2.59)#1,941 |
| 16. | Lithia Springs | 3.95% | 1.09%(+2.85)#36 | 1.37%(+2.57)#1,942 |
| 17. | Lovejoy | 3.86% | 1.09%(+2.77)#37 | 1.37%(+2.49)#1,943 |
| 18. | Conyers | 3.77% | 1.09%(+2.67)#38 | 1.37%(+2.39)#1,944 |
| 19. | Dacula | 3.76% | 1.09%(+2.67)#39 | 1.37%(+2.39)#1,945 |
| 20. | Morrow | 3.69% | 1.09%(+2.59)#40 | 1.37%(+2.31)#1,946 |
| 21. | Metter | 3.57% | 1.09%(+2.48)#41 | 1.37%(+2.20)#1,947 |
| 22. | Locust Grove | 3.42% | 1.09%(+2.32)#42 | 1.37%(+2.04)#1,948 |
| 23. | Funston | 3.34% | 1.09%(+2.25)#43 | 1.37%(+1.97)#1,949 |
| 24. | Mountain Park | 3.29% | 1.09%(+2.20)#44 | 1.37%(+1.92)#1,950 |
| 25. | Norcross | 3.11% | 1.09%(+2.01)#45 | 1.37%(+1.74)#1,951 |
| 26. | Newnan | 2.99% | 1.09%(+1.89)#46 | 1.37%(+1.62)#1,952 |
| 27. | Belvedere Park | 2.94% | 1.09%(+1.84)#47 | 1.37%(+1.57)#1,953 |
| 28. | Fort Stewart | 2.82% | 1.09%(+1.73)#48 | 1.37%(+1.45)#1,954 |
| 29. | Moultrie | 2.74% | 1.09%(+1.64)#49 | 1.37%(+1.37)#1,955 |
| 30. | Hiram | 2.61% | 1.09%(+1.51)#50 | 1.37%(+1.23)#1,956 |
| 31. | Auburn | 2.54% | 1.09%(+1.45)#51 | 1.37%(+1.17)#1,957 |
| 32. | Tucker | 2.43% | 1.09%(+1.34)#52 | 1.37%(+1.06)#1,958 |
| 33. | Marietta | 2.40% | 1.09%(+1.31)#53 | 1.37%(+1.03)#1,959 |
| 34. | Palmetto | 2.39% | 1.09%(+1.29)#54 | 1.37%(+1.01)#1,960 |
| 35. | South Fulton | 2.35% | 1.09%(+1.25)#55 | 1.37%(+0.975)#1,961 |
| 36. | Douglasville | 2.28% | 1.09%(+1.18)#56 | 1.37%(+0.903)#1,962 |
| 37. | Flemington | 2.25% | 1.09%(+1.15)#57 | 1.37%(+0.874)#1,963 |
| 38. | Milstead | 2.22% | 1.09%(+1.13)#58 | 1.37%(+0.850)#1,964 |
| 39. | Powder Springs | 2.19% | 1.09%(+1.09)#59 | 1.37%(+0.813)#1,965 |
| 40. | Fairfield Plantation | 2.18% | 1.09%(+1.09)#60 | 1.37%(+0.809)#1,966 |
| 41. | Mcrae Helena | 2.05% | 1.09%(+0.956)#61 | 1.37%(+0.679)#1,967 |
| 42. | Eton | 1.97% | 1.09%(+0.875)#62 | 1.37%(+0.597)#1,968 |
| 43. | Fayetteville | 1.96% | 1.09%(+0.862)#63 | 1.37%(+0.584)#1,969 |
| 44. | Perry | 1.94% | 1.09%(+0.841)#64 | 1.37%(+0.564)#1,970 |
| 45. | Lilburn | 1.93% | 1.09%(+0.838)#65 | 1.37%(+0.561)#1,971 |
| 46. | Dawsonville | 1.89% | 1.09%(+0.791)#66 | 1.37%(+0.513)#1,972 |
| 47. | Grovetown | 1.82% | 1.09%(+0.724)#67 | 1.37%(+0.447)#1,973 |
| 48. | Villa Rica | 1.80% | 1.09%(+0.703)#68 | 1.37%(+0.425)#1,974 |
| 49. | Pooler | 1.78% | 1.09%(+0.687)#69 | 1.37%(+0.409)#1,975 |
| 50. | Riverdale | 1.77% | 1.09%(+0.673)#70 | 1.37%(+0.395)#1,976 |
| 51. | North Druid Hills | 1.72% | 1.09%(+0.628)#71 | 1.37%(+0.350)#1,977 |
| 52. | Folkston | 1.69% | 1.09%(+0.600)#72 | 1.37%(+0.322)#1,978 |
| 53. | Dallas | 1.66% | 1.09%(+0.569)#73 | 1.37%(+0.291)#1,979 |
| 54. | Lithonia | 1.64% | 1.09%(+0.550)#74 | 1.37%(+0.273)#1,980 |
| 55. | Georgetown | 1.63% | 1.09%(+0.538)#75 | 1.37%(+0.261)#1,981 |
| 56. | Union City | 1.57% | 1.09%(+0.476)#76 | 1.37%(+0.198)#1,982 |
| 57. | Dalton | 1.56% | 1.09%(+0.465)#77 | 1.37%(+0.188)#1,983 |
| 58. | Rincon | 1.56% | 1.09%(+0.463)#78 | 1.37%(+0.186)#1,984 |
| 59. | Roswell | 1.55% | 1.09%(+0.458)#79 | 1.37%(+0.181)#1,985 |
| 60. | Winder | 1.54% | 1.09%(+0.447)#80 | 1.37%(+0.170)#1,986 |
| 61. | Mount Airy | 1.53% | 1.09%(+0.435)#81 | 1.37%(+0.157)#1,987 |
| 62. | Webster County Unified Government | 1.53% | 1.09%(+0.434)#82 | 1.37%(+0.157)#1,988 |
| 63. | Eastman | 1.49% | 1.09%(+0.396)#83 | 1.37%(+0.118)#1,989 |
| 64. | Hinesville | 1.49% | 1.09%(+0.394)#84 | 1.37%(+0.116)#1,990 |
| 65. | Suwanee | 1.49% | 1.09%(+0.393)#85 | 1.37%(+0.115)#2,029 |
| 66. | Girard | 1.49% | 1.09%(+0.390)#86 | 1.37%(+0.113)#2,030 |
| 67. | Ashburn | 1.44% | 1.09%(+0.349)#87 | 1.37%(+0.072)#2,031 |
| 68. | Mableton | 1.41% | 1.09%(+0.319)#88 | 1.37%(+0.042)#2,032 |
| 69. | Conley | 1.39% | 1.09%(+0.297)#89 | 1.37%(+0.019)#2,033 |
| 70. | Monroe | 1.39% | 1.09%(+0.295)#90 | 1.37%(+0.018)#2,034 |
| 71. | Johns Creek | 1.38% | 1.09%(+0.285)#91 | 1.37%(+0.008)#2,035 |
| 72. | Fairburn | 1.38% | 1.09%(+0.283)#92 | 1.37%(+0.006)#2,036 |
| 73. | Hoschton | 1.36% | 1.09%(+0.260)#93 | 1.37%(-0.017)#2,037 |
| 74. | Heron Bay | 1.33% | 1.09%(+0.239)#94 | 1.37%(-0.039)#2,038 |
| 75. | Bonanza | 1.32% | 1.09%(+0.224)#95 | 1.37%(-0.053)#2,039 |
| 76. | Gainesville | 1.32% | 1.09%(+0.221)#96 | 1.37%(-0.056)#2,040 |
| 77. | Senoia | 1.29% | 1.09%(+0.195)#97 | 1.37%(-0.082)#2,041 |
| 78. | College Park | 1.29% | 1.09%(+0.195)#98 | 1.37%(-0.083)#2,042 |
| 79. | Stockbridge | 1.26% | 1.09%(+0.166)#99 | 1.37%(-0.111)#2,043 |
| 80. | Vinings | 1.25% | 1.09%(+0.156)#100 | 1.37%(-0.121)#2,044 |
| 81. | Irondale | 1.23% | 1.09%(+0.133)#101 | 1.37%(-0.144)#2,045 |
| 82. | Kennesaw | 1.15% | 1.09%(+0.059)#102 | 1.37%(-0.218)#2,144 |
| 83. | Holly Springs | 1.15% | 1.09%(+0.050)#103 | 1.37%(-0.227)#2,145 |
| 84. | Candler Mcafee | 1.13% | 1.09%(+0.037)#104 | 1.37%(-0.241)#2,146 |
| 85. | Richmond Hill | 1.13% | 1.09%(+0.037)#105 | 1.37%(-0.241)#2,147 |
| 86. | Chauncey | 1.08% | 1.09%(-0.011)#106 | 1.37%(-0.288)#2,148 |
| 87. | Temple | 1.08% | 1.09%(-0.020)#107 | 1.37%(-0.297)#2,149 |
| 88. | Forest Park | 1.01% | 1.09%(-0.086)#108 | 1.37%(-0.363)#2,150 |
| 89. | Thomson | 0.98% | 1.09%(-0.115)#109 | 1.37%(-0.393)#2,151 |
| 90. | Pavo | 0.98% | 1.09%(-0.116)#110 | 1.37%(-0.393)#2,152 |
| 91. | Sandy Springs | 0.97% | 1.09%(-0.126)#111 | 1.37%(-0.403)#2,153 |
| 92. | Peachtree Corners | 0.92% | 1.09%(-0.177)#112 | 1.37%(-0.454)#2,154 |
| 93. | Braselton | 0.90% | 1.09%(-0.197)#113 | 1.37%(-0.474)#2,155 |
| 94. | Monticello | 0.89% | 1.09%(-0.208)#114 | 1.37%(-0.485)#2,156 |
| 95. | Bloomingdale | 0.89% | 1.09%(-0.209)#115 | 1.37%(-0.486)#2,157 |
| 96. | Byromville | 0.86% | 1.09%(-0.237)#116 | 1.37%(-0.515)#2,158 |
| 97. | Savannah | 0.85% | 1.09%(-0.246)#117 | 1.37%(-0.523)#2,159 |
| 98. | Canton | 0.84% | 1.09%(-0.250)#118 | 1.37%(-0.528)#2,160 |
| 99. | Reidsville | 0.83% | 1.09%(-0.268)#119 | 1.37%(-0.545)#2,161 |
| 100. | Tyrone | 0.82% | 1.09%(-0.278)#120 | 1.37%(-0.555)#2,162 |
Common Questions
What are the Top 10 Cities with the Highest Percentage of Immigrants from Caribbean in Georgia?
Top 10 Cities with the Highest Percentage of Immigrants from Caribbean in Georgia are:
#1
10.37%
#2
8.95%
#3
8.54%
#4
6.92%
#5
6.84%
#6
6.42%
#7
6.07%
#8
5.77%
#9
5.76%
#10
5.16%
What city has the Highest Percentage of Immigrants from Caribbean in Georgia?
Bethlehem has the Highest Percentage of Immigrants from Caribbean in Georgia with 10.37%.
What is the Percentage of Immigrants from Caribbean in the State of Georgia?
Percentage of Immigrants from Caribbean in Georgia is 1.09%.
What is the Percentage of Immigrants from Caribbean in the United States?
Percentage of Immigrants from Caribbean in the United States is 1.37%.