Riverdale, VA
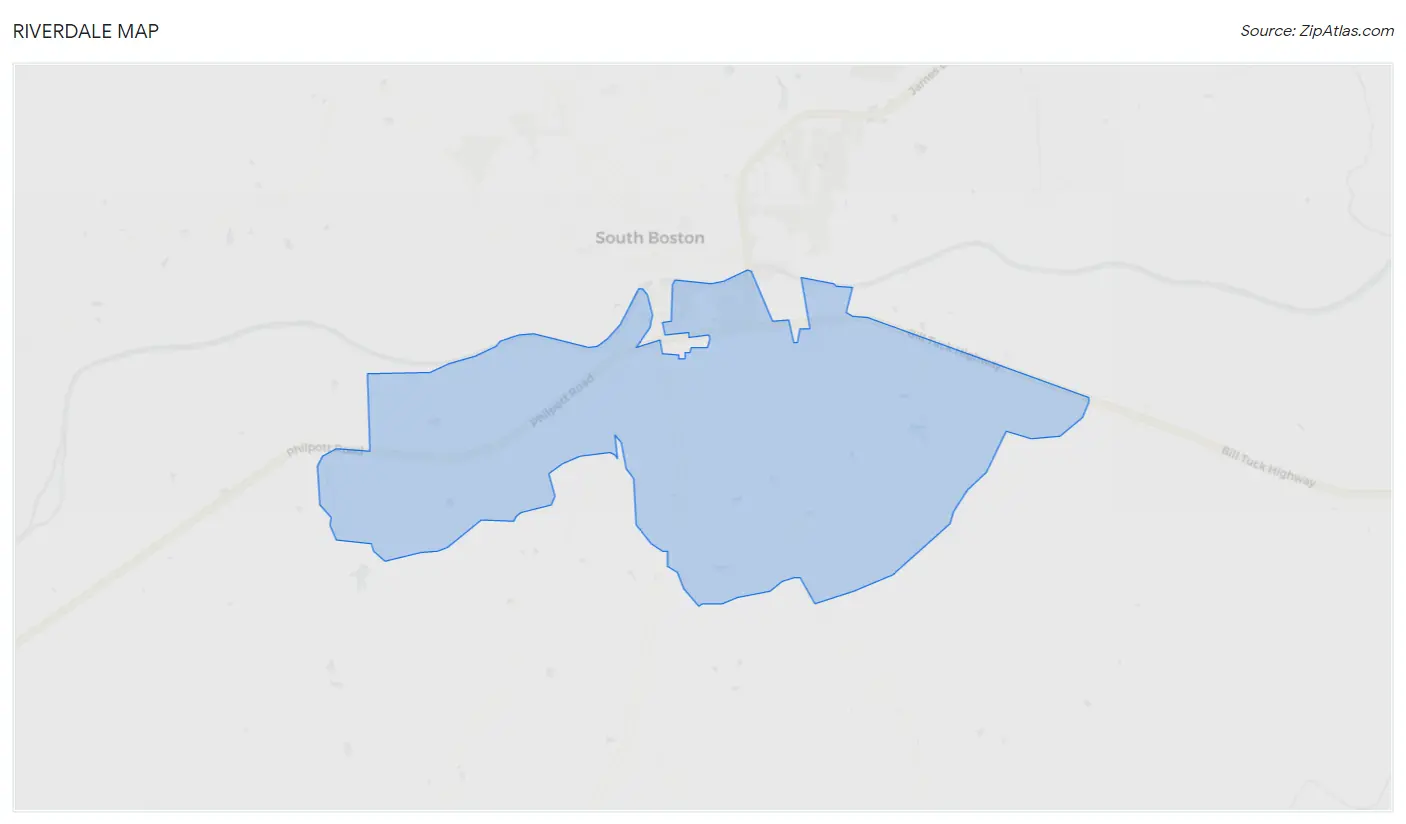
Riverdale Map
Riverdale Overview
1,046
TOTAL POPULATION
348
MALE POPULATION
698
FEMALE POPULATION
49.86
MALES / 100 FEMALES
200.57
FEMALES / 100 MALES
34.0
MEDIAN AGE
4.0
AVG FAMILY SIZE
2.9
AVG HOUSEHOLD SIZE
$24,570
PER CAPITA INCOME
$97,813
AVG FAMILY INCOME
$65,469
AVG HOUSEHOLD INCOME
0.34
INEQUALITY / GINI INDEX
302
LABOR FORCE [ PEOPLE ]
38.4%
PERCENT IN LABOR FORCE
Race in Riverdale
The most populous races in Riverdale are White / Caucasian (849 | 81.2%), Black / African American (180 | 17.2%), and Two or more Races (14 | 1.3%).
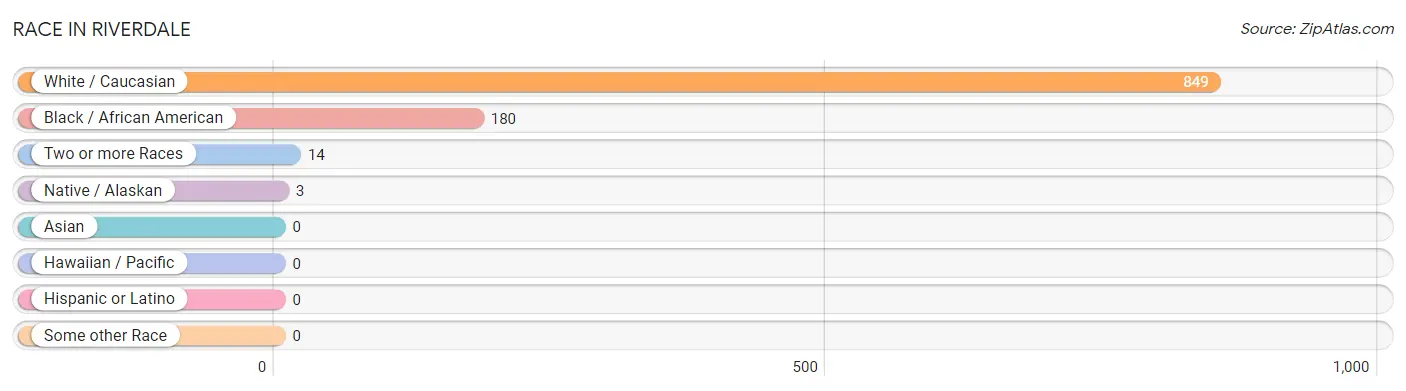
| Race | # Population | % Population |
| Asian | 0 | 0.0% |
| Black / African American | 180 | 17.2% |
| Hawaiian / Pacific | 0 | 0.0% |
| Hispanic or Latino | 0 | 0.0% |
| Native / Alaskan | 3 | 0.3% |
| White / Caucasian | 849 | 81.2% |
| Two or more Races | 14 | 1.3% |
| Some other Race | 0 | 0.0% |
| Total | 1,046 | 100.0% |
Ancestry in Riverdale
The most populous ancestries reported in Riverdale are American (662 | 63.3%), German (62 | 5.9%), English (30 | 2.9%), Haitian (23 | 2.2%), and Irish (21 | 2.0%), together accounting for 76.3% of all Riverdale residents.
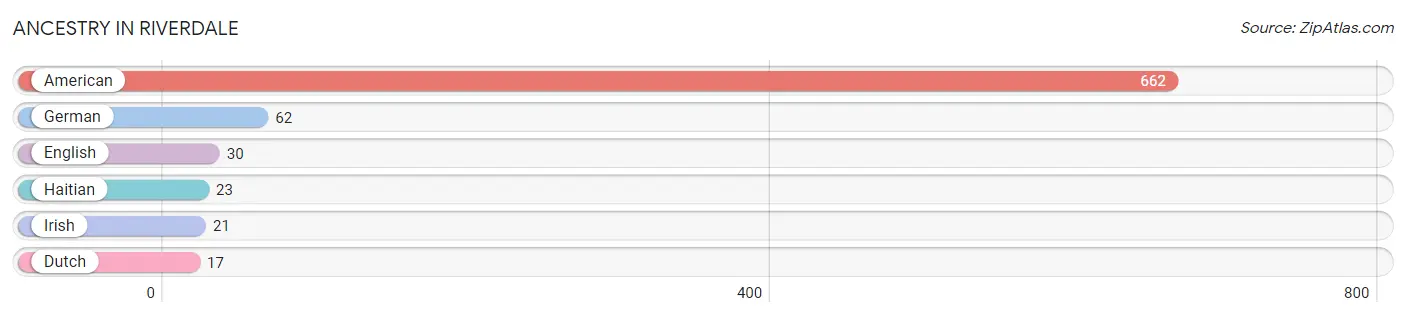
| Ancestry | # Population | % Population |
| American | 662 | 63.3% |
| Dutch | 17 | 1.6% |
| English | 30 | 2.9% |
| German | 62 | 5.9% |
| Haitian | 23 | 2.2% |
| Irish | 21 | 2.0% | View All 6 Rows |
Immigrants in Riverdale
The most numerous immigrant groups reported in Riverdale came from Caribbean (23 | 2.2%), Haiti (23 | 2.2%), and Latin America (23 | 2.2%), together accounting for 6.6% of all Riverdale residents.
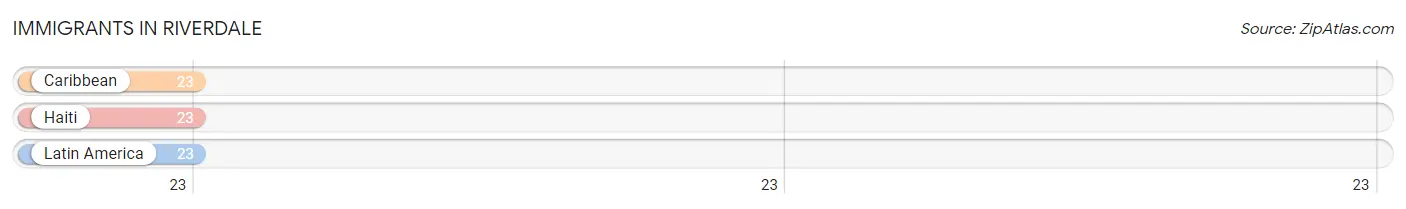
| Immigration Origin | # Population | % Population |
| Caribbean | 23 | 2.2% |
| Haiti | 23 | 2.2% |
| Latin America | 23 | 2.2% | View All 3 Rows |
Sex and Age in Riverdale
Sex and Age in Riverdale
The most populous age groups in Riverdale are 5 to 9 Years (71 | 20.4%) for men and 25 to 29 Years (176 | 25.2%) for women.
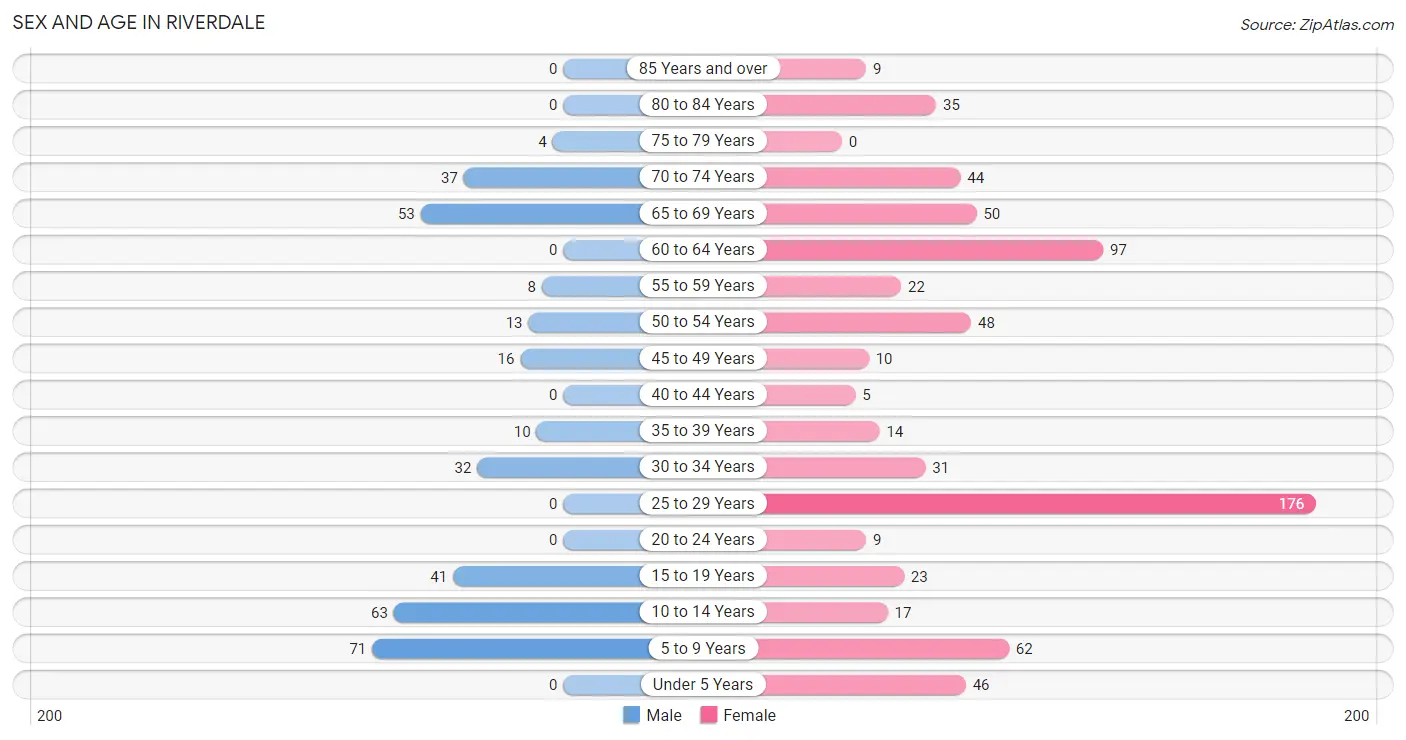
| Age Bracket | Male | Female |
| Under 5 Years | 0 (0.0%) | 46 (6.6%) |
| 5 to 9 Years | 71 (20.4%) | 62 (8.9%) |
| 10 to 14 Years | 63 (18.1%) | 17 (2.4%) |
| 15 to 19 Years | 41 (11.8%) | 23 (3.3%) |
| 20 to 24 Years | 0 (0.0%) | 9 (1.3%) |
| 25 to 29 Years | 0 (0.0%) | 176 (25.2%) |
| 30 to 34 Years | 32 (9.2%) | 31 (4.4%) |
| 35 to 39 Years | 10 (2.9%) | 14 (2.0%) |
| 40 to 44 Years | 0 (0.0%) | 5 (0.7%) |
| 45 to 49 Years | 16 (4.6%) | 10 (1.4%) |
| 50 to 54 Years | 13 (3.7%) | 48 (6.9%) |
| 55 to 59 Years | 8 (2.3%) | 22 (3.2%) |
| 60 to 64 Years | 0 (0.0%) | 97 (13.9%) |
| 65 to 69 Years | 53 (15.2%) | 50 (7.2%) |
| 70 to 74 Years | 37 (10.6%) | 44 (6.3%) |
| 75 to 79 Years | 4 (1.1%) | 0 (0.0%) |
| 80 to 84 Years | 0 (0.0%) | 35 (5.0%) |
| 85 Years and over | 0 (0.0%) | 9 (1.3%) |
| Total | 348 (100.0%) | 698 (100.0%) |
Families and Households in Riverdale
Median Family Size in Riverdale
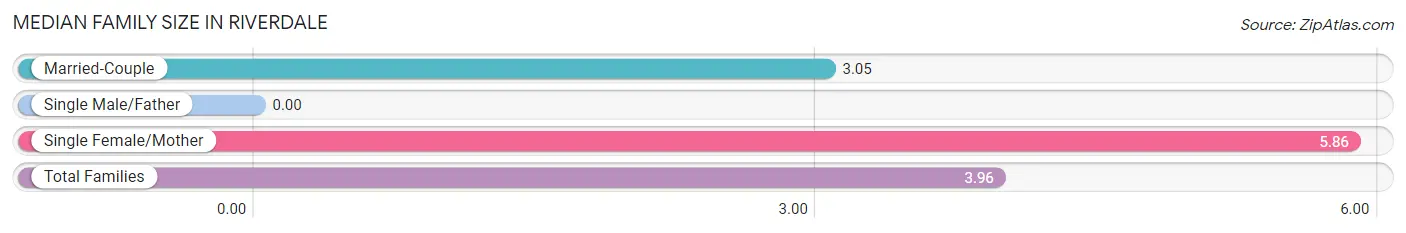
| Family Type | # Families | Family Size |
| Married-Couple | 155 (67.7%) | 3.05 |
| Single Male/Father | 0 (0.0%) | - |
| Single Female/Mother | 74 (32.3%) | 5.86 |
| Total Families | 229 (100.0%) | 3.96 |
Median Household Size in Riverdale
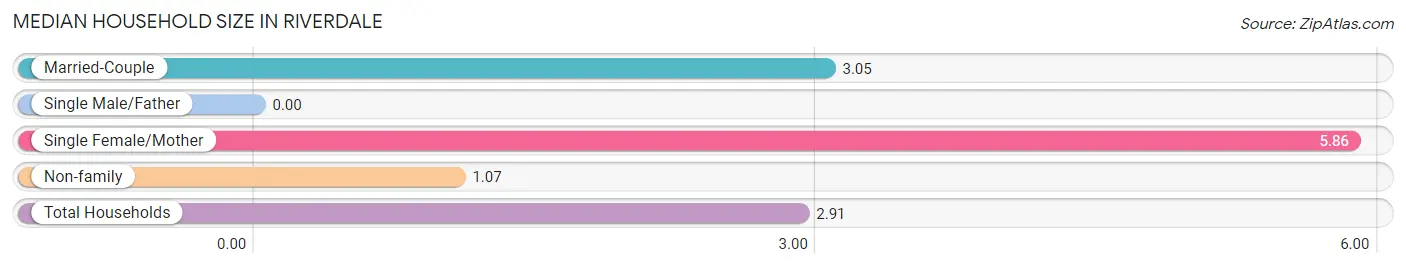
| Household Type | # Households | Household Size |
| Married-Couple | 155 (43.2%) | 3.05 |
| Single Male/Father | 0 (0.0%) | - |
| Single Female/Mother | 74 (20.6%) | 5.86 |
| Non-family | 130 (36.2%) | 1.07 |
| Total Households | 359 (100.0%) | 2.91 |
Household Size by Marriage Status in Riverdale
Out of a total of 359 households in Riverdale, 229 (63.8%) are family households, while 130 (36.2%) are nonfamily households. The most numerous type of family households are 2-person households, comprising 99, and the most common type of nonfamily households are 1-person households, comprising 116.
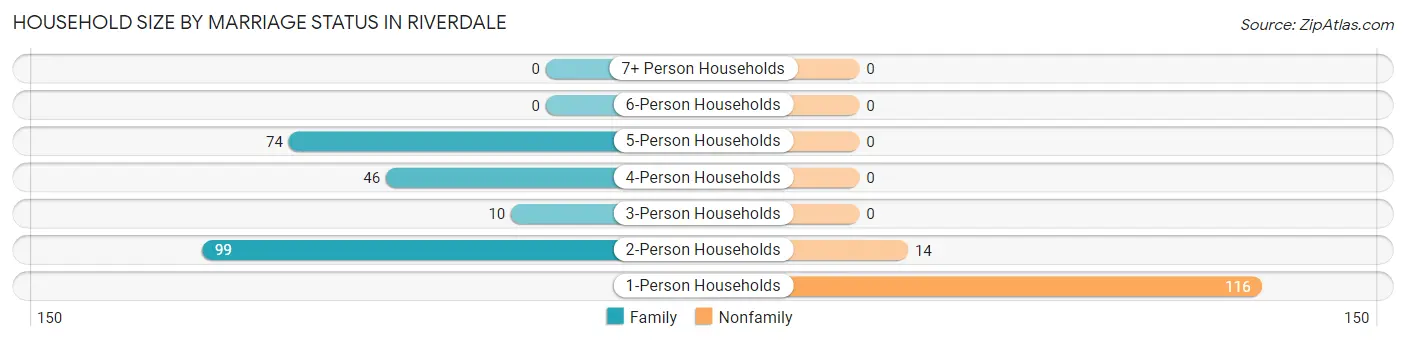
| Household Size | Family Households | Nonfamily Households |
| 1-Person Households | - | 116 (32.3%) |
| 2-Person Households | 99 (27.6%) | 14 (3.9%) |
| 3-Person Households | 10 (2.8%) | 0 (0.0%) |
| 4-Person Households | 46 (12.8%) | 0 (0.0%) |
| 5-Person Households | 74 (20.6%) | 0 (0.0%) |
| 6-Person Households | 0 (0.0%) | 0 (0.0%) |
| 7+ Person Households | 0 (0.0%) | 0 (0.0%) |
| Total | 229 (63.8%) | 130 (36.2%) |
Female Fertility in Riverdale
Fertility by Age in Riverdale
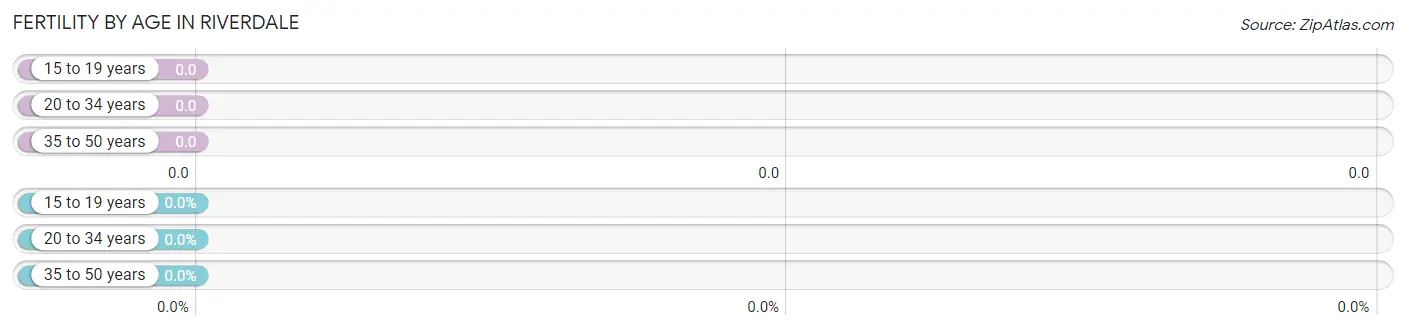
| Age Bracket | Women with Births | Births / 1,000 Women |
| 15 to 19 years | 0 (0.0%) | 0.0 |
| 20 to 34 years | 0 (0.0%) | 0.0 |
| 35 to 50 years | 0 (0.0%) | 0.0 |
| Total | 0 (0.0%) | 0.0 |
Fertility by Age by Marriage Status in Riverdale
| Age Bracket | Married | Unmarried |
| 15 to 19 years | 0 (0.0%) | 0 (0.0%) |
| 20 to 34 years | 0 (0.0%) | 0 (0.0%) |
| 35 to 50 years | 0 (0.0%) | 0 (0.0%) |
| Total | 0 (0.0%) | 0 (0.0%) |
Fertility by Education in Riverdale
| Educational Attainment | Women with Births | Births / 1,000 Women |
| Less than High School | 0 (0.0%) | 0.0 |
| High School Diploma | 0 (0.0%) | 0.0 |
| College or Associate's Degree | 0 (0.0%) | 0.0 |
| Bachelor's Degree | 0 (0.0%) | 0.0 |
| Graduate Degree | 0 (0.0%) | 0.0 |
| Total | 0 (0.0%) | 0.0 |
Fertility by Education by Marriage Status in Riverdale
| Educational Attainment | Married | Unmarried |
| Less than High School | 0 (0.0%) | 0 (0.0%) |
| High School Diploma | 0 (0.0%) | 0 (0.0%) |
| College or Associate's Degree | 0 (0.0%) | 0 (0.0%) |
| Bachelor's Degree | 0 (0.0%) | 0 (0.0%) |
| Graduate Degree | 0 (0.0%) | 0 (0.0%) |
| Total | 0 (0.0%) | 0 (0.0%) |
Income in Riverdale
Income Overview in Riverdale
Per Capita Income in Riverdale is $24,570, while median incomes of families and households are $97,813 and $65,469 respectively.
| Characteristic | Number | Measure |
| Per Capita Income | 1,046 | $24,570 |
| Median Family Income | 229 | $97,813 |
| Mean Family Income | 229 | $84,617 |
| Median Household Income | 359 | $65,469 |
| Mean Household Income | 359 | $66,288 |
| Income Deficit | 229 | $0 |
| Wage / Income Gap (%) | 1,046 | 0.00% |
| Wage / Income Gap ($) | 1,046 | 100.00¢ per $1 |
| Gini / Inequality Index | 1,046 | 0.34 |
Earnings by Sex in Riverdale
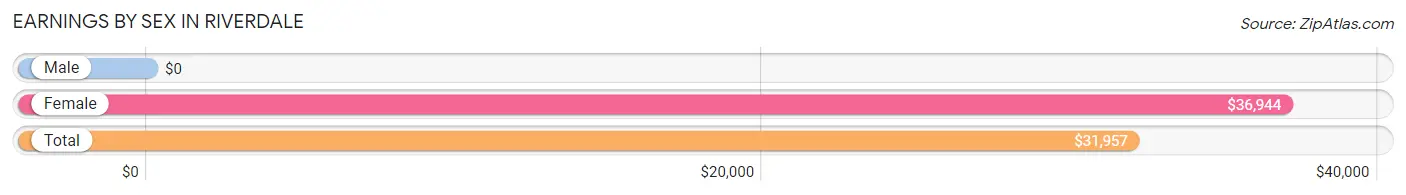
| Sex | Number | Average Earnings |
| Male | 120 (39.0%) | $0 |
| Female | 188 (61.0%) | $36,944 |
| Total | 308 (100.0%) | $31,957 |
Earnings by Sex by Income Bracket in Riverdale
The most common earnings brackets in Riverdale are $2,499 or less for men (54 | 45.0%) and $55,000 to $64,999 for women (33 | 17.5%).
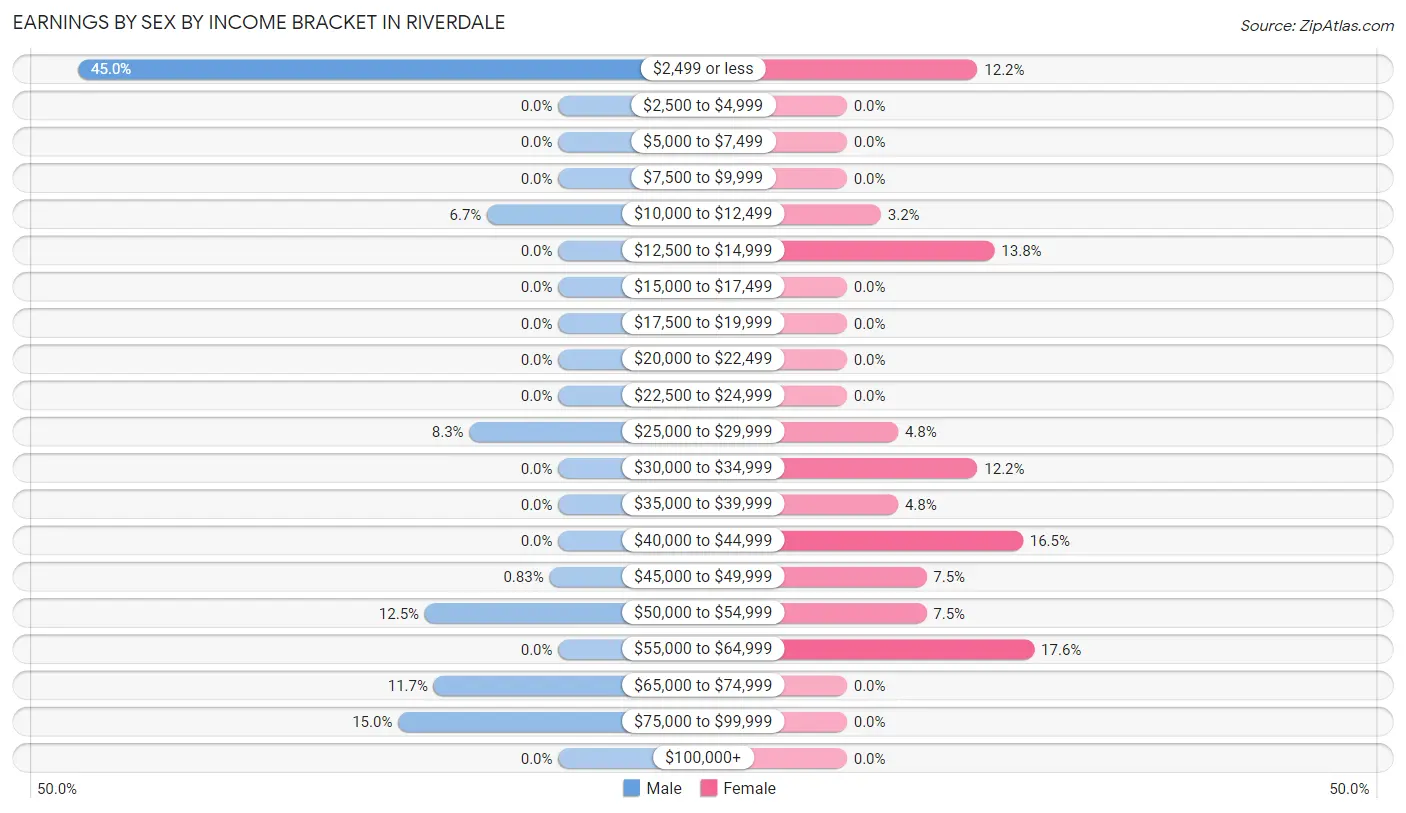
| Income | Male | Female |
| $2,499 or less | 54 (45.0%) | 23 (12.2%) |
| $2,500 to $4,999 | 0 (0.0%) | 0 (0.0%) |
| $5,000 to $7,499 | 0 (0.0%) | 0 (0.0%) |
| $7,500 to $9,999 | 0 (0.0%) | 0 (0.0%) |
| $10,000 to $12,499 | 8 (6.7%) | 6 (3.2%) |
| $12,500 to $14,999 | 0 (0.0%) | 26 (13.8%) |
| $15,000 to $17,499 | 0 (0.0%) | 0 (0.0%) |
| $17,500 to $19,999 | 0 (0.0%) | 0 (0.0%) |
| $20,000 to $22,499 | 0 (0.0%) | 0 (0.0%) |
| $22,500 to $24,999 | 0 (0.0%) | 0 (0.0%) |
| $25,000 to $29,999 | 10 (8.3%) | 9 (4.8%) |
| $30,000 to $34,999 | 0 (0.0%) | 23 (12.2%) |
| $35,000 to $39,999 | 0 (0.0%) | 9 (4.8%) |
| $40,000 to $44,999 | 0 (0.0%) | 31 (16.5%) |
| $45,000 to $49,999 | 1 (0.8%) | 14 (7.4%) |
| $50,000 to $54,999 | 15 (12.5%) | 14 (7.4%) |
| $55,000 to $64,999 | 0 (0.0%) | 33 (17.5%) |
| $65,000 to $74,999 | 14 (11.7%) | 0 (0.0%) |
| $75,000 to $99,999 | 18 (15.0%) | 0 (0.0%) |
| $100,000+ | 0 (0.0%) | 0 (0.0%) |
| Total | 120 (100.0%) | 188 (100.0%) |
Earnings by Sex by Educational Attainment in Riverdale
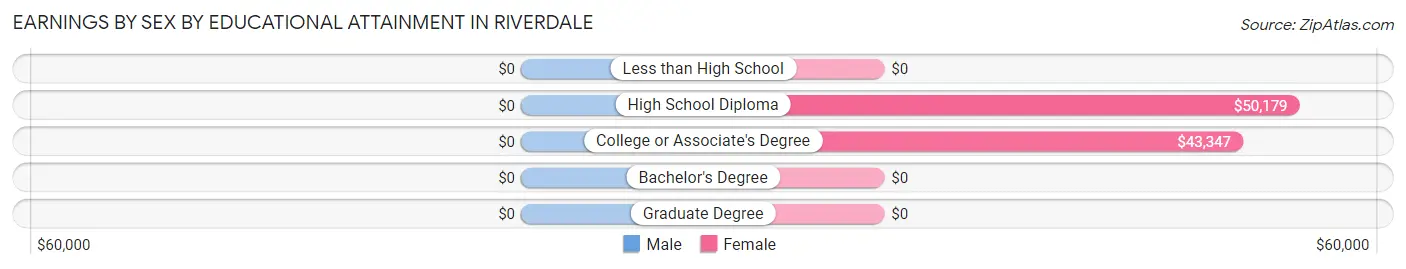
| Educational Attainment | Male Income | Female Income |
| Less than High School | - | - |
| High School Diploma | - | - |
| College or Associate's Degree | - | - |
| Bachelor's Degree | - | - |
| Graduate Degree | - | - |
| Total | $51,250 | $43,629 |
Family Income in Riverdale
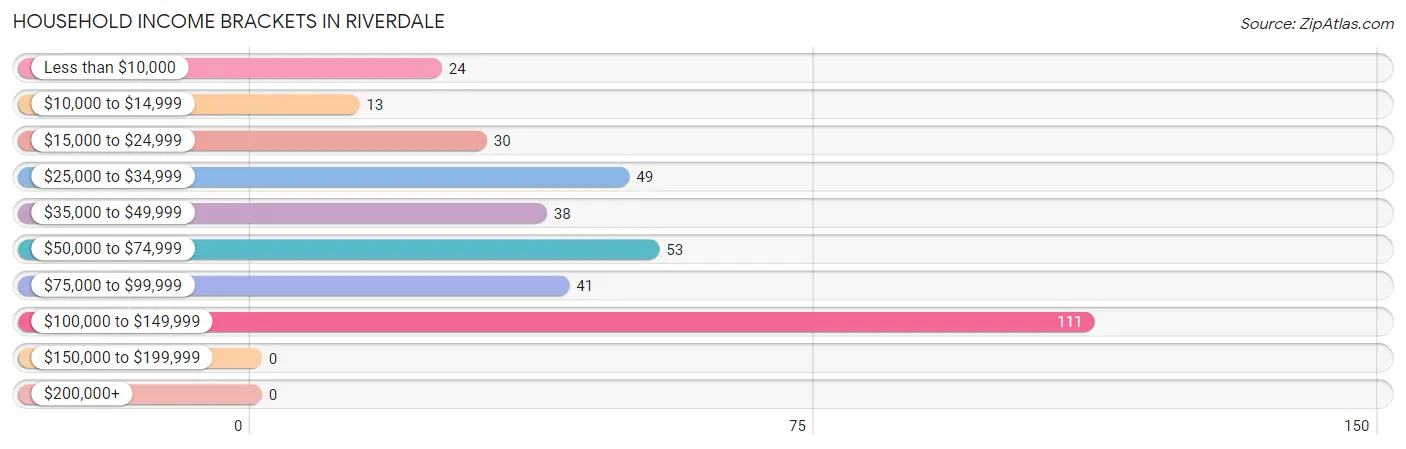
Family Income Brackets in Riverdale
According to the Riverdale family income data, there are 111 families falling into the $100,000 to $149,999 income range, which is the most common income bracket and makes up 48.5% of all families.
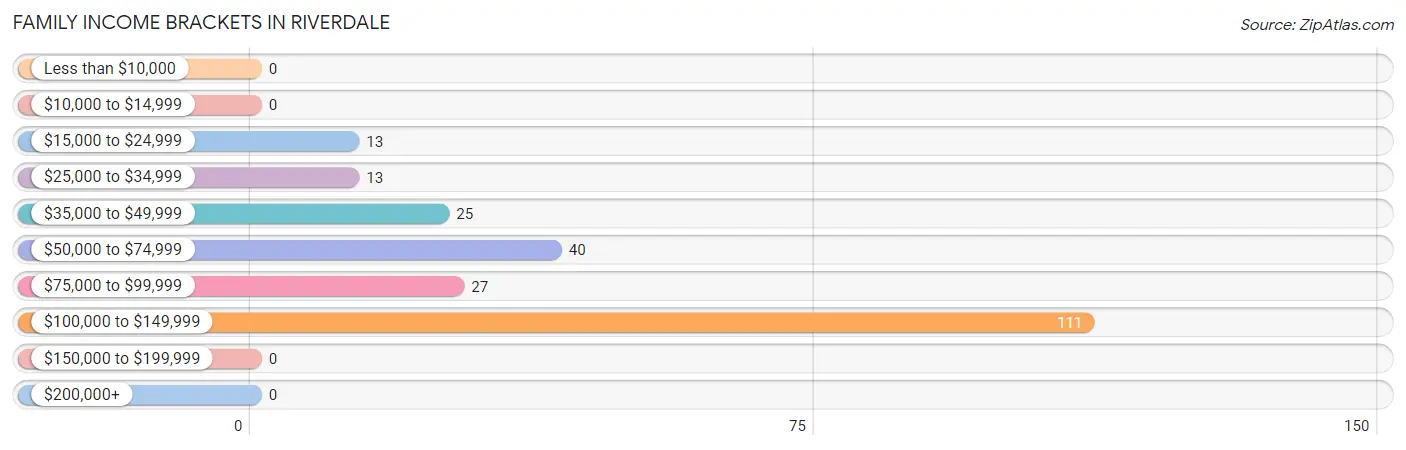
| Income Bracket | # Families | % Families |
| Less than $10,000 | 0 | 0.0% |
| $10,000 to $14,999 | 0 | 0.0% |
| $15,000 to $24,999 | 13 | 5.7% |
| $25,000 to $34,999 | 13 | 5.7% |
| $35,000 to $49,999 | 25 | 10.9% |
| $50,000 to $74,999 | 40 | 17.5% |
| $75,000 to $99,999 | 27 | 11.8% |
| $100,000 to $149,999 | 111 | 48.5% |
| $150,000 to $199,999 | 0 | 0.0% |
| $200,000+ | 0 | 0.0% |
Family Income by Famaliy Size in Riverdale
2-person families (99 | 43.2%) account for the highest median family income in Riverdale with $66,719 per family, while 2-person families (99 | 43.2%) have the highest median income of $33,360 per family member.
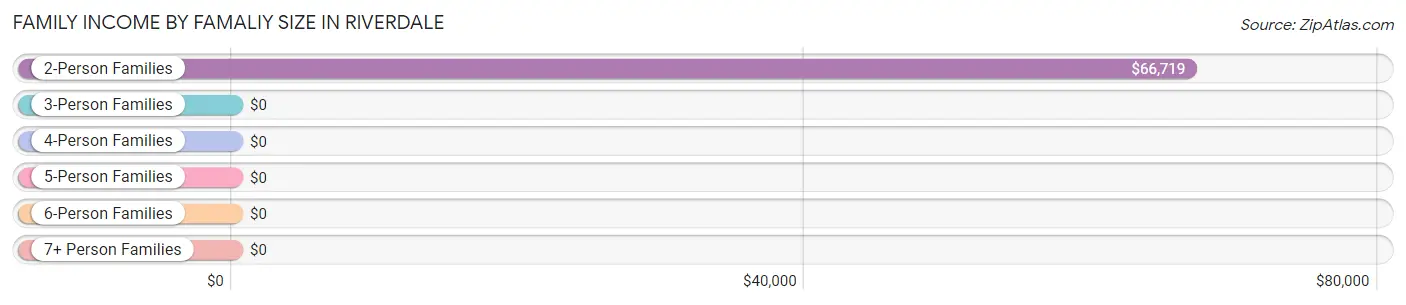
| Income Bracket | # Families | Median Income |
| 2-Person Families | 99 (43.2%) | $66,719 |
| 3-Person Families | 10 (4.4%) | $0 |
| 4-Person Families | 46 (20.1%) | $0 |
| 5-Person Families | 74 (32.3%) | $0 |
| 6-Person Families | 0 (0.0%) | $0 |
| 7+ Person Families | 0 (0.0%) | $0 |
| Total | 229 (100.0%) | $97,813 |
Family Income by Number of Earners in Riverdale
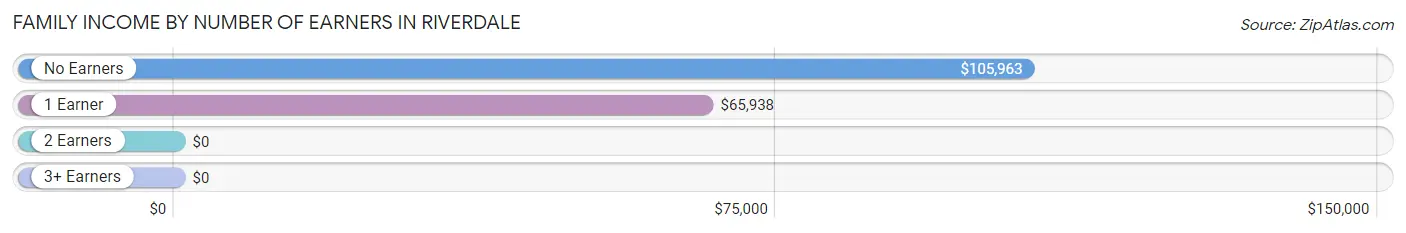
| Number of Earners | # Families | Median Income |
| No Earners | 109 (47.6%) | $105,963 |
| 1 Earner | 60 (26.2%) | $65,938 |
| 2 Earners | 50 (21.8%) | $0 |
| 3+ Earners | 10 (4.4%) | $0 |
| Total | 229 (100.0%) | $97,813 |
Household Income in Riverdale
Household Income Brackets in Riverdale
With 111 households falling in the category, the $100,000 to $149,999 income range is the most frequent in Riverdale, accounting for 30.9% of all households.
| Income Bracket | # Households | % Households |
| Less than $10,000 | 24 | 6.7% |
| $10,000 to $14,999 | 13 | 3.6% |
| $15,000 to $24,999 | 30 | 8.4% |
| $25,000 to $34,999 | 49 | 13.6% |
| $35,000 to $49,999 | 38 | 10.6% |
| $50,000 to $74,999 | 53 | 14.8% |
| $75,000 to $99,999 | 41 | 11.4% |
| $100,000 to $149,999 | 111 | 30.9% |
| $150,000 to $199,999 | 0 | 0.0% |
| $200,000+ | 0 | 0.0% |
Household Income by Householder Age in Riverdale
The median household income in Riverdale is $65,469, with the highest median household income of $91,518 found in the 25 to 44 years age bracket for the primary householder. A total of 47 households (13.1%) fall into this category.
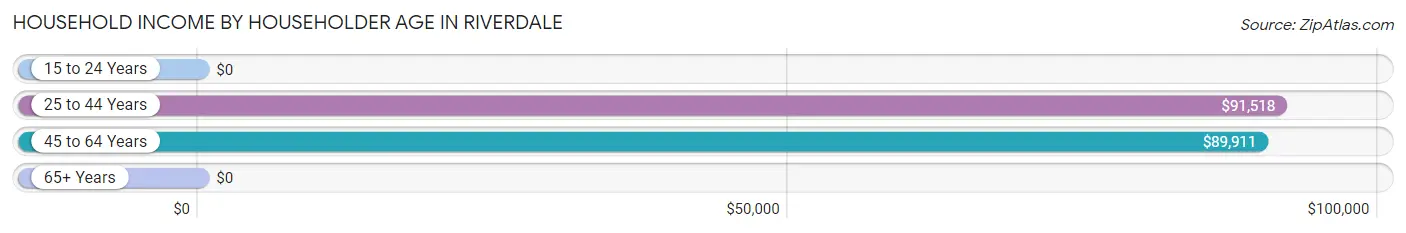
| Income Bracket | # Households | Median Income |
| 15 to 24 Years | 0 (0.0%) | $0 |
| 25 to 44 Years | 47 (13.1%) | $91,518 |
| 45 to 64 Years | 169 (47.1%) | $89,911 |
| 65+ Years | 143 (39.8%) | $0 |
| Total | 359 (100.0%) | $65,469 |
Poverty in Riverdale
Income Below Poverty by Sex and Age in Riverdale
With 9.2% poverty level for males and 9.2% for females among the residents of Riverdale, 18 to 24 year old males and 75 year old and over females are the most vulnerable to poverty, with 19 males (46.3%) and 37 females (84.1%) in their respective age groups living below the poverty level.
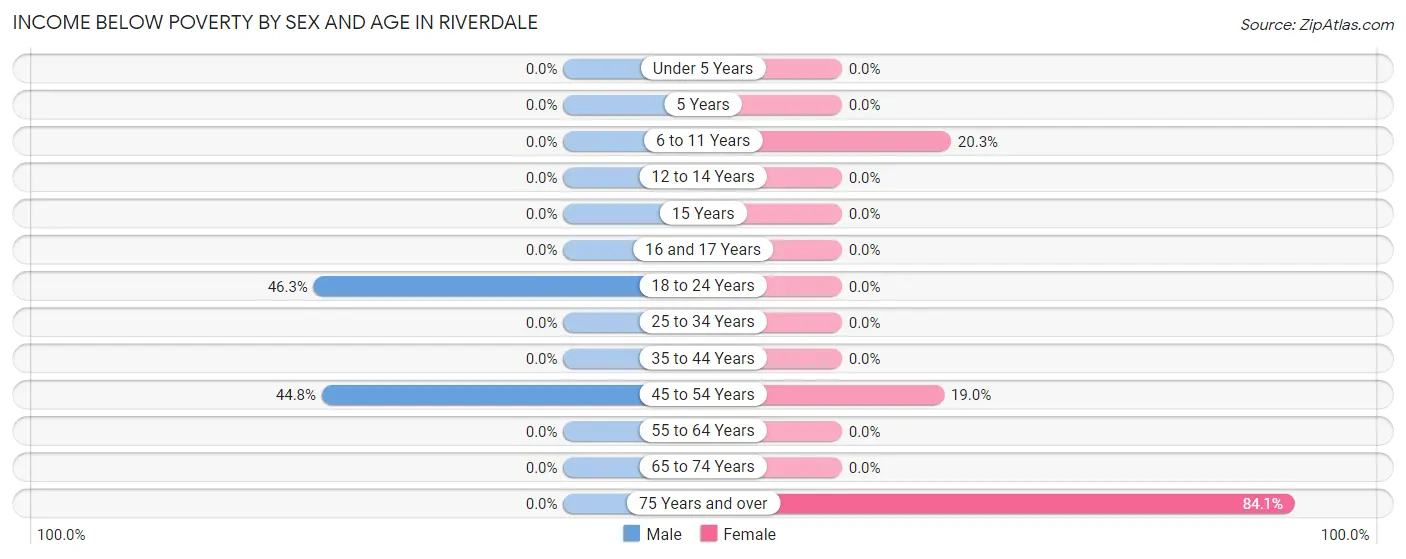
| Age Bracket | Male | Female |
| Under 5 Years | 0 (0.0%) | 0 (0.0%) |
| 5 Years | 0 (0.0%) | 0 (0.0%) |
| 6 to 11 Years | 0 (0.0%) | 16 (20.3%) |
| 12 to 14 Years | 0 (0.0%) | 0 (0.0%) |
| 15 Years | 0 (0.0%) | 0 (0.0%) |
| 16 and 17 Years | 0 (0.0%) | 0 (0.0%) |
| 18 to 24 Years | 19 (46.3%) | 0 (0.0%) |
| 25 to 34 Years | 0 (0.0%) | 0 (0.0%) |
| 35 to 44 Years | 0 (0.0%) | 0 (0.0%) |
| 45 to 54 Years | 13 (44.8%) | 11 (19.0%) |
| 55 to 64 Years | 0 (0.0%) | 0 (0.0%) |
| 65 to 74 Years | 0 (0.0%) | 0 (0.0%) |
| 75 Years and over | 0 (0.0%) | 37 (84.1%) |
| Total | 32 (9.2%) | 64 (9.2%) |
Income Above Poverty by Sex and Age in Riverdale
According to the poverty statistics in Riverdale, males aged 6 to 11 years and females aged under 5 years are the age groups that are most secure financially, with 100.0% of males and 100.0% of females in these age groups living above the poverty line.
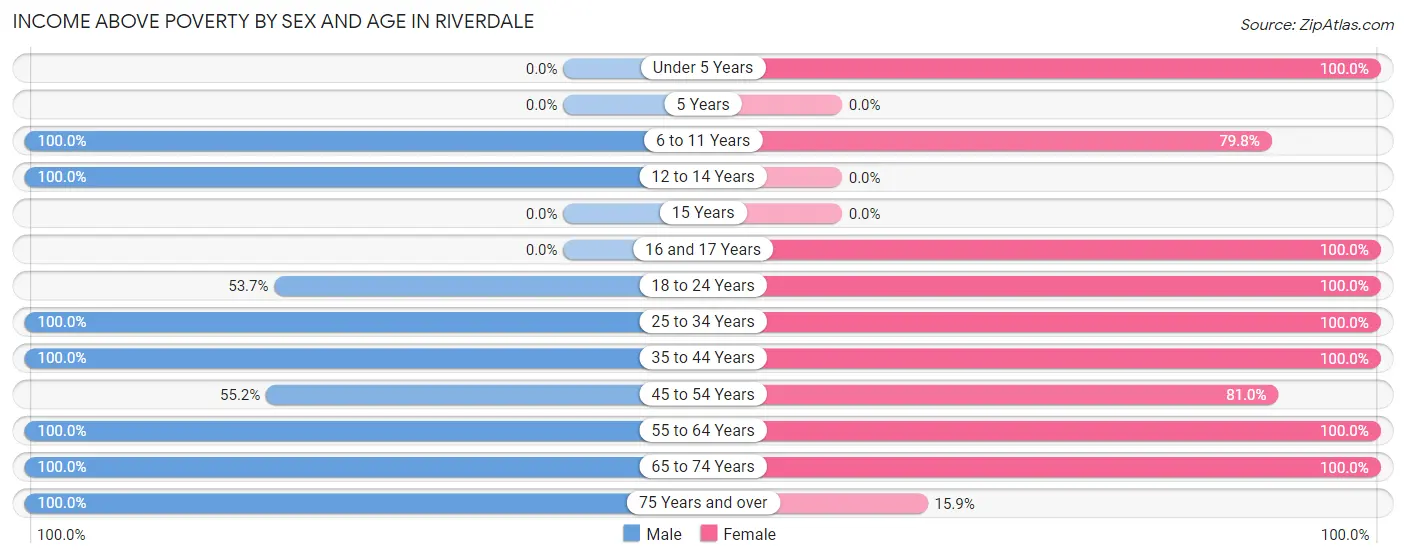
| Age Bracket | Male | Female |
| Under 5 Years | 0 (0.0%) | 46 (100.0%) |
| 5 Years | 0 (0.0%) | 0 (0.0%) |
| 6 to 11 Years | 71 (100.0%) | 63 (79.7%) |
| 12 to 14 Years | 63 (100.0%) | 0 (0.0%) |
| 15 Years | 0 (0.0%) | 0 (0.0%) |
| 16 and 17 Years | 0 (0.0%) | 23 (100.0%) |
| 18 to 24 Years | 22 (53.7%) | 9 (100.0%) |
| 25 to 34 Years | 32 (100.0%) | 207 (100.0%) |
| 35 to 44 Years | 10 (100.0%) | 19 (100.0%) |
| 45 to 54 Years | 16 (55.2%) | 47 (81.0%) |
| 55 to 64 Years | 8 (100.0%) | 119 (100.0%) |
| 65 to 74 Years | 90 (100.0%) | 94 (100.0%) |
| 75 Years and over | 4 (100.0%) | 7 (15.9%) |
| Total | 316 (90.8%) | 634 (90.8%) |
Income Below Poverty Among Married-Couple Families in Riverdale
The poverty statistics for married-couple families in Riverdale show that 8.4% or 13 of the total 155 families live below the poverty line. Families with 1 or 2 children have the highest poverty rate of 28.3%, comprising of 13 families. On the other hand, families with no children have the lowest poverty rate of 0.0%, which includes 0 families.
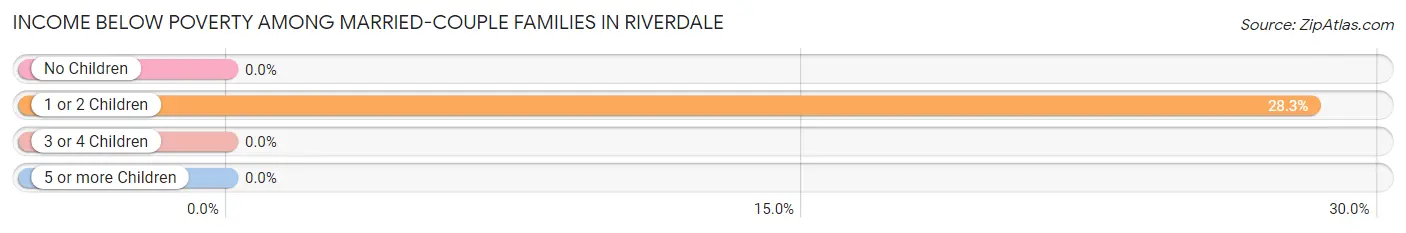
| Children | Above Poverty | Below Poverty |
| No Children | 109 (100.0%) | 0 (0.0%) |
| 1 or 2 Children | 33 (71.7%) | 13 (28.3%) |
| 3 or 4 Children | 0 (0.0%) | 0 (0.0%) |
| 5 or more Children | 0 (0.0%) | 0 (0.0%) |
| Total | 142 (91.6%) | 13 (8.4%) |
Income Below Poverty Among Single-Parent Households in Riverdale
| Children | Single Father | Single Mother |
| No Children | 0 (0.0%) | 0 (0.0%) |
| 1 or 2 Children | 0 (0.0%) | 0 (0.0%) |
| 3 or 4 Children | 0 (0.0%) | 0 (0.0%) |
| 5 or more Children | 0 (0.0%) | 0 (0.0%) |
| Total | 0 (0.0%) | 0 (0.0%) |
Income Below Poverty Among Married-Couple vs Single-Parent Households in Riverdale
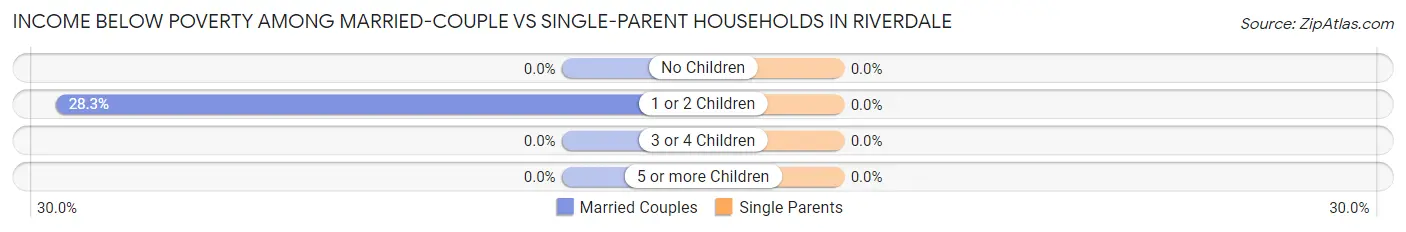
| Children | Married-Couple Families | Single-Parent Households |
| No Children | 0 (0.0%) | 0 (0.0%) |
| 1 or 2 Children | 13 (28.3%) | 0 (0.0%) |
| 3 or 4 Children | 0 (0.0%) | 0 (0.0%) |
| 5 or more Children | 0 (0.0%) | 0 (0.0%) |
| Total | 13 (8.4%) | 0 (0.0%) |
Employment Characteristics in Riverdale
Employment by Class of Employer in Riverdale
Among the 292 employed individuals in Riverdale, private company employees (265 | 90.7%), self-employed (not incorporated) (18 | 6.2%), and local government employees (9 | 3.1%) make up the most common classes of employment.
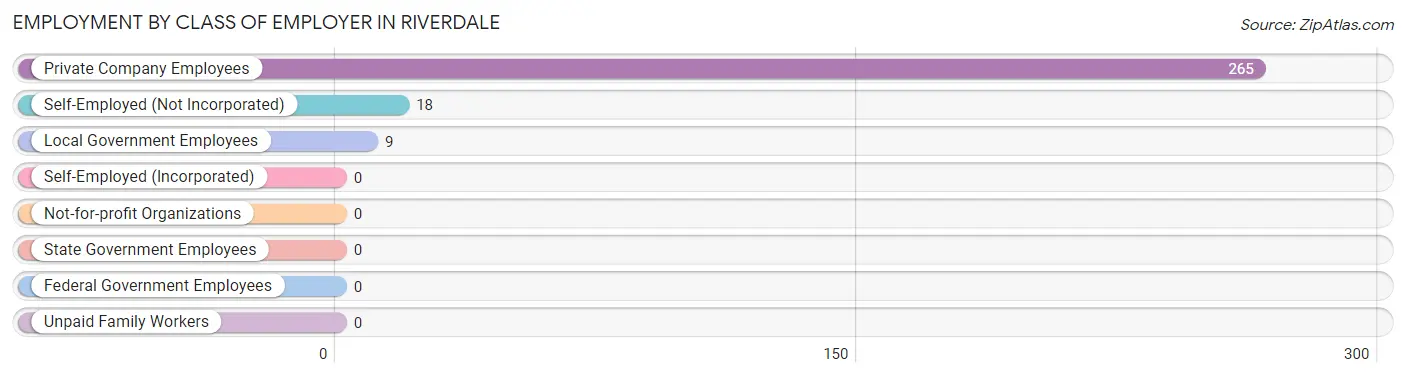
| Employer Class | # Employees | % Employees |
| Private Company Employees | 265 | 90.7% |
| Self-Employed (Incorporated) | 0 | 0.0% |
| Self-Employed (Not Incorporated) | 18 | 6.2% |
| Not-for-profit Organizations | 0 | 0.0% |
| Local Government Employees | 9 | 3.1% |
| State Government Employees | 0 | 0.0% |
| Federal Government Employees | 0 | 0.0% |
| Unpaid Family Workers | 0 | 0.0% |
| Total | 292 | 100.0% |
Employment Status by Age in Riverdale
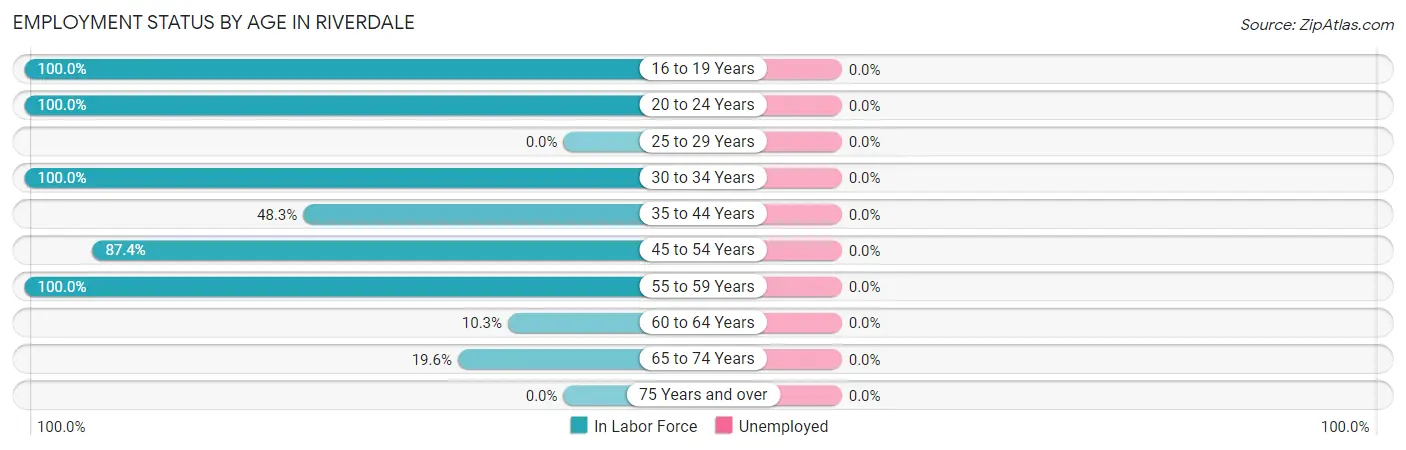
| Age Bracket | In Labor Force | Unemployed |
| 16 to 19 Years | 64 (100.0%) | 0 (0.0%) |
| 20 to 24 Years | 9 (100.0%) | 0 (0.0%) |
| 25 to 29 Years | 0 (0.0%) | 0 (0.0%) |
| 30 to 34 Years | 63 (100.0%) | 0 (0.0%) |
| 35 to 44 Years | 14 (48.3%) | 0 (0.0%) |
| 45 to 54 Years | 76 (87.4%) | 0 (0.0%) |
| 55 to 59 Years | 30 (100.0%) | 0 (0.0%) |
| 60 to 64 Years | 10 (10.3%) | 0 (0.0%) |
| 65 to 74 Years | 36 (19.6%) | 0 (0.0%) |
| 75 Years and over | 0 (0.0%) | 0 (0.0%) |
| Total | 302 (38.4%) | 0 (0.0%) |
Employment Status by Educational Attainment in Riverdale
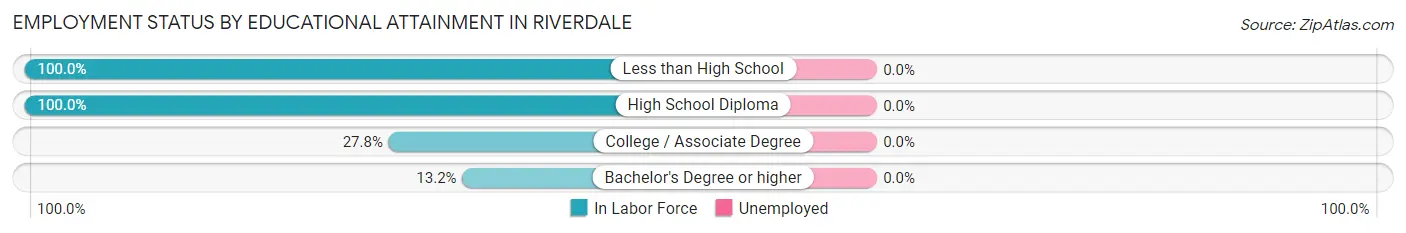
| Educational Attainment | In Labor Force | Unemployed |
| Less than High School | 23 (100.0%) | 0 (0.0%) |
| High School Diploma | 80 (100.0%) | 0 (0.0%) |
| College / Associate Degree | 76 (27.8%) | 0 (0.0%) |
| Bachelor's Degree or higher | 14 (13.2%) | 0 (0.0%) |
| Total | 193 (40.0%) | 0 (0.0%) |
Employment Occupations by Sex in Riverdale
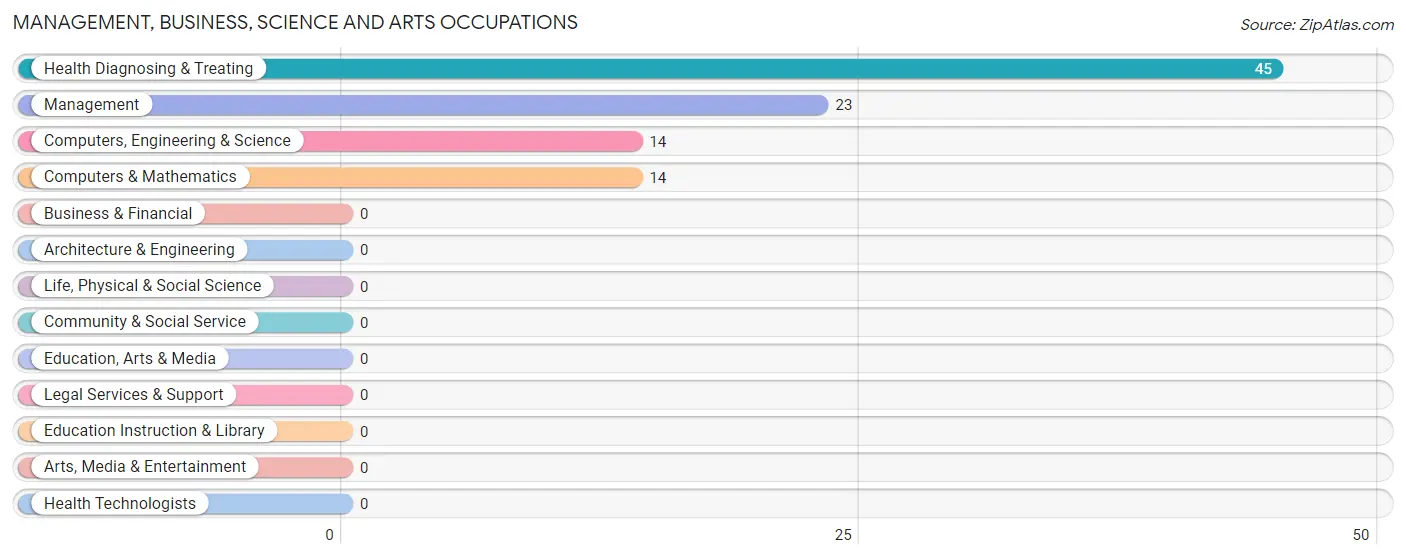
Management, Business, Science and Arts Occupations
The most common Management, Business, Science and Arts occupations in Riverdale are Health Diagnosing & Treating (45 | 14.9%), Management (23 | 7.6%), Computers, Engineering & Science (14 | 4.6%), and Computers & Mathematics (14 | 4.6%).
Management, Business, Science and Arts Occupations by Sex
Within the Management, Business, Science and Arts occupations in Riverdale, the most male-oriented occupations are Computers, Engineering & Science (100.0%), and Computers & Mathematics (100.0%), while the most female-oriented occupations are Management (100.0%), and Health Diagnosing & Treating (100.0%).
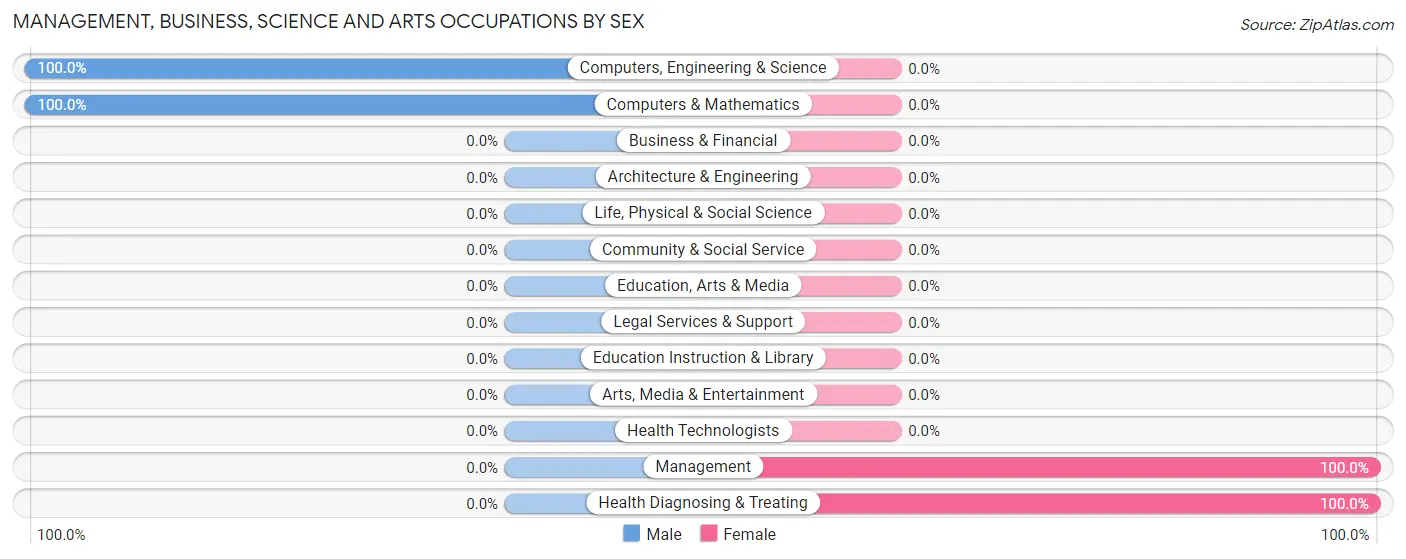
| Occupation | Male | Female |
| Management | 0 (0.0%) | 23 (100.0%) |
| Business & Financial | 0 (0.0%) | 0 (0.0%) |
| Computers, Engineering & Science | 14 (100.0%) | 0 (0.0%) |
| Computers & Mathematics | 14 (100.0%) | 0 (0.0%) |
| Architecture & Engineering | 0 (0.0%) | 0 (0.0%) |
| Life, Physical & Social Science | 0 (0.0%) | 0 (0.0%) |
| Community & Social Service | 0 (0.0%) | 0 (0.0%) |
| Education, Arts & Media | 0 (0.0%) | 0 (0.0%) |
| Legal Services & Support | 0 (0.0%) | 0 (0.0%) |
| Education Instruction & Library | 0 (0.0%) | 0 (0.0%) |
| Arts, Media & Entertainment | 0 (0.0%) | 0 (0.0%) |
| Health Diagnosing & Treating | 0 (0.0%) | 45 (100.0%) |
| Health Technologists | 0 (0.0%) | 0 (0.0%) |
| Total (Category) | 14 (17.1%) | 68 (82.9%) |
| Total (Overall) | 120 (39.7%) | 182 (60.3%) |
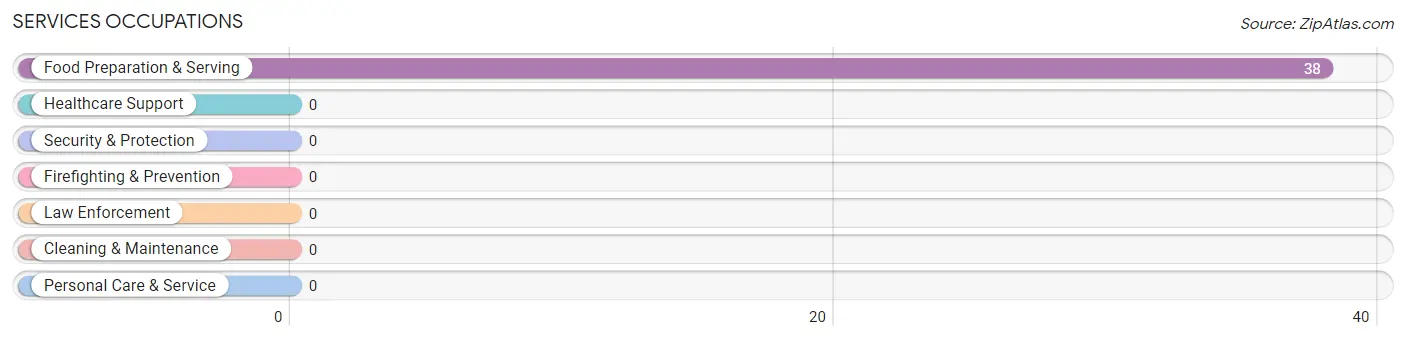
Services Occupations
The most common Services occupations in Riverdale are , and Food Preparation & Serving (38 | 12.6%).
Services Occupations by Sex
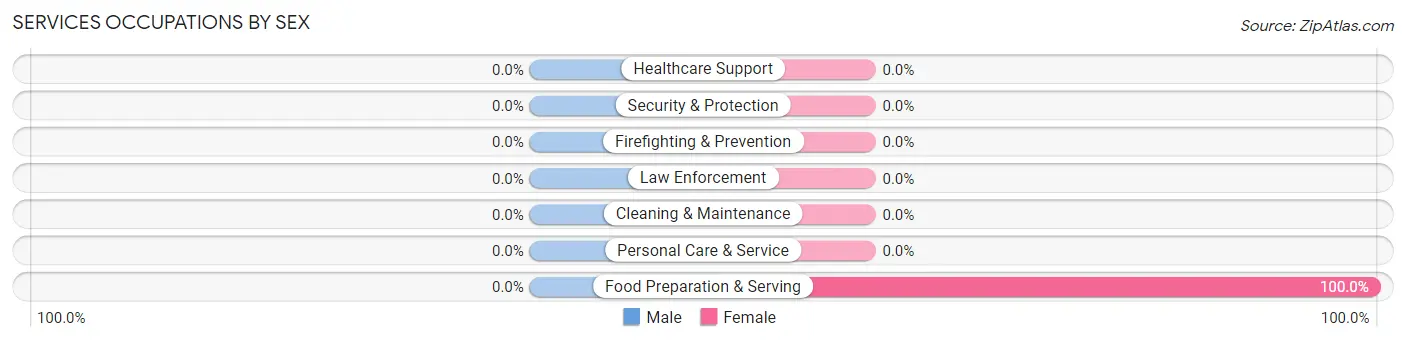
| Occupation | Male | Female |
| Healthcare Support | 0 (0.0%) | 0 (0.0%) |
| Security & Protection | 0 (0.0%) | 0 (0.0%) |
| Firefighting & Prevention | 0 (0.0%) | 0 (0.0%) |
| Law Enforcement | 0 (0.0%) | 0 (0.0%) |
| Food Preparation & Serving | 0 (0.0%) | 38 (100.0%) |
| Cleaning & Maintenance | 0 (0.0%) | 0 (0.0%) |
| Personal Care & Service | 0 (0.0%) | 0 (0.0%) |
| Total (Category) | 0 (0.0%) | 38 (100.0%) |
| Total (Overall) | 120 (39.7%) | 182 (60.3%) |
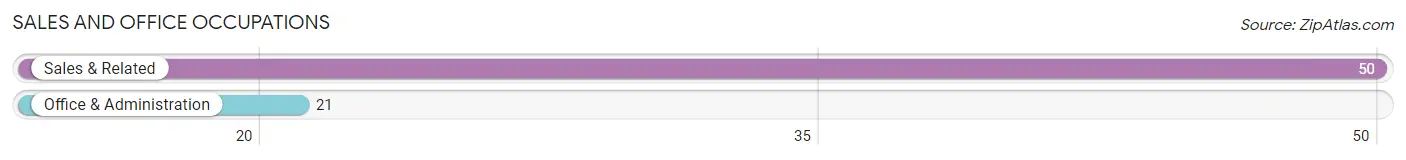
Sales and Office Occupations
The most common Sales and Office occupations in Riverdale are Sales & Related (50 | 16.6%), and Office & Administration (21 | 7.0%).
Sales and Office Occupations by Sex
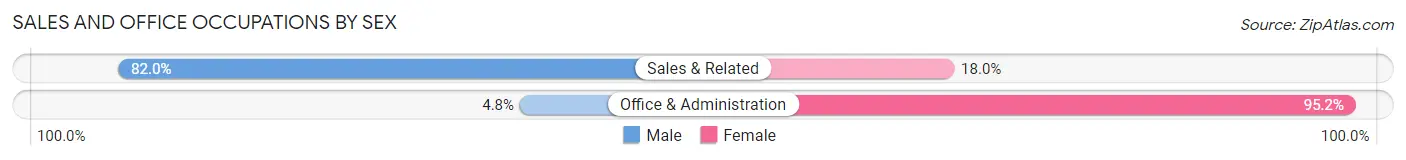
| Occupation | Male | Female |
| Sales & Related | 41 (82.0%) | 9 (18.0%) |
| Office & Administration | 1 (4.8%) | 20 (95.2%) |
| Total (Category) | 42 (59.2%) | 29 (40.8%) |
| Total (Overall) | 120 (39.7%) | 182 (60.3%) |
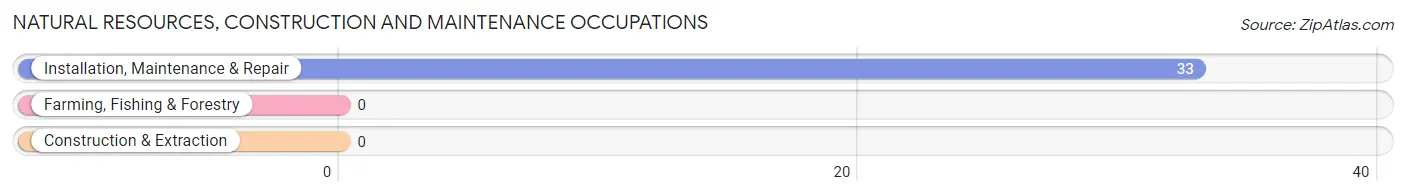
Natural Resources, Construction and Maintenance Occupations
The most common Natural Resources, Construction and Maintenance occupations in Riverdale are , and Installation, Maintenance & Repair (33 | 10.9%).
Natural Resources, Construction and Maintenance Occupations by Sex
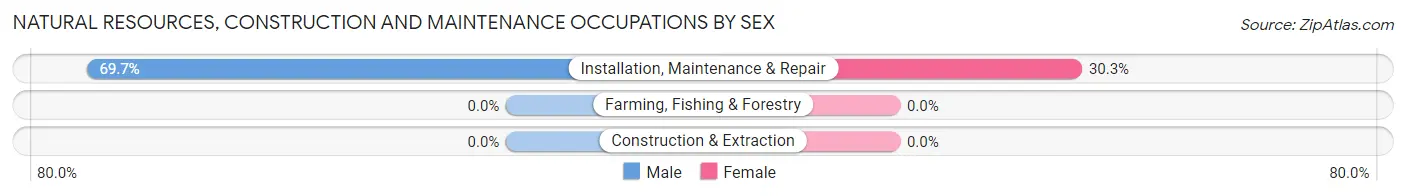
| Occupation | Male | Female |
| Farming, Fishing & Forestry | 0 (0.0%) | 0 (0.0%) |
| Construction & Extraction | 0 (0.0%) | 0 (0.0%) |
| Installation, Maintenance & Repair | 23 (69.7%) | 10 (30.3%) |
| Total (Category) | 23 (69.7%) | 10 (30.3%) |
| Total (Overall) | 120 (39.7%) | 182 (60.3%) |
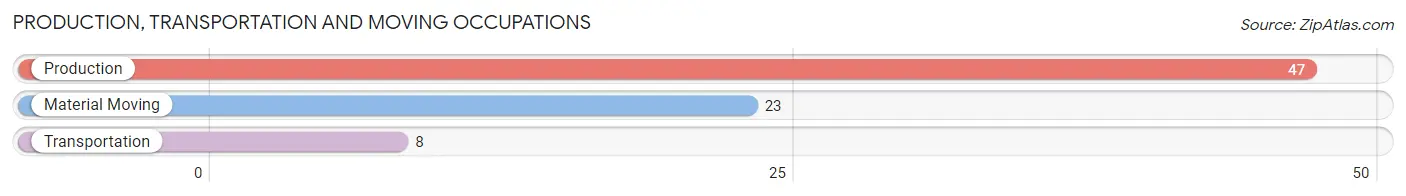
Production, Transportation and Moving Occupations
The most common Production, Transportation and Moving occupations in Riverdale are Production (47 | 15.6%), Material Moving (23 | 7.6%), and Transportation (8 | 2.6%).
Production, Transportation and Moving Occupations by Sex
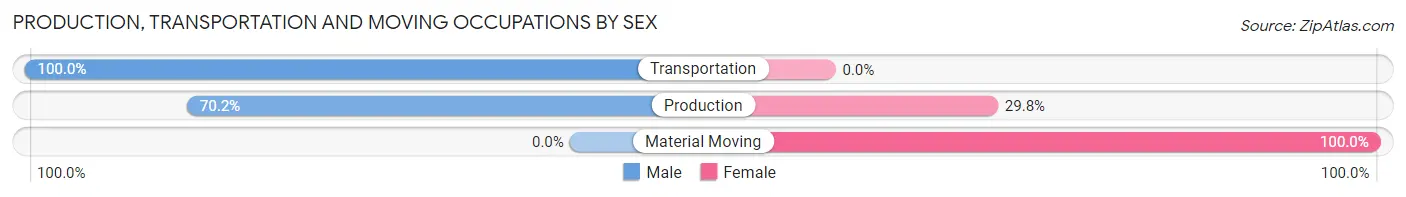
| Occupation | Male | Female |
| Production | 33 (70.2%) | 14 (29.8%) |
| Transportation | 8 (100.0%) | 0 (0.0%) |
| Material Moving | 0 (0.0%) | 23 (100.0%) |
| Total (Category) | 41 (52.6%) | 37 (47.4%) |
| Total (Overall) | 120 (39.7%) | 182 (60.3%) |
Employment Industries by Sex in Riverdale
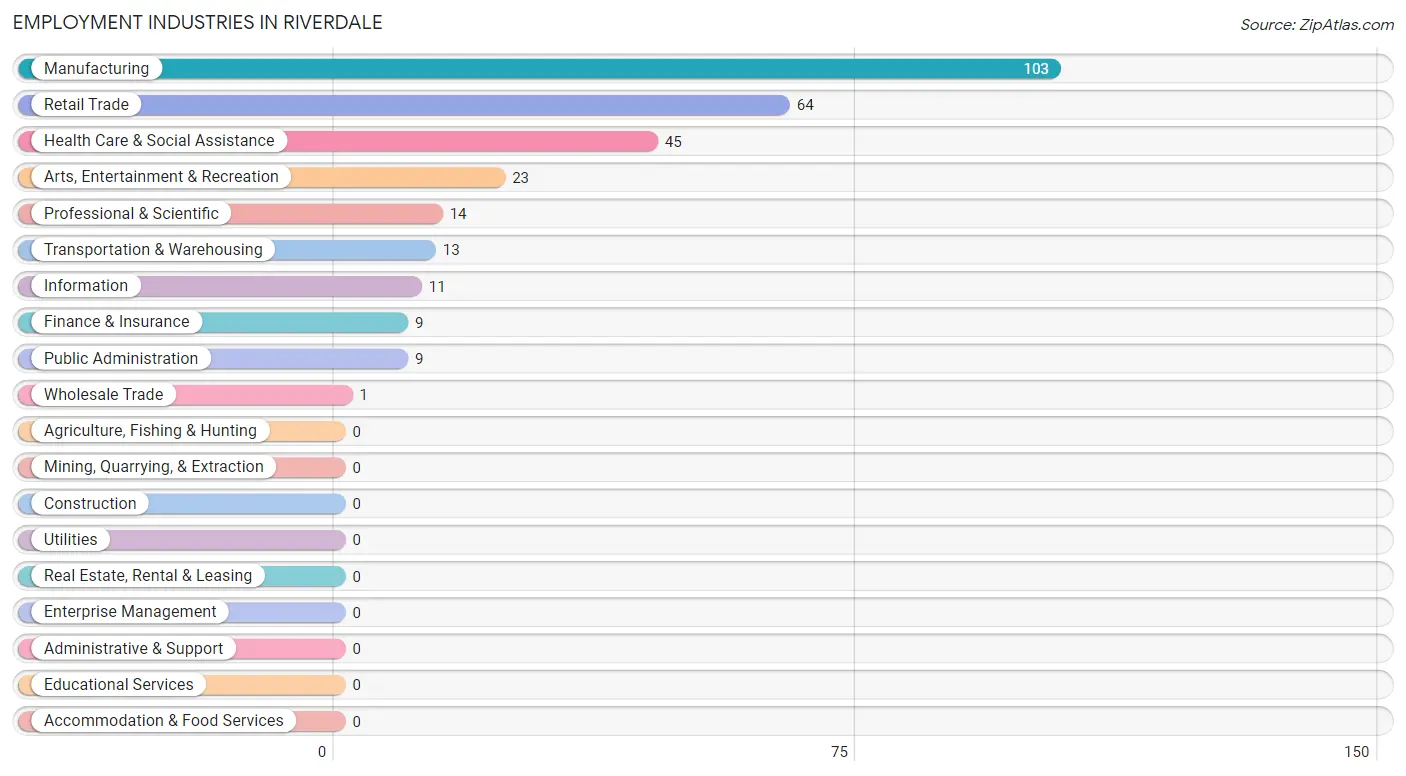
Employment Industries in Riverdale
The major employment industries in Riverdale include Manufacturing (103 | 34.1%), Retail Trade (64 | 21.2%), Health Care & Social Assistance (45 | 14.9%), Arts, Entertainment & Recreation (23 | 7.6%), and Professional & Scientific (14 | 4.6%).
Employment Industries by Sex in Riverdale
The Riverdale industries that see more men than women are Wholesale Trade (100.0%), Professional & Scientific (100.0%), and Retail Trade (76.6%), whereas the industries that tend to have a higher number of women are Transportation & Warehousing (100.0%), Information (100.0%), and Finance & Insurance (100.0%).
| Industry | Male | Female |
| Agriculture, Fishing & Hunting | 0 (0.0%) | 0 (0.0%) |
| Mining, Quarrying, & Extraction | 0 (0.0%) | 0 (0.0%) |
| Construction | 0 (0.0%) | 0 (0.0%) |
| Manufacturing | 46 (44.7%) | 57 (55.3%) |
| Wholesale Trade | 1 (100.0%) | 0 (0.0%) |
| Retail Trade | 49 (76.6%) | 15 (23.4%) |
| Transportation & Warehousing | 0 (0.0%) | 13 (100.0%) |
| Utilities | 0 (0.0%) | 0 (0.0%) |
| Information | 0 (0.0%) | 11 (100.0%) |
| Finance & Insurance | 0 (0.0%) | 9 (100.0%) |
| Real Estate, Rental & Leasing | 0 (0.0%) | 0 (0.0%) |
| Professional & Scientific | 14 (100.0%) | 0 (0.0%) |
| Enterprise Management | 0 (0.0%) | 0 (0.0%) |
| Administrative & Support | 0 (0.0%) | 0 (0.0%) |
| Educational Services | 0 (0.0%) | 0 (0.0%) |
| Health Care & Social Assistance | 0 (0.0%) | 45 (100.0%) |
| Arts, Entertainment & Recreation | 0 (0.0%) | 23 (100.0%) |
| Accommodation & Food Services | 0 (0.0%) | 0 (0.0%) |
| Public Administration | 0 (0.0%) | 9 (100.0%) |
| Total | 120 (39.7%) | 182 (60.3%) |
Education in Riverdale
School Enrollment in Riverdale
The most common levels of schooling among the 288 students in Riverdale are elementary school (133 | 46.2%), middle school (80 | 27.8%), and high school (42 | 14.6%).
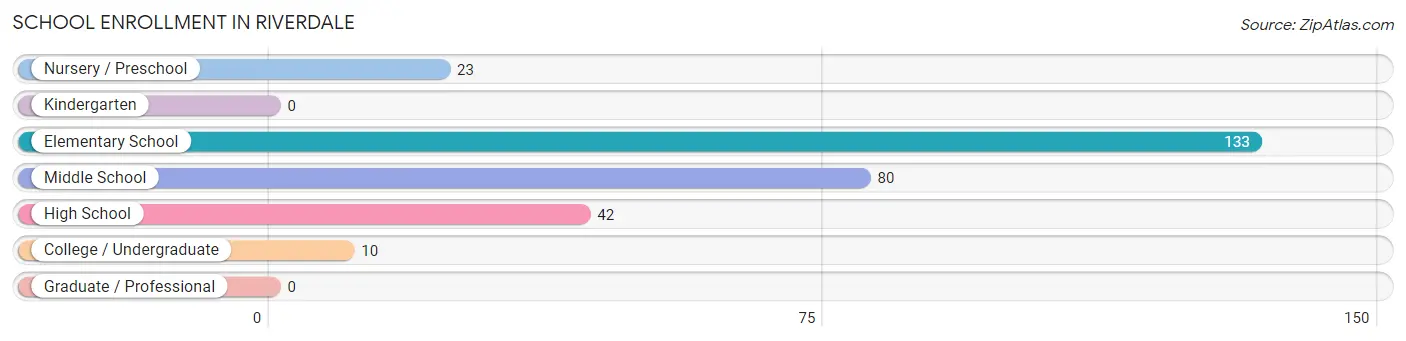
| School Level | # Students | % Students |
| Nursery / Preschool | 23 | 8.0% |
| Kindergarten | 0 | 0.0% |
| Elementary School | 133 | 46.2% |
| Middle School | 80 | 27.8% |
| High School | 42 | 14.6% |
| College / Undergraduate | 10 | 3.5% |
| Graduate / Professional | 0 | 0.0% |
| Total | 288 | 100.0% |
School Enrollment by Age by Funding Source in Riverdale
Out of a total of 288 students who are enrolled in schools in Riverdale, 33 (11.5%) attend a private institution, while the remaining 255 (88.5%) are enrolled in public schools. The age group of 3 to 4 year olds has the highest likelihood of being enrolled in private schools, with 23 (100.0% in the age bracket) enrolled. Conversely, the age group of 5 to 9 year old has the lowest likelihood of being enrolled in a private school, with 133 (100.0% in the age bracket) attending a public institution.
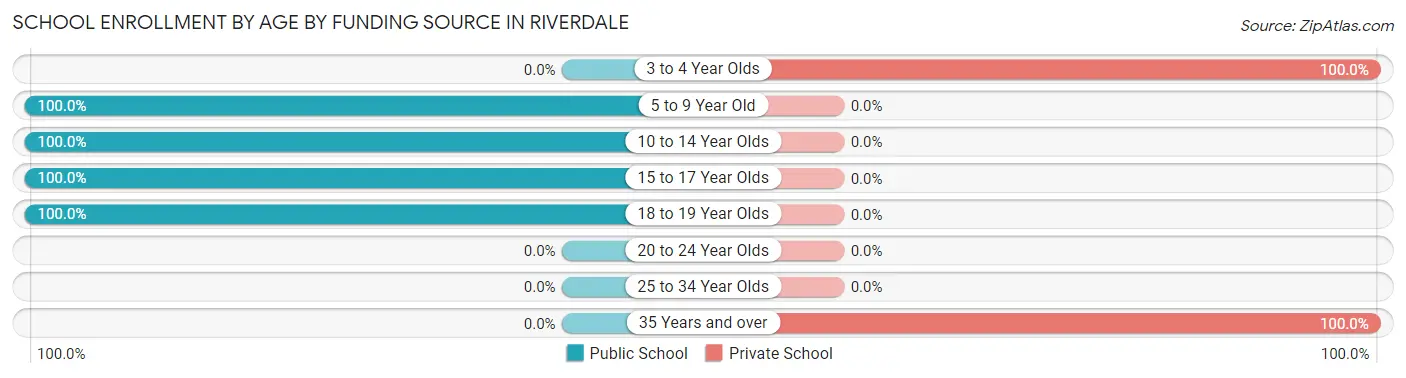
| Age Bracket | Public School | Private School |
| 3 to 4 Year Olds | 0 (0.0%) | 23 (100.0%) |
| 5 to 9 Year Old | 133 (100.0%) | 0 (0.0%) |
| 10 to 14 Year Olds | 80 (100.0%) | 0 (0.0%) |
| 15 to 17 Year Olds | 23 (100.0%) | 0 (0.0%) |
| 18 to 19 Year Olds | 19 (100.0%) | 0 (0.0%) |
| 20 to 24 Year Olds | 0 (0.0%) | 0 (0.0%) |
| 25 to 34 Year Olds | 0 (0.0%) | 0 (0.0%) |
| 35 Years and over | 0 (0.0%) | 10 (100.0%) |
| Total | 255 (88.5%) | 33 (11.5%) |
Educational Attainment by Field of Study in Riverdale
Science & technology (74 | 67.3%), business (18 | 16.4%), and education (18 | 16.4%) are the most common fields of study among 110 individuals in Riverdale who have obtained a bachelor's degree or higher.
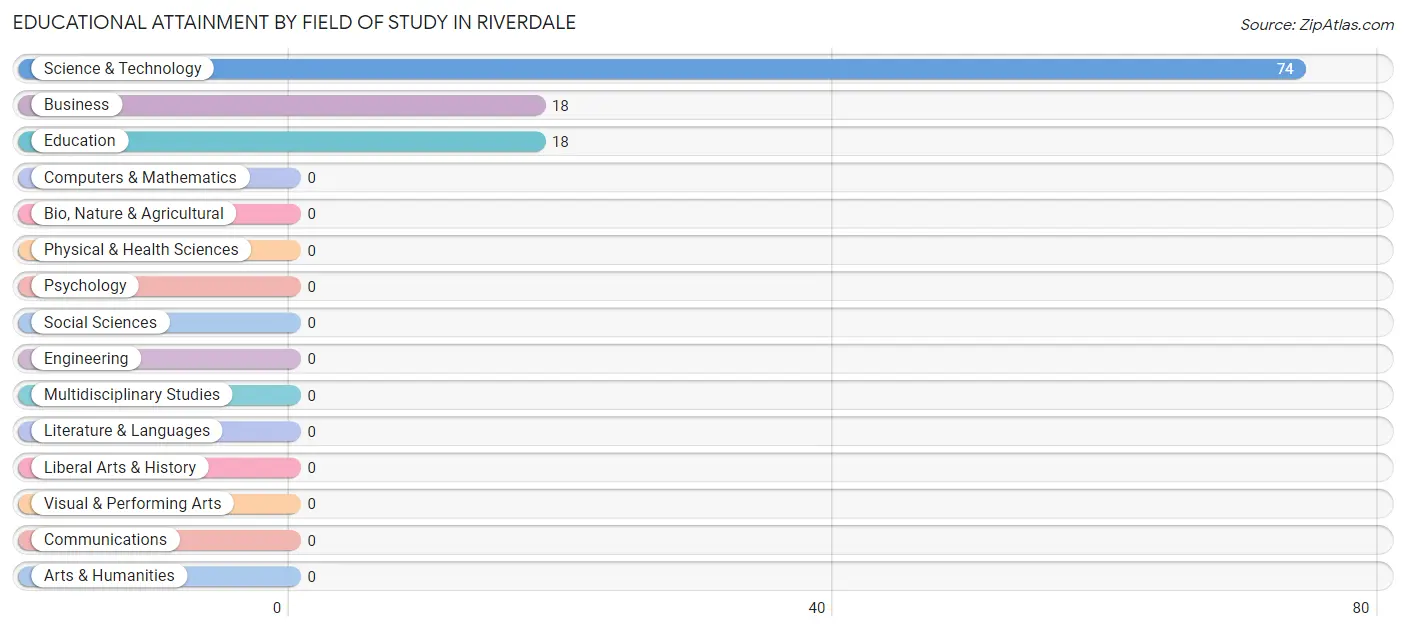
| Field of Study | # Graduates | % Graduates |
| Computers & Mathematics | 0 | 0.0% |
| Bio, Nature & Agricultural | 0 | 0.0% |
| Physical & Health Sciences | 0 | 0.0% |
| Psychology | 0 | 0.0% |
| Social Sciences | 0 | 0.0% |
| Engineering | 0 | 0.0% |
| Multidisciplinary Studies | 0 | 0.0% |
| Science & Technology | 74 | 67.3% |
| Business | 18 | 16.4% |
| Education | 18 | 16.4% |
| Literature & Languages | 0 | 0.0% |
| Liberal Arts & History | 0 | 0.0% |
| Visual & Performing Arts | 0 | 0.0% |
| Communications | 0 | 0.0% |
| Arts & Humanities | 0 | 0.0% |
| Total | 110 | 100.0% |
Transportation & Commute in Riverdale
Vehicle Availability by Sex in Riverdale
The most prevalent vehicle ownership categories in Riverdale are males with 3 vehicles (41, accounting for 34.2%) and females with 3 vehicles (86, making up 23.8%).
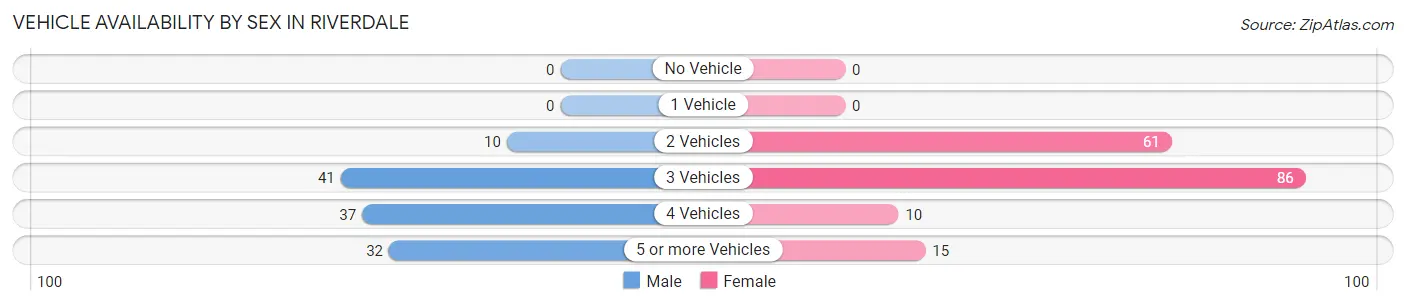
| Vehicles Available | Male | Female |
| No Vehicle | 0 (0.0%) | 0 (0.0%) |
| 1 Vehicle | 0 (0.0%) | 0 (0.0%) |
| 2 Vehicles | 10 (8.3%) | 61 (35.5%) |
| 3 Vehicles | 41 (34.2%) | 86 (50.0%) |
| 4 Vehicles | 37 (30.8%) | 10 (5.8%) |
| 5 or more Vehicles | 32 (26.7%) | 15 (8.7%) |
| Total | 120 (100.0%) | 172 (100.0%) |
Commute Time in Riverdale
The most frequently occuring commute durations in Riverdale are 5 to 9 minutes (90 commuters, 31.7%), 15 to 19 minutes (78 commuters, 27.5%), and 10 to 14 minutes (63 commuters, 22.2%).
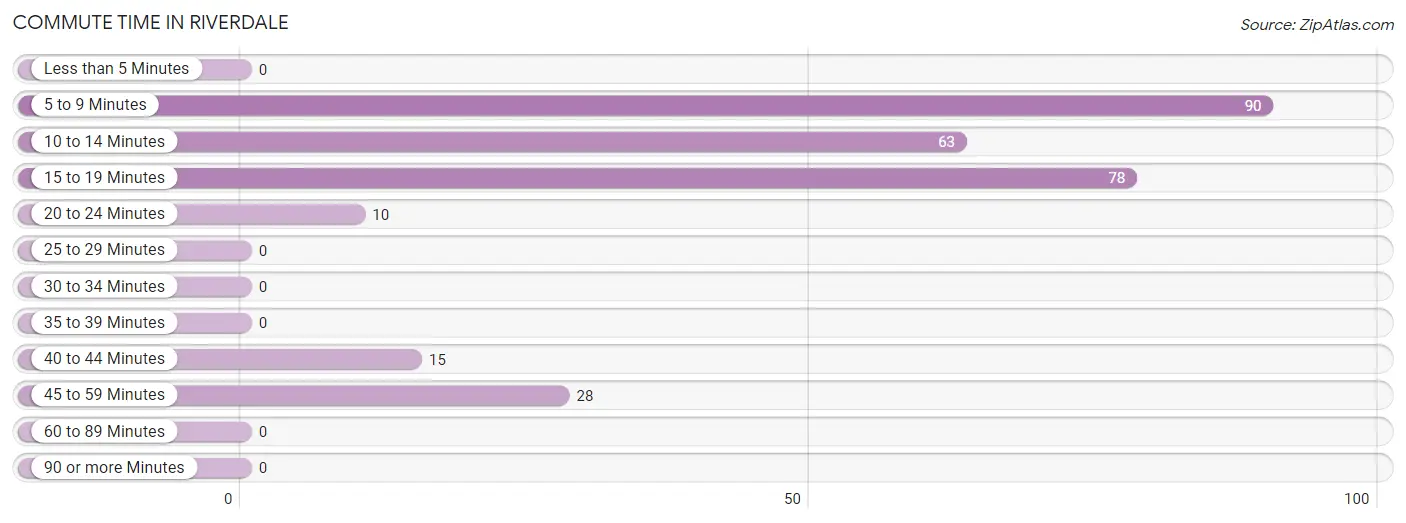
| Commute Time | # Commuters | % Commuters |
| Less than 5 Minutes | 0 | 0.0% |
| 5 to 9 Minutes | 90 | 31.7% |
| 10 to 14 Minutes | 63 | 22.2% |
| 15 to 19 Minutes | 78 | 27.5% |
| 20 to 24 Minutes | 10 | 3.5% |
| 25 to 29 Minutes | 0 | 0.0% |
| 30 to 34 Minutes | 0 | 0.0% |
| 35 to 39 Minutes | 0 | 0.0% |
| 40 to 44 Minutes | 15 | 5.3% |
| 45 to 59 Minutes | 28 | 9.9% |
| 60 to 89 Minutes | 0 | 0.0% |
| 90 or more Minutes | 0 | 0.0% |
Commute Time by Sex in Riverdale
The most common commute times in Riverdale are 15 to 19 minutes (32 commuters, 28.6%) for males and 5 to 9 minutes (68 commuters, 39.5%) for females.
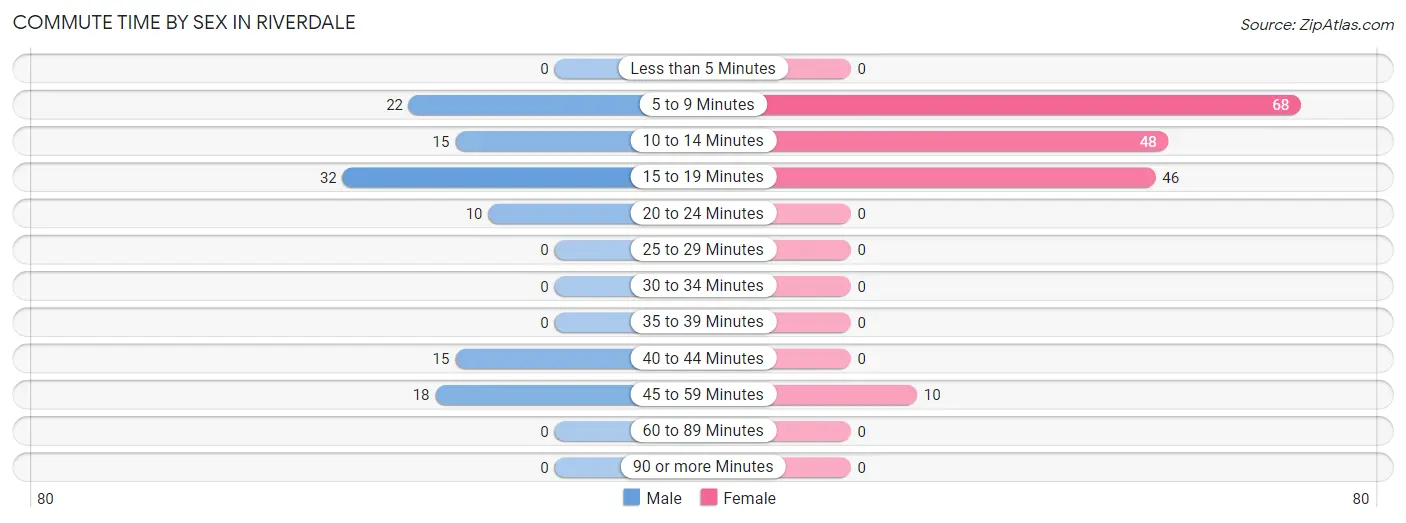
| Commute Time | Male | Female |
| Less than 5 Minutes | 0 (0.0%) | 0 (0.0%) |
| 5 to 9 Minutes | 22 (19.6%) | 68 (39.5%) |
| 10 to 14 Minutes | 15 (13.4%) | 48 (27.9%) |
| 15 to 19 Minutes | 32 (28.6%) | 46 (26.7%) |
| 20 to 24 Minutes | 10 (8.9%) | 0 (0.0%) |
| 25 to 29 Minutes | 0 (0.0%) | 0 (0.0%) |
| 30 to 34 Minutes | 0 (0.0%) | 0 (0.0%) |
| 35 to 39 Minutes | 0 (0.0%) | 0 (0.0%) |
| 40 to 44 Minutes | 15 (13.4%) | 0 (0.0%) |
| 45 to 59 Minutes | 18 (16.1%) | 10 (5.8%) |
| 60 to 89 Minutes | 0 (0.0%) | 0 (0.0%) |
| 90 or more Minutes | 0 (0.0%) | 0 (0.0%) |
Time of Departure to Work by Sex in Riverdale
The most frequent times of departure to work in Riverdale are 6:00 AM to 6:29 AM (42, 37.5%) for males and 7:30 AM to 7:59 AM (42, 24.4%) for females.
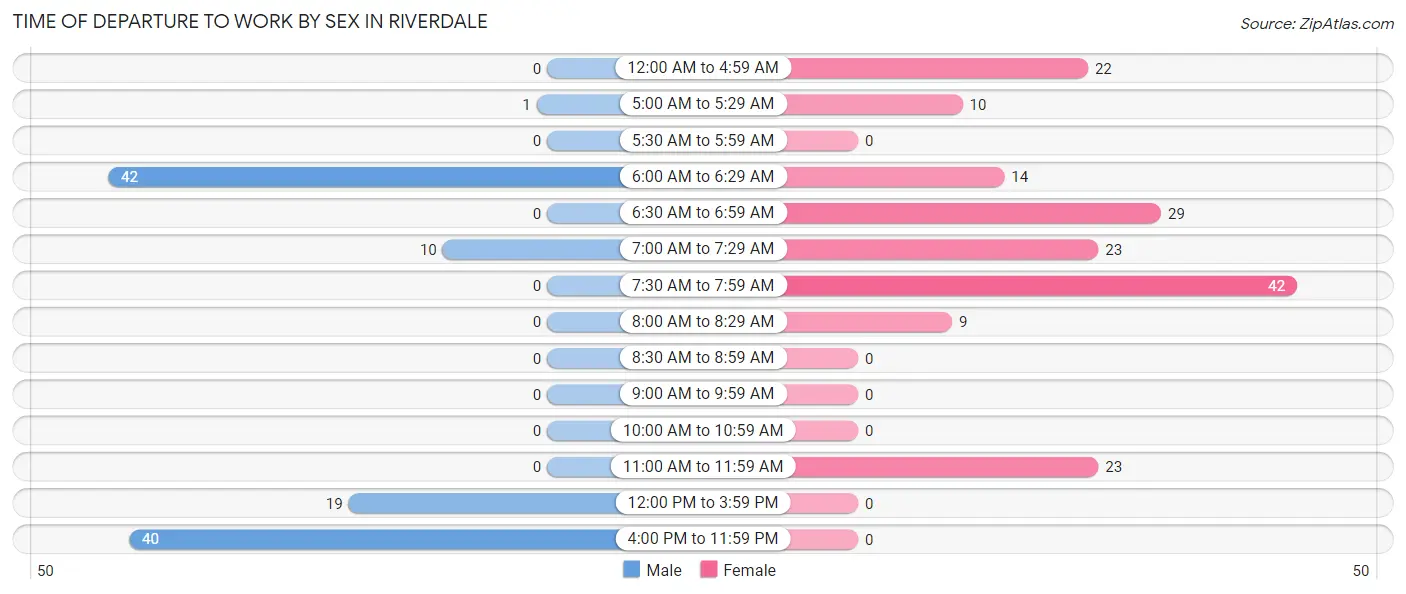
| Time of Departure | Male | Female |
| 12:00 AM to 4:59 AM | 0 (0.0%) | 22 (12.8%) |
| 5:00 AM to 5:29 AM | 1 (0.9%) | 10 (5.8%) |
| 5:30 AM to 5:59 AM | 0 (0.0%) | 0 (0.0%) |
| 6:00 AM to 6:29 AM | 42 (37.5%) | 14 (8.1%) |
| 6:30 AM to 6:59 AM | 0 (0.0%) | 29 (16.9%) |
| 7:00 AM to 7:29 AM | 10 (8.9%) | 23 (13.4%) |
| 7:30 AM to 7:59 AM | 0 (0.0%) | 42 (24.4%) |
| 8:00 AM to 8:29 AM | 0 (0.0%) | 9 (5.2%) |
| 8:30 AM to 8:59 AM | 0 (0.0%) | 0 (0.0%) |
| 9:00 AM to 9:59 AM | 0 (0.0%) | 0 (0.0%) |
| 10:00 AM to 10:59 AM | 0 (0.0%) | 0 (0.0%) |
| 11:00 AM to 11:59 AM | 0 (0.0%) | 23 (13.4%) |
| 12:00 PM to 3:59 PM | 19 (17.0%) | 0 (0.0%) |
| 4:00 PM to 11:59 PM | 40 (35.7%) | 0 (0.0%) |
| Total | 112 (100.0%) | 172 (100.0%) |
Housing Occupancy in Riverdale
Occupancy by Ownership in Riverdale
Of the total 359 dwellings in Riverdale, owner-occupied units account for 313 (87.2%), while renter-occupied units make up 46 (12.8%).
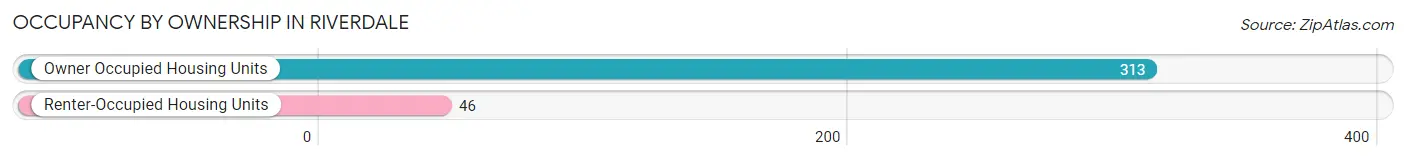
| Occupancy | # Housing Units | % Housing Units |
| Owner Occupied Housing Units | 313 | 87.2% |
| Renter-Occupied Housing Units | 46 | 12.8% |
| Total Occupied Housing Units | 359 | 100.0% |
Occupancy by Household Size in Riverdale
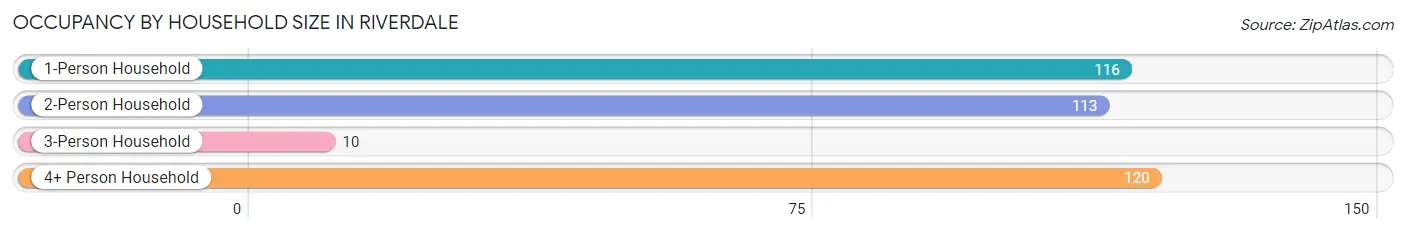
| Household Size | # Housing Units | % Housing Units |
| 1-Person Household | 116 | 32.3% |
| 2-Person Household | 113 | 31.5% |
| 3-Person Household | 10 | 2.8% |
| 4+ Person Household | 120 | 33.4% |
| Total Housing Units | 359 | 100.0% |
Occupancy by Ownership by Household Size in Riverdale
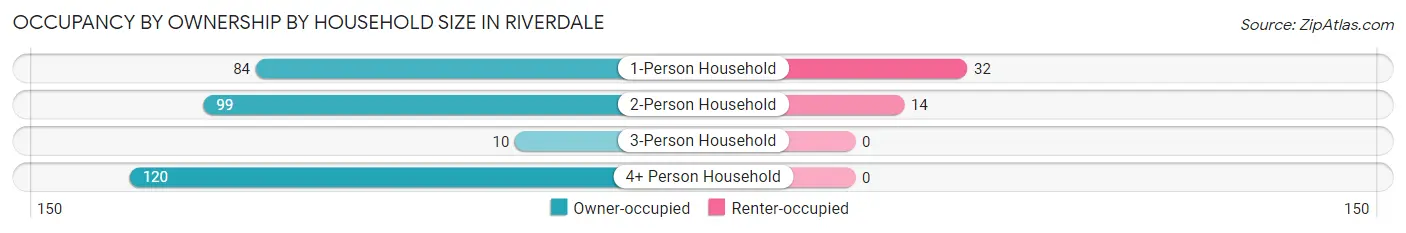
| Household Size | Owner-occupied | Renter-occupied |
| 1-Person Household | 84 (72.4%) | 32 (27.6%) |
| 2-Person Household | 99 (87.6%) | 14 (12.4%) |
| 3-Person Household | 10 (100.0%) | 0 (0.0%) |
| 4+ Person Household | 120 (100.0%) | 0 (0.0%) |
| Total Housing Units | 313 (87.2%) | 46 (12.8%) |
Occupancy by Educational Attainment in Riverdale
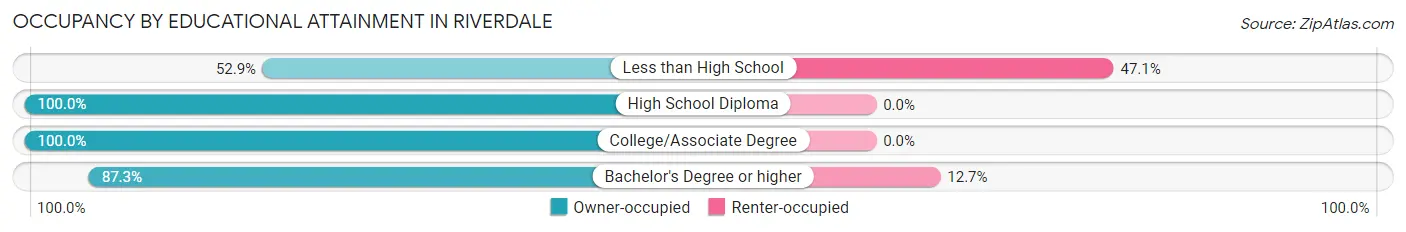
| Household Size | Owner-occupied | Renter-occupied |
| Less than High School | 36 (52.9%) | 32 (47.1%) |
| High School Diploma | 73 (100.0%) | 0 (0.0%) |
| College/Associate Degree | 108 (100.0%) | 0 (0.0%) |
| Bachelor's Degree or higher | 96 (87.3%) | 14 (12.7%) |
Occupancy by Age of Householder in Riverdale
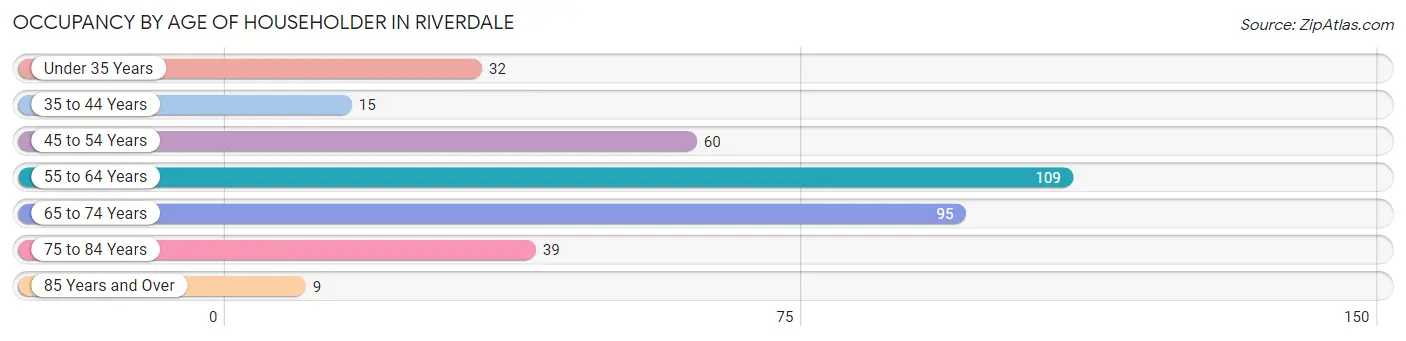
| Age Bracket | # Households | % Households |
| Under 35 Years | 32 | 8.9% |
| 35 to 44 Years | 15 | 4.2% |
| 45 to 54 Years | 60 | 16.7% |
| 55 to 64 Years | 109 | 30.4% |
| 65 to 74 Years | 95 | 26.5% |
| 75 to 84 Years | 39 | 10.9% |
| 85 Years and Over | 9 | 2.5% |
| Total | 359 | 100.0% |
Housing Finances in Riverdale
Median Income by Occupancy in Riverdale
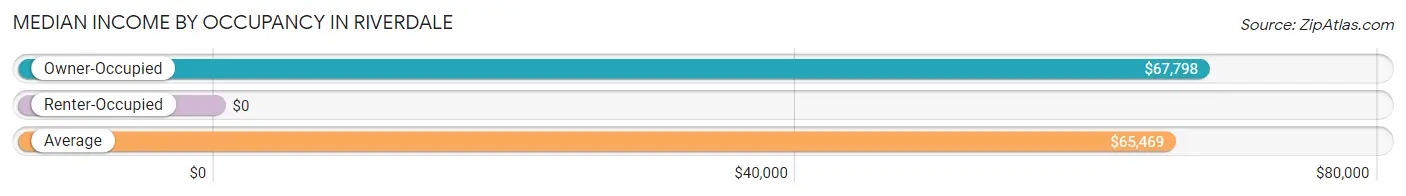
| Occupancy Type | # Households | Median Income |
| Owner-Occupied | 313 (87.2%) | $67,798 |
| Renter-Occupied | 46 (12.8%) | $0 |
| Average | 359 (100.0%) | $65,469 |
Occupancy by Householder Income Bracket in Riverdale
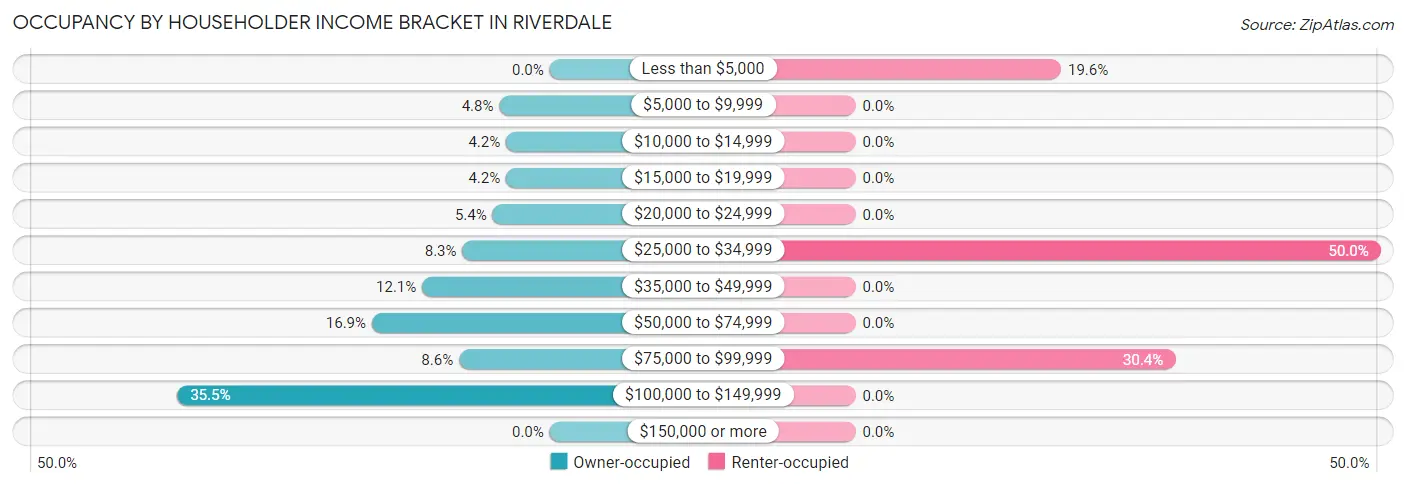
| Income Bracket | Owner-occupied | Renter-occupied |
| Less than $5,000 | 0 (0.0%) | 9 (19.6%) |
| $5,000 to $9,999 | 15 (4.8%) | 0 (0.0%) |
| $10,000 to $14,999 | 13 (4.2%) | 0 (0.0%) |
| $15,000 to $19,999 | 13 (4.2%) | 0 (0.0%) |
| $20,000 to $24,999 | 17 (5.4%) | 0 (0.0%) |
| $25,000 to $34,999 | 26 (8.3%) | 23 (50.0%) |
| $35,000 to $49,999 | 38 (12.1%) | 0 (0.0%) |
| $50,000 to $74,999 | 53 (16.9%) | 0 (0.0%) |
| $75,000 to $99,999 | 27 (8.6%) | 14 (30.4%) |
| $100,000 to $149,999 | 111 (35.5%) | 0 (0.0%) |
| $150,000 or more | 0 (0.0%) | 0 (0.0%) |
| Total | 313 (100.0%) | 46 (100.0%) |
Monthly Housing Cost Tiers in Riverdale
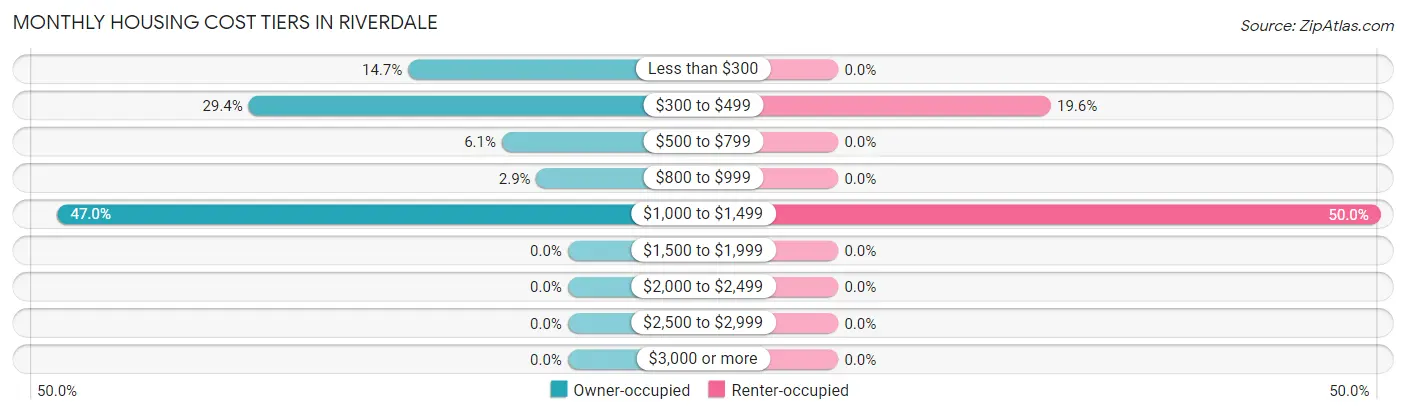
| Monthly Cost | Owner-occupied | Renter-occupied |
| Less than $300 | 46 (14.7%) | 0 (0.0%) |
| $300 to $499 | 92 (29.4%) | 9 (19.6%) |
| $500 to $799 | 19 (6.1%) | 0 (0.0%) |
| $800 to $999 | 9 (2.9%) | 0 (0.0%) |
| $1,000 to $1,499 | 147 (47.0%) | 23 (50.0%) |
| $1,500 to $1,999 | 0 (0.0%) | 0 (0.0%) |
| $2,000 to $2,499 | 0 (0.0%) | 0 (0.0%) |
| $2,500 to $2,999 | 0 (0.0%) | 0 (0.0%) |
| $3,000 or more | 0 (0.0%) | 0 (0.0%) |
| Total | 313 (100.0%) | 46 (100.0%) |
Physical Housing Characteristics in Riverdale
Housing Structures in Riverdale
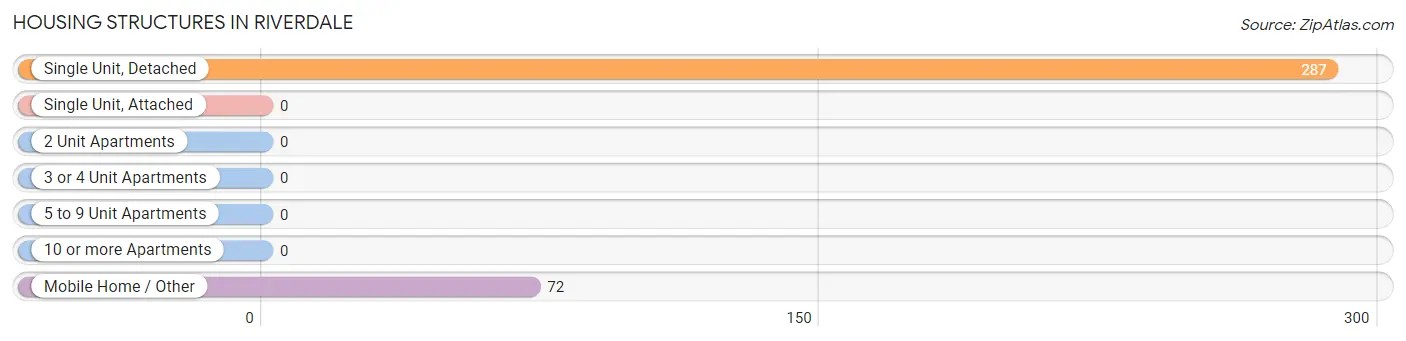
| Structure Type | # Housing Units | % Housing Units |
| Single Unit, Detached | 287 | 79.9% |
| Single Unit, Attached | 0 | 0.0% |
| 2 Unit Apartments | 0 | 0.0% |
| 3 or 4 Unit Apartments | 0 | 0.0% |
| 5 to 9 Unit Apartments | 0 | 0.0% |
| 10 or more Apartments | 0 | 0.0% |
| Mobile Home / Other | 72 | 20.1% |
| Total | 359 | 100.0% |
Housing Structures by Occupancy in Riverdale
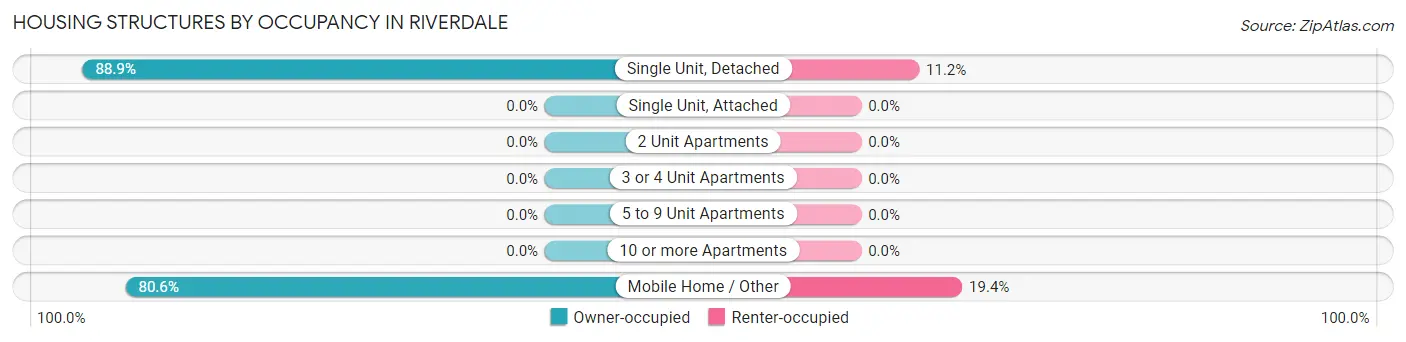
| Structure Type | Owner-occupied | Renter-occupied |
| Single Unit, Detached | 255 (88.8%) | 32 (11.2%) |
| Single Unit, Attached | 0 (0.0%) | 0 (0.0%) |
| 2 Unit Apartments | 0 (0.0%) | 0 (0.0%) |
| 3 or 4 Unit Apartments | 0 (0.0%) | 0 (0.0%) |
| 5 to 9 Unit Apartments | 0 (0.0%) | 0 (0.0%) |
| 10 or more Apartments | 0 (0.0%) | 0 (0.0%) |
| Mobile Home / Other | 58 (80.6%) | 14 (19.4%) |
| Total | 313 (87.2%) | 46 (12.8%) |
Housing Structures by Number of Rooms in Riverdale
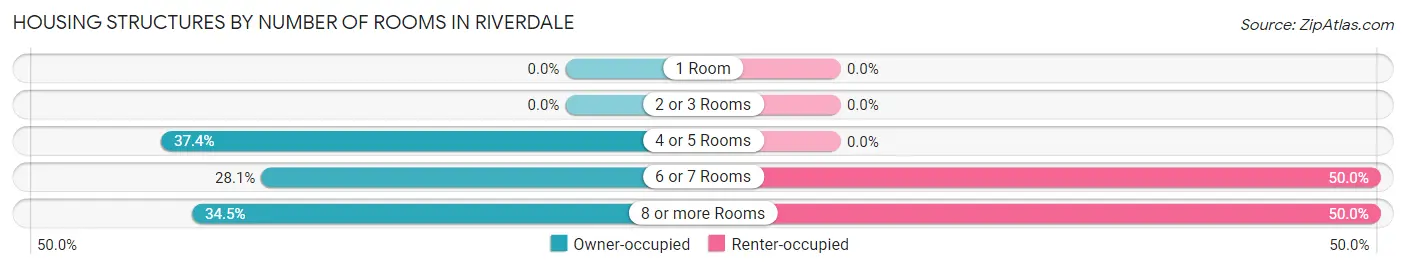
| Number of Rooms | Owner-occupied | Renter-occupied |
| 1 Room | 0 (0.0%) | 0 (0.0%) |
| 2 or 3 Rooms | 0 (0.0%) | 0 (0.0%) |
| 4 or 5 Rooms | 117 (37.4%) | 0 (0.0%) |
| 6 or 7 Rooms | 88 (28.1%) | 23 (50.0%) |
| 8 or more Rooms | 108 (34.5%) | 23 (50.0%) |
| Total | 313 (100.0%) | 46 (100.0%) |
Housing Structure by Heating Type in Riverdale
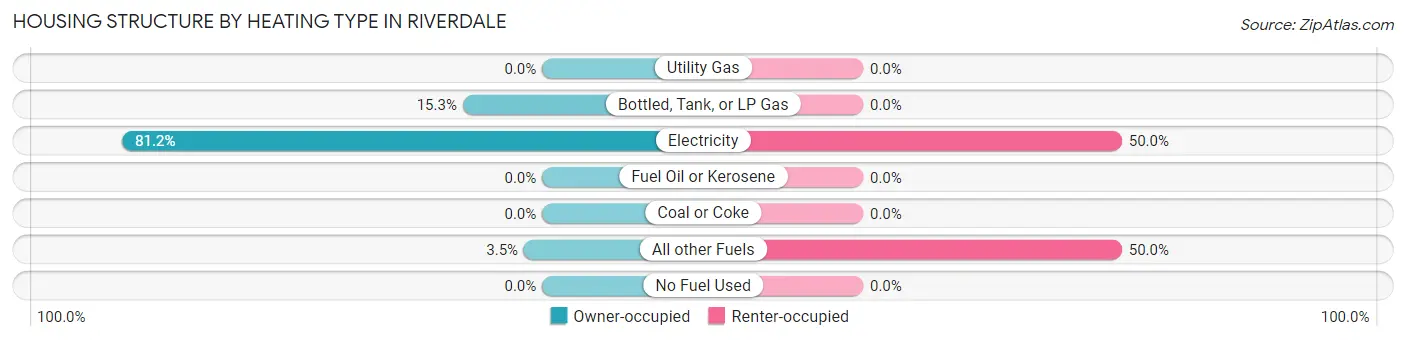
| Heating Type | Owner-occupied | Renter-occupied |
| Utility Gas | 0 (0.0%) | 0 (0.0%) |
| Bottled, Tank, or LP Gas | 48 (15.3%) | 0 (0.0%) |
| Electricity | 254 (81.1%) | 23 (50.0%) |
| Fuel Oil or Kerosene | 0 (0.0%) | 0 (0.0%) |
| Coal or Coke | 0 (0.0%) | 0 (0.0%) |
| All other Fuels | 11 (3.5%) | 23 (50.0%) |
| No Fuel Used | 0 (0.0%) | 0 (0.0%) |
| Total | 313 (100.0%) | 46 (100.0%) |
Household Vehicle Usage in Riverdale
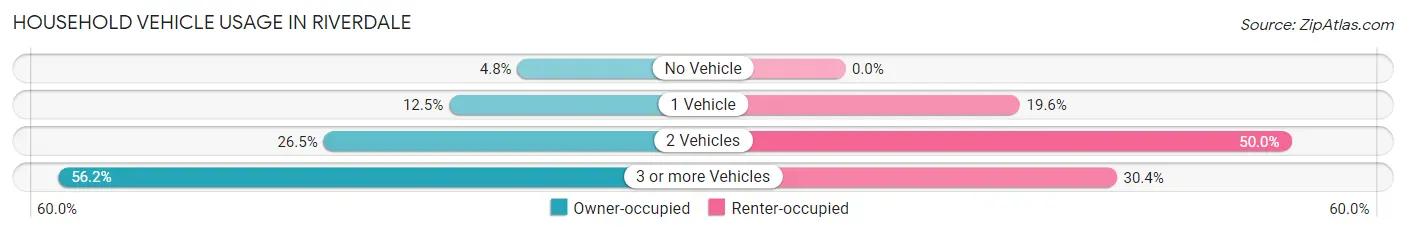
| Vehicles per Household | Owner-occupied | Renter-occupied |
| No Vehicle | 15 (4.8%) | 0 (0.0%) |
| 1 Vehicle | 39 (12.5%) | 9 (19.6%) |
| 2 Vehicles | 83 (26.5%) | 23 (50.0%) |
| 3 or more Vehicles | 176 (56.2%) | 14 (30.4%) |
| Total | 313 (100.0%) | 46 (100.0%) |
Real Estate & Mortgages in Riverdale
Real Estate and Mortgage Overview in Riverdale
| Characteristic | Without Mortgage | With Mortgage |
| Housing Units | 136 | 177 |
| Median Property Value | $117,000 | $184,200 |
| Median Household Income | $48,068 | $0 |
| Monthly Housing Costs | $323 | $0 |
| Real Estate Taxes | $525 | $0 |
Property Value by Mortgage Status in Riverdale
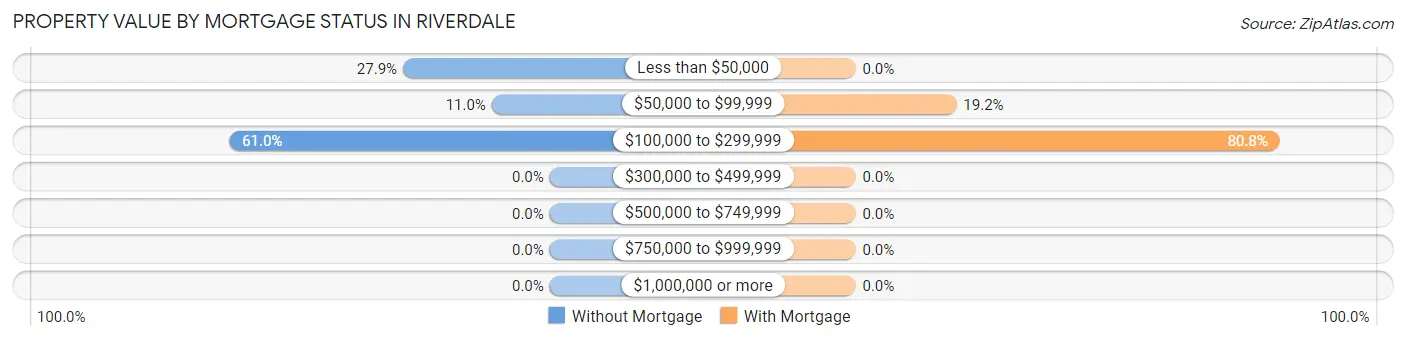
| Property Value | Without Mortgage | With Mortgage |
| Less than $50,000 | 38 (27.9%) | 0 (0.0%) |
| $50,000 to $99,999 | 15 (11.0%) | 34 (19.2%) |
| $100,000 to $299,999 | 83 (61.0%) | 143 (80.8%) |
| $300,000 to $499,999 | 0 (0.0%) | 0 (0.0%) |
| $500,000 to $749,999 | 0 (0.0%) | 0 (0.0%) |
| $750,000 to $999,999 | 0 (0.0%) | 0 (0.0%) |
| $1,000,000 or more | 0 (0.0%) | 0 (0.0%) |
| Total | 136 (100.0%) | 177 (100.0%) |
Household Income by Mortgage Status in Riverdale
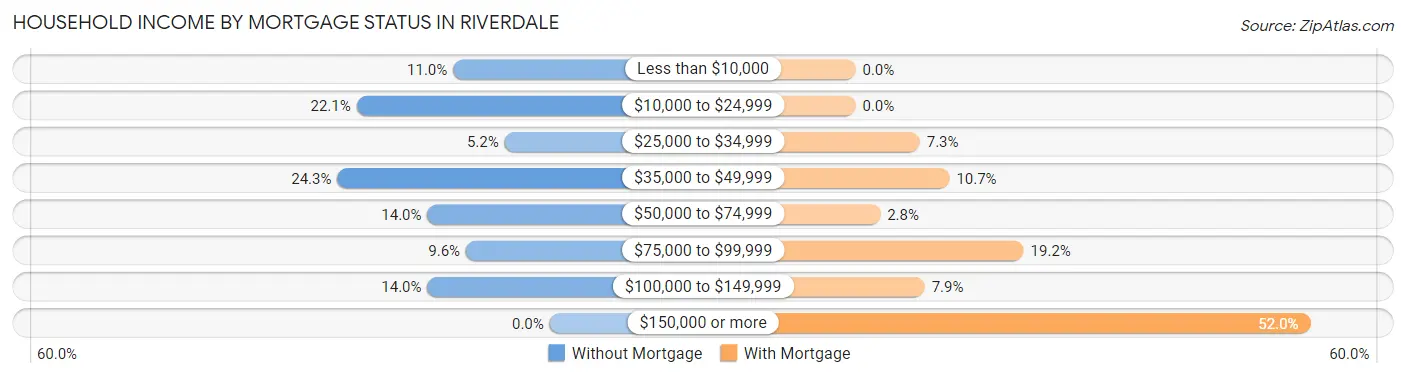
| Household Income | Without Mortgage | With Mortgage |
| Less than $10,000 | 15 (11.0%) | 0 (0.0%) |
| $10,000 to $24,999 | 30 (22.1%) | 0 (0.0%) |
| $25,000 to $34,999 | 7 (5.1%) | 13 (7.3%) |
| $35,000 to $49,999 | 33 (24.3%) | 19 (10.7%) |
| $50,000 to $74,999 | 19 (14.0%) | 5 (2.8%) |
| $75,000 to $99,999 | 13 (9.6%) | 34 (19.2%) |
| $100,000 to $149,999 | 19 (14.0%) | 14 (7.9%) |
| $150,000 or more | 0 (0.0%) | 92 (52.0%) |
| Total | 136 (100.0%) | 177 (100.0%) |
Property Value to Household Income Ratio in Riverdale
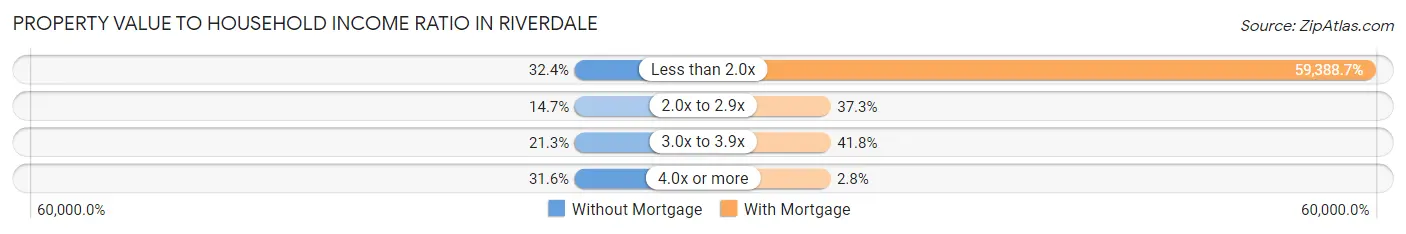
| Value-to-Income Ratio | Without Mortgage | With Mortgage |
| Less than 2.0x | 44 (32.4%) | 105,118 (59,388.7%) |
| 2.0x to 2.9x | 20 (14.7%) | 66 (37.3%) |
| 3.0x to 3.9x | 29 (21.3%) | 74 (41.8%) |
| 4.0x or more | 43 (31.6%) | 5 (2.8%) |
| Total | 136 (100.0%) | 177 (100.0%) |
Real Estate Taxes by Mortgage Status in Riverdale
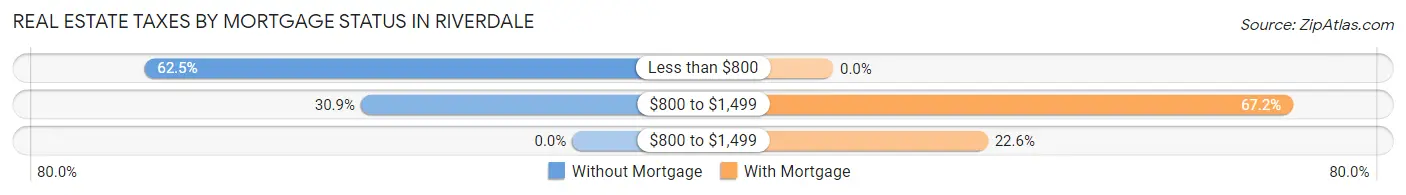
| Property Taxes | Without Mortgage | With Mortgage |
| Less than $800 | 85 (62.5%) | 0 (0.0%) |
| $800 to $1,499 | 42 (30.9%) | 119 (67.2%) |
| $800 to $1,499 | 0 (0.0%) | 40 (22.6%) |
| Total | 136 (100.0%) | 177 (100.0%) |
Health & Disability in Riverdale
Health Insurance Coverage by Age in Riverdale
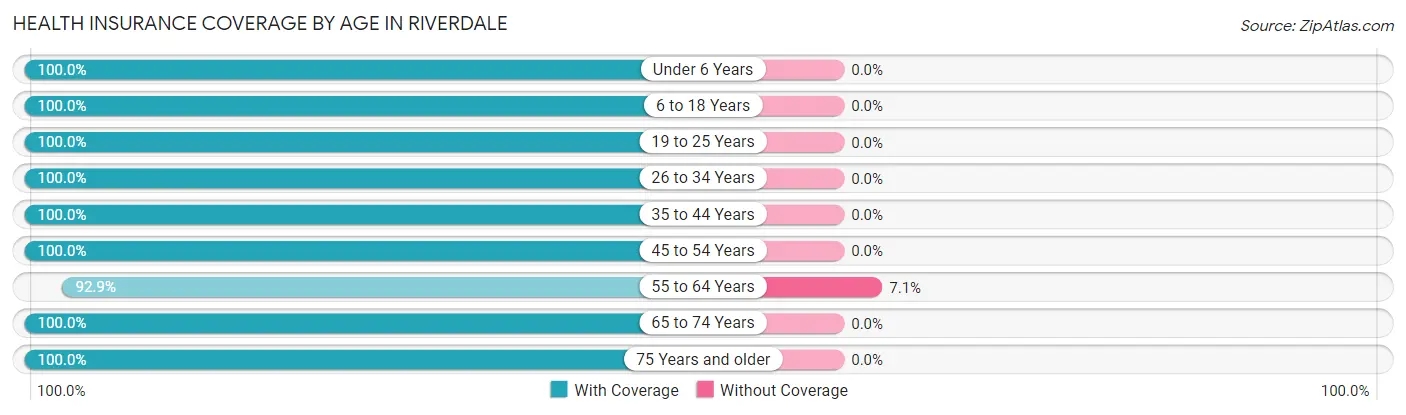
| Age Bracket | With Coverage | Without Coverage |
| Under 6 Years | 46 (100.0%) | 0 (0.0%) |
| 6 to 18 Years | 277 (100.0%) | 0 (0.0%) |
| 19 to 25 Years | 185 (100.0%) | 0 (0.0%) |
| 26 to 34 Years | 63 (100.0%) | 0 (0.0%) |
| 35 to 44 Years | 29 (100.0%) | 0 (0.0%) |
| 45 to 54 Years | 87 (100.0%) | 0 (0.0%) |
| 55 to 64 Years | 118 (92.9%) | 9 (7.1%) |
| 65 to 74 Years | 184 (100.0%) | 0 (0.0%) |
| 75 Years and older | 48 (100.0%) | 0 (0.0%) |
| Total | 1,037 (99.1%) | 9 (0.9%) |
Health Insurance Coverage by Citizenship Status in Riverdale
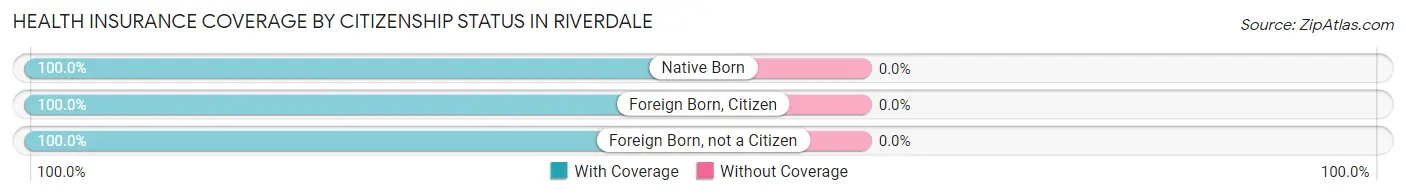
| Citizenship Status | With Coverage | Without Coverage |
| Native Born | 46 (100.0%) | 0 (0.0%) |
| Foreign Born, Citizen | 277 (100.0%) | 0 (0.0%) |
| Foreign Born, not a Citizen | 185 (100.0%) | 0 (0.0%) |
Health Insurance Coverage by Household Income in Riverdale
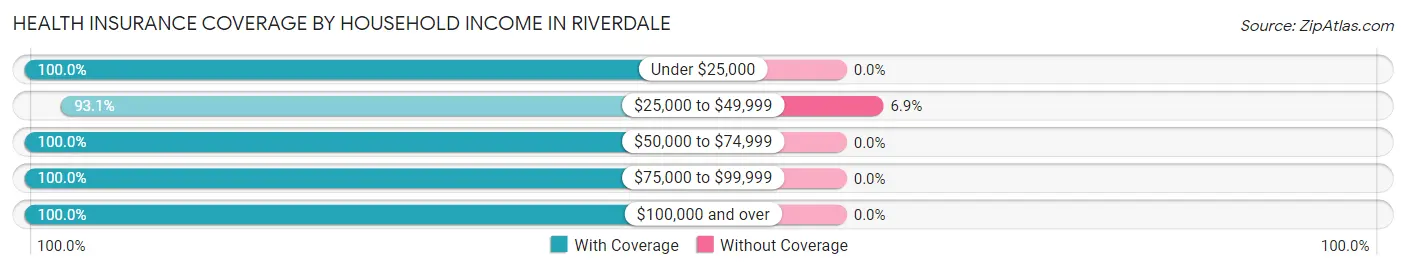
| Household Income | With Coverage | Without Coverage |
| Under $25,000 | 113 (100.0%) | 0 (0.0%) |
| $25,000 to $49,999 | 122 (93.1%) | 9 (6.9%) |
| $50,000 to $74,999 | 136 (100.0%) | 0 (0.0%) |
| $75,000 to $99,999 | 73 (100.0%) | 0 (0.0%) |
| $100,000 and over | 593 (100.0%) | 0 (0.0%) |
Public vs Private Health Insurance Coverage by Age in Riverdale
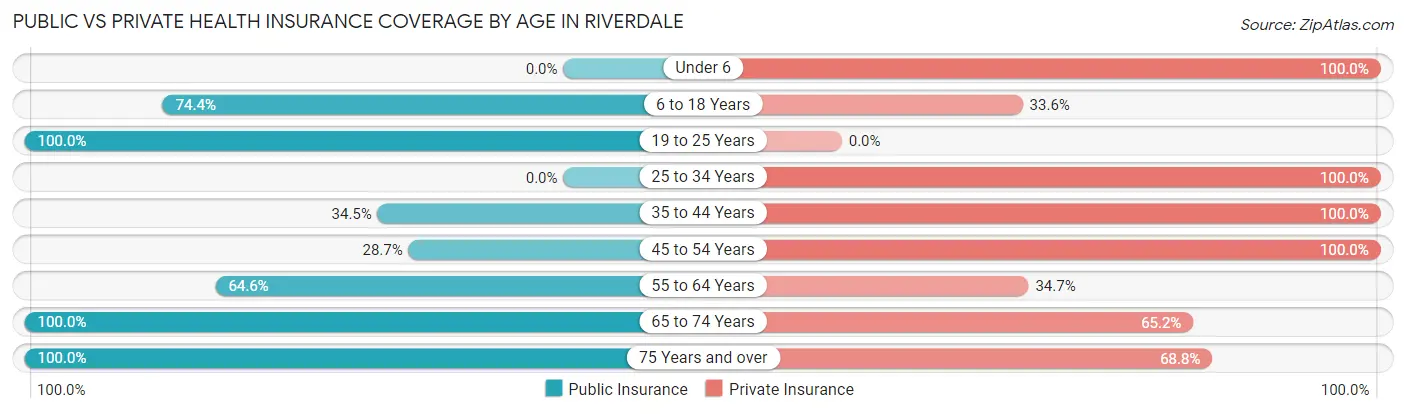
| Age Bracket | Public Insurance | Private Insurance |
| Under 6 | 0 (0.0%) | 46 (100.0%) |
| 6 to 18 Years | 206 (74.4%) | 93 (33.6%) |
| 19 to 25 Years | 185 (100.0%) | 0 (0.0%) |
| 25 to 34 Years | 0 (0.0%) | 63 (100.0%) |
| 35 to 44 Years | 10 (34.5%) | 29 (100.0%) |
| 45 to 54 Years | 25 (28.7%) | 87 (100.0%) |
| 55 to 64 Years | 82 (64.6%) | 44 (34.6%) |
| 65 to 74 Years | 184 (100.0%) | 120 (65.2%) |
| 75 Years and over | 48 (100.0%) | 33 (68.8%) |
| Total | 740 (70.8%) | 515 (49.2%) |
Disability Status by Sex by Age in Riverdale
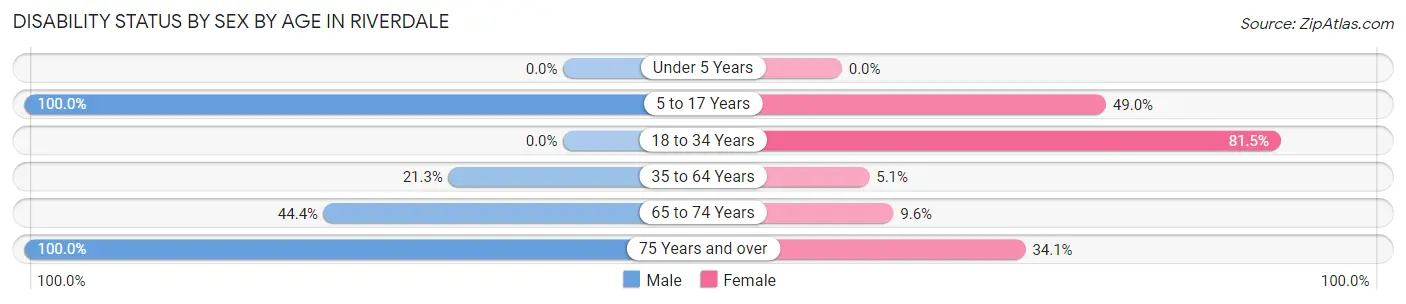
| Age Bracket | Male | Female |
| Under 5 Years | 0 (0.0%) | 0 (0.0%) |
| 5 to 17 Years | 134 (100.0%) | 50 (49.0%) |
| 18 to 34 Years | 0 (0.0%) | 176 (81.5%) |
| 35 to 64 Years | 10 (21.3%) | 10 (5.1%) |
| 65 to 74 Years | 40 (44.4%) | 9 (9.6%) |
| 75 Years and over | 4 (100.0%) | 15 (34.1%) |
Disability Class by Sex by Age in Riverdale
Disability Class: Hearing Difficulty
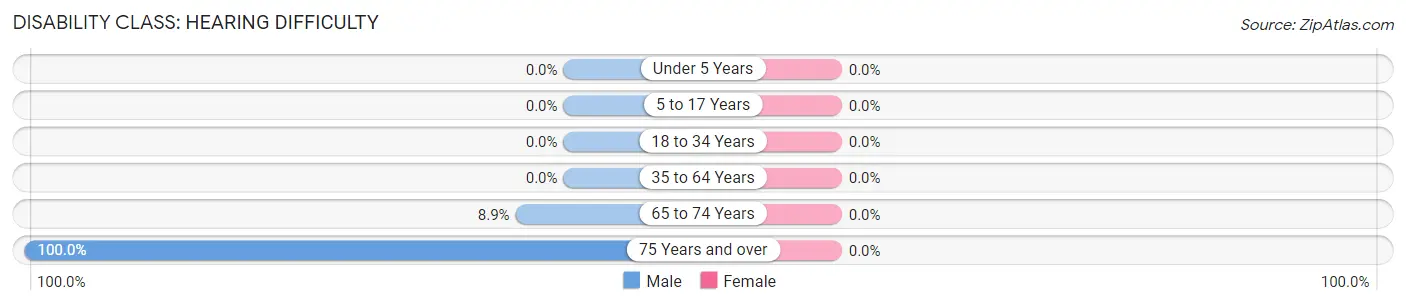
| Age Bracket | Male | Female |
| Under 5 Years | 0 (0.0%) | 0 (0.0%) |
| 5 to 17 Years | 0 (0.0%) | 0 (0.0%) |
| 18 to 34 Years | 0 (0.0%) | 0 (0.0%) |
| 35 to 64 Years | 0 (0.0%) | 0 (0.0%) |
| 65 to 74 Years | 8 (8.9%) | 0 (0.0%) |
| 75 Years and over | 4 (100.0%) | 0 (0.0%) |
Disability Class: Vision Difficulty
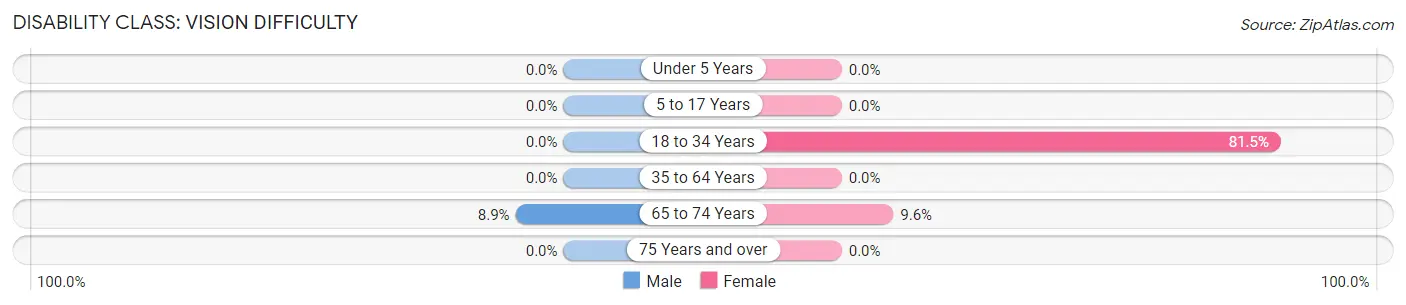
| Age Bracket | Male | Female |
| Under 5 Years | 0 (0.0%) | 0 (0.0%) |
| 5 to 17 Years | 0 (0.0%) | 0 (0.0%) |
| 18 to 34 Years | 0 (0.0%) | 176 (81.5%) |
| 35 to 64 Years | 0 (0.0%) | 0 (0.0%) |
| 65 to 74 Years | 8 (8.9%) | 9 (9.6%) |
| 75 Years and over | 0 (0.0%) | 0 (0.0%) |
Disability Class: Cognitive Difficulty
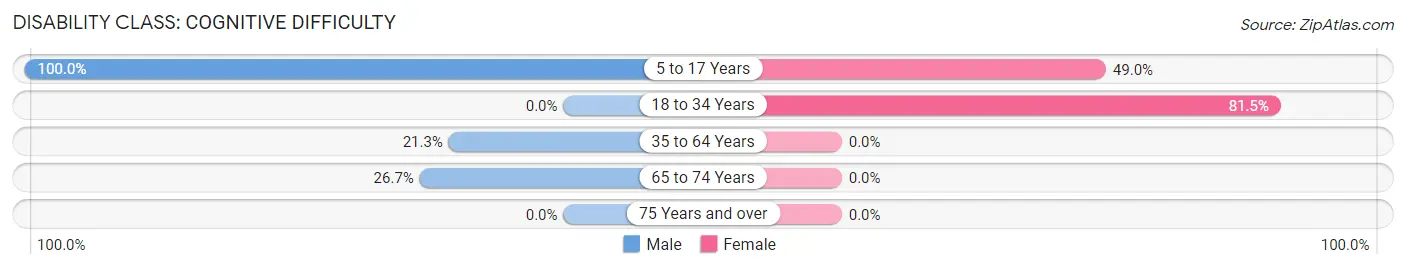
| Age Bracket | Male | Female |
| 5 to 17 Years | 134 (100.0%) | 50 (49.0%) |
| 18 to 34 Years | 0 (0.0%) | 176 (81.5%) |
| 35 to 64 Years | 10 (21.3%) | 0 (0.0%) |
| 65 to 74 Years | 24 (26.7%) | 0 (0.0%) |
| 75 Years and over | 0 (0.0%) | 0 (0.0%) |
Disability Class: Ambulatory Difficulty
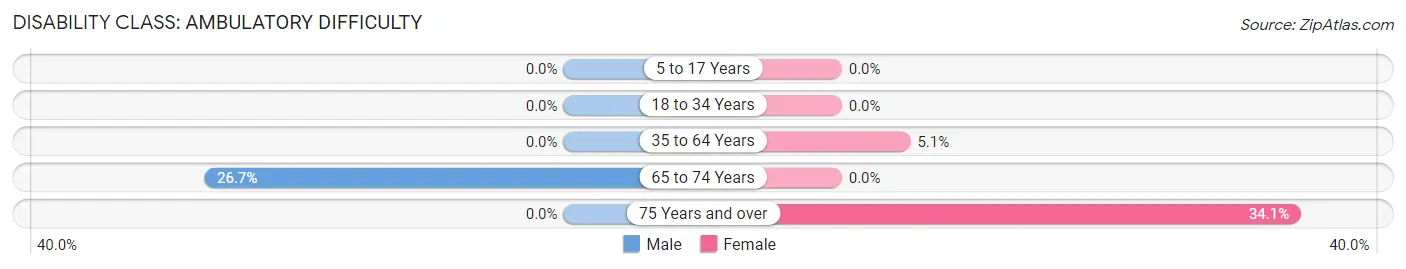
| Age Bracket | Male | Female |
| 5 to 17 Years | 0 (0.0%) | 0 (0.0%) |
| 18 to 34 Years | 0 (0.0%) | 0 (0.0%) |
| 35 to 64 Years | 0 (0.0%) | 10 (5.1%) |
| 65 to 74 Years | 24 (26.7%) | 0 (0.0%) |
| 75 Years and over | 0 (0.0%) | 15 (34.1%) |
Disability Class: Self-Care Difficulty
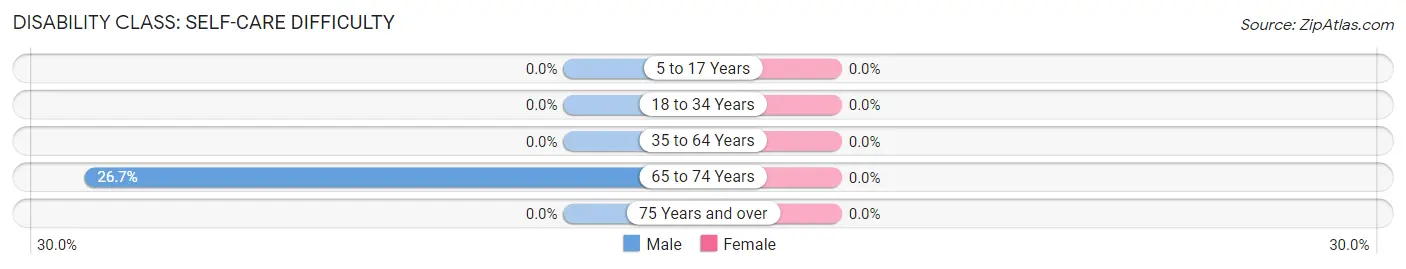
| Age Bracket | Male | Female |
| 5 to 17 Years | 0 (0.0%) | 0 (0.0%) |
| 18 to 34 Years | 0 (0.0%) | 0 (0.0%) |
| 35 to 64 Years | 0 (0.0%) | 0 (0.0%) |
| 65 to 74 Years | 24 (26.7%) | 0 (0.0%) |
| 75 Years and over | 0 (0.0%) | 0 (0.0%) |
Technology Access in Riverdale
Computing Device Access in Riverdale
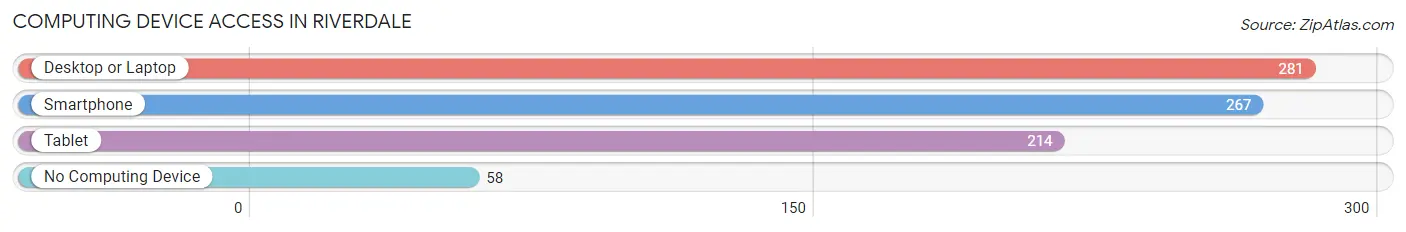
| Device Type | # Households | % Households |
| Desktop or Laptop | 281 | 78.3% |
| Smartphone | 267 | 74.4% |
| Tablet | 214 | 59.6% |
| No Computing Device | 58 | 16.2% |
| Total | 359 | 100.0% |
Internet Access in Riverdale
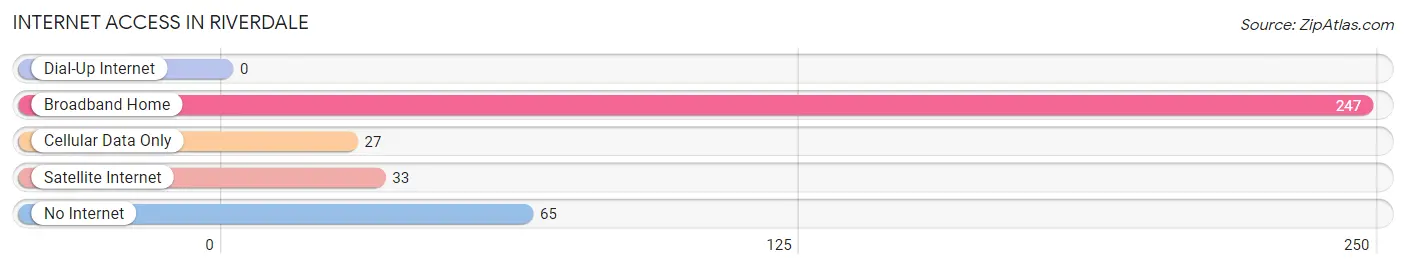
| Internet Type | # Households | % Households |
| Dial-Up Internet | 0 | 0.0% |
| Broadband Home | 247 | 68.8% |
| Cellular Data Only | 27 | 7.5% |
| Satellite Internet | 33 | 9.2% |
| No Internet | 65 | 18.1% |
| Total | 359 | 100.0% |
Riverdale Summary
Riverdale is a small unincorporated community located in Prince George’s County, Maryland, United States. It is situated along the Potomac River, just south of Washington, D.C. The community is part of the Washington metropolitan area and is located approximately 10 miles south of the nation’s capital.
History
The area that is now Riverdale was first settled in the late 1700s by a group of German immigrants. The area was originally known as “German Town” and was home to a number of small farms. In the early 1800s, the area was renamed “Riverdale” after the nearby Potomac River.
In the late 1800s, the area began to experience rapid growth as the Washington, D.C. metropolitan area expanded. The area was annexed by the City of Washington in 1871 and was later incorporated into Prince George’s County in 1895.
In the early 1900s, Riverdale began to develop into a residential community. The area was served by a number of streetcar lines and was home to a number of small businesses. In the 1950s, the area experienced a period of rapid growth as the Washington metropolitan area continued to expand.
Geography
Riverdale is located in Prince George’s County, Maryland, approximately 10 miles south of Washington, D.C. The community is situated along the Potomac River and is bordered by the towns of Bladensburg, Colmar Manor, and Hyattsville.
The area is characterized by rolling hills and is home to a number of parks and recreational areas. The area is also home to a number of historic sites, including the Riverdale Manor House and the Riverdale Park Historic District.
Economy
Riverdale is primarily a residential community, although it is home to a number of small businesses. The area is served by a number of major highways, including Interstate 95, Interstate 495, and the Baltimore-Washington Parkway.
The area is also home to a number of government agencies, including the National Institutes of Health, the National Security Agency, and the U.S. Department of Agriculture.
Demographics
As of the 2010 census, the population of Riverdale was 8,979. The racial makeup of the community was 57.3% White, 28.2% African American, 0.3% Native American, 5.2% Asian, and 8.9% from other races. The median household income was $68,945.
Riverdale is a diverse community with a variety of cultural and religious backgrounds. The area is home to a number of churches, including the Riverdale Presbyterian Church, the Riverdale Baptist Church, and the Riverdale United Methodist Church.
Conclusion
Riverdale is a small unincorporated community located in Prince George’s County, Maryland, United States. It is situated along the Potomac River, just south of Washington, D.C. The area was first settled in the late 1700s by a group of German immigrants and was later annexed by the City of Washington in 1871. The area is characterized by rolling hills and is home to a number of parks and recreational areas. Riverdale is primarily a residential community, although it is home to a number of small businesses. As of the 2010 census, the population of Riverdale was 8,979. The area is home to a number of churches, including the Riverdale Presbyterian Church, the Riverdale Baptist Church, and the Riverdale United Methodist Church.
Common Questions
What is the Total Population of Riverdale?
Total Population of Riverdale is 1,046.
What is the Total Male Population of Riverdale?
Total Male Population of Riverdale is 348.
What is the Total Female Population of Riverdale?
Total Female Population of Riverdale is 698.
What is the Ratio of Males per 100 Females in Riverdale?
There are 49.86 Males per 100 Females in Riverdale.
What is the Ratio of Females per 100 Males in Riverdale?
There are 200.57 Females per 100 Males in Riverdale.
What is the Median Population Age in Riverdale?
Median Population Age in Riverdale is 34.0 Years.
What is the Average Family Size in Riverdale
Average Family Size in Riverdale is 4.0 People.
What is the Average Household Size in Riverdale
Average Household Size in Riverdale is 2.9 People.
What is Per Capita Income in Riverdale?
Per Capita income in Riverdale is $24,570.
What is the Median Family Income in Riverdale?
Median Family Income in Riverdale is $97,813.
What is the Median Household income in Riverdale?
Median Household Income in Riverdale is $65,469.
What is Inequality or Gini Index in Riverdale?
Inequality or Gini Index in Riverdale is 0.34.
How Large is the Labor Force in Riverdale?
There are 302 People in the Labor Forcein in Riverdale.
What is the Percentage of People in the Labor Force in Riverdale?
38.4% of People are in the Labor Force in Riverdale.