Cities with the Most Immigrants from Sri Lanka in the United States
RELATED REPORTS & OPTIONS
Sri Lanka
United States
Compare Cities
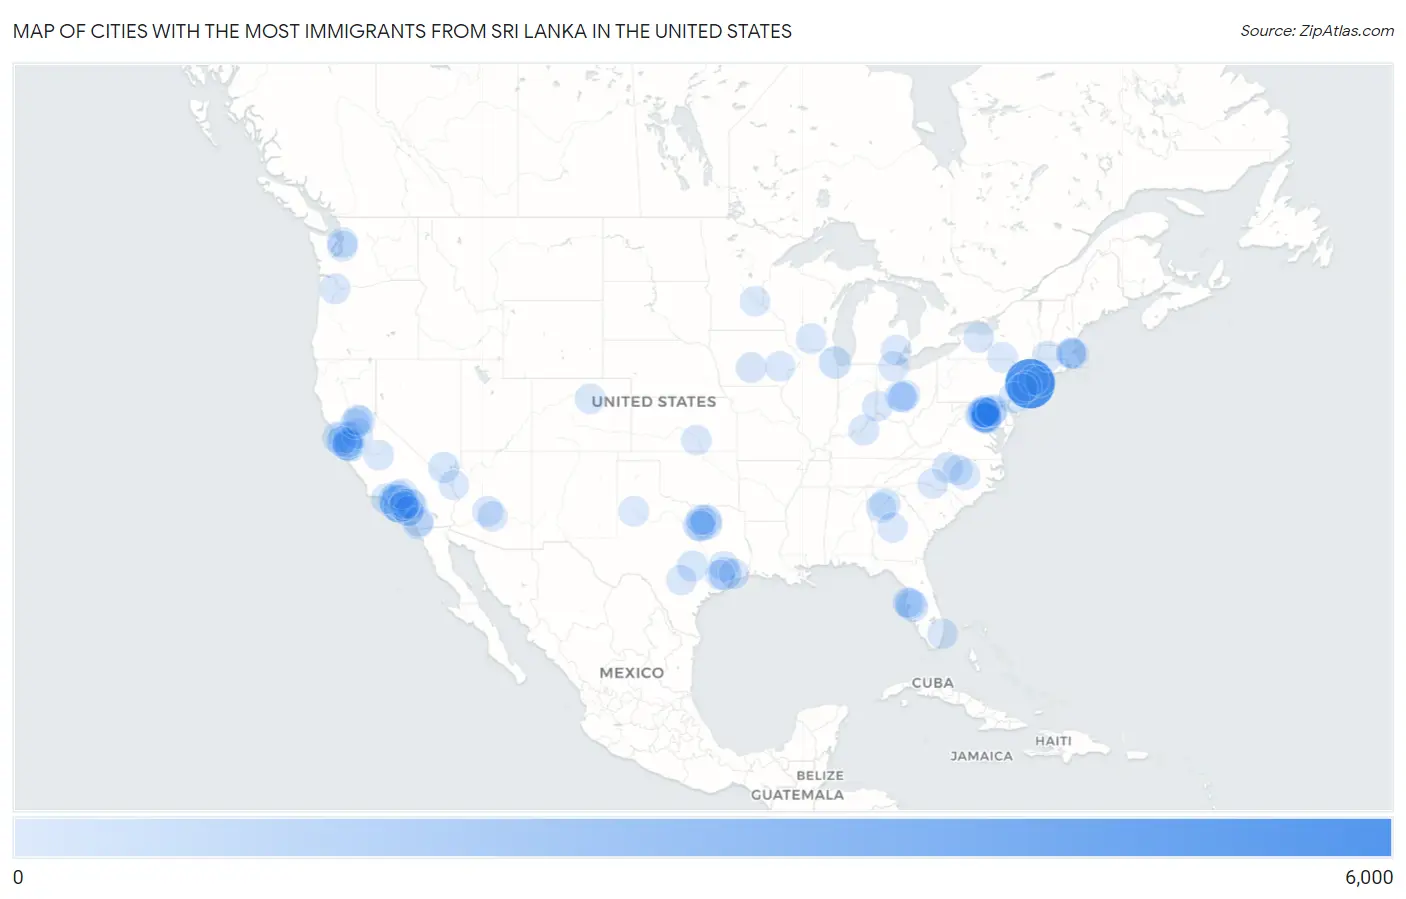
Map of Cities with the Most Immigrants from Sri Lanka in the United States
0
6,000
Cities with the Most Immigrants from Sri Lanka in the United States
| City | Sri Lanka | vs State | vs National | |
| 1. | New York | 5,344 | 7,915(67.52%)#1 | 56,619(9.44%)#1 |
| 2. | Los Angeles | 1,939 | 11,287(17.18%)#1 | 56,619(3.42%)#2 |
| 3. | Houston | 727 | 5,523(13.16%)#1 | 56,619(1.28%)#3 |
| 4. | Chicago | 574 | 1,403(40.91%)#1 | 56,619(1.01%)#4 |
| 5. | Dallas | 486 | 5,523(8.80%)#2 | 56,619(0.86%)#5 |
| 6. | Sunnyvale | 429 | 11,287(3.80%)#2 | 56,619(0.76%)#6 |
| 7. | Gaithersburg | 392 | 3,410(11.50%)#1 | 56,619(0.69%)#7 |
| 8. | Reston | 358 | 2,232(16.04%)#1 | 56,619(0.63%)#8 |
| 9. | Clarksburg | 346 | 3,410(10.15%)#2 | 56,619(0.61%)#9 |
| 10. | Fort Worth | 341 | 5,523(6.17%)#3 | 56,619(0.60%)#10 |
| 11. | San Jose | 337 | 11,287(2.99%)#3 | 56,619(0.60%)#11 |
| 12. | Riverview | 333 | 2,649(12.57%)#1 | 56,619(0.59%)#12 |
| 13. | Baltimore | 314 | 3,410(9.21%)#3 | 56,619(0.55%)#13 |
| 14. | Austin | 310 | 5,523(5.61%)#4 | 56,619(0.55%)#14 |
| 15. | Oakland | 301 | 11,287(2.67%)#4 | 56,619(0.53%)#15 |
| 16. | Irvine | 291 | 11,287(2.58%)#5 | 56,619(0.51%)#16 |
| 17. | Spring Valley | 288 | 530(54.34%)#1 | 56,619(0.51%)#17 |
| 18. | Tampa | 279 | 2,649(10.53%)#2 | 56,619(0.49%)#18 |
| 19. | San Francisco | 277 | 11,287(2.45%)#6 | 56,619(0.49%)#19 |
| 20. | Simi Valley | 268 | 11,287(2.37%)#7 | 56,619(0.47%)#20 |
| 21. | San Ramon | 267 | 11,287(2.37%)#8 | 56,619(0.47%)#21 |
| 22. | Aspen Hill | 255 | 3,410(7.48%)#4 | 56,619(0.45%)#22 |
| 23. | Santa Clarita | 251 | 11,287(2.22%)#9 | 56,619(0.44%)#23 |
| 24. | Commack | 251 | 7,915(3.17%)#2 | 56,619(0.44%)#24 |
| 25. | Philadelphia | 248 | 1,144(21.68%)#1 | 56,619(0.44%)#25 |
| 26. | South Plainfield Borough | 226 | 3,488(6.48%)#1 | 56,619(0.40%)#26 |
| 27. | Johns Creek | 223 | 1,437(15.52%)#1 | 56,619(0.39%)#27 |
| 28. | Santa Clara | 216 | 11,287(1.91%)#10 | 56,619(0.38%)#28 |
| 29. | Bethesda | 208 | 3,410(6.10%)#5 | 56,619(0.37%)#29 |
| 30. | Des Moines | 201 | 470(42.77%)#1 | 56,619(0.36%)#30 |
| 31. | Stockton | 200 | 11,287(1.77%)#11 | 56,619(0.35%)#31 |
| 32. | Madison | 199 | 318(62.58%)#1 | 56,619(0.35%)#32 |
| 33. | Arlington | 194 | 2,232(8.69%)#2 | 56,619(0.34%)#33 |
| 34. | Plano | 187 | 5,523(3.39%)#5 | 56,619(0.33%)#34 |
| 35. | Brighton | 181 | 7,915(2.29%)#3 | 56,619(0.32%)#35 |
| 36. | Westfield | 177 | 1,990(8.89%)#1 | 56,619(0.31%)#36 |
| 37. | Bethany | 175 | 677(25.85%)#1 | 56,619(0.31%)#37 |
| 38. | Broadlands | 174 | 2,232(7.80%)#3 | 56,619(0.31%)#38 |
| 39. | Arlington | 170 | 5,523(3.08%)#6 | 56,619(0.30%)#39 |
| 40. | Alexandria | 165 | 2,232(7.39%)#4 | 56,619(0.29%)#40 |
| 41. | Torrance | 165 | 11,287(1.46%)#12 | 56,619(0.29%)#41 |
| 42. | Louisville | 161 | 271(59.41%)#1 | 56,619(0.28%)#42 |
| 43. | Phoenix | 155 | 808(19.18%)#1 | 56,619(0.27%)#43 |
| 44. | New Rochelle | 155 | 7,915(1.96%)#4 | 56,619(0.27%)#44 |
| 45. | Oxford | 155 | 1,435(10.80%)#1 | 56,619(0.27%)#45 |
| 46. | Farmington Hills | 154 | 1,092(14.10%)#1 | 56,619(0.27%)#46 |
| 47. | West Falls Church | 153 | 2,232(6.85%)#5 | 56,619(0.27%)#47 |
| 48. | Seattle | 152 | 833(18.25%)#1 | 56,619(0.27%)#48 |
| 49. | Hilliard | 150 | 1,435(10.45%)#2 | 56,619(0.26%)#49 |
| 50. | Folsom | 147 | 11,287(1.30%)#13 | 56,619(0.26%)#50 |
| 51. | Flower Mound | 147 | 5,523(2.66%)#7 | 56,619(0.26%)#51 |
| 52. | Fort Lauderdale | 141 | 2,649(5.32%)#3 | 56,619(0.25%)#52 |
| 53. | Thornton | 138 | 404(34.16%)#1 | 56,619(0.24%)#53 |
| 54. | San Diego | 137 | 11,287(1.21%)#14 | 56,619(0.24%)#54 |
| 55. | Sewaren | 136 | 3,488(3.90%)#2 | 56,619(0.24%)#55 |
| 56. | Greensboro | 135 | 1,029(13.12%)#1 | 56,619(0.24%)#56 |
| 57. | Boston | 134 | 1,990(6.73%)#2 | 56,619(0.24%)#57 |
| 58. | Garner | 132 | 1,029(12.83%)#2 | 56,619(0.23%)#58 |
| 59. | San Buenaventura Ventura | 131 | 11,287(1.16%)#15 | 56,619(0.23%)#59 |
| 60. | Fremont | 130 | 11,287(1.15%)#16 | 56,619(0.23%)#60 |
| 61. | Montgomery Village | 129 | 3,410(3.78%)#6 | 56,619(0.23%)#61 |
| 62. | Lubbock | 127 | 5,523(2.30%)#8 | 56,619(0.22%)#62 |
| 63. | Toledo | 126 | 1,435(8.78%)#3 | 56,619(0.22%)#63 |
| 64. | Riverside | 123 | 11,287(1.09%)#17 | 56,619(0.22%)#64 |
| 65. | Ontario | 123 | 11,287(1.09%)#18 | 56,619(0.22%)#65 |
| 66. | Palmdale | 123 | 11,287(1.09%)#19 | 56,619(0.22%)#66 |
| 67. | Cambridge | 123 | 1,990(6.18%)#3 | 56,619(0.22%)#67 |
| 68. | Poway | 123 | 11,287(1.09%)#20 | 56,619(0.22%)#68 |
| 69. | Binghamton | 120 | 7,915(1.52%)#5 | 56,619(0.21%)#69 |
| 70. | Germantown | 119 | 3,410(3.49%)#7 | 56,619(0.21%)#70 |
| 71. | Aliso Viejo | 119 | 11,287(1.05%)#21 | 56,619(0.21%)#71 |
| 72. | Golden Valley | 119 | 902(13.19%)#1 | 56,619(0.21%)#72 |
| 73. | Sacramento | 118 | 11,287(1.05%)#22 | 56,619(0.21%)#73 |
| 74. | Brookline | 118 | 1,990(5.93%)#4 | 56,619(0.21%)#74 |
| 75. | Carrboro | 117 | 1,029(11.37%)#3 | 56,619(0.21%)#75 |
| 76. | Fairview Borough | 117 | 3,488(3.35%)#3 | 56,619(0.21%)#76 |
| 77. | West Covina | 116 | 11,287(1.03%)#23 | 56,619(0.20%)#77 |
| 78. | New Albany | 116 | 1,435(8.08%)#4 | 56,619(0.20%)#78 |
| 79. | Fresno | 115 | 11,287(1.02%)#24 | 56,619(0.20%)#79 |
| 80. | Olney | 113 | 3,410(3.31%)#8 | 56,619(0.20%)#80 |
| 81. | Conroe | 112 | 5,523(2.03%)#9 | 56,619(0.20%)#81 |
| 82. | Cinco Ranch | 111 | 5,523(2.01%)#10 | 56,619(0.20%)#82 |
| 83. | Wichita | 110 | 339(32.45%)#1 | 56,619(0.19%)#83 |
| 84. | Iowa City | 110 | 470(23.40%)#2 | 56,619(0.19%)#84 |
| 85. | Franklin Park | 110 | 3,488(3.15%)#4 | 56,619(0.19%)#85 |
| 86. | Columbus | 108 | 1,435(7.53%)#5 | 56,619(0.19%)#86 |
| 87. | Mont Belvieu | 108 | 5,523(1.96%)#11 | 56,619(0.19%)#87 |
| 88. | Lynnwood | 107 | 833(12.85%)#2 | 56,619(0.19%)#88 |
| 89. | Roseville | 106 | 11,287(0.94%)#25 | 56,619(0.19%)#89 |
| 90. | Westchase | 105 | 2,649(3.96%)#4 | 56,619(0.19%)#90 |
| 91. | Gilbert | 103 | 808(12.75%)#2 | 56,619(0.18%)#91 |
| 92. | Hillsborough | 103 | 3,488(2.95%)#5 | 56,619(0.18%)#92 |
| 93. | Arbutus | 102 | 3,410(2.99%)#9 | 56,619(0.18%)#93 |
| 94. | Millbrae | 100 | 11,287(0.89%)#26 | 56,619(0.18%)#94 |
| 95. | Atlanta | 99 | 1,437(6.89%)#2 | 56,619(0.17%)#95 |
| 96. | San Antonio | 98 | 5,523(1.77%)#12 | 56,619(0.17%)#96 |
| 97. | Charlotte | 98 | 1,029(9.52%)#4 | 56,619(0.17%)#97 |
| 98. | Warner Robins | 98 | 1,437(6.82%)#3 | 56,619(0.17%)#98 |
| 99. | Bullhead City | 98 | 808(12.13%)#3 | 56,619(0.17%)#99 |
| 100. | Cerritos | 96 | 11,287(0.85%)#27 | 56,619(0.17%)#100 |
Common Questions
What are the Top 10 Cities with the Most Immigrants from Sri Lanka in the United States?
Top 10 Cities with the Most Immigrants from Sri Lanka in the United States are:
#1
5,344
#2
1,939
#3
727
#4
574
#5
486
#6
429
#7
392
#8
358
#9
346
#10
341
What city has the Most Immigrants from Sri Lanka in the United States?
New York has the Most Immigrants from Sri Lanka in the United States with 5,344.
What is the Total Immigrants from Sri Lanka in the United States?
Total Immigrants from Sri Lanka in the United States is 56,619.