Cities with the Most Immigrants from Singapore in New Jersey
RELATED REPORTS & OPTIONS
Singapore
New Jersey
Compare Cities
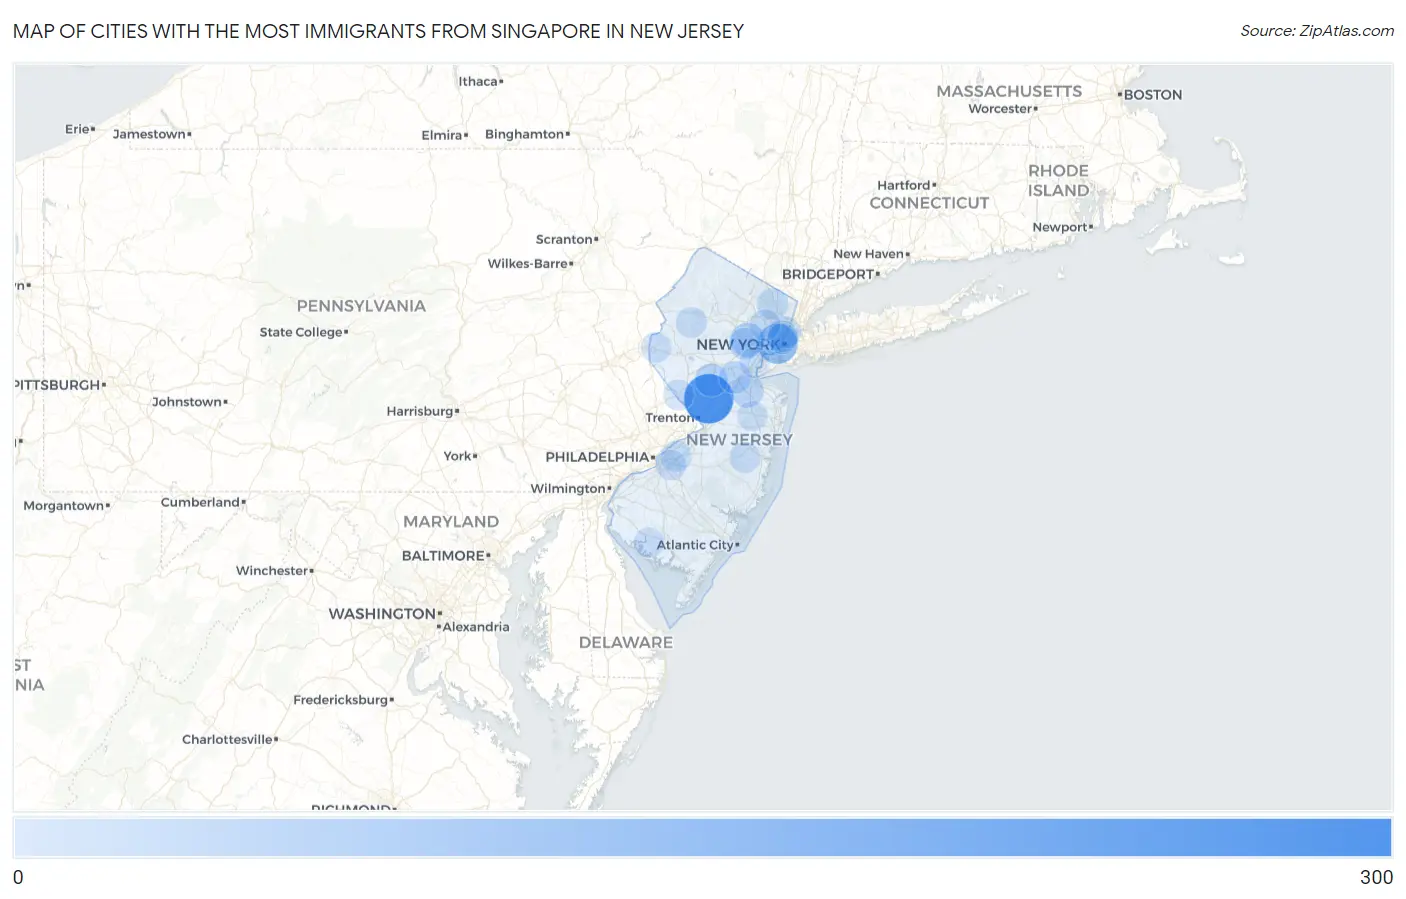
Map of Cities with the Most Immigrants from Singapore in New Jersey
0
300
Cities with the Most Immigrants from Singapore in New Jersey
| City | Singapore | vs State | vs National | |
| 1. | Princeton | 288 | 1,490(19.33%)#1 | 35,435(0.81%)#11 |
| 2. | Jersey City | 147 | 1,490(9.87%)#2 | 35,435(0.41%)#35 |
| 3. | Tenafly Borough | 80 | 1,490(5.37%)#3 | 35,435(0.23%)#79 |
| 4. | Short Hills | 58 | 1,490(3.89%)#4 | 35,435(0.16%)#120 |
| 5. | Belle Mead | 43 | 1,490(2.89%)#5 | 35,435(0.12%)#166 |
| 6. | Old Bridge | 34 | 1,490(2.28%)#6 | 35,435(0.10%)#212 |
| 7. | Lindenwold Borough | 33 | 1,490(2.21%)#7 | 35,435(0.09%)#218 |
| 8. | New Brunswick | 32 | 1,490(2.15%)#8 | 35,435(0.09%)#223 |
| 9. | Parsippany | 30 | 1,490(2.01%)#9 | 35,435(0.08%)#235 |
| 10. | West New York | 26 | 1,490(1.74%)#10 | 35,435(0.07%)#263 |
| 11. | Summit | 23 | 1,490(1.54%)#11 | 35,435(0.06%)#290 |
| 12. | New Milford Borough | 22 | 1,490(1.48%)#12 | 35,435(0.06%)#306 |
| 13. | Ridgewood | 20 | 1,490(1.34%)#13 | 35,435(0.06%)#331 |
| 14. | Union City | 18 | 1,490(1.21%)#14 | 35,435(0.05%)#354 |
| 15. | River Edge Borough | 18 | 1,490(1.21%)#15 | 35,435(0.05%)#364 |
| 16. | Fort Lee Borough | 17 | 1,490(1.14%)#16 | 35,435(0.05%)#377 |
| 17. | Rutherford Borough | 16 | 1,490(1.07%)#17 | 35,435(0.05%)#398 |
| 18. | Brooklawn Borough | 16 | 1,490(1.07%)#18 | 35,435(0.05%)#401 |
| 19. | Brookdale | 15 | 1,490(1.01%)#19 | 35,435(0.04%)#420 |
| 20. | Moorestown Lenola | 13 | 1,490(0.87%)#20 | 35,435(0.04%)#454 |
| 21. | Leonia Borough | 13 | 1,490(0.87%)#21 | 35,435(0.04%)#458 |
| 22. | Matawan Borough | 12 | 1,490(0.81%)#22 | 35,435(0.03%)#486 |
| 23. | Norwood Borough | 12 | 1,490(0.81%)#23 | 35,435(0.03%)#489 |
| 24. | Hackettstown | 11 | 1,490(0.74%)#24 | 35,435(0.03%)#513 |
| 25. | Fanwood Borough | 11 | 1,490(0.74%)#25 | 35,435(0.03%)#514 |
| 26. | Paramus Borough | 10 | 1,490(0.67%)#26 | 35,435(0.03%)#536 |
| 27. | Avenel | 10 | 1,490(0.67%)#27 | 35,435(0.03%)#543 |
| 28. | Crestwood Village | 10 | 1,490(0.67%)#28 | 35,435(0.03%)#548 |
| 29. | The College Of New Jersey | 10 | 1,490(0.67%)#29 | 35,435(0.03%)#551 |
| 30. | Hoboken | 9 | 1,490(0.60%)#30 | 35,435(0.03%)#562 |
| 31. | Roselle Park Borough | 9 | 1,490(0.60%)#31 | 35,435(0.03%)#572 |
| 32. | Closter Borough | 9 | 1,490(0.60%)#32 | 35,435(0.03%)#577 |
| 33. | Lambertville | 9 | 1,490(0.60%)#33 | 35,435(0.03%)#580 |
| 34. | Eatontown Borough | 8 | 1,490(0.54%)#34 | 35,435(0.02%)#599 |
| 35. | Haddonfield Borough | 8 | 1,490(0.54%)#35 | 35,435(0.02%)#600 |
| 36. | Menlo Park Terrace | 8 | 1,490(0.54%)#36 | 35,435(0.02%)#611 |
| 37. | Sayreville Borough | 6 | 1,490(0.40%)#37 | 35,435(0.02%)#645 |
| 38. | Waldwick Borough | 6 | 1,490(0.40%)#38 | 35,435(0.02%)#656 |
| 39. | Bridgewater Center | 6 | 1,490(0.40%)#39 | 35,435(0.02%)#660 |
| 40. | Barclay | 5 | 1,490(0.34%)#40 | 35,435(0.01%)#684 |
| 41. | Greenwich | 5 | 1,490(0.34%)#41 | 35,435(0.01%)#686 |
| 42. | West Freehold | 3 | 1,490(0.20%)#42 | 35,435(0.01%)#719 |
| 43. | Fairton | 3 | 1,490(0.20%)#43 | 35,435(0.01%)#728 |
Common Questions
What are the Top 10 Cities with the Most Immigrants from Singapore in New Jersey?
Top 10 Cities with the Most Immigrants from Singapore in New Jersey are:
#1
288
#2
147
#3
58
#4
43
#5
34
#6
32
#7
26
#8
23
#9
20
#10
18
What city has the Most Immigrants from Singapore in New Jersey?
Princeton has the Most Immigrants from Singapore in New Jersey with 288.
What is the Total Immigrants from Singapore in the State of New Jersey?
Total Immigrants from Singapore in New Jersey is 1,490.
What is the Total Immigrants from Singapore in the United States?
Total Immigrants from Singapore in the United States is 35,435.