Crystal City, TX
Crystal City Map
Crystal City Overview
6,332
TOTAL POPULATION
3,267
MALE POPULATION
3,065
FEMALE POPULATION
106.59
MALES / 100 FEMALES
93.82
FEMALES / 100 MALES
33.8
MEDIAN AGE
2.9
AVG FAMILY SIZE
2.6
AVG HOUSEHOLD SIZE
$21,198
PER CAPITA INCOME
$48,145
AVG FAMILY INCOME
$49,211
AVG HOUSEHOLD INCOME
61.7%
WAGE / INCOME GAP [ % ]
38.3¢/ $1
WAGE / INCOME GAP [ $ ]
0.40
INEQUALITY / GINI INDEX
2,680
LABOR FORCE [ PEOPLE ]
55.4%
PERCENT IN LABOR FORCE
4.7%
UNEMPLOYMENT RATE
Crystal City Zip Codes
Crystal City Area Codes
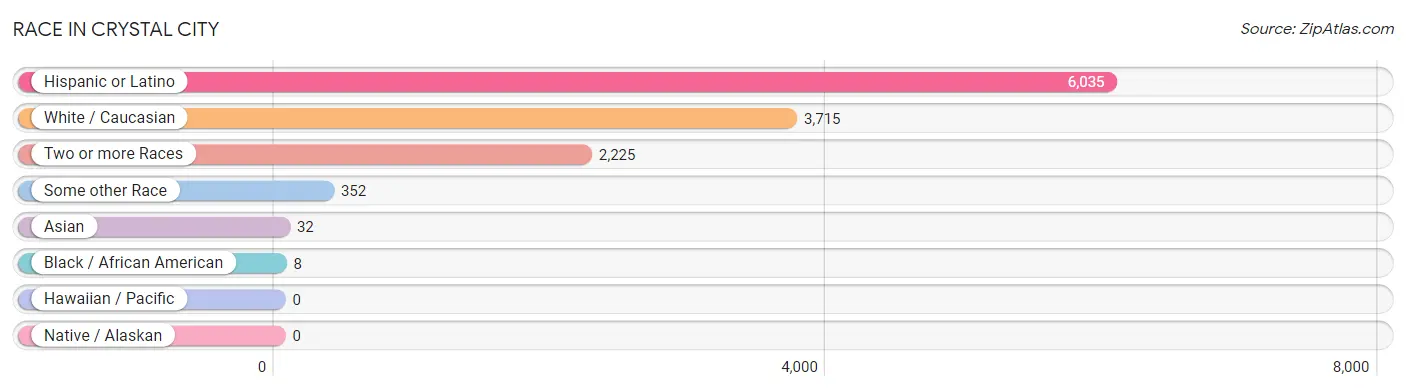
Race in Crystal City
The most populous races in Crystal City are Hispanic or Latino (6,035 | 95.3%), White / Caucasian (3,715 | 58.7%), and Two or more Races (2,225 | 35.1%).
| Race | # Population | % Population |
| Asian | 32 | 0.5% |
| Black / African American | 8 | 0.1% |
| Hawaiian / Pacific | 0 | 0.0% |
| Hispanic or Latino | 6,035 | 95.3% |
| Native / Alaskan | 0 | 0.0% |
| White / Caucasian | 3,715 | 58.7% |
| Two or more Races | 2,225 | 35.1% |
| Some other Race | 352 | 5.6% |
| Total | 6,332 | 100.0% |
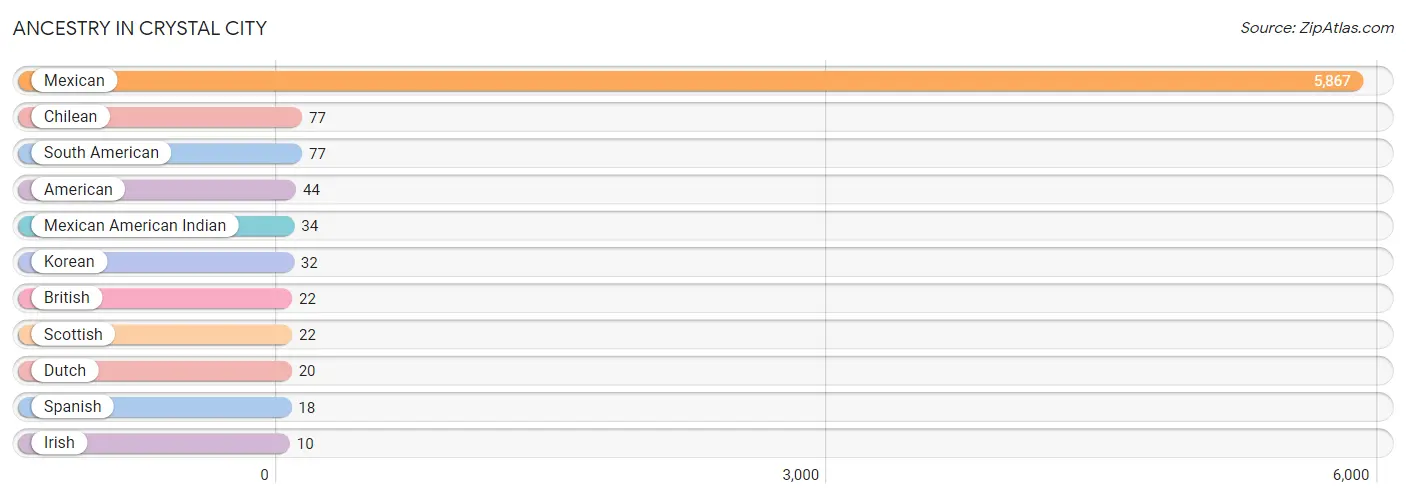
Ancestry in Crystal City
The most populous ancestries reported in Crystal City are Mexican (5,867 | 92.7%), Chilean (77 | 1.2%), South American (77 | 1.2%), American (44 | 0.7%), and Mexican American Indian (34 | 0.5%), together accounting for 96.3% of all Crystal City residents.
| Ancestry | # Population | % Population |
| American | 44 | 0.7% |
| British | 22 | 0.4% |
| Chilean | 77 | 1.2% |
| Dutch | 20 | 0.3% |
| Irish | 10 | 0.2% |
| Korean | 32 | 0.5% |
| Mexican | 5,867 | 92.7% |
| Mexican American Indian | 34 | 0.5% |
| Scottish | 22 | 0.4% |
| South American | 77 | 1.2% |
| Spanish | 18 | 0.3% | View All 11 Rows |
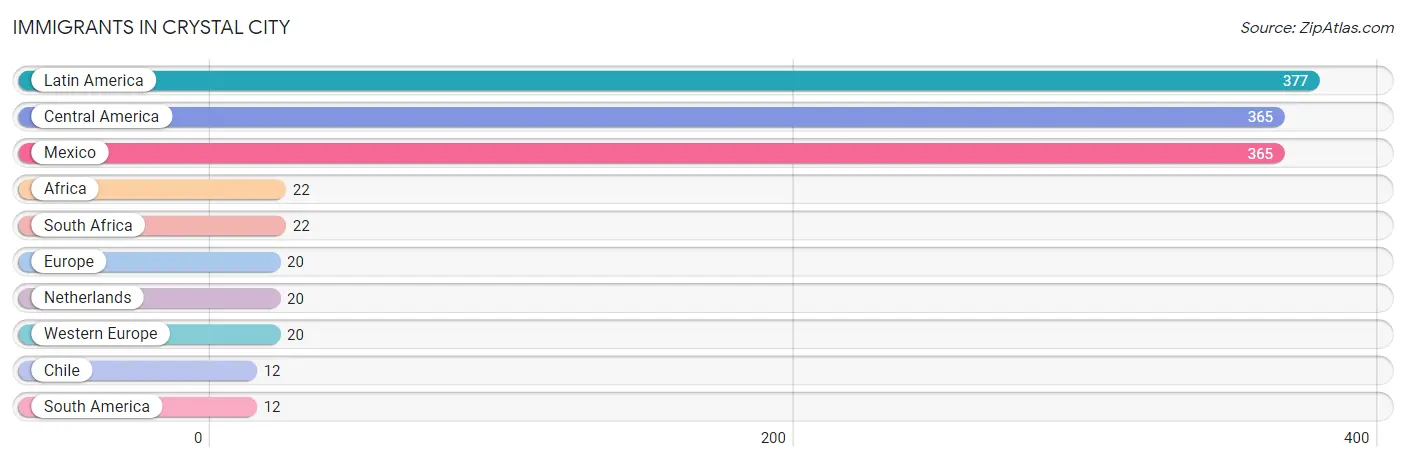
Immigrants in Crystal City
The most numerous immigrant groups reported in Crystal City came from Latin America (377 | 5.9%), Central America (365 | 5.8%), Mexico (365 | 5.8%), Africa (22 | 0.4%), and South Africa (22 | 0.4%), together accounting for 18.2% of all Crystal City residents.
| Immigration Origin | # Population | % Population |
| Africa | 22 | 0.4% |
| Central America | 365 | 5.8% |
| Chile | 12 | 0.2% |
| Europe | 20 | 0.3% |
| Latin America | 377 | 5.9% |
| Mexico | 365 | 5.8% |
| Netherlands | 20 | 0.3% |
| South Africa | 22 | 0.4% |
| South America | 12 | 0.2% |
| Western Europe | 20 | 0.3% | View All 10 Rows |
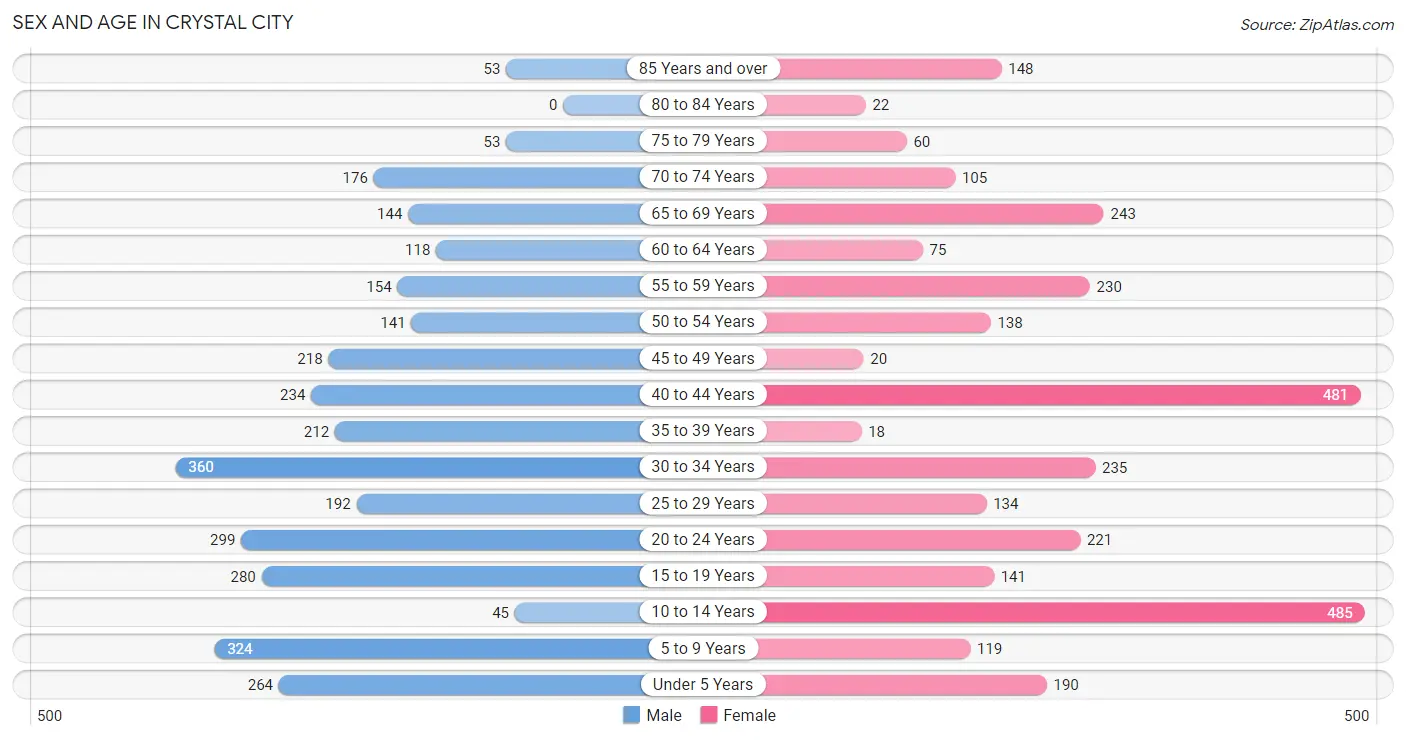
Sex and Age in Crystal City
Sex and Age in Crystal City
The most populous age groups in Crystal City are 30 to 34 Years (360 | 11.0%) for men and 10 to 14 Years (485 | 15.8%) for women.
| Age Bracket | Male | Female |
| Under 5 Years | 264 (8.1%) | 190 (6.2%) |
| 5 to 9 Years | 324 (9.9%) | 119 (3.9%) |
| 10 to 14 Years | 45 (1.4%) | 485 (15.8%) |
| 15 to 19 Years | 280 (8.6%) | 141 (4.6%) |
| 20 to 24 Years | 299 (9.1%) | 221 (7.2%) |
| 25 to 29 Years | 192 (5.9%) | 134 (4.4%) |
| 30 to 34 Years | 360 (11.0%) | 235 (7.7%) |
| 35 to 39 Years | 212 (6.5%) | 18 (0.6%) |
| 40 to 44 Years | 234 (7.2%) | 481 (15.7%) |
| 45 to 49 Years | 218 (6.7%) | 20 (0.6%) |
| 50 to 54 Years | 141 (4.3%) | 138 (4.5%) |
| 55 to 59 Years | 154 (4.7%) | 230 (7.5%) |
| 60 to 64 Years | 118 (3.6%) | 75 (2.5%) |
| 65 to 69 Years | 144 (4.4%) | 243 (7.9%) |
| 70 to 74 Years | 176 (5.4%) | 105 (3.4%) |
| 75 to 79 Years | 53 (1.6%) | 60 (2.0%) |
| 80 to 84 Years | 0 (0.0%) | 22 (0.7%) |
| 85 Years and over | 53 (1.6%) | 148 (4.8%) |
| Total | 3,267 (100.0%) | 3,065 (100.0%) |
Families and Households in Crystal City
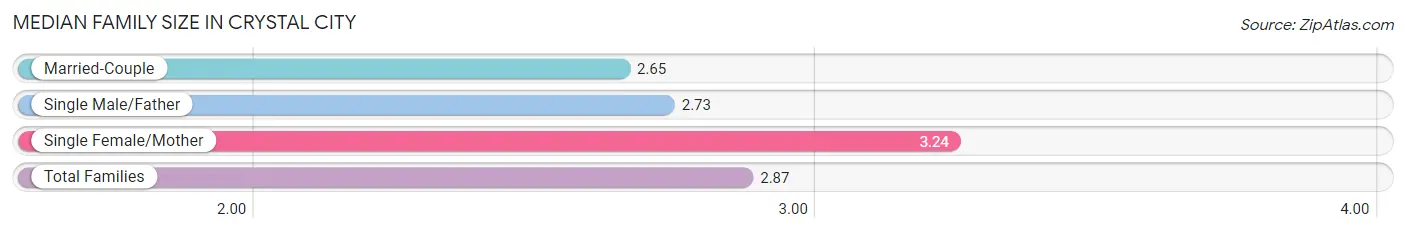
Median Family Size in Crystal City
The median family size in Crystal City is 2.87 persons per family, with single female/mother families (673 | 35.3%) accounting for the largest median family size of 3.24 persons per family. On the other hand, married-couple families (951 | 49.9%) represent the smallest median family size with 2.65 persons per family.
| Family Type | # Families | Family Size |
| Married-Couple | 951 (49.9%) | 2.65 |
| Single Male/Father | 283 (14.8%) | 2.73 |
| Single Female/Mother | 673 (35.3%) | 3.24 |
| Total Families | 1,907 (100.0%) | 2.87 |
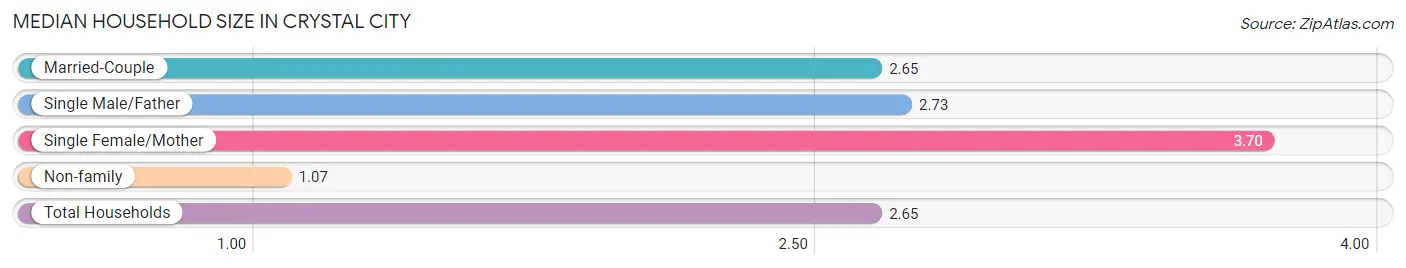
Median Household Size in Crystal City
The median household size in Crystal City is 2.65 persons per household, with single female/mother households (673 | 28.4%) accounting for the largest median household size of 3.7 persons per household. non-family households (459 | 19.4%) represent the smallest median household size with 1.07 persons per household.
| Household Type | # Households | Household Size |
| Married-Couple | 951 (40.2%) | 2.65 |
| Single Male/Father | 283 (12.0%) | 2.73 |
| Single Female/Mother | 673 (28.4%) | 3.70 |
| Non-family | 459 (19.4%) | 1.07 |
| Total Households | 2,366 (100.0%) | 2.65 |
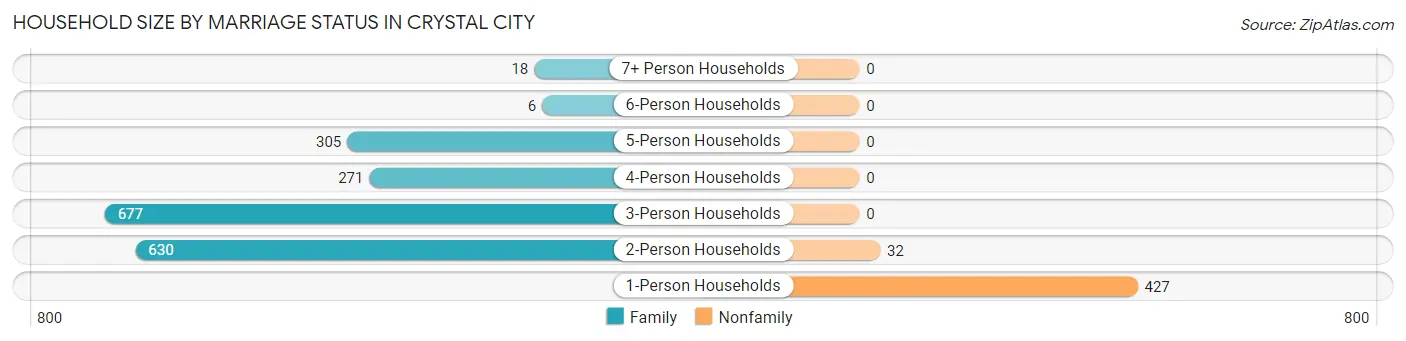
Household Size by Marriage Status in Crystal City
Out of a total of 2,366 households in Crystal City, 1,907 (80.6%) are family households, while 459 (19.4%) are nonfamily households. The most numerous type of family households are 3-person households, comprising 677, and the most common type of nonfamily households are 1-person households, comprising 427.
| Household Size | Family Households | Nonfamily Households |
| 1-Person Households | - | 427 (18.0%) |
| 2-Person Households | 630 (26.6%) | 32 (1.3%) |
| 3-Person Households | 677 (28.6%) | 0 (0.0%) |
| 4-Person Households | 271 (11.5%) | 0 (0.0%) |
| 5-Person Households | 305 (12.9%) | 0 (0.0%) |
| 6-Person Households | 6 (0.3%) | 0 (0.0%) |
| 7+ Person Households | 18 (0.8%) | 0 (0.0%) |
| Total | 1,907 (80.6%) | 459 (19.4%) |
Female Fertility in Crystal City
Fertility by Age in Crystal City
Average fertility rate in Crystal City is 56.0 births per 1,000 women. Women in the age bracket of 35 to 50 years have the highest fertility rate with 131.0 births per 1,000 women. Women in the age bracket of 35 to 50 years acount for 100.0% of all women with births.
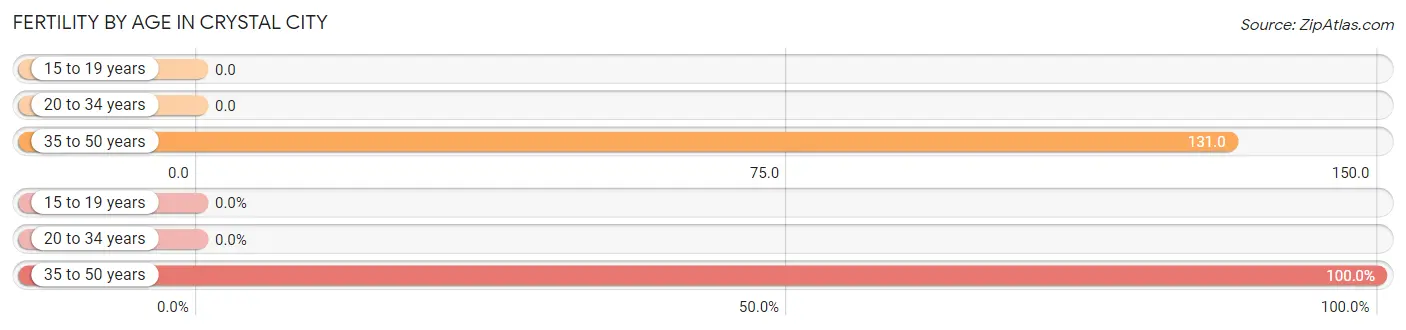
| Age Bracket | Women with Births | Births / 1,000 Women |
| 15 to 19 years | 0 (0.0%) | 0.0 |
| 20 to 34 years | 0 (0.0%) | 0.0 |
| 35 to 50 years | 71 (100.0%) | 131.0 |
| Total | 71 (100.0%) | 56.0 |
Fertility by Age by Marriage Status in Crystal City
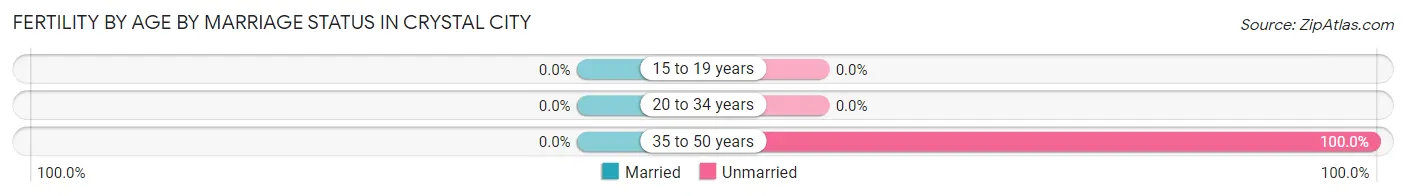
| Age Bracket | Married | Unmarried |
| 15 to 19 years | 0 (0.0%) | 0 (0.0%) |
| 20 to 34 years | 0 (0.0%) | 0 (0.0%) |
| 35 to 50 years | 0 (0.0%) | 71 (100.0%) |
| Total | 0 (0.0%) | 71 (100.0%) |
Fertility by Education in Crystal City
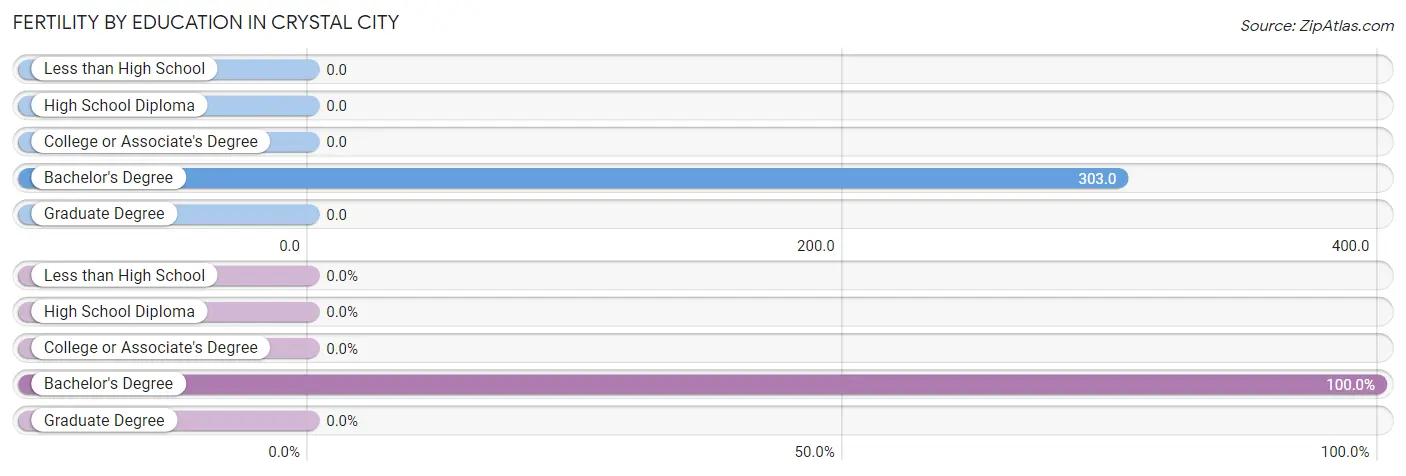
| Educational Attainment | Women with Births | Births / 1,000 Women |
| Less than High School | 0 (0.0%) | 0.0 |
| High School Diploma | 0 (0.0%) | 0.0 |
| College or Associate's Degree | 0 (0.0%) | 0.0 |
| Bachelor's Degree | 71 (100.0%) | 303.0 |
| Graduate Degree | 0 (0.0%) | 0.0 |
| Total | 71 (100.0%) | 56.0 |
Fertility by Education by Marriage Status in Crystal City
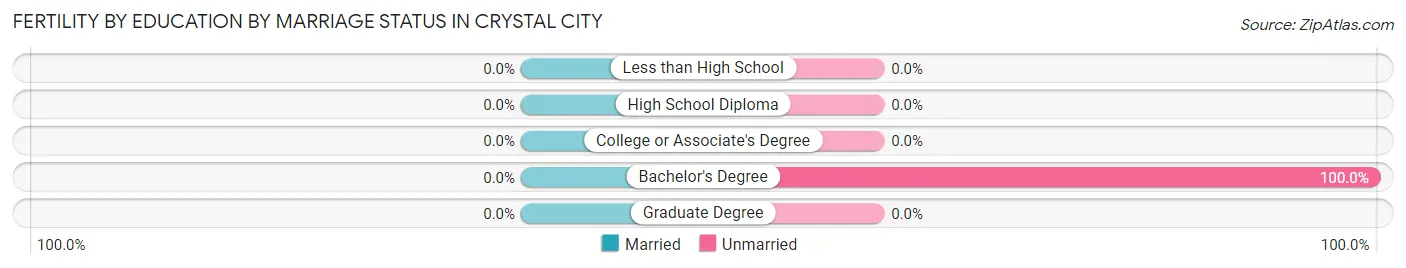
| Educational Attainment | Married | Unmarried |
| Less than High School | 0 (0.0%) | 0 (0.0%) |
| High School Diploma | 0 (0.0%) | 0 (0.0%) |
| College or Associate's Degree | 0 (0.0%) | 0 (0.0%) |
| Bachelor's Degree | 0 (0.0%) | 71 (100.0%) |
| Graduate Degree | 0 (0.0%) | 0 (0.0%) |
| Total | 0 (0.0%) | 71 (100.0%) |
Income in Crystal City
Income Overview in Crystal City
Per Capita Income in Crystal City is $21,198, while median incomes of families and households are $48,145 and $49,211 respectively.
| Characteristic | Number | Measure |
| Per Capita Income | 6,332 | $21,198 |
| Median Family Income | 1,907 | $48,145 |
| Mean Family Income | 1,907 | $65,429 |
| Median Household Income | 2,366 | $49,211 |
| Mean Household Income | 2,366 | $61,584 |
| Income Deficit | 1,907 | $0 |
| Wage / Income Gap (%) | 6,332 | 61.71% |
| Wage / Income Gap ($) | 6,332 | 38.29¢ per $1 |
| Gini / Inequality Index | 6,332 | 0.40 |
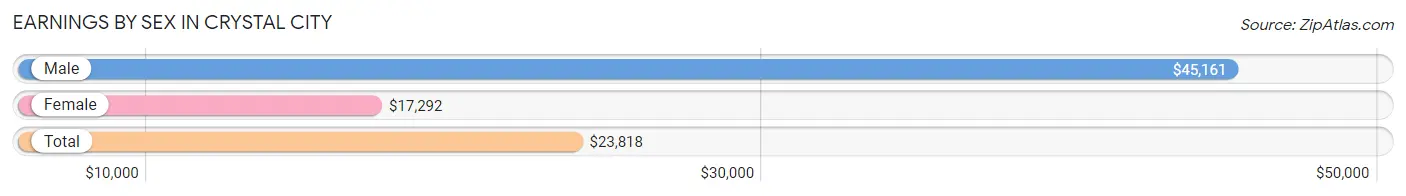
Earnings by Sex in Crystal City
Average Earnings in Crystal City are $23,818, $45,161 for men and $17,292 for women, a difference of 61.7%.
| Sex | Number | Average Earnings |
| Male | 1,605 (54.5%) | $45,161 |
| Female | 1,337 (45.5%) | $17,292 |
| Total | 2,942 (100.0%) | $23,818 |
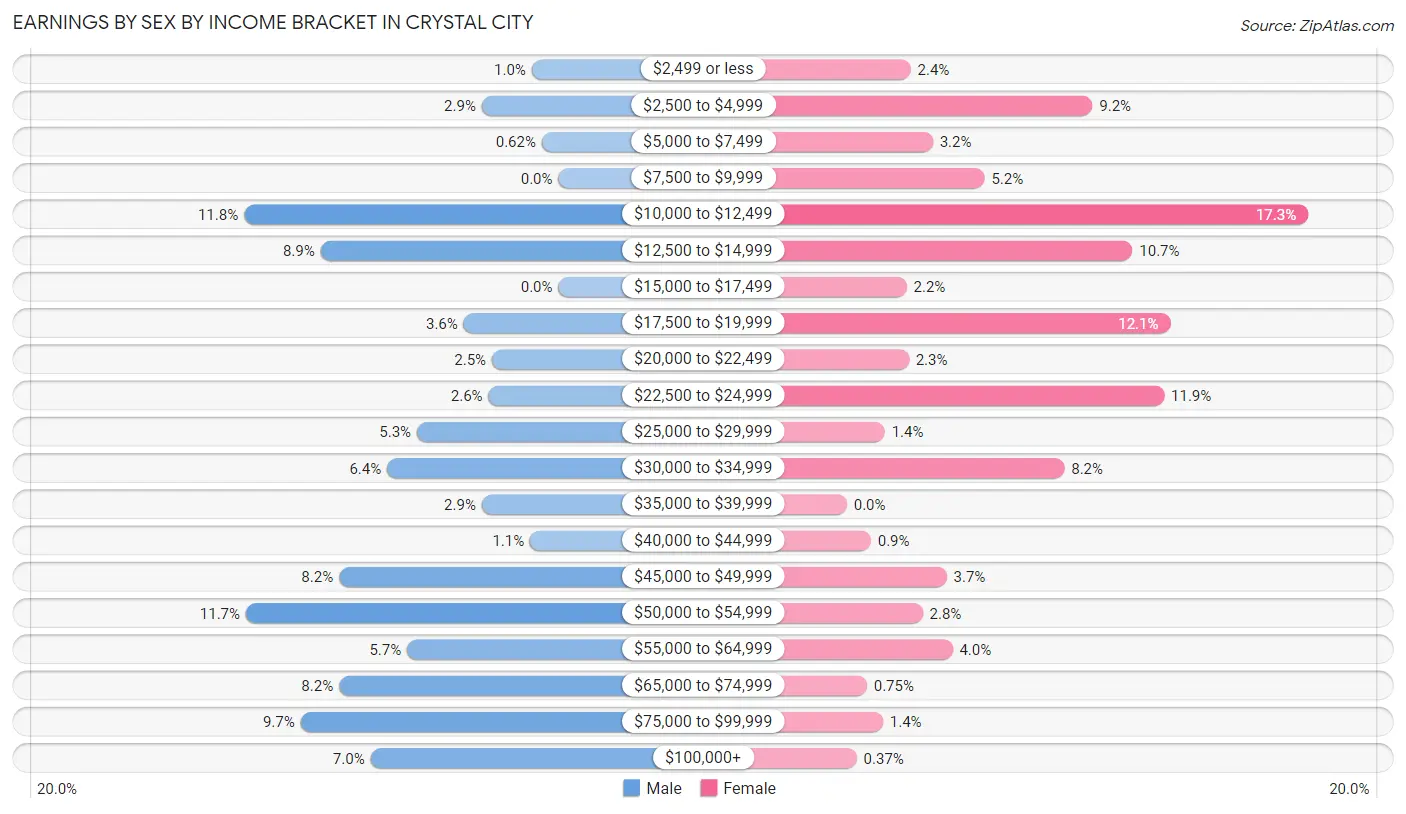
Earnings by Sex by Income Bracket in Crystal City
The most common earnings brackets in Crystal City are $10,000 to $12,499 for men (189 | 11.8%) and $10,000 to $12,499 for women (231 | 17.3%).
| Income | Male | Female |
| $2,499 or less | 16 (1.0%) | 32 (2.4%) |
| $2,500 to $4,999 | 46 (2.9%) | 123 (9.2%) |
| $5,000 to $7,499 | 10 (0.6%) | 43 (3.2%) |
| $7,500 to $9,999 | 0 (0.0%) | 69 (5.2%) |
| $10,000 to $12,499 | 189 (11.8%) | 231 (17.3%) |
| $12,500 to $14,999 | 143 (8.9%) | 143 (10.7%) |
| $15,000 to $17,499 | 0 (0.0%) | 30 (2.2%) |
| $17,500 to $19,999 | 57 (3.5%) | 162 (12.1%) |
| $20,000 to $22,499 | 40 (2.5%) | 31 (2.3%) |
| $22,500 to $24,999 | 42 (2.6%) | 159 (11.9%) |
| $25,000 to $29,999 | 85 (5.3%) | 19 (1.4%) |
| $30,000 to $34,999 | 103 (6.4%) | 109 (8.2%) |
| $35,000 to $39,999 | 46 (2.9%) | 0 (0.0%) |
| $40,000 to $44,999 | 17 (1.1%) | 12 (0.9%) |
| $45,000 to $49,999 | 132 (8.2%) | 50 (3.7%) |
| $50,000 to $54,999 | 188 (11.7%) | 38 (2.8%) |
| $55,000 to $64,999 | 91 (5.7%) | 53 (4.0%) |
| $65,000 to $74,999 | 132 (8.2%) | 10 (0.7%) |
| $75,000 to $99,999 | 155 (9.7%) | 18 (1.3%) |
| $100,000+ | 113 (7.0%) | 5 (0.4%) |
| Total | 1,605 (100.0%) | 1,337 (100.0%) |
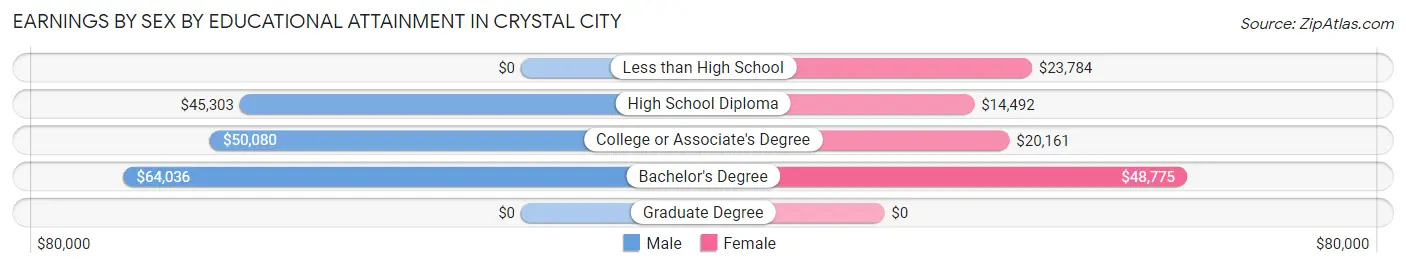
Earnings by Sex by Educational Attainment in Crystal City
Average earnings in Crystal City are $47,169 for men and $19,167 for women, a difference of 59.4%. Men with an educational attainment of bachelor's degree enjoy the highest average annual earnings of $64,036, while those with high school diploma education earn the least with $45,303. Women with an educational attainment of bachelor's degree earn the most with the average annual earnings of $48,775, while those with high school diploma education have the smallest earnings of $14,492.
| Educational Attainment | Male Income | Female Income |
| Less than High School | - | - |
| High School Diploma | $45,303 | $14,492 |
| College or Associate's Degree | $50,080 | $20,161 |
| Bachelor's Degree | $64,036 | $48,775 |
| Graduate Degree | - | - |
| Total | $47,169 | $19,167 |
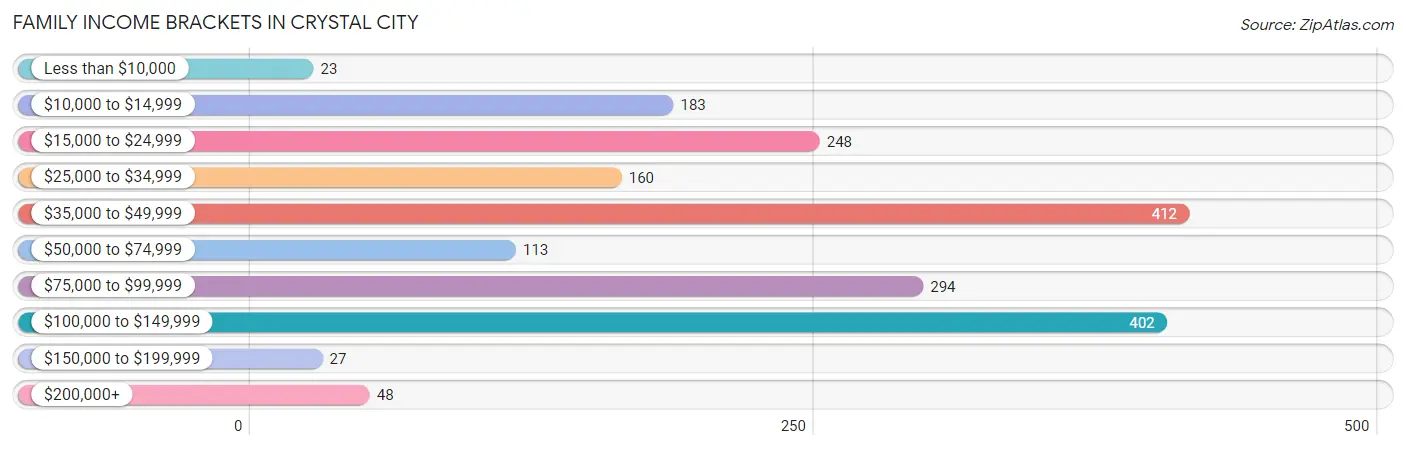
Family Income in Crystal City
Family Income Brackets in Crystal City
According to the Crystal City family income data, there are 412 families falling into the $35,000 to $49,999 income range, which is the most common income bracket and makes up 21.6% of all families. Conversely, the less than $10,000 income bracket is the least frequent group with only 23 families (1.2%) belonging to this category.
| Income Bracket | # Families | % Families |
| Less than $10,000 | 23 | 1.2% |
| $10,000 to $14,999 | 183 | 9.6% |
| $15,000 to $24,999 | 248 | 13.0% |
| $25,000 to $34,999 | 160 | 8.4% |
| $35,000 to $49,999 | 412 | 21.6% |
| $50,000 to $74,999 | 113 | 5.9% |
| $75,000 to $99,999 | 294 | 15.4% |
| $100,000 to $149,999 | 402 | 21.1% |
| $150,000 to $199,999 | 27 | 1.4% |
| $200,000+ | 48 | 2.5% |
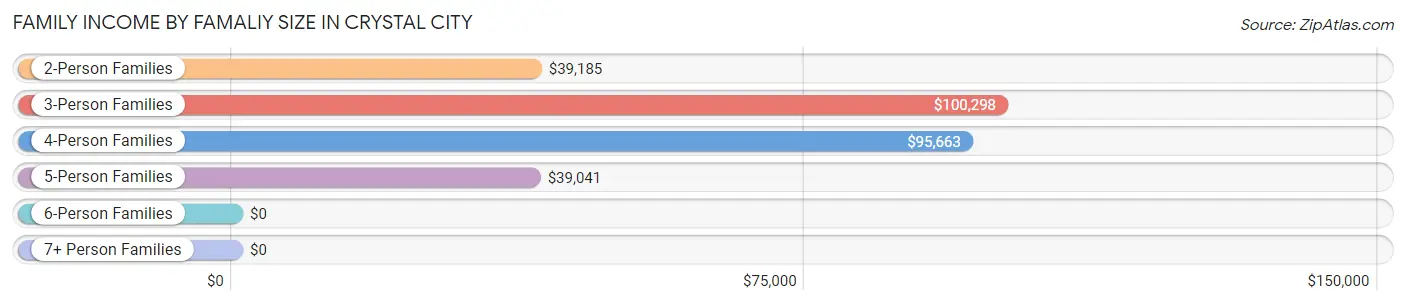
Family Income by Famaliy Size in Crystal City
3-person families (519 | 27.2%) account for the highest median family income in Crystal City with $100,298 per family, while 3-person families (519 | 27.2%) have the highest median income of $33,433 per family member.
| Income Bracket | # Families | Median Income |
| 2-Person Families | 821 (43.0%) | $39,185 |
| 3-Person Families | 519 (27.2%) | $100,298 |
| 4-Person Families | 238 (12.5%) | $95,663 |
| 5-Person Families | 305 (16.0%) | $39,041 |
| 6-Person Families | 6 (0.3%) | $0 |
| 7+ Person Families | 18 (0.9%) | $0 |
| Total | 1,907 (100.0%) | $48,145 |
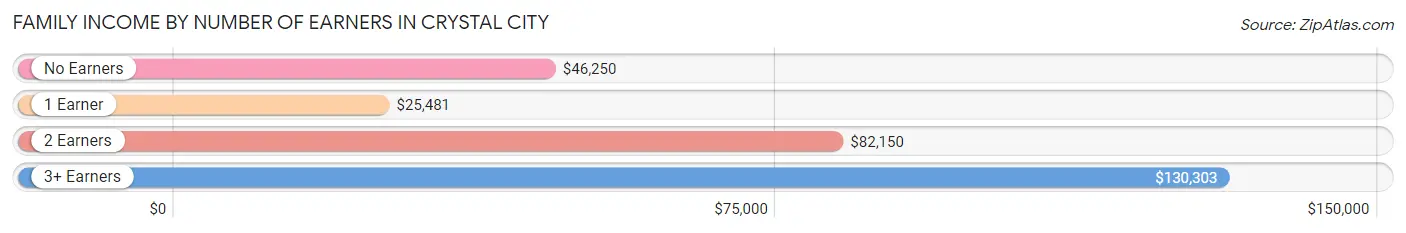
Family Income by Number of Earners in Crystal City
The median family income in Crystal City is $48,145, with families comprising 3+ earners (58) having the highest median family income of $130,303, while families with 1 earner (729) have the lowest median family income of $25,481, accounting for 3.0% and 38.2% of families, respectively.
| Number of Earners | # Families | Median Income |
| No Earners | 276 (14.5%) | $46,250 |
| 1 Earner | 729 (38.2%) | $25,481 |
| 2 Earners | 844 (44.3%) | $82,150 |
| 3+ Earners | 58 (3.0%) | $130,303 |
| Total | 1,907 (100.0%) | $48,145 |
Household Income in Crystal City
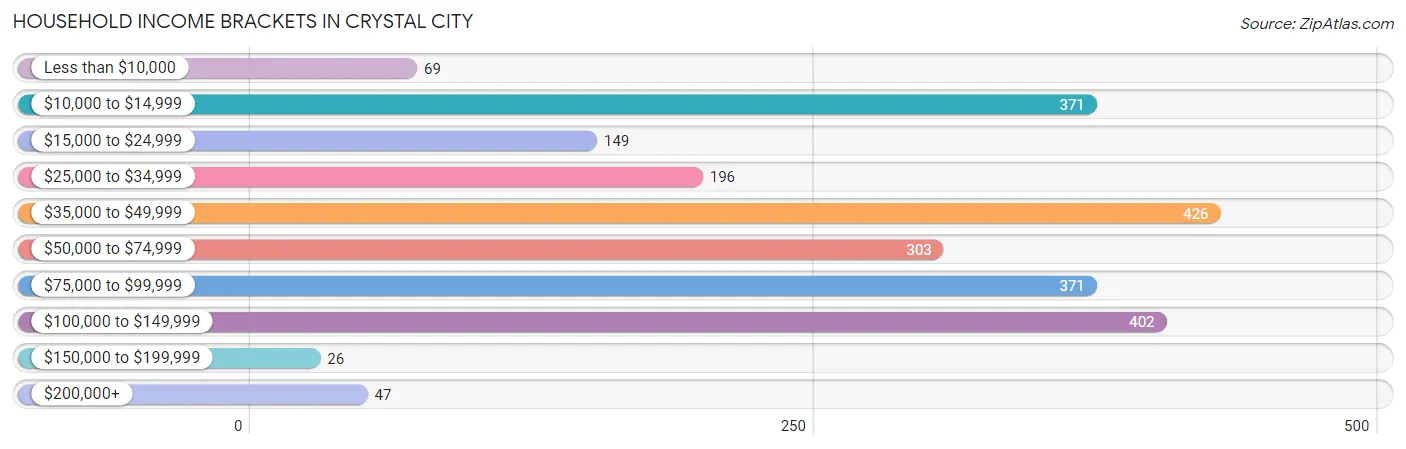
Household Income Brackets in Crystal City
With 426 households falling in the category, the $35,000 to $49,999 income range is the most frequent in Crystal City, accounting for 18.0% of all households. In contrast, only 26 households (1.1%) fall into the $150,000 to $199,999 income bracket, making it the least populous group.
| Income Bracket | # Households | % Households |
| Less than $10,000 | 69 | 2.9% |
| $10,000 to $14,999 | 371 | 15.7% |
| $15,000 to $24,999 | 149 | 6.3% |
| $25,000 to $34,999 | 196 | 8.3% |
| $35,000 to $49,999 | 426 | 18.0% |
| $50,000 to $74,999 | 303 | 12.8% |
| $75,000 to $99,999 | 371 | 15.7% |
| $100,000 to $149,999 | 402 | 17.0% |
| $150,000 to $199,999 | 26 | 1.1% |
| $200,000+ | 47 | 2.0% |
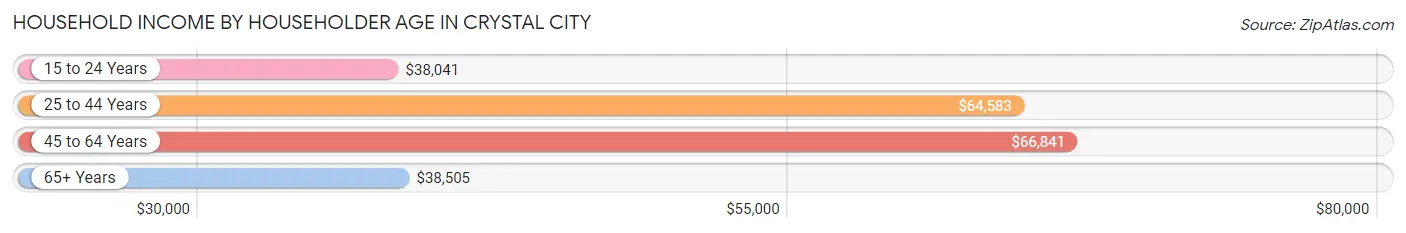
Household Income by Householder Age in Crystal City
The median household income in Crystal City is $49,211, with the highest median household income of $66,841 found in the 45 to 64 years age bracket for the primary householder. A total of 499 households (21.1%) fall into this category. Meanwhile, the 15 to 24 years age bracket for the primary householder has the lowest median household income of $38,041, with 268 households (11.3%) in this group.
| Income Bracket | # Households | Median Income |
| 15 to 24 Years | 268 (11.3%) | $38,041 |
| 25 to 44 Years | 968 (40.9%) | $64,583 |
| 45 to 64 Years | 499 (21.1%) | $66,841 |
| 65+ Years | 631 (26.7%) | $38,505 |
| Total | 2,366 (100.0%) | $49,211 |
Poverty in Crystal City
Income Below Poverty by Sex and Age in Crystal City
With 25.6% poverty level for males and 35.5% for females among the residents of Crystal City, 6 to 11 year old males and 12 to 14 year old females are the most vulnerable to poverty, with 304 males (93.8%) and 459 females (98.1%) in their respective age groups living below the poverty level.
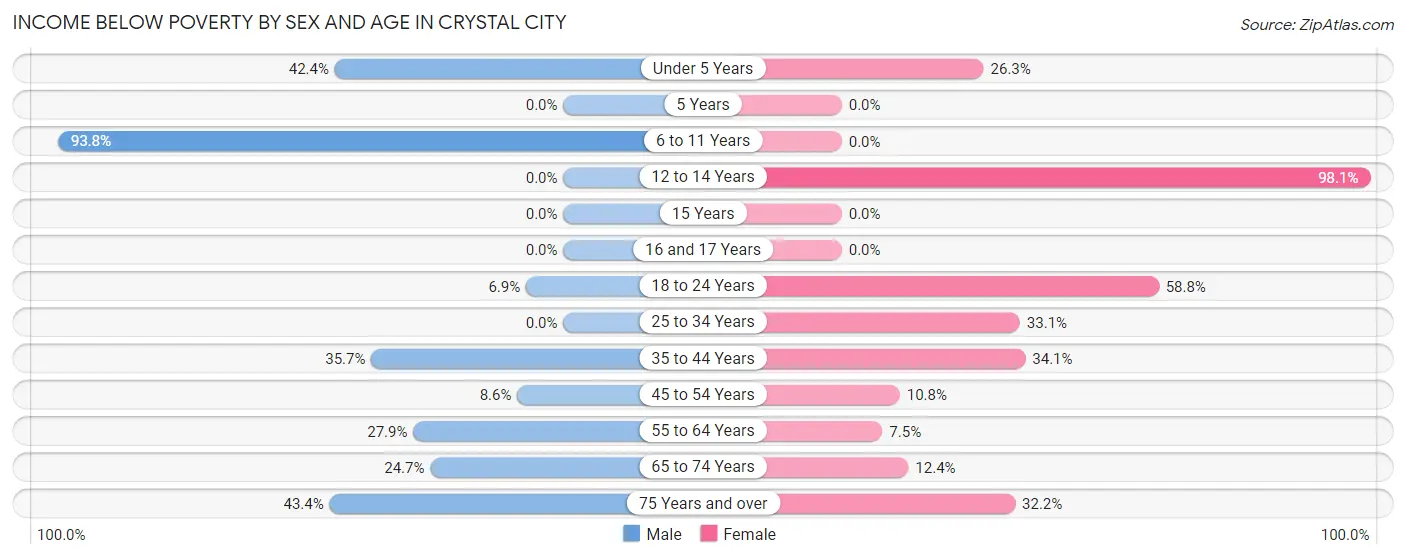
| Age Bracket | Male | Female |
| Under 5 Years | 112 (42.4%) | 50 (26.3%) |
| 5 Years | 0 (0.0%) | 0 (0.0%) |
| 6 to 11 Years | 304 (93.8%) | 0 (0.0%) |
| 12 to 14 Years | 0 (0.0%) | 459 (98.1%) |
| 15 Years | 0 (0.0%) | 0 (0.0%) |
| 16 and 17 Years | 0 (0.0%) | 0 (0.0%) |
| 18 to 24 Years | 19 (6.9%) | 130 (58.8%) |
| 25 to 34 Years | 0 (0.0%) | 122 (33.1%) |
| 35 to 44 Years | 159 (35.6%) | 170 (34.1%) |
| 45 to 54 Years | 30 (8.6%) | 17 (10.8%) |
| 55 to 64 Years | 73 (27.9%) | 23 (7.5%) |
| 65 to 74 Years | 79 (24.7%) | 43 (12.4%) |
| 75 Years and over | 46 (43.4%) | 74 (32.2%) |
| Total | 822 (25.6%) | 1,088 (35.5%) |
Income Above Poverty by Sex and Age in Crystal City
According to the poverty statistics in Crystal City, males aged 12 to 14 years and females aged 5 years are the age groups that are most secure financially, with 100.0% of males and 100.0% of females in these age groups living above the poverty line.
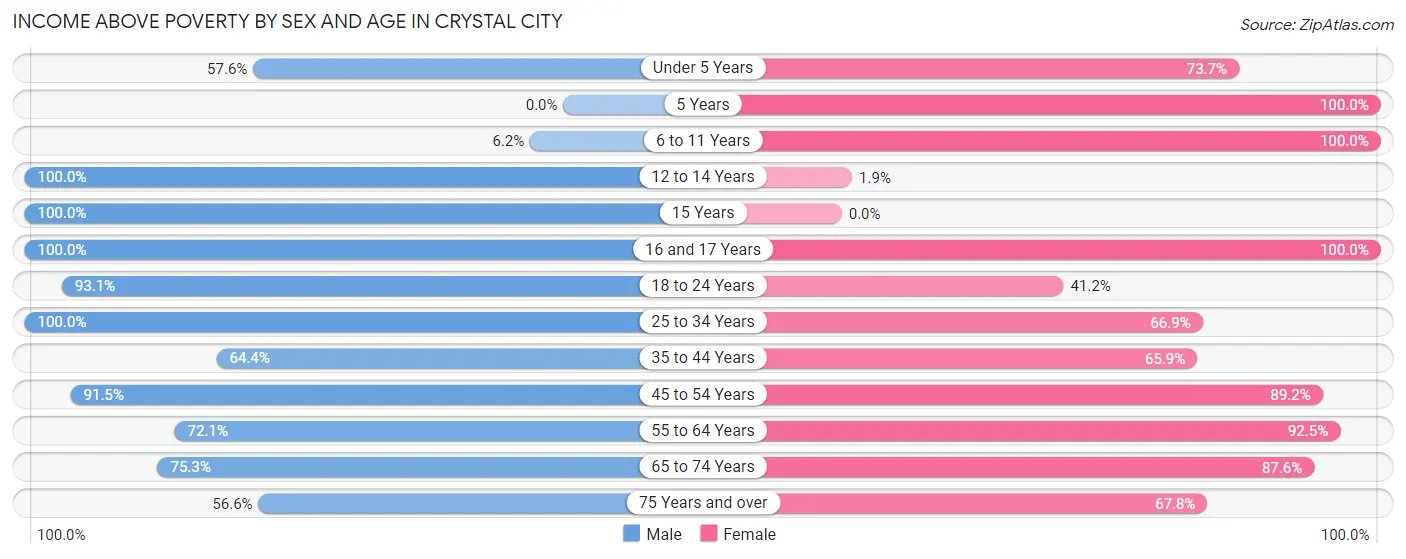
| Age Bracket | Male | Female |
| Under 5 Years | 152 (57.6%) | 140 (73.7%) |
| 5 Years | 0 (0.0%) | 7 (100.0%) |
| 6 to 11 Years | 20 (6.2%) | 129 (100.0%) |
| 12 to 14 Years | 45 (100.0%) | 9 (1.9%) |
| 15 Years | 67 (100.0%) | 0 (0.0%) |
| 16 and 17 Years | 213 (100.0%) | 141 (100.0%) |
| 18 to 24 Years | 255 (93.1%) | 91 (41.2%) |
| 25 to 34 Years | 542 (100.0%) | 247 (66.9%) |
| 35 to 44 Years | 287 (64.3%) | 329 (65.9%) |
| 45 to 54 Years | 321 (91.4%) | 141 (89.2%) |
| 55 to 64 Years | 189 (72.1%) | 282 (92.5%) |
| 65 to 74 Years | 241 (75.3%) | 305 (87.6%) |
| 75 Years and over | 60 (56.6%) | 156 (67.8%) |
| Total | 2,392 (74.4%) | 1,977 (64.5%) |
Income Below Poverty Among Married-Couple Families in Crystal City
The poverty statistics for married-couple families in Crystal City show that 4.8% or 46 of the total 951 families live below the poverty line. Families with no children have the highest poverty rate of 8.2%, comprising of 46 families. On the other hand, families with 1 or 2 children have the lowest poverty rate of 0.0%, which includes 0 families.
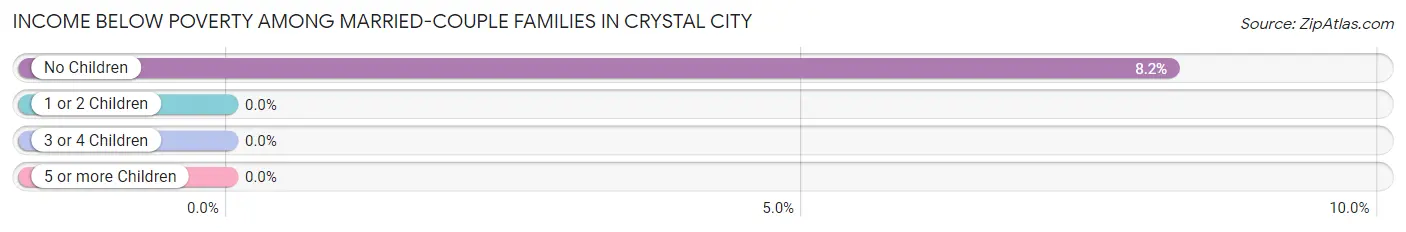
| Children | Above Poverty | Below Poverty |
| No Children | 516 (91.8%) | 46 (8.2%) |
| 1 or 2 Children | 286 (100.0%) | 0 (0.0%) |
| 3 or 4 Children | 103 (100.0%) | 0 (0.0%) |
| 5 or more Children | 0 (0.0%) | 0 (0.0%) |
| Total | 905 (95.2%) | 46 (4.8%) |
Income Below Poverty Among Single-Parent Households in Crystal City
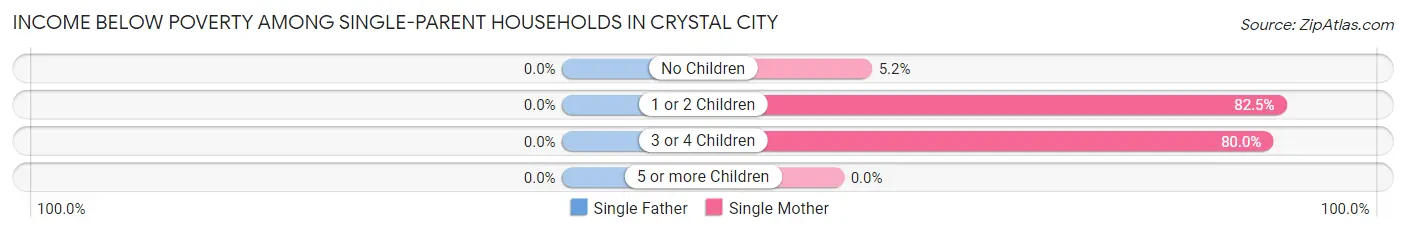
| Children | Single Father | Single Mother |
| No Children | 0 (0.0%) | 13 (5.2%) |
| 1 or 2 Children | 0 (0.0%) | 296 (82.5%) |
| 3 or 4 Children | 0 (0.0%) | 52 (80.0%) |
| 5 or more Children | 0 (0.0%) | 0 (0.0%) |
| Total | 0 (0.0%) | 361 (53.6%) |
Income Below Poverty Among Married-Couple vs Single-Parent Households in Crystal City
The poverty data for Crystal City shows that 46 of the married-couple family households (4.8%) and 361 of the single-parent households (37.8%) are living below the poverty level. Within the married-couple family households, those with no children have the highest poverty rate, with 46 households (8.2%) falling below the poverty line. Among the single-parent households, those with 1 or 2 children have the highest poverty rate, with 296 household (63.5%) living below poverty.
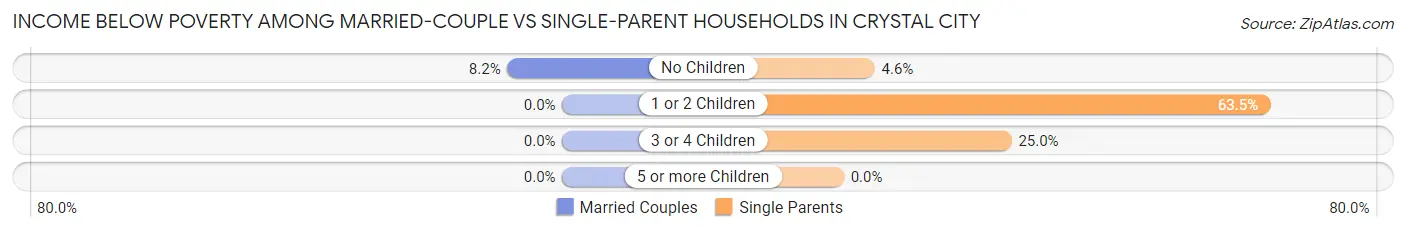
| Children | Married-Couple Families | Single-Parent Households |
| No Children | 46 (8.2%) | 13 (4.6%) |
| 1 or 2 Children | 0 (0.0%) | 296 (63.5%) |
| 3 or 4 Children | 0 (0.0%) | 52 (25.0%) |
| 5 or more Children | 0 (0.0%) | 0 (0.0%) |
| Total | 46 (4.8%) | 361 (37.8%) |
Employment Characteristics in Crystal City
Employment by Class of Employer in Crystal City
Among the 2,527 employed individuals in Crystal City, private company employees (1,422 | 56.3%), local government employees (379 | 15.0%), and self-employed (not incorporated) (260 | 10.3%) make up the most common classes of employment.
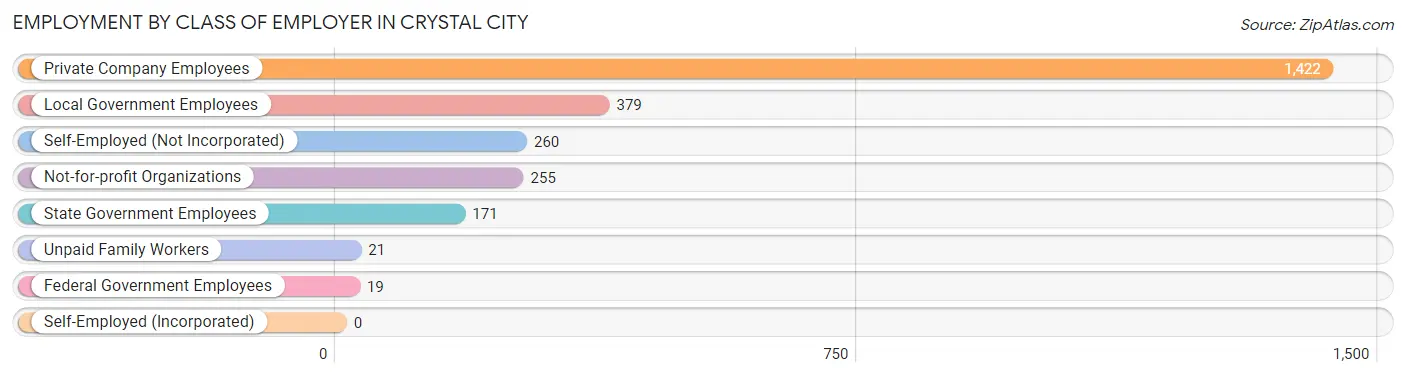
| Employer Class | # Employees | % Employees |
| Private Company Employees | 1,422 | 56.3% |
| Self-Employed (Incorporated) | 0 | 0.0% |
| Self-Employed (Not Incorporated) | 260 | 10.3% |
| Not-for-profit Organizations | 255 | 10.1% |
| Local Government Employees | 379 | 15.0% |
| State Government Employees | 171 | 6.8% |
| Federal Government Employees | 19 | 0.7% |
| Unpaid Family Workers | 21 | 0.8% |
| Total | 2,527 | 100.0% |
Employment Status by Age in Crystal City
According to the labor force statistics for Crystal City, out of the total population over 16 years of age (4,838), 55.4% or 2,680 individuals are in the labor force, with 4.7% or 126 of them unemployed. The age group with the highest labor force participation rate is 30 to 34 years, with 98.3% or 585 individuals in the labor force. Within the labor force, the 20 to 24 years age range has the highest percentage of unemployed individuals, with 31.6% or 114 of them being unemployed.
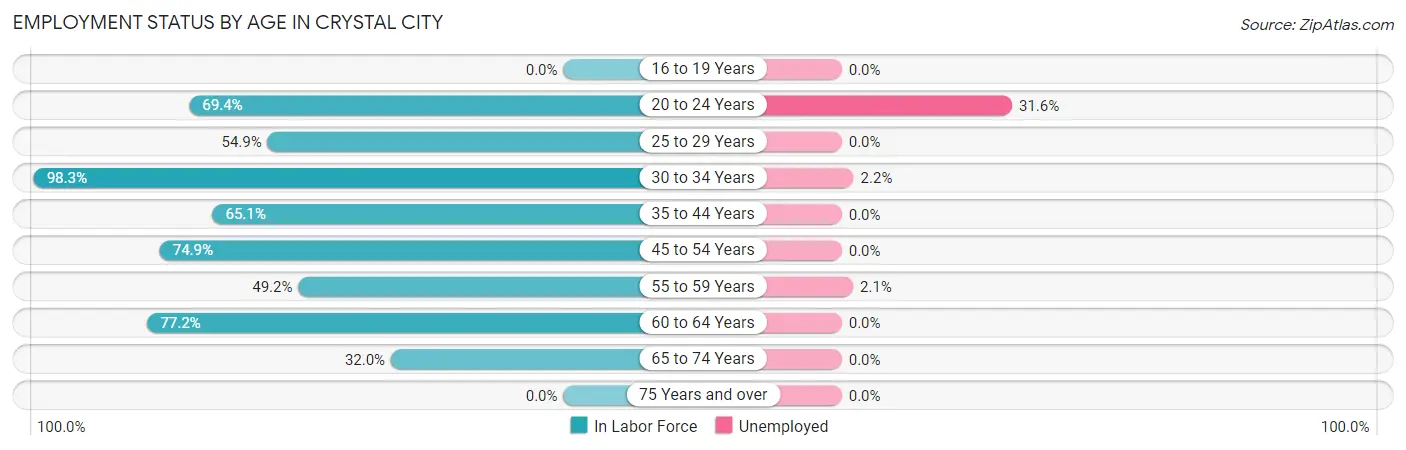
| Age Bracket | In Labor Force | Unemployed |
| 16 to 19 Years | 0 (0.0%) | 0 (0.0%) |
| 20 to 24 Years | 361 (69.4%) | 114 (31.6%) |
| 25 to 29 Years | 179 (54.9%) | 0 (0.0%) |
| 30 to 34 Years | 585 (98.3%) | 13 (2.2%) |
| 35 to 44 Years | 615 (65.1%) | 0 (0.0%) |
| 45 to 54 Years | 387 (74.9%) | 0 (0.0%) |
| 55 to 59 Years | 189 (49.2%) | 4 (2.1%) |
| 60 to 64 Years | 149 (77.2%) | 0 (0.0%) |
| 65 to 74 Years | 214 (32.0%) | 0 (0.0%) |
| 75 Years and over | 0 (0.0%) | 0 (0.0%) |
| Total | 2,680 (55.4%) | 126 (4.7%) |
Employment Status by Educational Attainment in Crystal City
According to labor force statistics for Crystal City, 71.1% of individuals (2,105) out of the total population between 25 and 64 years of age (2,960) are in the labor force, with 0.8% or 17 of them being unemployed. The group with the highest labor force participation rate are those with the educational attainment of bachelor's degree or higher, with 100.0% or 490 individuals in the labor force. Within the labor force, individuals with high school diploma education have the highest percentage of unemployment, with 2.1% or 11 of them being unemployed.
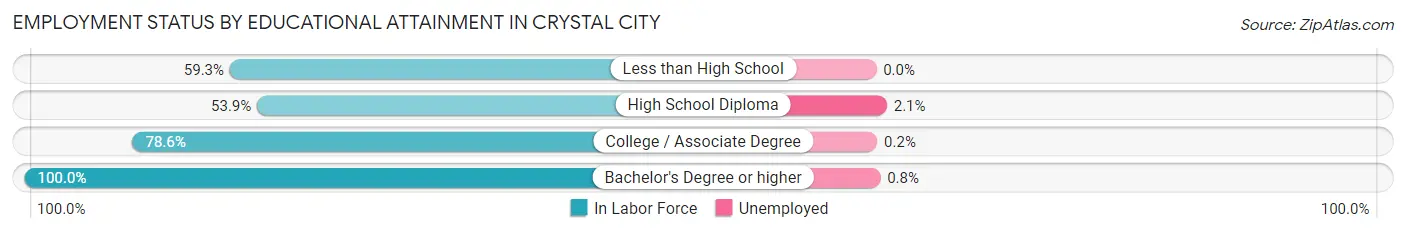
| Educational Attainment | In Labor Force | Unemployed |
| Less than High School | 277 (59.3%) | 0 (0.0%) |
| High School Diploma | 520 (53.9%) | 20 (2.1%) |
| College / Associate Degree | 817 (78.6%) | 2 (0.2%) |
| Bachelor's Degree or higher | 490 (100.0%) | 4 (0.8%) |
| Total | 2,105 (71.1%) | 24 (0.8%) |
Employment Occupations by Sex in Crystal City
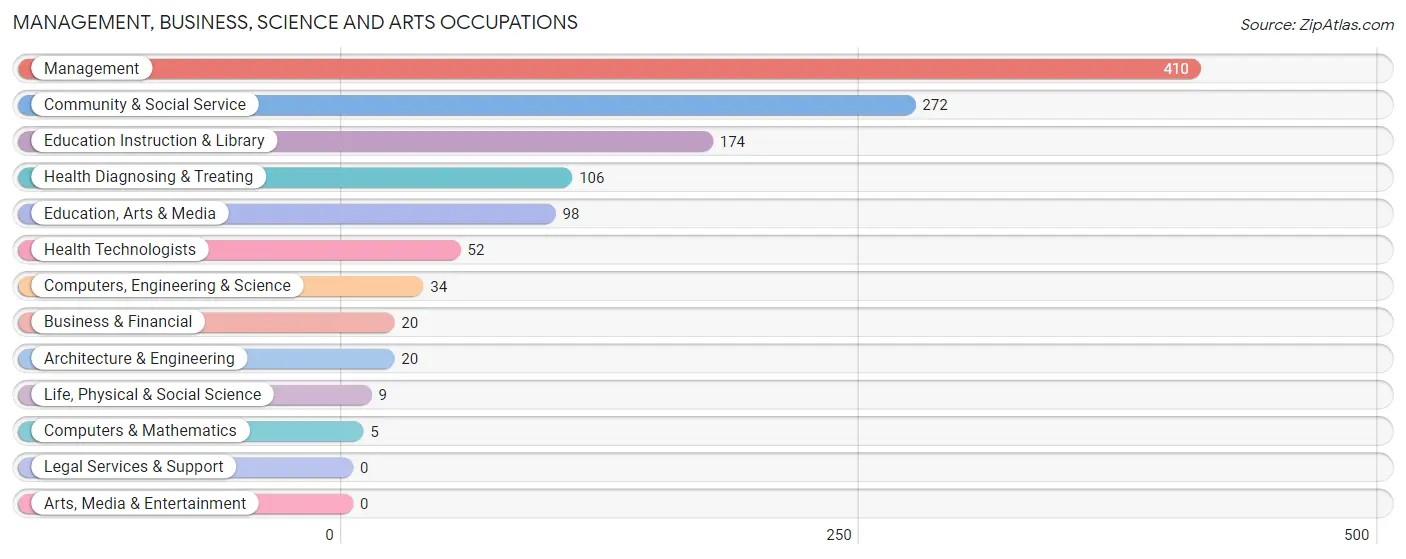
Management, Business, Science and Arts Occupations
The most common Management, Business, Science and Arts occupations in Crystal City are Management (410 | 16.2%), Community & Social Service (272 | 10.7%), Education Instruction & Library (174 | 6.9%), Health Diagnosing & Treating (106 | 4.2%), and Education, Arts & Media (98 | 3.9%).
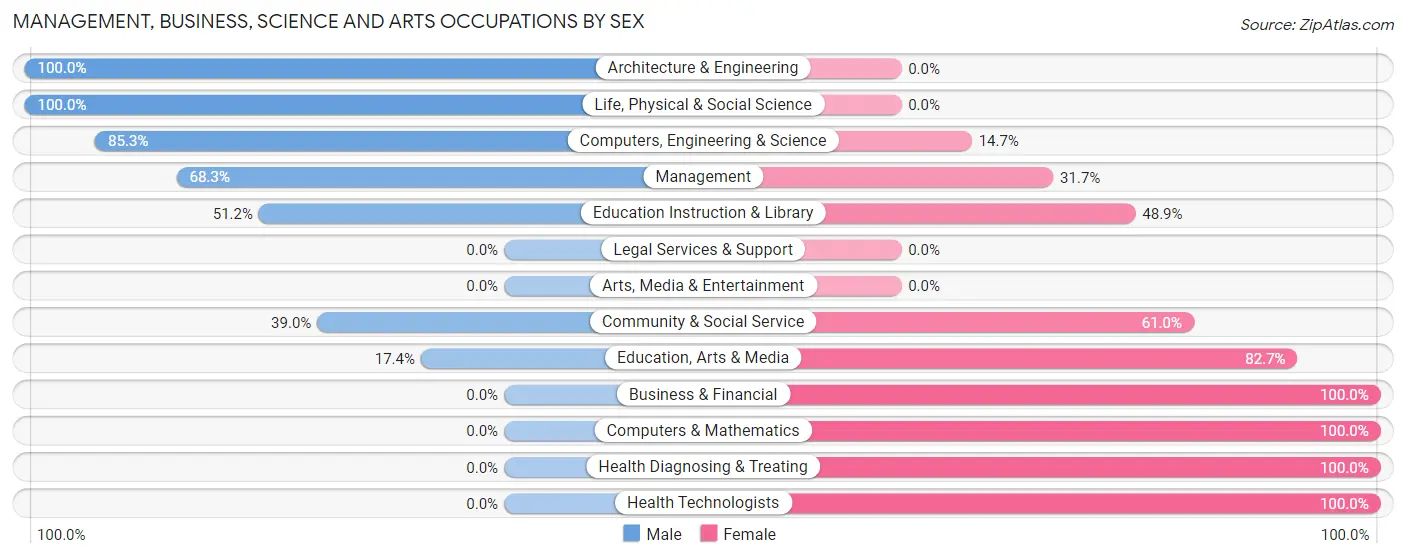
Management, Business, Science and Arts Occupations by Sex
Within the Management, Business, Science and Arts occupations in Crystal City, the most male-oriented occupations are Architecture & Engineering (100.0%), Life, Physical & Social Science (100.0%), and Computers, Engineering & Science (85.3%), while the most female-oriented occupations are Business & Financial (100.0%), Computers & Mathematics (100.0%), and Health Diagnosing & Treating (100.0%).
| Occupation | Male | Female |
| Management | 280 (68.3%) | 130 (31.7%) |
| Business & Financial | 0 (0.0%) | 20 (100.0%) |
| Computers, Engineering & Science | 29 (85.3%) | 5 (14.7%) |
| Computers & Mathematics | 0 (0.0%) | 5 (100.0%) |
| Architecture & Engineering | 20 (100.0%) | 0 (0.0%) |
| Life, Physical & Social Science | 9 (100.0%) | 0 (0.0%) |
| Community & Social Service | 106 (39.0%) | 166 (61.0%) |
| Education, Arts & Media | 17 (17.3%) | 81 (82.7%) |
| Legal Services & Support | 0 (0.0%) | 0 (0.0%) |
| Education Instruction & Library | 89 (51.1%) | 85 (48.8%) |
| Arts, Media & Entertainment | 0 (0.0%) | 0 (0.0%) |
| Health Diagnosing & Treating | 0 (0.0%) | 106 (100.0%) |
| Health Technologists | 0 (0.0%) | 52 (100.0%) |
| Total (Category) | 415 (49.3%) | 427 (50.7%) |
| Total (Overall) | 1,481 (58.4%) | 1,054 (41.6%) |
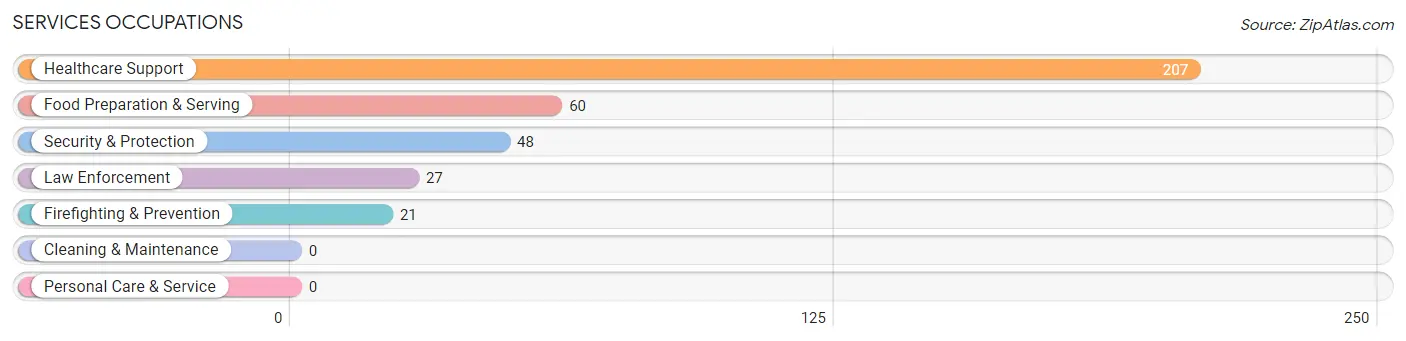
Services Occupations
The most common Services occupations in Crystal City are Healthcare Support (207 | 8.2%), Food Preparation & Serving (60 | 2.4%), Security & Protection (48 | 1.9%), Law Enforcement (27 | 1.1%), and Firefighting & Prevention (21 | 0.8%).
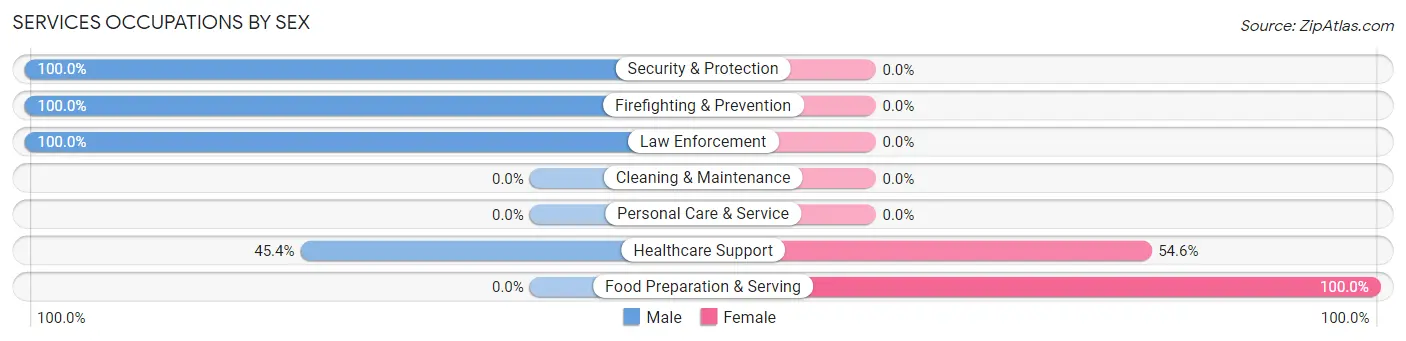
Services Occupations by Sex
Within the Services occupations in Crystal City, the most male-oriented occupations are Security & Protection (100.0%), Firefighting & Prevention (100.0%), and Law Enforcement (100.0%), while the most female-oriented occupations are Food Preparation & Serving (100.0%), and Healthcare Support (54.6%).
| Occupation | Male | Female |
| Healthcare Support | 94 (45.4%) | 113 (54.6%) |
| Security & Protection | 48 (100.0%) | 0 (0.0%) |
| Firefighting & Prevention | 21 (100.0%) | 0 (0.0%) |
| Law Enforcement | 27 (100.0%) | 0 (0.0%) |
| Food Preparation & Serving | 0 (0.0%) | 60 (100.0%) |
| Cleaning & Maintenance | 0 (0.0%) | 0 (0.0%) |
| Personal Care & Service | 0 (0.0%) | 0 (0.0%) |
| Total (Category) | 142 (45.1%) | 173 (54.9%) |
| Total (Overall) | 1,481 (58.4%) | 1,054 (41.6%) |
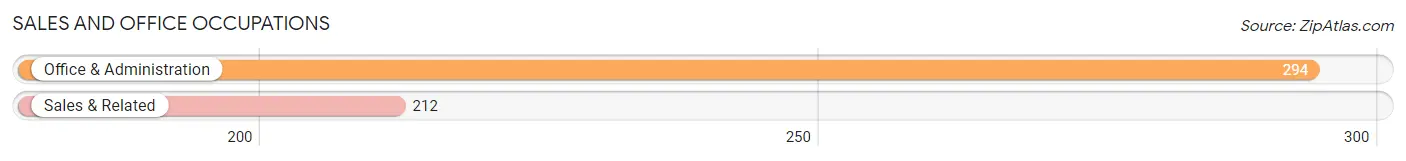
Sales and Office Occupations
The most common Sales and Office occupations in Crystal City are Office & Administration (294 | 11.6%), and Sales & Related (212 | 8.4%).
Sales and Office Occupations by Sex
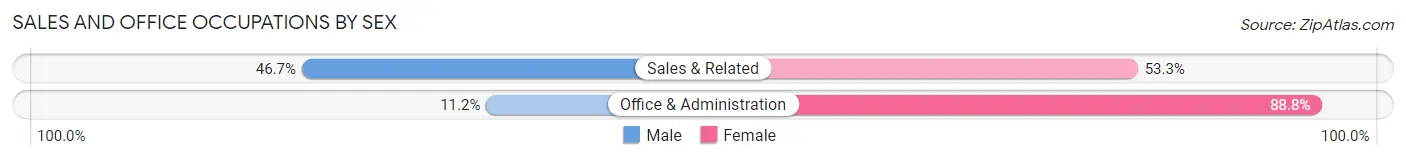
| Occupation | Male | Female |
| Sales & Related | 99 (46.7%) | 113 (53.3%) |
| Office & Administration | 33 (11.2%) | 261 (88.8%) |
| Total (Category) | 132 (26.1%) | 374 (73.9%) |
| Total (Overall) | 1,481 (58.4%) | 1,054 (41.6%) |
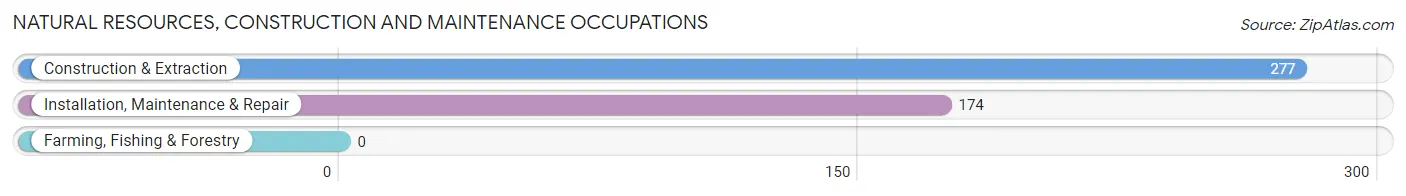
Natural Resources, Construction and Maintenance Occupations
The most common Natural Resources, Construction and Maintenance occupations in Crystal City are Construction & Extraction (277 | 10.9%), and Installation, Maintenance & Repair (174 | 6.9%).
Natural Resources, Construction and Maintenance Occupations by Sex
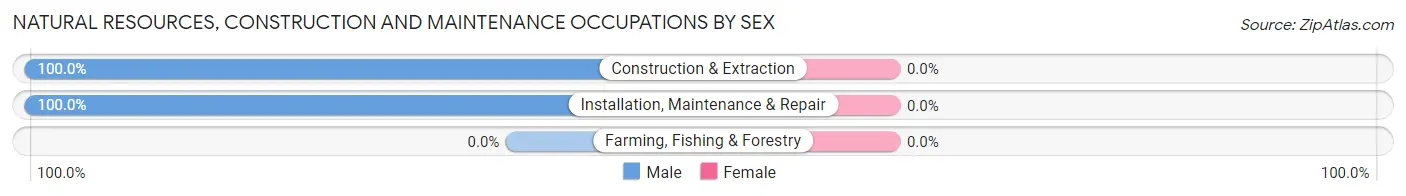
| Occupation | Male | Female |
| Farming, Fishing & Forestry | 0 (0.0%) | 0 (0.0%) |
| Construction & Extraction | 277 (100.0%) | 0 (0.0%) |
| Installation, Maintenance & Repair | 174 (100.0%) | 0 (0.0%) |
| Total (Category) | 451 (100.0%) | 0 (0.0%) |
| Total (Overall) | 1,481 (58.4%) | 1,054 (41.6%) |
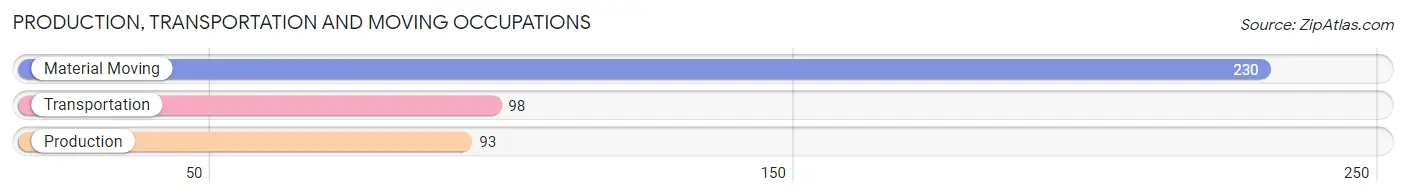
Production, Transportation and Moving Occupations
The most common Production, Transportation and Moving occupations in Crystal City are Material Moving (230 | 9.1%), Transportation (98 | 3.9%), and Production (93 | 3.7%).
Production, Transportation and Moving Occupations by Sex
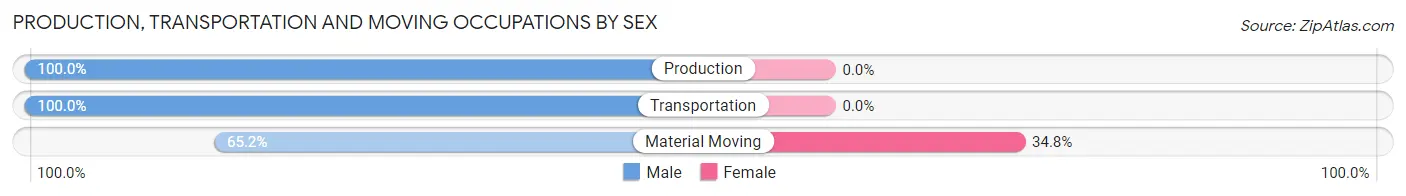
| Occupation | Male | Female |
| Production | 93 (100.0%) | 0 (0.0%) |
| Transportation | 98 (100.0%) | 0 (0.0%) |
| Material Moving | 150 (65.2%) | 80 (34.8%) |
| Total (Category) | 341 (81.0%) | 80 (19.0%) |
| Total (Overall) | 1,481 (58.4%) | 1,054 (41.6%) |
Employment Industries by Sex in Crystal City
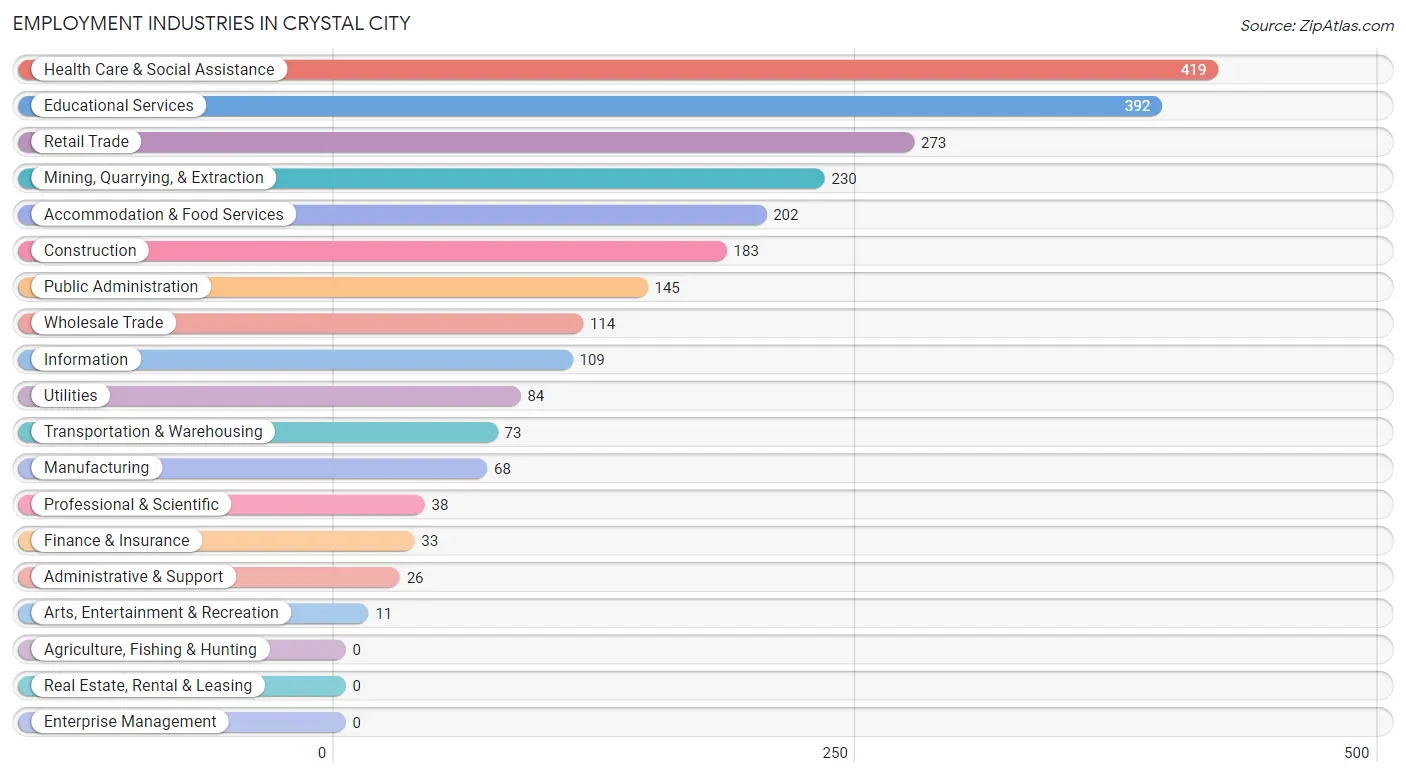
Employment Industries in Crystal City
The major employment industries in Crystal City include Health Care & Social Assistance (419 | 16.5%), Educational Services (392 | 15.5%), Retail Trade (273 | 10.8%), Mining, Quarrying, & Extraction (230 | 9.1%), and Accommodation & Food Services (202 | 8.0%).
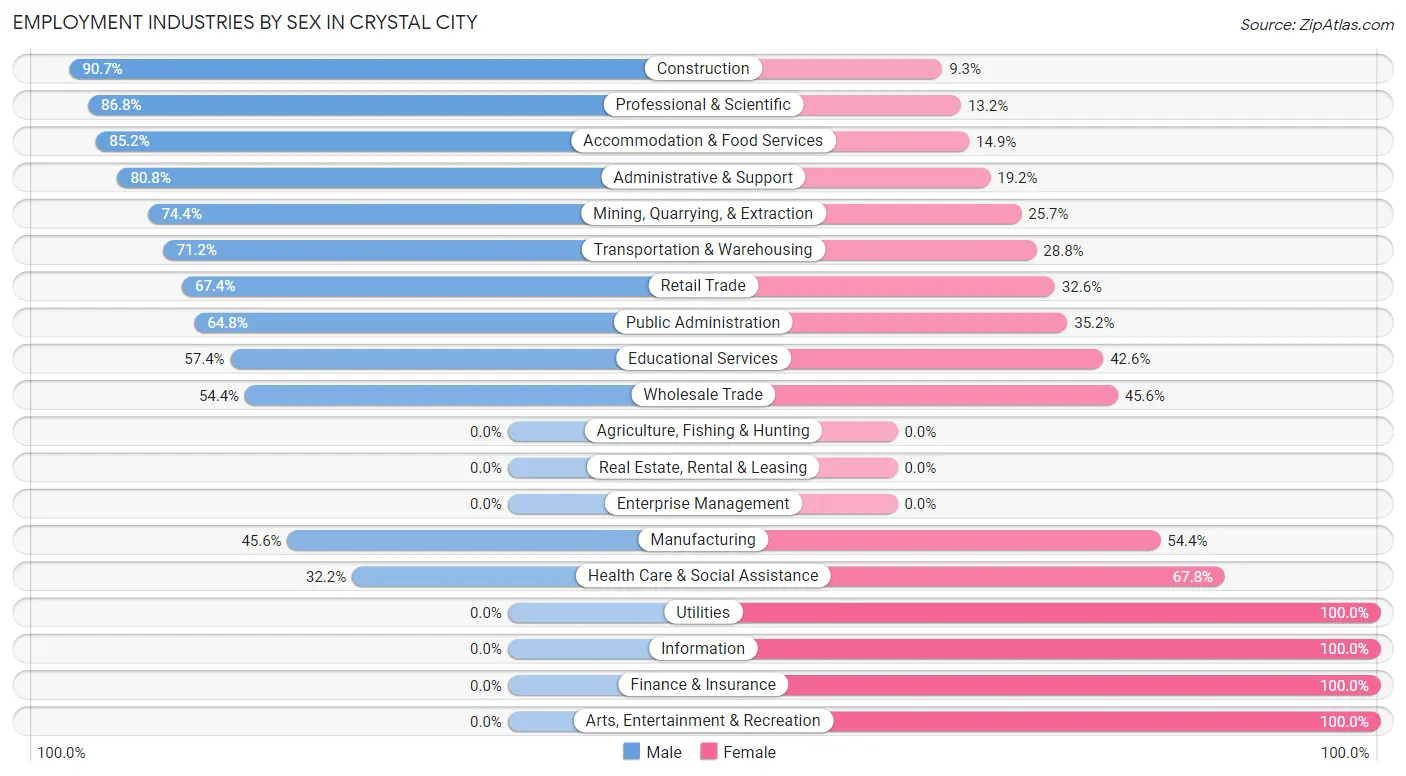
Employment Industries by Sex in Crystal City
The Crystal City industries that see more men than women are Construction (90.7%), Professional & Scientific (86.8%), and Accommodation & Food Services (85.2%), whereas the industries that tend to have a higher number of women are Utilities (100.0%), Information (100.0%), and Finance & Insurance (100.0%).
| Industry | Male | Female |
| Agriculture, Fishing & Hunting | 0 (0.0%) | 0 (0.0%) |
| Mining, Quarrying, & Extraction | 171 (74.4%) | 59 (25.7%) |
| Construction | 166 (90.7%) | 17 (9.3%) |
| Manufacturing | 31 (45.6%) | 37 (54.4%) |
| Wholesale Trade | 62 (54.4%) | 52 (45.6%) |
| Retail Trade | 184 (67.4%) | 89 (32.6%) |
| Transportation & Warehousing | 52 (71.2%) | 21 (28.8%) |
| Utilities | 0 (0.0%) | 84 (100.0%) |
| Information | 0 (0.0%) | 109 (100.0%) |
| Finance & Insurance | 0 (0.0%) | 33 (100.0%) |
| Real Estate, Rental & Leasing | 0 (0.0%) | 0 (0.0%) |
| Professional & Scientific | 33 (86.8%) | 5 (13.2%) |
| Enterprise Management | 0 (0.0%) | 0 (0.0%) |
| Administrative & Support | 21 (80.8%) | 5 (19.2%) |
| Educational Services | 225 (57.4%) | 167 (42.6%) |
| Health Care & Social Assistance | 135 (32.2%) | 284 (67.8%) |
| Arts, Entertainment & Recreation | 0 (0.0%) | 11 (100.0%) |
| Accommodation & Food Services | 172 (85.2%) | 30 (14.8%) |
| Public Administration | 94 (64.8%) | 51 (35.2%) |
| Total | 1,481 (58.4%) | 1,054 (41.6%) |
Education in Crystal City
School Enrollment in Crystal City
The most common levels of schooling among the 1,614 students in Crystal City are high school (650 | 40.3%), elementary school (414 | 25.7%), and middle school (284 | 17.6%).
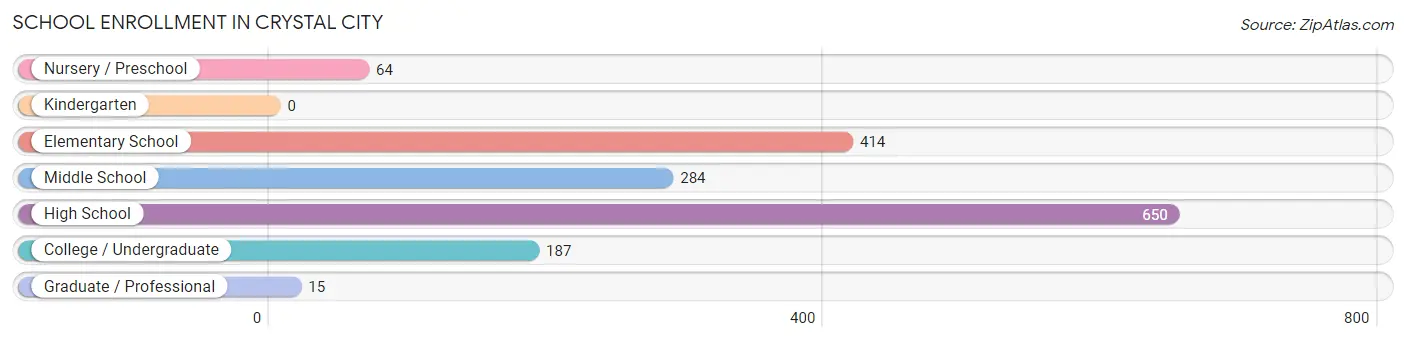
| School Level | # Students | % Students |
| Nursery / Preschool | 64 | 4.0% |
| Kindergarten | 0 | 0.0% |
| Elementary School | 414 | 25.7% |
| Middle School | 284 | 17.6% |
| High School | 650 | 40.3% |
| College / Undergraduate | 187 | 11.6% |
| Graduate / Professional | 15 | 0.9% |
| Total | 1,614 | 100.0% |
School Enrollment by Age by Funding Source in Crystal City
Out of a total of 1,614 students who are enrolled in schools in Crystal City, 69 (4.3%) attend a private institution, while the remaining 1,545 (95.7%) are enrolled in public schools. The age group of 5 to 9 year old has the highest likelihood of being enrolled in private schools, with 69 (17.1% in the age bracket) enrolled. Conversely, the age group of 3 to 4 year olds has the lowest likelihood of being enrolled in a private school, with 57 (100.0% in the age bracket) attending a public institution.
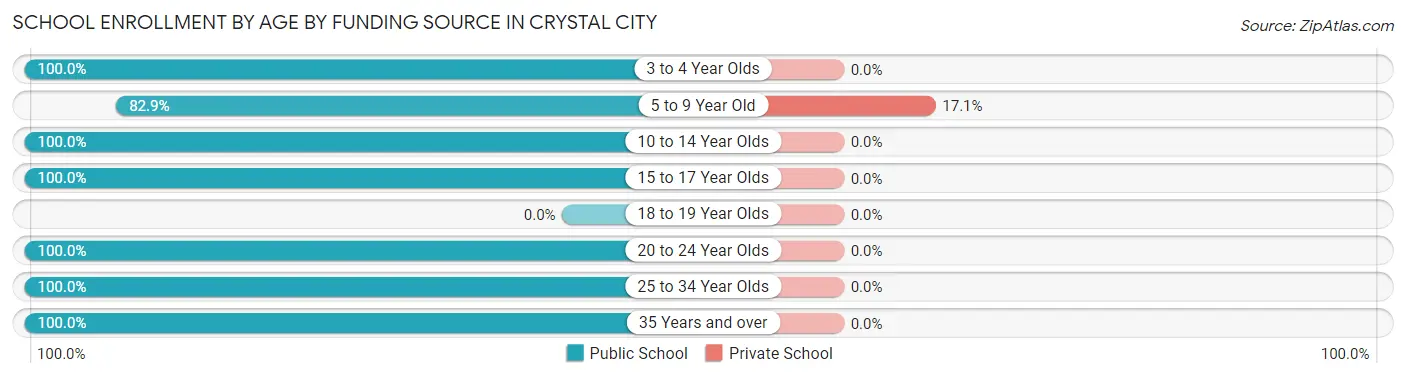
| Age Bracket | Public School | Private School |
| 3 to 4 Year Olds | 57 (100.0%) | 0 (0.0%) |
| 5 to 9 Year Old | 335 (82.9%) | 69 (17.1%) |
| 10 to 14 Year Olds | 530 (100.0%) | 0 (0.0%) |
| 15 to 17 Year Olds | 421 (100.0%) | 0 (0.0%) |
| 18 to 19 Year Olds | 0 (0.0%) | 0 (0.0%) |
| 20 to 24 Year Olds | 140 (100.0%) | 0 (0.0%) |
| 25 to 34 Year Olds | 39 (100.0%) | 0 (0.0%) |
| 35 Years and over | 23 (100.0%) | 0 (0.0%) |
| Total | 1,545 (95.7%) | 69 (4.3%) |
Educational Attainment by Field of Study in Crystal City
Education (191 | 34.1%), computers & mathematics (98 | 17.5%), science & technology (92 | 16.4%), business (50 | 8.9%), and social sciences (43 | 7.7%) are the most common fields of study among 560 individuals in Crystal City who have obtained a bachelor's degree or higher.
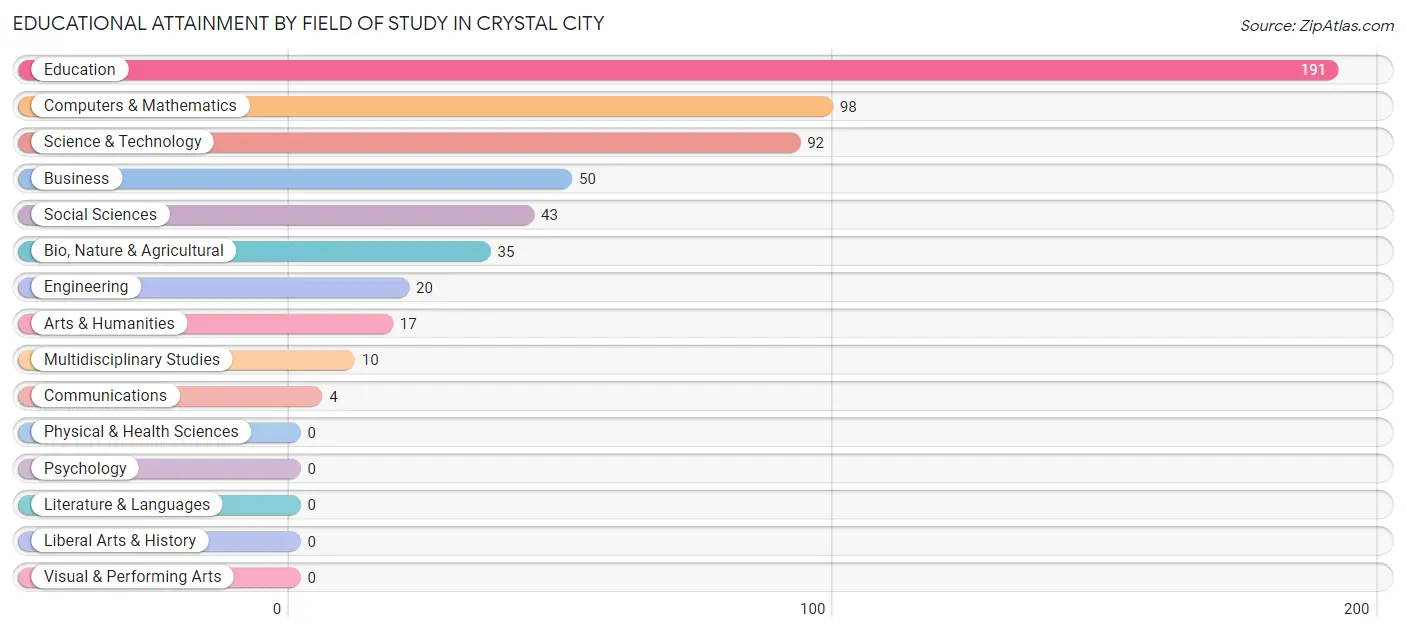
| Field of Study | # Graduates | % Graduates |
| Computers & Mathematics | 98 | 17.5% |
| Bio, Nature & Agricultural | 35 | 6.2% |
| Physical & Health Sciences | 0 | 0.0% |
| Psychology | 0 | 0.0% |
| Social Sciences | 43 | 7.7% |
| Engineering | 20 | 3.6% |
| Multidisciplinary Studies | 10 | 1.8% |
| Science & Technology | 92 | 16.4% |
| Business | 50 | 8.9% |
| Education | 191 | 34.1% |
| Literature & Languages | 0 | 0.0% |
| Liberal Arts & History | 0 | 0.0% |
| Visual & Performing Arts | 0 | 0.0% |
| Communications | 4 | 0.7% |
| Arts & Humanities | 17 | 3.0% |
| Total | 560 | 100.0% |
Transportation & Commute in Crystal City
Vehicle Availability by Sex in Crystal City
The most prevalent vehicle ownership categories in Crystal City are males with 2 vehicles (526, accounting for 35.7%) and females with 2 vehicles (367, making up 49.9%).
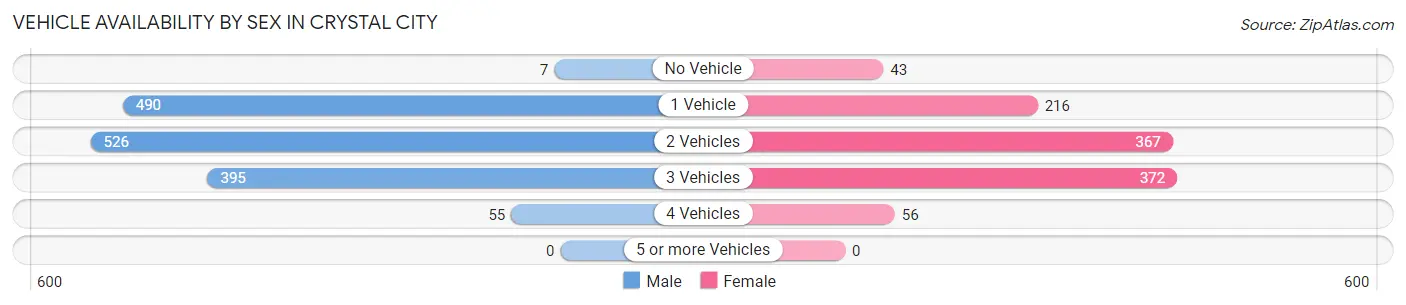
| Vehicles Available | Male | Female |
| No Vehicle | 7 (0.5%) | 43 (4.1%) |
| 1 Vehicle | 490 (33.3%) | 216 (20.5%) |
| 2 Vehicles | 526 (35.7%) | 367 (34.8%) |
| 3 Vehicles | 395 (26.8%) | 372 (35.3%) |
| 4 Vehicles | 55 (3.7%) | 56 (5.3%) |
| 5 or more Vehicles | 0 (0.0%) | 0 (0.0%) |
| Total | 1,473 (100.0%) | 1,054 (100.0%) |
Commute Time in Crystal City
The most frequently occuring commute durations in Crystal City are 5 to 9 minutes (560 commuters, 22.7%), 10 to 14 minutes (445 commuters, 18.0%), and 15 to 19 minutes (390 commuters, 15.8%).
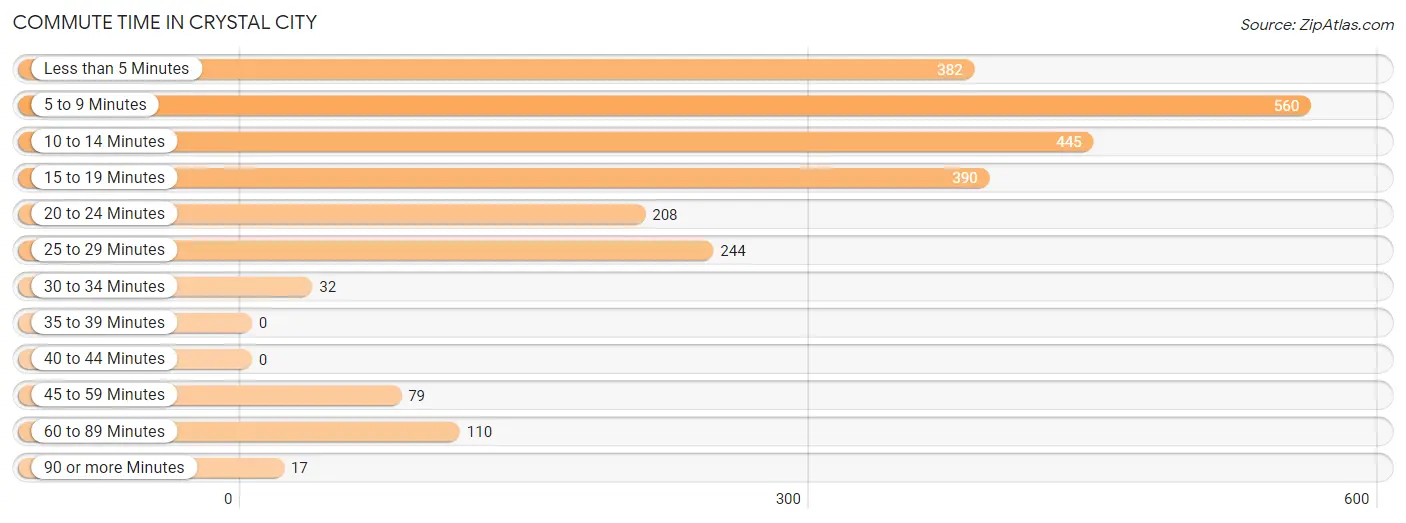
| Commute Time | # Commuters | % Commuters |
| Less than 5 Minutes | 382 | 15.5% |
| 5 to 9 Minutes | 560 | 22.7% |
| 10 to 14 Minutes | 445 | 18.0% |
| 15 to 19 Minutes | 390 | 15.8% |
| 20 to 24 Minutes | 208 | 8.4% |
| 25 to 29 Minutes | 244 | 9.9% |
| 30 to 34 Minutes | 32 | 1.3% |
| 35 to 39 Minutes | 0 | 0.0% |
| 40 to 44 Minutes | 0 | 0.0% |
| 45 to 59 Minutes | 79 | 3.2% |
| 60 to 89 Minutes | 110 | 4.5% |
| 90 or more Minutes | 17 | 0.7% |
Commute Time by Sex in Crystal City
The most common commute times in Crystal City are 10 to 14 minutes (299 commuters, 20.6%) for males and 5 to 9 minutes (341 commuters, 33.7%) for females.
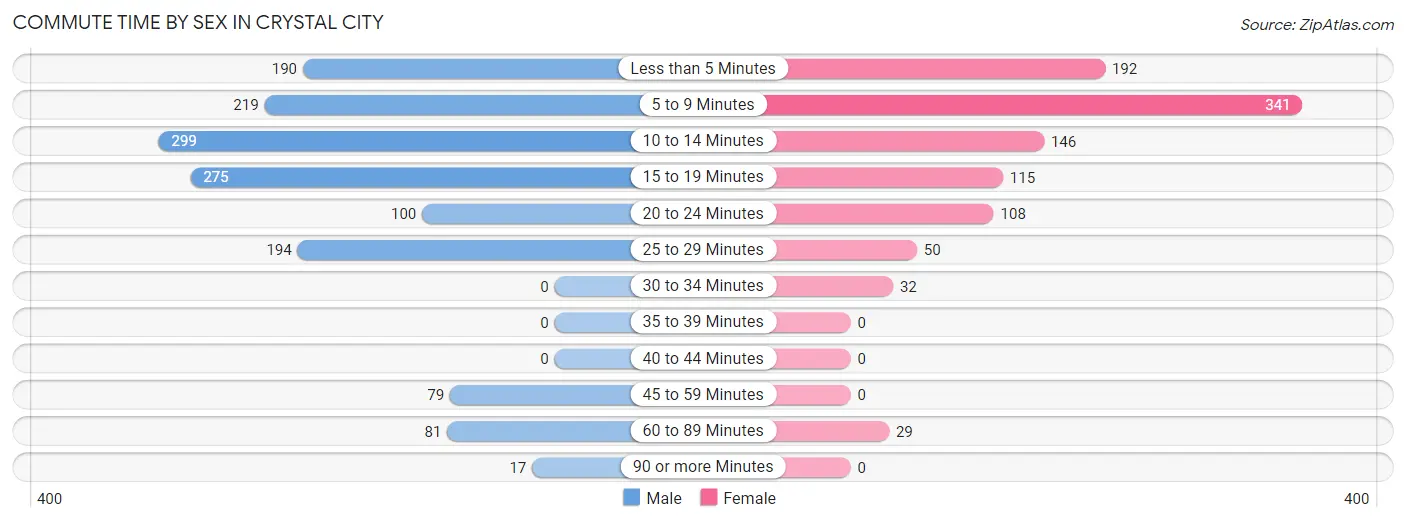
| Commute Time | Male | Female |
| Less than 5 Minutes | 190 (13.1%) | 192 (19.0%) |
| 5 to 9 Minutes | 219 (15.1%) | 341 (33.7%) |
| 10 to 14 Minutes | 299 (20.6%) | 146 (14.4%) |
| 15 to 19 Minutes | 275 (18.9%) | 115 (11.4%) |
| 20 to 24 Minutes | 100 (6.9%) | 108 (10.7%) |
| 25 to 29 Minutes | 194 (13.3%) | 50 (4.9%) |
| 30 to 34 Minutes | 0 (0.0%) | 32 (3.2%) |
| 35 to 39 Minutes | 0 (0.0%) | 0 (0.0%) |
| 40 to 44 Minutes | 0 (0.0%) | 0 (0.0%) |
| 45 to 59 Minutes | 79 (5.4%) | 0 (0.0%) |
| 60 to 89 Minutes | 81 (5.6%) | 29 (2.9%) |
| 90 or more Minutes | 17 (1.2%) | 0 (0.0%) |
Time of Departure to Work by Sex in Crystal City
The most frequent times of departure to work in Crystal City are 7:30 AM to 7:59 AM (406, 27.9%) for males and 8:00 AM to 8:29 AM (296, 29.2%) for females.
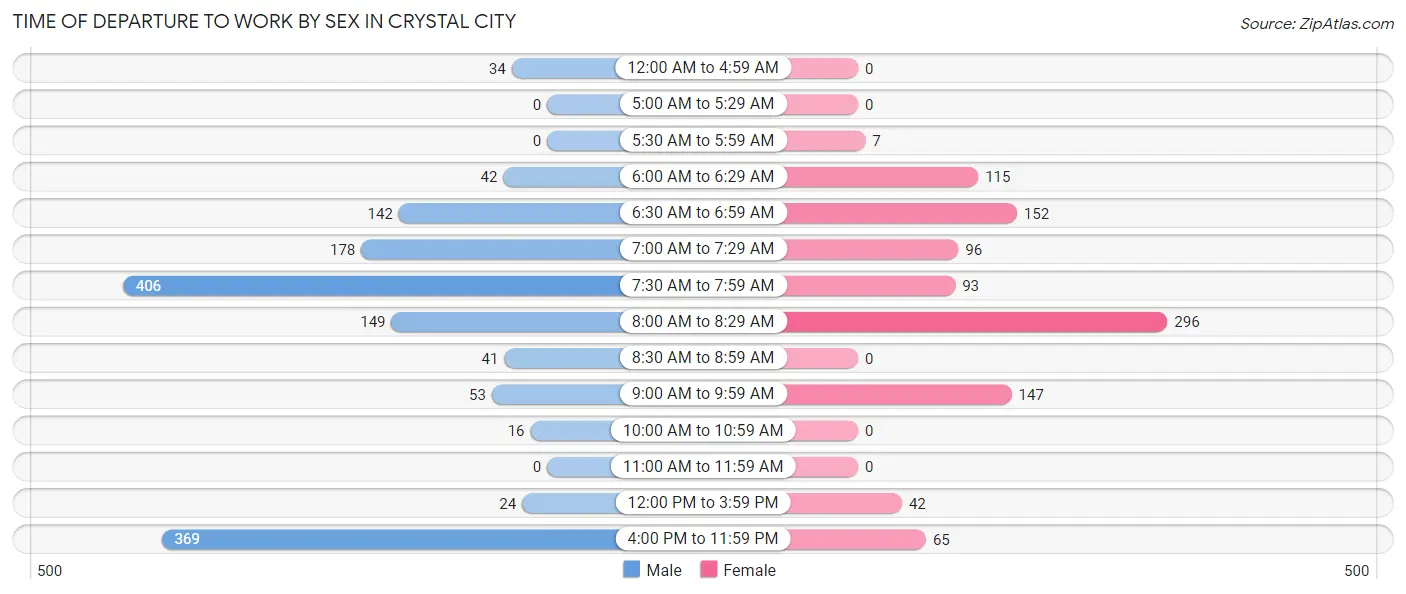
| Time of Departure | Male | Female |
| 12:00 AM to 4:59 AM | 34 (2.3%) | 0 (0.0%) |
| 5:00 AM to 5:29 AM | 0 (0.0%) | 0 (0.0%) |
| 5:30 AM to 5:59 AM | 0 (0.0%) | 7 (0.7%) |
| 6:00 AM to 6:29 AM | 42 (2.9%) | 115 (11.4%) |
| 6:30 AM to 6:59 AM | 142 (9.8%) | 152 (15.0%) |
| 7:00 AM to 7:29 AM | 178 (12.2%) | 96 (9.5%) |
| 7:30 AM to 7:59 AM | 406 (27.9%) | 93 (9.2%) |
| 8:00 AM to 8:29 AM | 149 (10.2%) | 296 (29.2%) |
| 8:30 AM to 8:59 AM | 41 (2.8%) | 0 (0.0%) |
| 9:00 AM to 9:59 AM | 53 (3.6%) | 147 (14.5%) |
| 10:00 AM to 10:59 AM | 16 (1.1%) | 0 (0.0%) |
| 11:00 AM to 11:59 AM | 0 (0.0%) | 0 (0.0%) |
| 12:00 PM to 3:59 PM | 24 (1.7%) | 42 (4.2%) |
| 4:00 PM to 11:59 PM | 369 (25.4%) | 65 (6.4%) |
| Total | 1,454 (100.0%) | 1,013 (100.0%) |
Housing Occupancy in Crystal City
Occupancy by Ownership in Crystal City
Of the total 2,366 dwellings in Crystal City, owner-occupied units account for 1,619 (68.4%), while renter-occupied units make up 747 (31.6%).
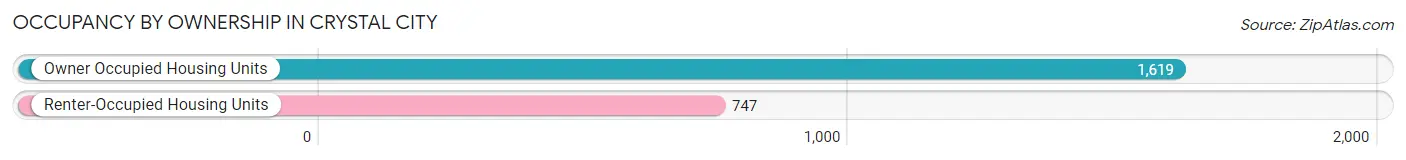
| Occupancy | # Housing Units | % Housing Units |
| Owner Occupied Housing Units | 1,619 | 68.4% |
| Renter-Occupied Housing Units | 747 | 31.6% |
| Total Occupied Housing Units | 2,366 | 100.0% |
Occupancy by Household Size in Crystal City
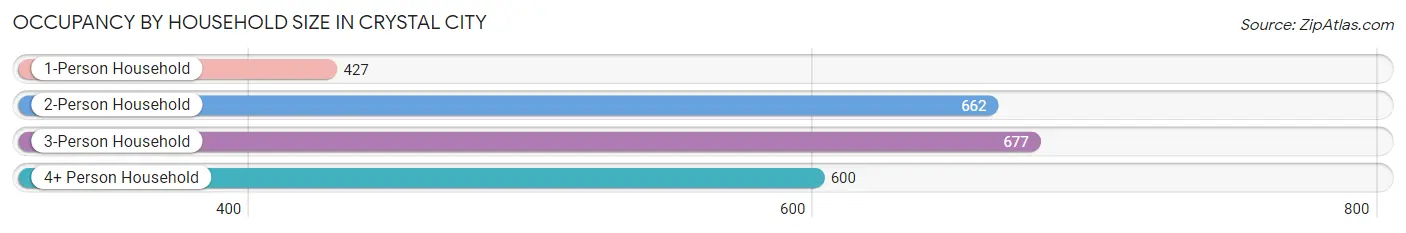
| Household Size | # Housing Units | % Housing Units |
| 1-Person Household | 427 | 18.0% |
| 2-Person Household | 662 | 28.0% |
| 3-Person Household | 677 | 28.6% |
| 4+ Person Household | 600 | 25.4% |
| Total Housing Units | 2,366 | 100.0% |
Occupancy by Ownership by Household Size in Crystal City
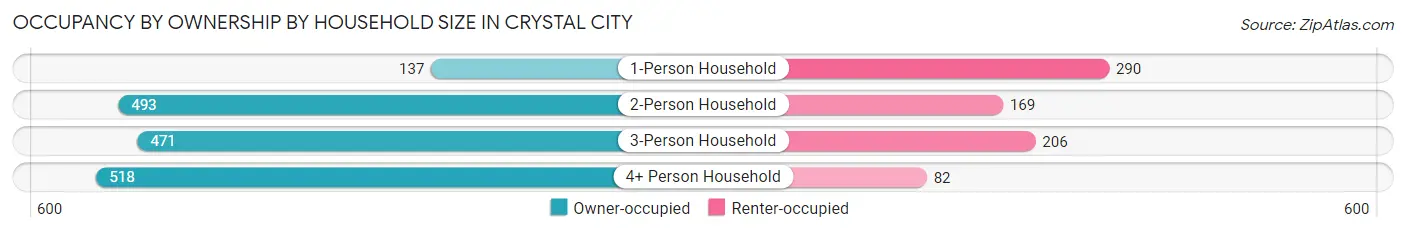
| Household Size | Owner-occupied | Renter-occupied |
| 1-Person Household | 137 (32.1%) | 290 (67.9%) |
| 2-Person Household | 493 (74.5%) | 169 (25.5%) |
| 3-Person Household | 471 (69.6%) | 206 (30.4%) |
| 4+ Person Household | 518 (86.3%) | 82 (13.7%) |
| Total Housing Units | 1,619 (68.4%) | 747 (31.6%) |
Occupancy by Educational Attainment in Crystal City
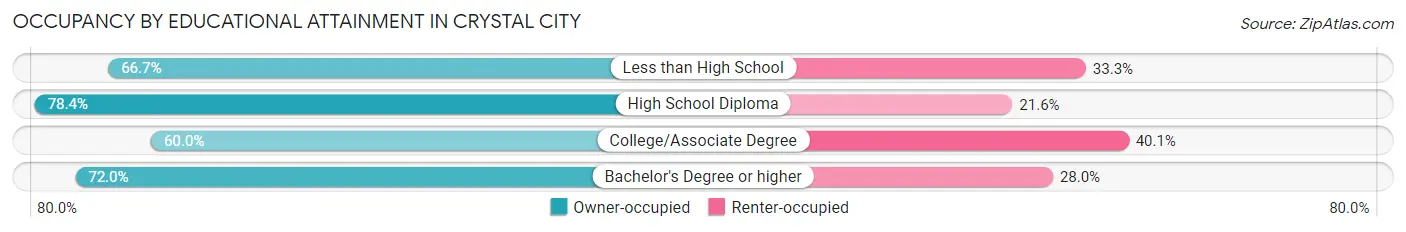
| Household Size | Owner-occupied | Renter-occupied |
| Less than High School | 339 (66.7%) | 169 (33.3%) |
| High School Diploma | 555 (78.4%) | 153 (21.6%) |
| College/Associate Degree | 512 (60.0%) | 342 (40.1%) |
| Bachelor's Degree or higher | 213 (72.0%) | 83 (28.0%) |
Occupancy by Age of Householder in Crystal City
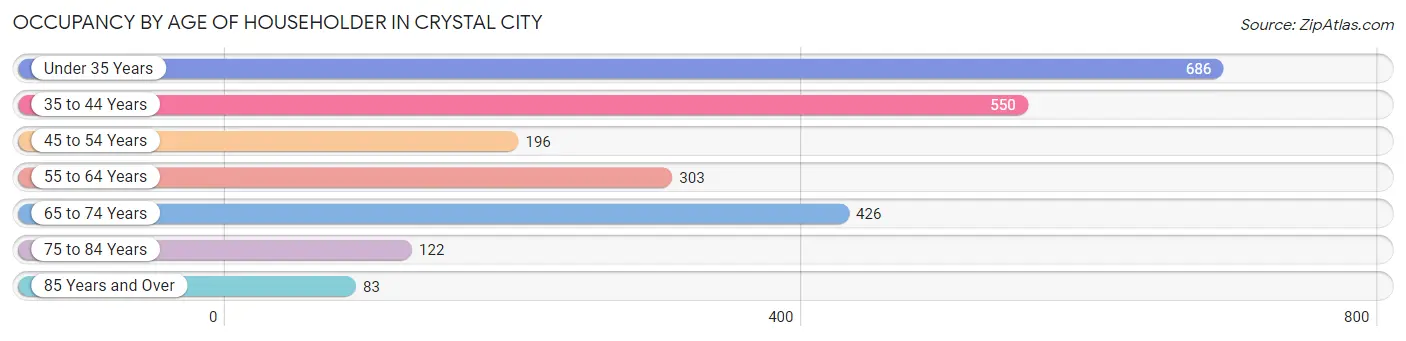
| Age Bracket | # Households | % Households |
| Under 35 Years | 686 | 29.0% |
| 35 to 44 Years | 550 | 23.3% |
| 45 to 54 Years | 196 | 8.3% |
| 55 to 64 Years | 303 | 12.8% |
| 65 to 74 Years | 426 | 18.0% |
| 75 to 84 Years | 122 | 5.2% |
| 85 Years and Over | 83 | 3.5% |
| Total | 2,366 | 100.0% |
Housing Finances in Crystal City
Median Income by Occupancy in Crystal City
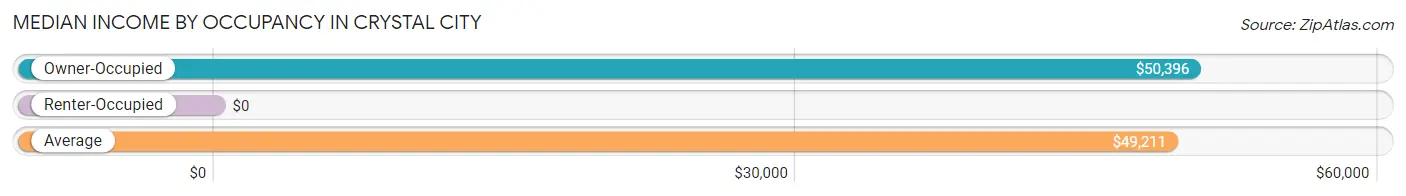
| Occupancy Type | # Households | Median Income |
| Owner-Occupied | 1,619 (68.4%) | $50,396 |
| Renter-Occupied | 747 (31.6%) | $0 |
| Average | 2,366 (100.0%) | $49,211 |
Occupancy by Householder Income Bracket in Crystal City
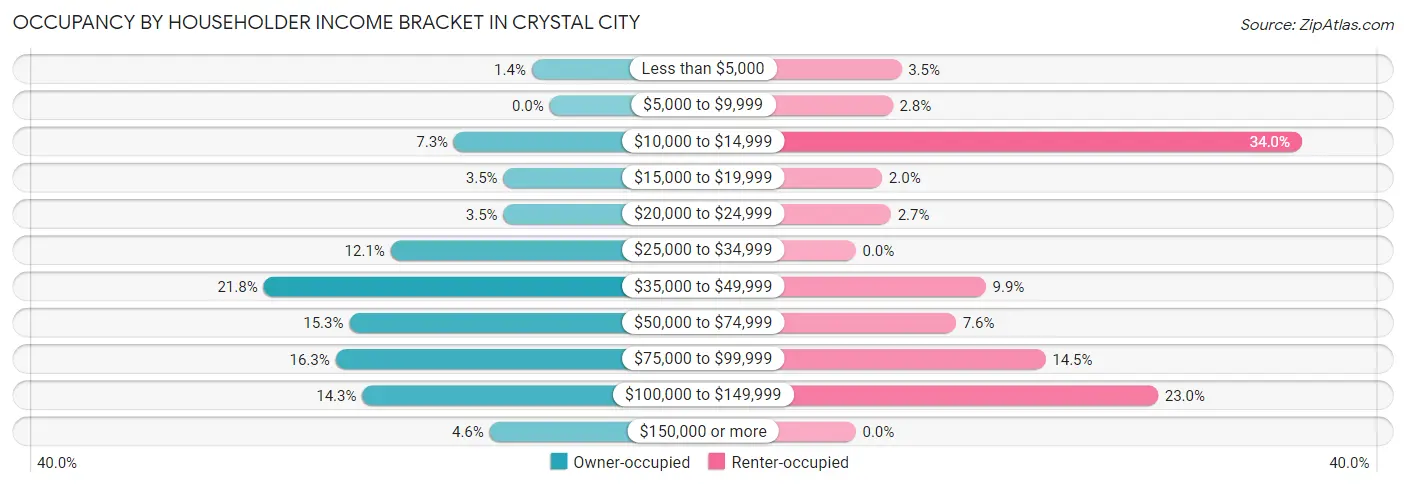
| Income Bracket | Owner-occupied | Renter-occupied |
| Less than $5,000 | 22 (1.4%) | 26 (3.5%) |
| $5,000 to $9,999 | 0 (0.0%) | 21 (2.8%) |
| $10,000 to $14,999 | 118 (7.3%) | 254 (34.0%) |
| $15,000 to $19,999 | 57 (3.5%) | 15 (2.0%) |
| $20,000 to $24,999 | 57 (3.5%) | 20 (2.7%) |
| $25,000 to $34,999 | 196 (12.1%) | 0 (0.0%) |
| $35,000 to $49,999 | 353 (21.8%) | 74 (9.9%) |
| $50,000 to $74,999 | 247 (15.3%) | 57 (7.6%) |
| $75,000 to $99,999 | 264 (16.3%) | 108 (14.5%) |
| $100,000 to $149,999 | 231 (14.3%) | 172 (23.0%) |
| $150,000 or more | 74 (4.6%) | 0 (0.0%) |
| Total | 1,619 (100.0%) | 747 (100.0%) |
Monthly Housing Cost Tiers in Crystal City
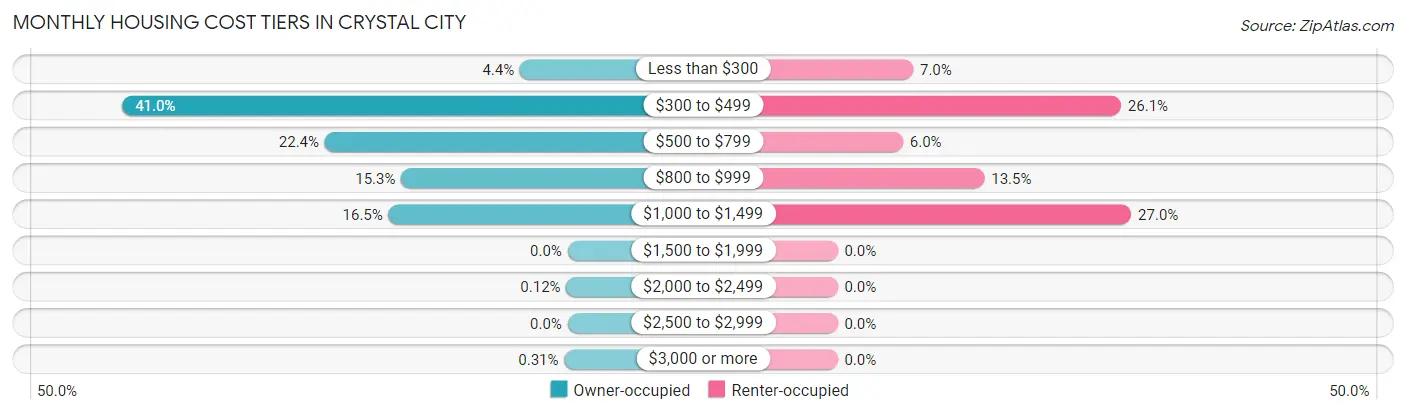
| Monthly Cost | Owner-occupied | Renter-occupied |
| Less than $300 | 71 (4.4%) | 52 (7.0%) |
| $300 to $499 | 664 (41.0%) | 195 (26.1%) |
| $500 to $799 | 362 (22.4%) | 45 (6.0%) |
| $800 to $999 | 248 (15.3%) | 101 (13.5%) |
| $1,000 to $1,499 | 267 (16.5%) | 202 (27.0%) |
| $1,500 to $1,999 | 0 (0.0%) | 0 (0.0%) |
| $2,000 to $2,499 | 2 (0.1%) | 0 (0.0%) |
| $2,500 to $2,999 | 0 (0.0%) | 0 (0.0%) |
| $3,000 or more | 5 (0.3%) | 0 (0.0%) |
| Total | 1,619 (100.0%) | 747 (100.0%) |
Physical Housing Characteristics in Crystal City
Housing Structures in Crystal City
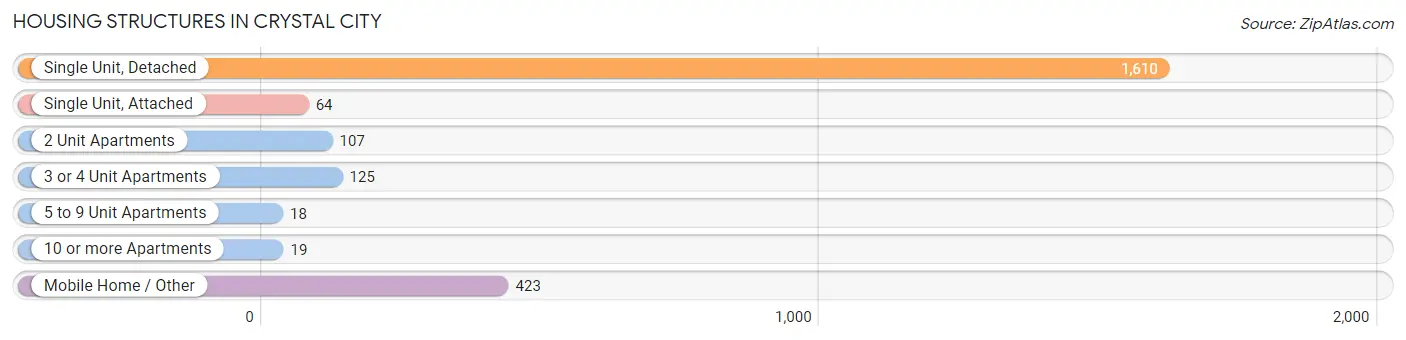
| Structure Type | # Housing Units | % Housing Units |
| Single Unit, Detached | 1,610 | 68.0% |
| Single Unit, Attached | 64 | 2.7% |
| 2 Unit Apartments | 107 | 4.5% |
| 3 or 4 Unit Apartments | 125 | 5.3% |
| 5 to 9 Unit Apartments | 18 | 0.8% |
| 10 or more Apartments | 19 | 0.8% |
| Mobile Home / Other | 423 | 17.9% |
| Total | 2,366 | 100.0% |
Housing Structures by Occupancy in Crystal City
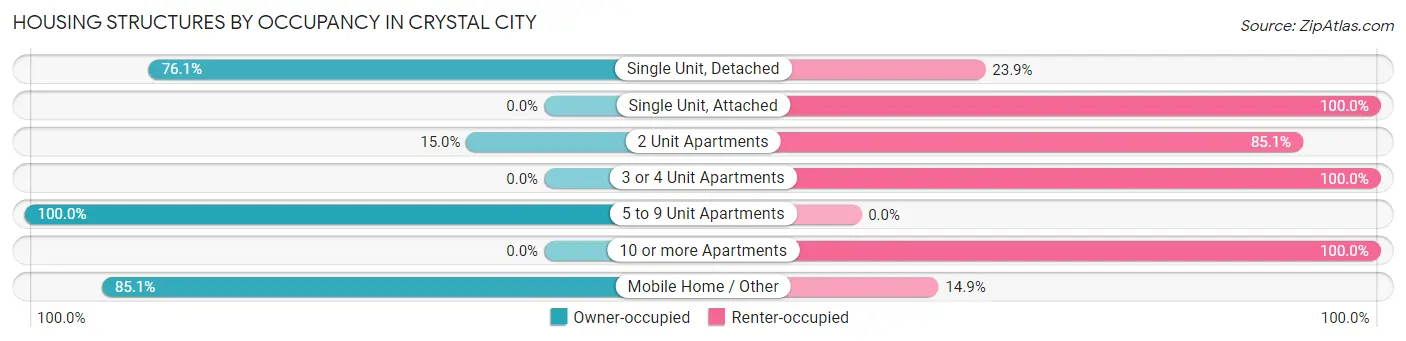
| Structure Type | Owner-occupied | Renter-occupied |
| Single Unit, Detached | 1,225 (76.1%) | 385 (23.9%) |
| Single Unit, Attached | 0 (0.0%) | 64 (100.0%) |
| 2 Unit Apartments | 16 (14.9%) | 91 (85.1%) |
| 3 or 4 Unit Apartments | 0 (0.0%) | 125 (100.0%) |
| 5 to 9 Unit Apartments | 18 (100.0%) | 0 (0.0%) |
| 10 or more Apartments | 0 (0.0%) | 19 (100.0%) |
| Mobile Home / Other | 360 (85.1%) | 63 (14.9%) |
| Total | 1,619 (68.4%) | 747 (31.6%) |
Housing Structures by Number of Rooms in Crystal City
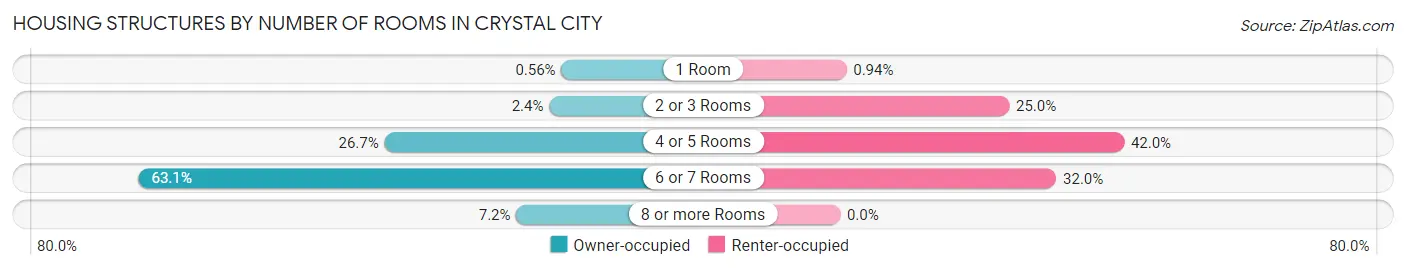
| Number of Rooms | Owner-occupied | Renter-occupied |
| 1 Room | 9 (0.6%) | 7 (0.9%) |
| 2 or 3 Rooms | 38 (2.4%) | 187 (25.0%) |
| 4 or 5 Rooms | 433 (26.7%) | 314 (42.0%) |
| 6 or 7 Rooms | 1,022 (63.1%) | 239 (32.0%) |
| 8 or more Rooms | 117 (7.2%) | 0 (0.0%) |
| Total | 1,619 (100.0%) | 747 (100.0%) |
Housing Structure by Heating Type in Crystal City
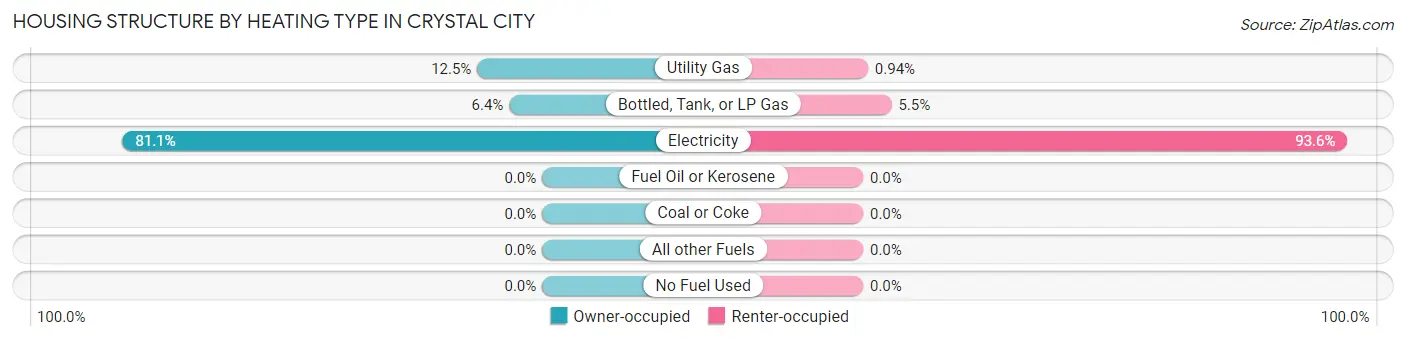
| Heating Type | Owner-occupied | Renter-occupied |
| Utility Gas | 203 (12.5%) | 7 (0.9%) |
| Bottled, Tank, or LP Gas | 103 (6.4%) | 41 (5.5%) |
| Electricity | 1,313 (81.1%) | 699 (93.6%) |
| Fuel Oil or Kerosene | 0 (0.0%) | 0 (0.0%) |
| Coal or Coke | 0 (0.0%) | 0 (0.0%) |
| All other Fuels | 0 (0.0%) | 0 (0.0%) |
| No Fuel Used | 0 (0.0%) | 0 (0.0%) |
| Total | 1,619 (100.0%) | 747 (100.0%) |
Household Vehicle Usage in Crystal City
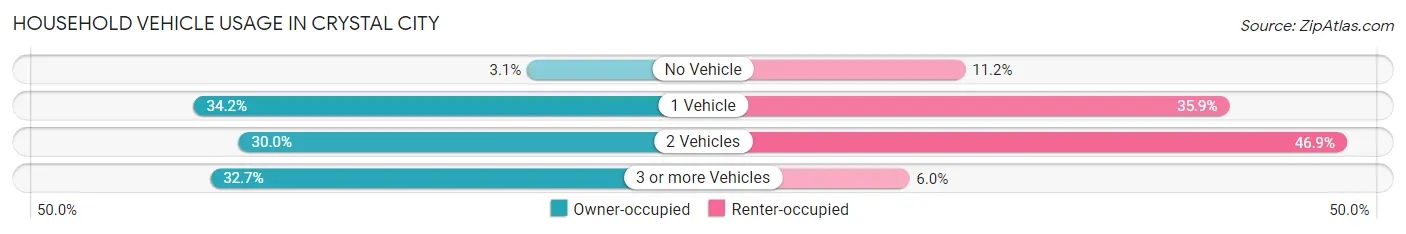
| Vehicles per Household | Owner-occupied | Renter-occupied |
| No Vehicle | 50 (3.1%) | 84 (11.2%) |
| 1 Vehicle | 554 (34.2%) | 268 (35.9%) |
| 2 Vehicles | 486 (30.0%) | 350 (46.9%) |
| 3 or more Vehicles | 529 (32.7%) | 45 (6.0%) |
| Total | 1,619 (100.0%) | 747 (100.0%) |
Real Estate & Mortgages in Crystal City
Real Estate and Mortgage Overview in Crystal City
| Characteristic | Without Mortgage | With Mortgage |
| Housing Units | 1,229 | 390 |
| Median Property Value | $73,300 | $86,100 |
| Median Household Income | $52,946 | $5 |
| Monthly Housing Costs | $459 | $5 |
| Real Estate Taxes | $1,088 | $0 |
Property Value by Mortgage Status in Crystal City
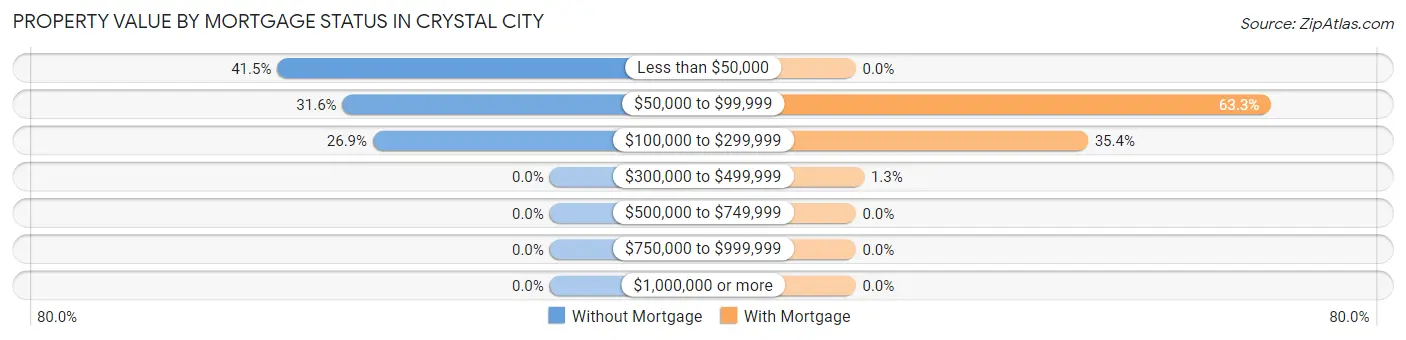
| Property Value | Without Mortgage | With Mortgage |
| Less than $50,000 | 510 (41.5%) | 0 (0.0%) |
| $50,000 to $99,999 | 388 (31.6%) | 247 (63.3%) |
| $100,000 to $299,999 | 331 (26.9%) | 138 (35.4%) |
| $300,000 to $499,999 | 0 (0.0%) | 5 (1.3%) |
| $500,000 to $749,999 | 0 (0.0%) | 0 (0.0%) |
| $750,000 to $999,999 | 0 (0.0%) | 0 (0.0%) |
| $1,000,000 or more | 0 (0.0%) | 0 (0.0%) |
| Total | 1,229 (100.0%) | 390 (100.0%) |
Household Income by Mortgage Status in Crystal City
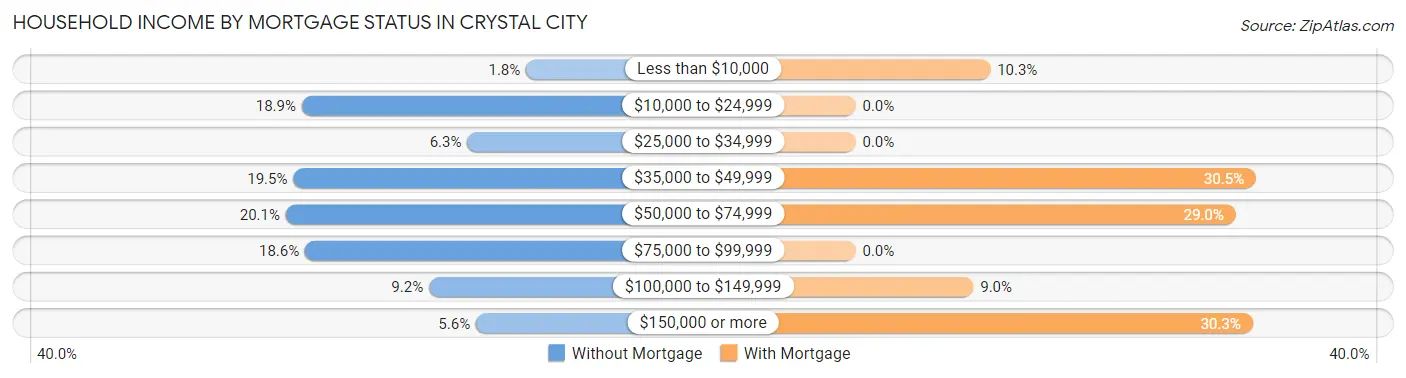
| Household Income | Without Mortgage | With Mortgage |
| Less than $10,000 | 22 (1.8%) | 40 (10.3%) |
| $10,000 to $24,999 | 232 (18.9%) | 0 (0.0%) |
| $25,000 to $34,999 | 77 (6.3%) | 0 (0.0%) |
| $35,000 to $49,999 | 240 (19.5%) | 119 (30.5%) |
| $50,000 to $74,999 | 247 (20.1%) | 113 (29.0%) |
| $75,000 to $99,999 | 229 (18.6%) | 0 (0.0%) |
| $100,000 to $149,999 | 113 (9.2%) | 35 (9.0%) |
| $150,000 or more | 69 (5.6%) | 118 (30.3%) |
| Total | 1,229 (100.0%) | 390 (100.0%) |
Property Value to Household Income Ratio in Crystal City
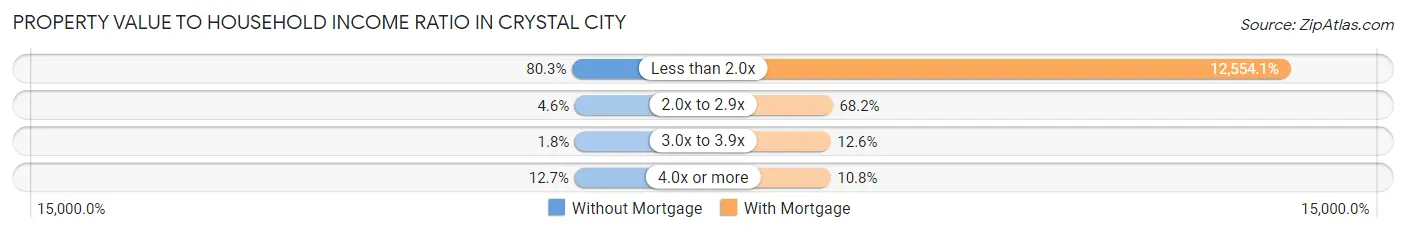
| Value-to-Income Ratio | Without Mortgage | With Mortgage |
| Less than 2.0x | 987 (80.3%) | 48,961 (12,554.1%) |
| 2.0x to 2.9x | 57 (4.6%) | 266 (68.2%) |
| 3.0x to 3.9x | 22 (1.8%) | 49 (12.6%) |
| 4.0x or more | 156 (12.7%) | 42 (10.8%) |
| Total | 1,229 (100.0%) | 390 (100.0%) |
Real Estate Taxes by Mortgage Status in Crystal City
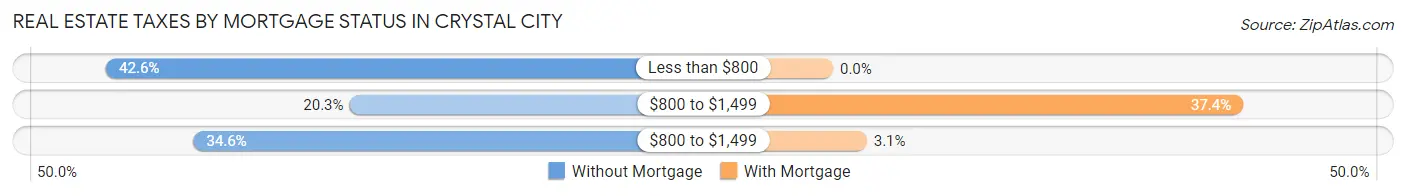
| Property Taxes | Without Mortgage | With Mortgage |
| Less than $800 | 523 (42.5%) | 0 (0.0%) |
| $800 to $1,499 | 250 (20.3%) | 146 (37.4%) |
| $800 to $1,499 | 425 (34.6%) | 12 (3.1%) |
| Total | 1,229 (100.0%) | 390 (100.0%) |
Health & Disability in Crystal City
Health Insurance Coverage by Age in Crystal City
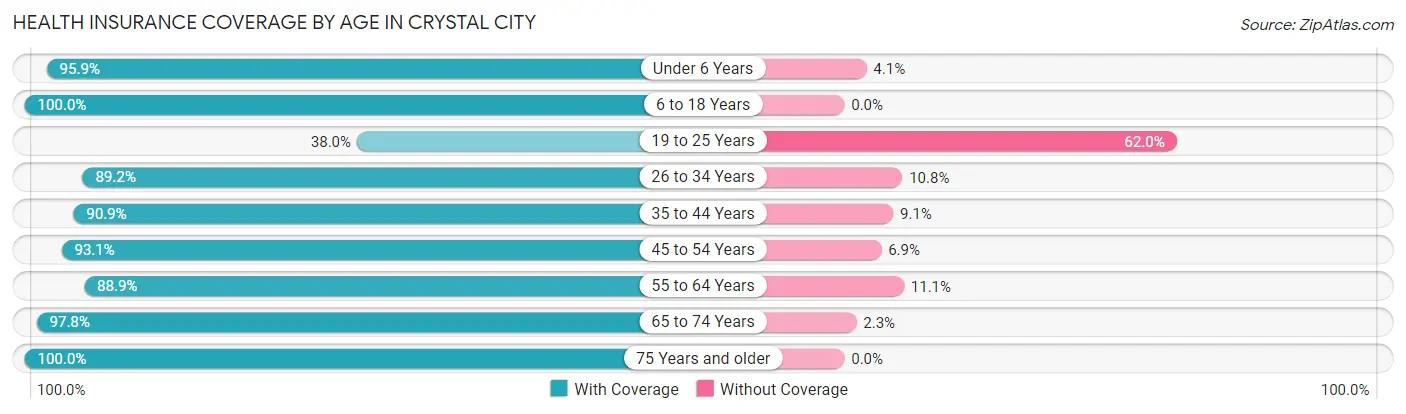
| Age Bracket | With Coverage | Without Coverage |
| Under 6 Years | 442 (95.9%) | 19 (4.1%) |
| 6 to 18 Years | 1,387 (100.0%) | 0 (0.0%) |
| 19 to 25 Years | 186 (38.0%) | 303 (62.0%) |
| 26 to 34 Years | 801 (89.2%) | 97 (10.8%) |
| 35 to 44 Years | 859 (90.9%) | 86 (9.1%) |
| 45 to 54 Years | 474 (93.1%) | 35 (6.9%) |
| 55 to 64 Years | 504 (88.9%) | 63 (11.1%) |
| 65 to 74 Years | 653 (97.8%) | 15 (2.2%) |
| 75 Years and older | 336 (100.0%) | 0 (0.0%) |
| Total | 5,642 (90.1%) | 618 (9.9%) |
Health Insurance Coverage by Citizenship Status in Crystal City
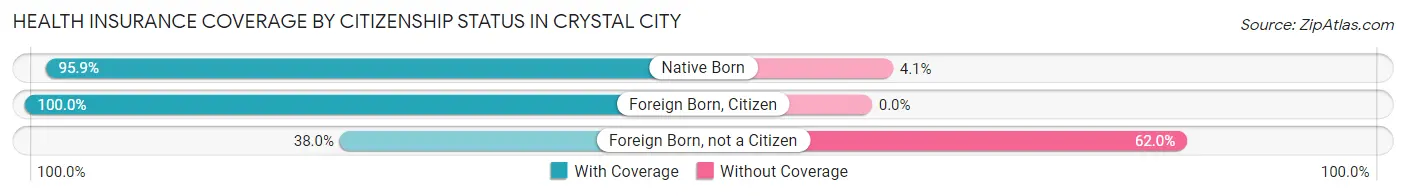
| Citizenship Status | With Coverage | Without Coverage |
| Native Born | 442 (95.9%) | 19 (4.1%) |
| Foreign Born, Citizen | 1,387 (100.0%) | 0 (0.0%) |
| Foreign Born, not a Citizen | 186 (38.0%) | 303 (62.0%) |
Health Insurance Coverage by Household Income in Crystal City
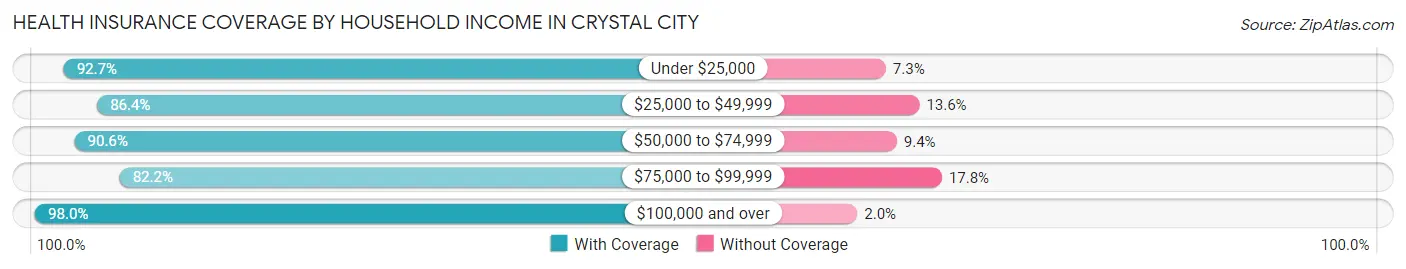
| Household Income | With Coverage | Without Coverage |
| Under $25,000 | 1,252 (92.7%) | 99 (7.3%) |
| $25,000 to $49,999 | 1,765 (86.4%) | 278 (13.6%) |
| $50,000 to $74,999 | 754 (90.6%) | 78 (9.4%) |
| $75,000 to $99,999 | 636 (82.2%) | 138 (17.8%) |
| $100,000 and over | 1,235 (98.0%) | 25 (2.0%) |
Public vs Private Health Insurance Coverage by Age in Crystal City
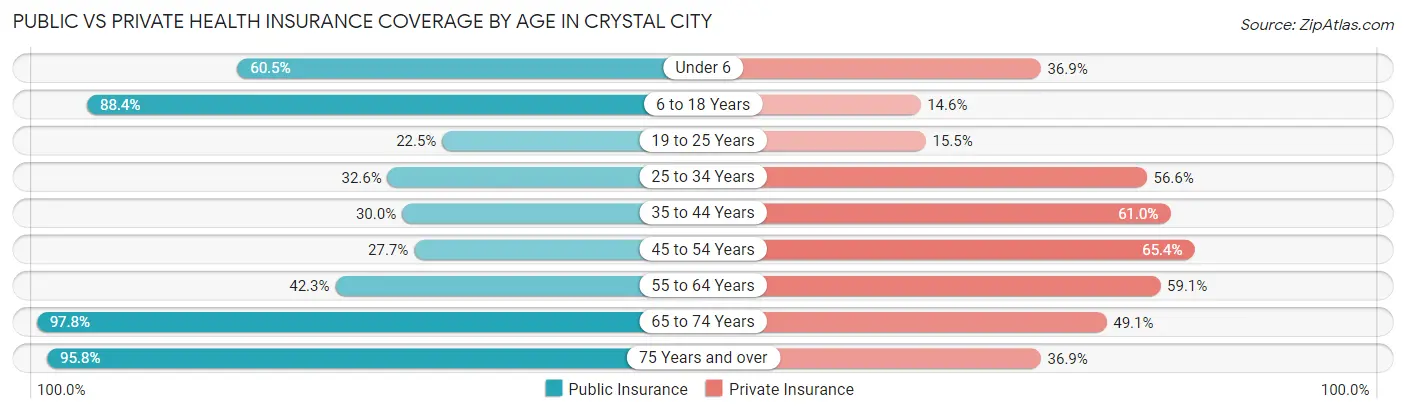
| Age Bracket | Public Insurance | Private Insurance |
| Under 6 | 279 (60.5%) | 170 (36.9%) |
| 6 to 18 Years | 1,226 (88.4%) | 202 (14.6%) |
| 19 to 25 Years | 110 (22.5%) | 76 (15.5%) |
| 25 to 34 Years | 293 (32.6%) | 508 (56.6%) |
| 35 to 44 Years | 283 (29.9%) | 576 (61.0%) |
| 45 to 54 Years | 141 (27.7%) | 333 (65.4%) |
| 55 to 64 Years | 240 (42.3%) | 335 (59.1%) |
| 65 to 74 Years | 653 (97.8%) | 328 (49.1%) |
| 75 Years and over | 322 (95.8%) | 124 (36.9%) |
| Total | 3,547 (56.7%) | 2,652 (42.4%) |
Disability Status by Sex by Age in Crystal City
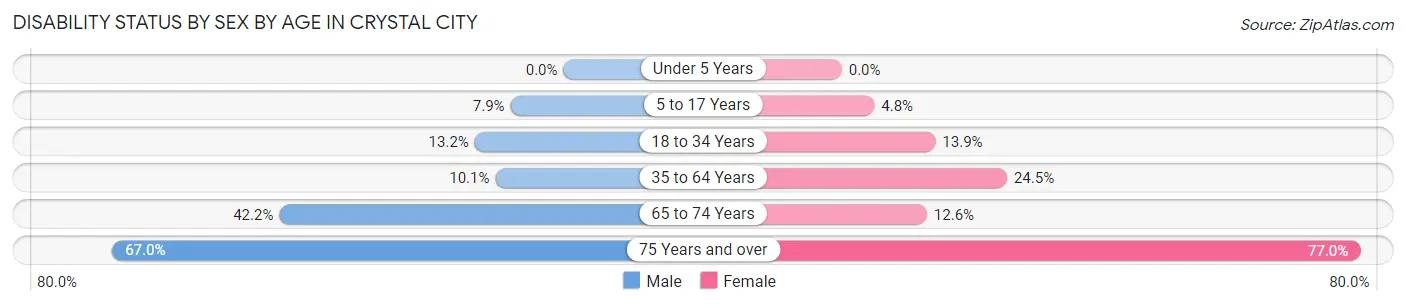
| Age Bracket | Male | Female |
| Under 5 Years | 0 (0.0%) | 0 (0.0%) |
| 5 to 17 Years | 51 (7.9%) | 36 (4.8%) |
| 18 to 34 Years | 105 (13.2%) | 82 (13.9%) |
| 35 to 64 Years | 107 (10.1%) | 236 (24.5%) |
| 65 to 74 Years | 135 (42.2%) | 44 (12.6%) |
| 75 Years and over | 71 (67.0%) | 177 (77.0%) |
Disability Class by Sex by Age in Crystal City
Disability Class: Hearing Difficulty
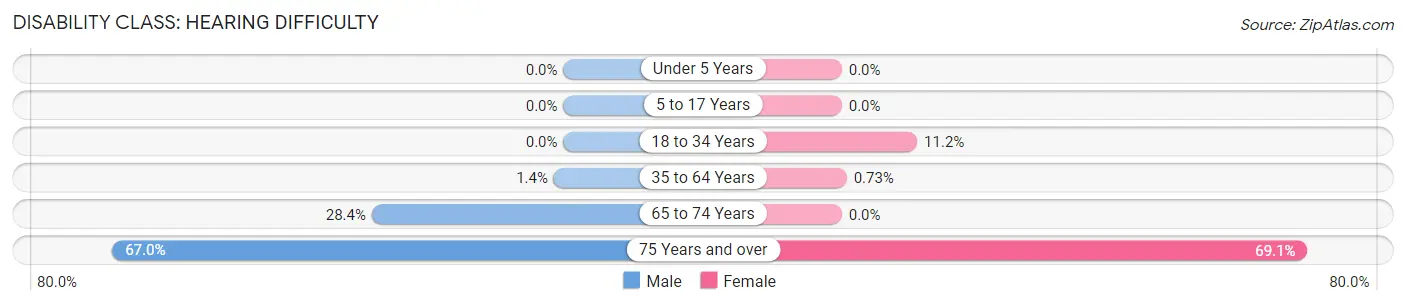
| Age Bracket | Male | Female |
| Under 5 Years | 0 (0.0%) | 0 (0.0%) |
| 5 to 17 Years | 0 (0.0%) | 0 (0.0%) |
| 18 to 34 Years | 0 (0.0%) | 66 (11.2%) |
| 35 to 64 Years | 15 (1.4%) | 7 (0.7%) |
| 65 to 74 Years | 91 (28.4%) | 0 (0.0%) |
| 75 Years and over | 71 (67.0%) | 159 (69.1%) |
Disability Class: Vision Difficulty
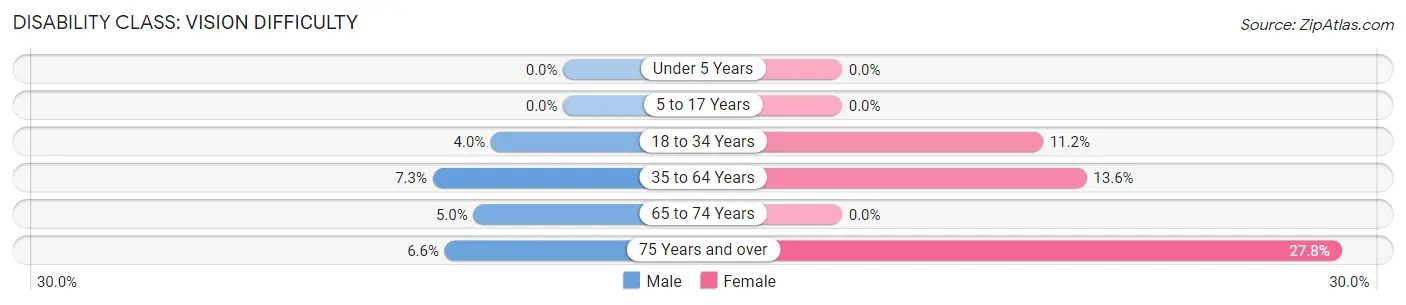
| Age Bracket | Male | Female |
| Under 5 Years | 0 (0.0%) | 0 (0.0%) |
| 5 to 17 Years | 0 (0.0%) | 0 (0.0%) |
| 18 to 34 Years | 32 (4.0%) | 66 (11.2%) |
| 35 to 64 Years | 77 (7.3%) | 131 (13.6%) |
| 65 to 74 Years | 16 (5.0%) | 0 (0.0%) |
| 75 Years and over | 7 (6.6%) | 64 (27.8%) |
Disability Class: Cognitive Difficulty
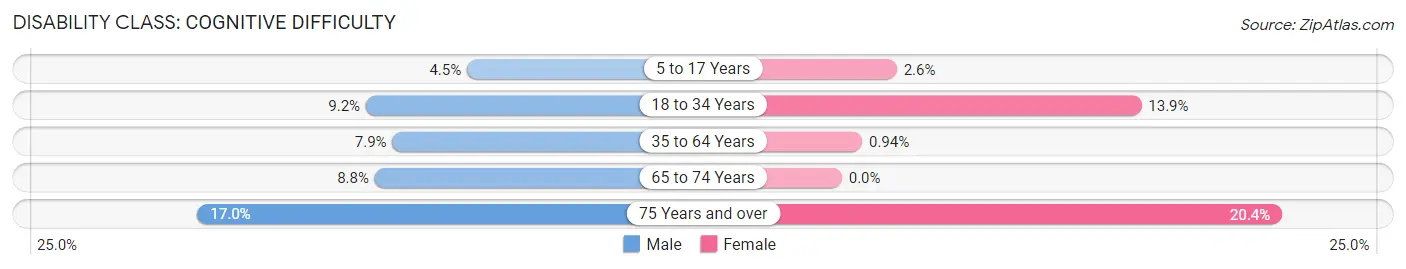
| Age Bracket | Male | Female |
| 5 to 17 Years | 29 (4.5%) | 19 (2.5%) |
| 18 to 34 Years | 73 (9.2%) | 82 (13.9%) |
| 35 to 64 Years | 84 (7.9%) | 9 (0.9%) |
| 65 to 74 Years | 28 (8.7%) | 0 (0.0%) |
| 75 Years and over | 18 (17.0%) | 47 (20.4%) |
Disability Class: Ambulatory Difficulty
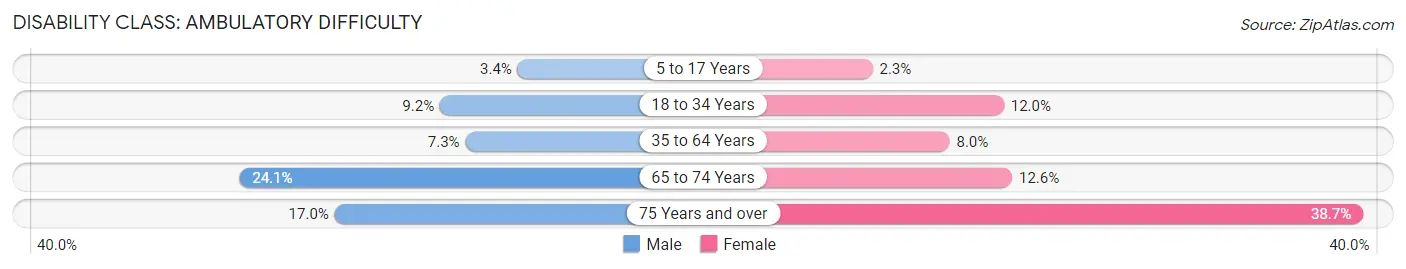
| Age Bracket | Male | Female |
| 5 to 17 Years | 22 (3.4%) | 17 (2.3%) |
| 18 to 34 Years | 73 (9.2%) | 71 (12.0%) |
| 35 to 64 Years | 77 (7.3%) | 77 (8.0%) |
| 65 to 74 Years | 77 (24.1%) | 44 (12.6%) |
| 75 Years and over | 18 (17.0%) | 89 (38.7%) |
Disability Class: Self-Care Difficulty
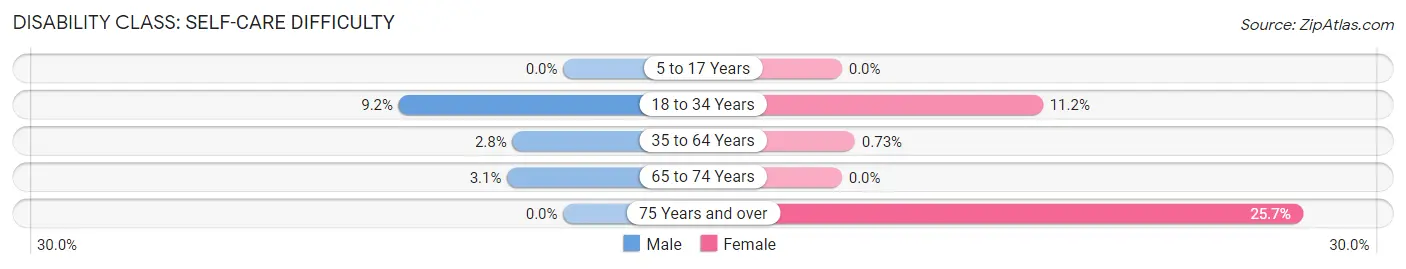
| Age Bracket | Male | Female |
| 5 to 17 Years | 0 (0.0%) | 0 (0.0%) |
| 18 to 34 Years | 73 (9.2%) | 66 (11.2%) |
| 35 to 64 Years | 30 (2.8%) | 7 (0.7%) |
| 65 to 74 Years | 10 (3.1%) | 0 (0.0%) |
| 75 Years and over | 0 (0.0%) | 59 (25.7%) |
Technology Access in Crystal City
Computing Device Access in Crystal City
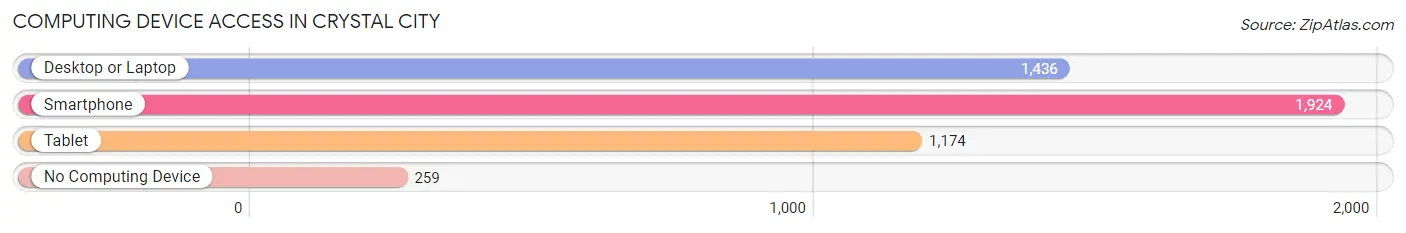
| Device Type | # Households | % Households |
| Desktop or Laptop | 1,436 | 60.7% |
| Smartphone | 1,924 | 81.3% |
| Tablet | 1,174 | 49.6% |
| No Computing Device | 259 | 11.0% |
| Total | 2,366 | 100.0% |
Internet Access in Crystal City
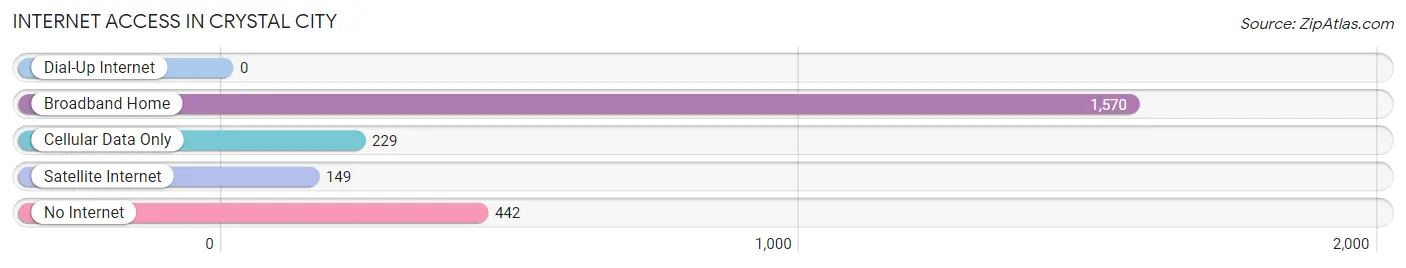
| Internet Type | # Households | % Households |
| Dial-Up Internet | 0 | 0.0% |
| Broadband Home | 1,570 | 66.4% |
| Cellular Data Only | 229 | 9.7% |
| Satellite Internet | 149 | 6.3% |
| No Internet | 442 | 18.7% |
| Total | 2,366 | 100.0% |
Crystal City Summary
City Overview
Located in the heart of the Rio Grande Valley, the city of Crystal City, Texas is a small town with a population of 7,500 people. It is located in Zavala County, Texas, and is the county seat. The city is known for its rich history, diverse geography, and vibrant economy.
History
The city of Crystal City was founded in 1912 by a group of settlers from the nearby town of Eagle Pass. The settlers were looking for a place to settle and start a new life, and they chose the area around Crystal City because of its abundance of natural resources. The city was named after the crystal-clear waters of the nearby San Miguel River.
The city quickly grew and became a major agricultural center in the region. The city was known for its production of cotton, corn, and other crops. In the 1920s, the city was also home to a large number of Mexican immigrants who came to work in the fields.
During World War II, the city was home to a large number of German prisoners of war. The prisoners were housed in a camp located just outside of the city. After the war, the city continued to grow and prosper.
Geography
Crystal City is located in the Rio Grande Valley, which is a region of south Texas that is known for its lush vegetation and diverse wildlife. The city is located in the foothills of the Sierra Madre Mountains, which provide a beautiful backdrop to the city. The city is also located near the San Miguel River, which is a major source of water for the region.
The city has a semi-arid climate, with hot summers and mild winters. The average temperature in the summer is around 90 degrees Fahrenheit, and the average temperature in the winter is around 60 degrees Fahrenheit.
Economy
The economy of Crystal City is largely based on agriculture. The city is home to a number of large farms that produce cotton, corn, and other crops. The city is also home to a number of food processing plants, which process the crops grown in the area.
The city is also home to a number of manufacturing plants, which produce a variety of products, including furniture, clothing, and electronics. The city is also home to a number of retail stores, which sell a variety of goods.
Demographics
As of the 2010 census, the population of Crystal City was 7,500 people. The city is predominantly Hispanic, with a population that is over 90% Hispanic. The city is also home to a large number of immigrants, with over 20% of the population being foreign-born.
The median household income in the city is $30,000, and the median home value is $90,000. The city has a poverty rate of 22%, which is higher than the national average.
Conclusion
The city of Crystal City, Texas is a small town with a rich history, diverse geography, and vibrant economy. The city is predominantly Hispanic, with a population that is over 90% Hispanic. The city is home to a number of large farms and manufacturing plants, which provide a number of jobs for the residents. The city also has a poverty rate of 22%, which is higher than the national average.
Common Questions
What is the Total Population of Crystal City?
Total Population of Crystal City is 6,332.
What is the Total Male Population of Crystal City?
Total Male Population of Crystal City is 3,267.
What is the Total Female Population of Crystal City?
Total Female Population of Crystal City is 3,065.
What is the Ratio of Males per 100 Females in Crystal City?
There are 106.59 Males per 100 Females in Crystal City.
What is the Ratio of Females per 100 Males in Crystal City?
There are 93.82 Females per 100 Males in Crystal City.
What is the Median Population Age in Crystal City?
Median Population Age in Crystal City is 33.8 Years.
What is the Average Family Size in Crystal City
Average Family Size in Crystal City is 2.9 People.
What is the Average Household Size in Crystal City
Average Household Size in Crystal City is 2.6 People.
What is Per Capita Income in Crystal City?
Per Capita income in Crystal City is $21,198.
What is the Median Family Income in Crystal City?
Median Family Income in Crystal City is $48,145.
What is the Median Household income in Crystal City?
Median Household Income in Crystal City is $49,211.
What is Income or Wage Gap in Crystal City?
Income or Wage Gap in Crystal City is 61.7%.
Women in Crystal City earn 38.3 cents for every dollar earned by a man.
What is Inequality or Gini Index in Crystal City?
Inequality or Gini Index in Crystal City is 0.40.
How Large is the Labor Force in Crystal City?
There are 2,680 People in the Labor Forcein in Crystal City.
What is the Percentage of People in the Labor Force in Crystal City?
55.4% of People are in the Labor Force in Crystal City.
What is the Unemployment Rate in Crystal City?
Unemployment Rate in Crystal City is 4.7%.