Buchanan Dam, TX
Buchanan Dam Map
Buchanan Dam Overview
1,274
TOTAL POPULATION
726
MALE POPULATION
548
FEMALE POPULATION
132.48
MALES / 100 FEMALES
75.48
FEMALES / 100 MALES
65.5
MEDIAN AGE
2.5
AVG FAMILY SIZE
2.0
AVG HOUSEHOLD SIZE
$48,882
PER CAPITA INCOME
$76,364
AVG FAMILY INCOME
$66,250
AVG HOUSEHOLD INCOME
42.5%
WAGE / INCOME GAP [ % ]
57.5¢/ $1
WAGE / INCOME GAP [ $ ]
$14,338
FAMILY INCOME DEFICIT
0.52
INEQUALITY / GINI INDEX
492
LABOR FORCE [ PEOPLE ]
42.6%
PERCENT IN LABOR FORCE
0.2%
UNEMPLOYMENT RATE
Buchanan Dam Zip Codes
Buchanan Dam Area Codes
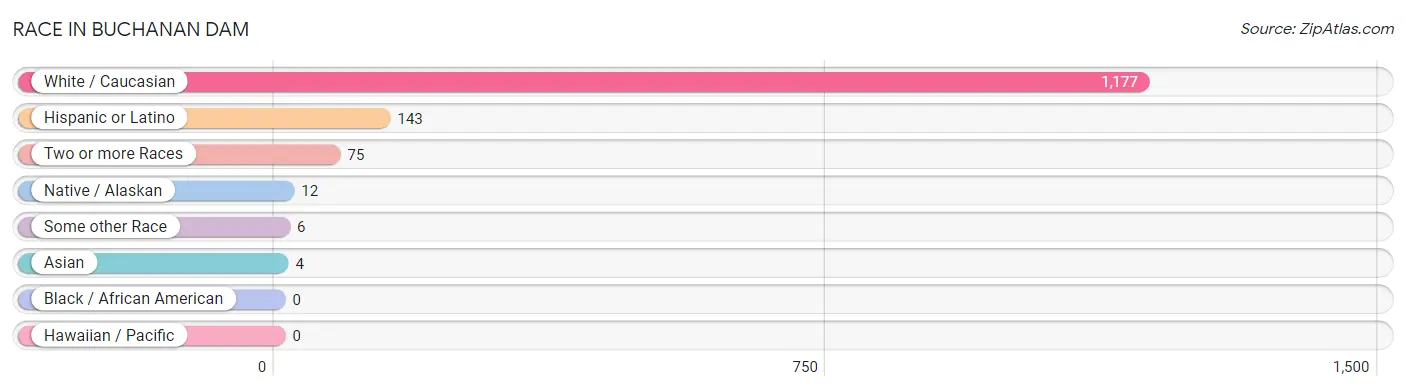
Race in Buchanan Dam
The most populous races in Buchanan Dam are White / Caucasian (1,177 | 92.4%), Hispanic or Latino (143 | 11.2%), and Two or more Races (75 | 5.9%).
| Race | # Population | % Population |
| Asian | 4 | 0.3% |
| Black / African American | 0 | 0.0% |
| Hawaiian / Pacific | 0 | 0.0% |
| Hispanic or Latino | 143 | 11.2% |
| Native / Alaskan | 12 | 0.9% |
| White / Caucasian | 1,177 | 92.4% |
| Two or more Races | 75 | 5.9% |
| Some other Race | 6 | 0.5% |
| Total | 1,274 | 100.0% |
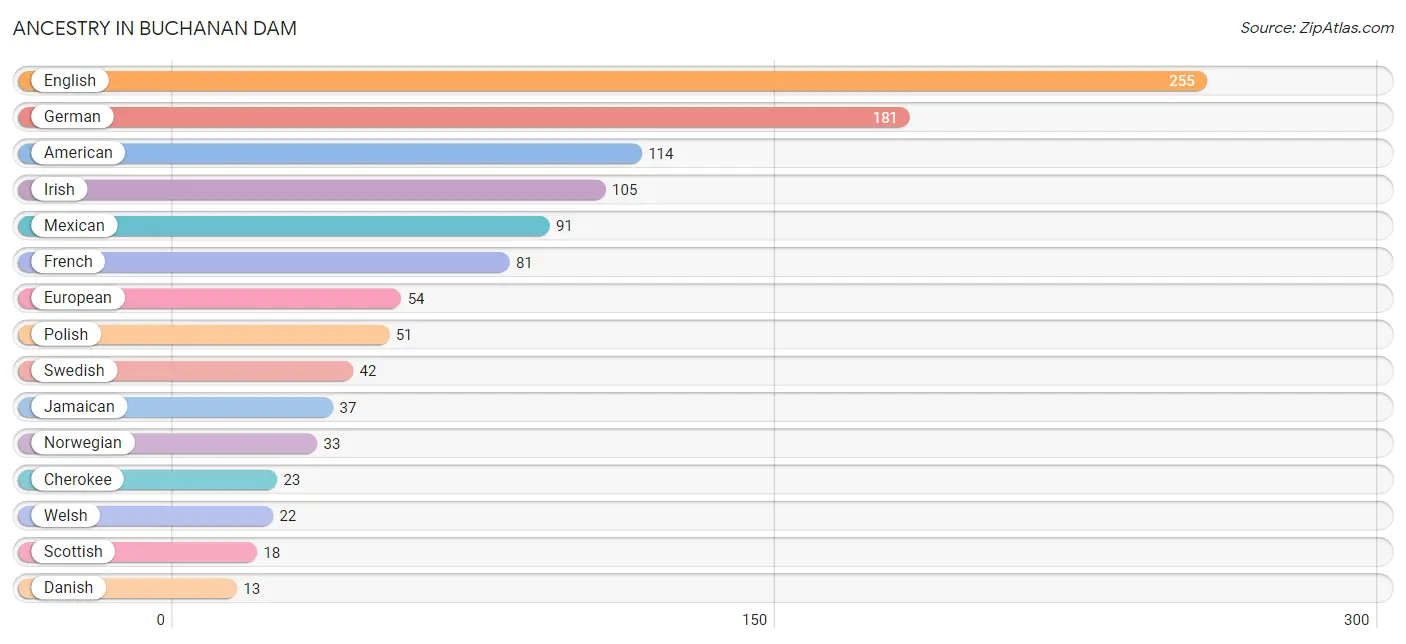
Ancestry in Buchanan Dam
The most populous ancestries reported in Buchanan Dam are English (255 | 20.0%), German (181 | 14.2%), American (114 | 8.9%), Irish (105 | 8.2%), and Mexican (91 | 7.1%), together accounting for 58.6% of all Buchanan Dam residents.
| Ancestry | # Population | % Population |
| American | 114 | 8.9% |
| British | 12 | 0.9% |
| Cherokee | 23 | 1.8% |
| Chilean | 4 | 0.3% |
| Choctaw | 5 | 0.4% |
| Creek | 7 | 0.5% |
| Czech | 7 | 0.5% |
| Danish | 13 | 1.0% |
| Dutch | 7 | 0.5% |
| Dutch West Indian | 12 | 0.9% |
| English | 255 | 20.0% |
| European | 54 | 4.2% |
| French | 81 | 6.4% |
| German | 181 | 14.2% |
| Irish | 105 | 8.2% |
| Jamaican | 37 | 2.9% |
| Laotian | 4 | 0.3% |
| Mexican | 91 | 7.1% |
| Norwegian | 33 | 2.6% |
| Pennsylvania German | 10 | 0.8% |
| Polish | 51 | 4.0% |
| Scandinavian | 11 | 0.9% |
| Scotch-Irish | 12 | 0.9% |
| Scottish | 18 | 1.4% |
| South American | 4 | 0.3% |
| Spaniard | 4 | 0.3% |
| Swedish | 42 | 3.3% |
| Welsh | 22 | 1.7% | View All 28 Rows |
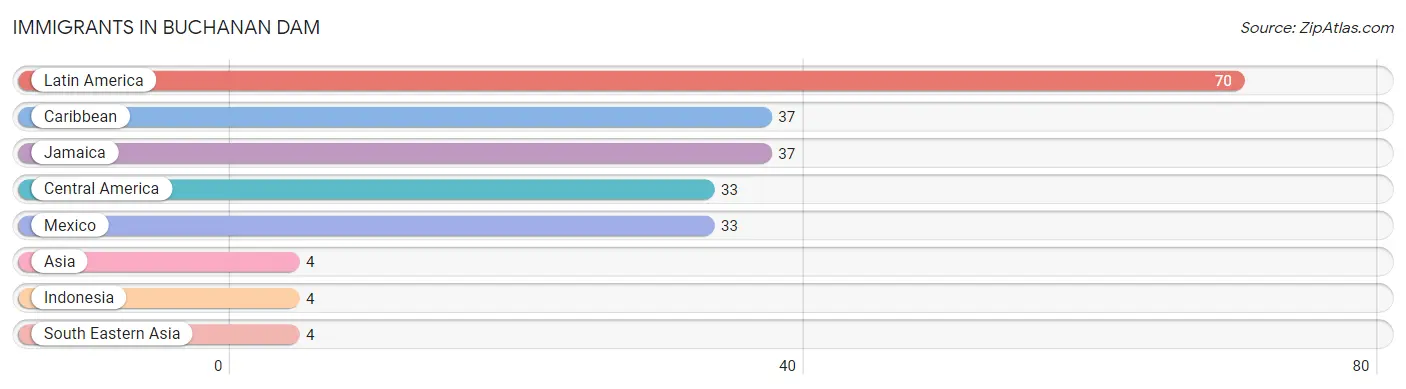
Immigrants in Buchanan Dam
The most numerous immigrant groups reported in Buchanan Dam came from Latin America (70 | 5.5%), Caribbean (37 | 2.9%), Jamaica (37 | 2.9%), Central America (33 | 2.6%), and Mexico (33 | 2.6%), together accounting for 16.5% of all Buchanan Dam residents.
| Immigration Origin | # Population | % Population |
| Asia | 4 | 0.3% |
| Caribbean | 37 | 2.9% |
| Central America | 33 | 2.6% |
| Indonesia | 4 | 0.3% |
| Jamaica | 37 | 2.9% |
| Latin America | 70 | 5.5% |
| Mexico | 33 | 2.6% |
| South Eastern Asia | 4 | 0.3% | View All 8 Rows |
Sex and Age in Buchanan Dam
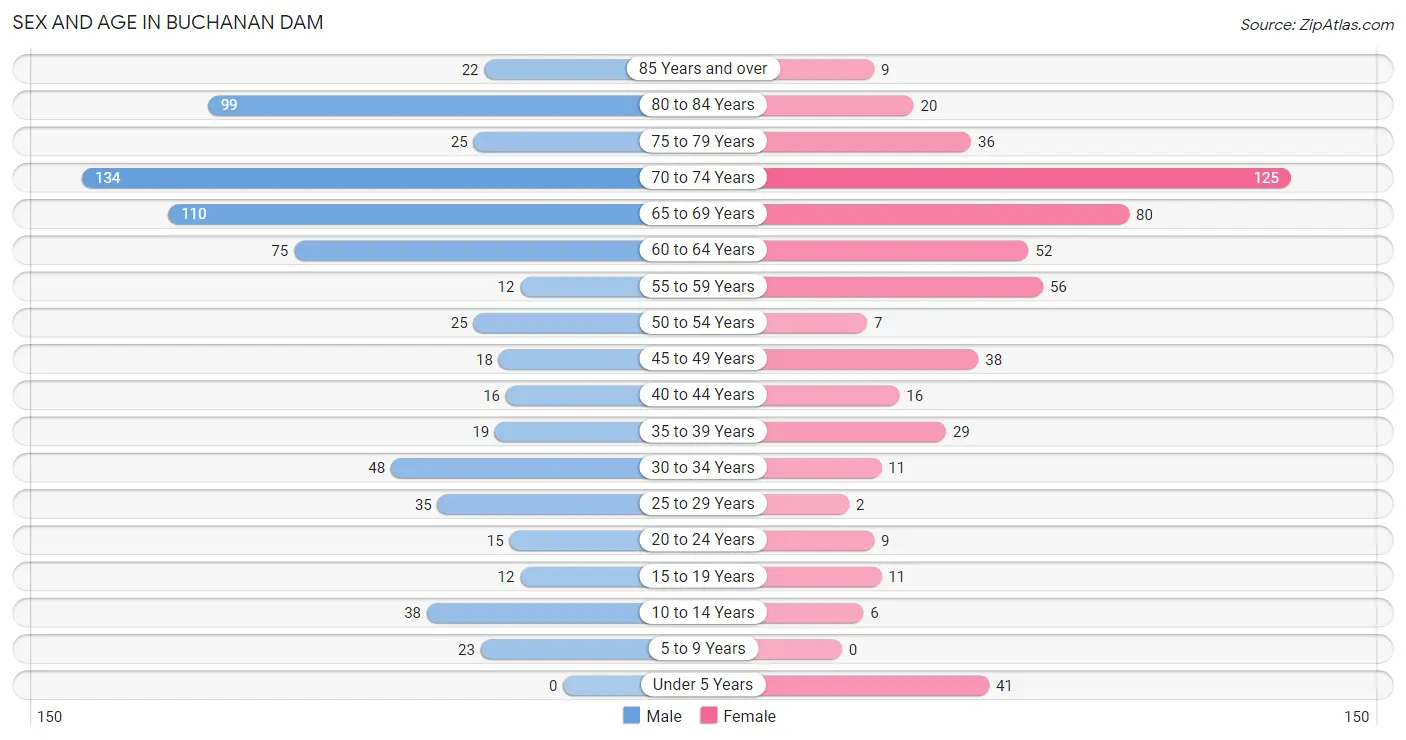
Sex and Age in Buchanan Dam
The most populous age groups in Buchanan Dam are 70 to 74 Years (134 | 18.5%) for men and 70 to 74 Years (125 | 22.8%) for women.
| Age Bracket | Male | Female |
| Under 5 Years | 0 (0.0%) | 41 (7.5%) |
| 5 to 9 Years | 23 (3.2%) | 0 (0.0%) |
| 10 to 14 Years | 38 (5.2%) | 6 (1.1%) |
| 15 to 19 Years | 12 (1.7%) | 11 (2.0%) |
| 20 to 24 Years | 15 (2.1%) | 9 (1.6%) |
| 25 to 29 Years | 35 (4.8%) | 2 (0.4%) |
| 30 to 34 Years | 48 (6.6%) | 11 (2.0%) |
| 35 to 39 Years | 19 (2.6%) | 29 (5.3%) |
| 40 to 44 Years | 16 (2.2%) | 16 (2.9%) |
| 45 to 49 Years | 18 (2.5%) | 38 (6.9%) |
| 50 to 54 Years | 25 (3.4%) | 7 (1.3%) |
| 55 to 59 Years | 12 (1.7%) | 56 (10.2%) |
| 60 to 64 Years | 75 (10.3%) | 52 (9.5%) |
| 65 to 69 Years | 110 (15.1%) | 80 (14.6%) |
| 70 to 74 Years | 134 (18.5%) | 125 (22.8%) |
| 75 to 79 Years | 25 (3.4%) | 36 (6.6%) |
| 80 to 84 Years | 99 (13.6%) | 20 (3.6%) |
| 85 Years and over | 22 (3.0%) | 9 (1.6%) |
| Total | 726 (100.0%) | 548 (100.0%) |
Families and Households in Buchanan Dam
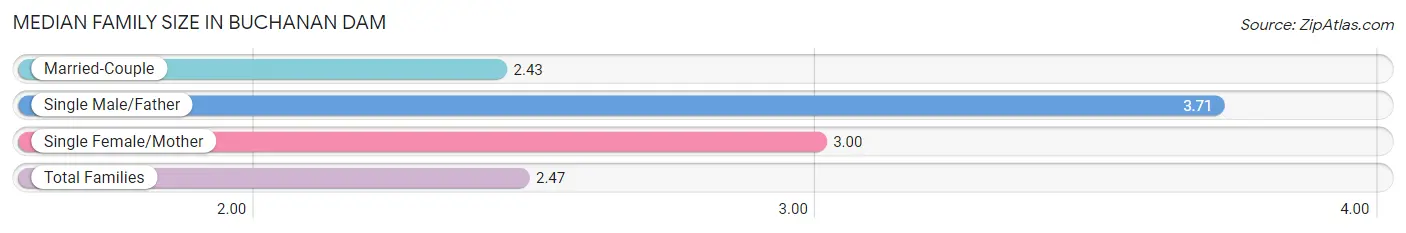
Median Family Size in Buchanan Dam
The median family size in Buchanan Dam is 2.47 persons per family, with single male/father families (7 | 1.7%) accounting for the largest median family size of 3.71 persons per family. On the other hand, married-couple families (404 | 95.7%) represent the smallest median family size with 2.43 persons per family.
| Family Type | # Families | Family Size |
| Married-Couple | 404 (95.7%) | 2.43 |
| Single Male/Father | 7 (1.7%) | 3.71 |
| Single Female/Mother | 11 (2.6%) | 3.00 |
| Total Families | 422 (100.0%) | 2.47 |
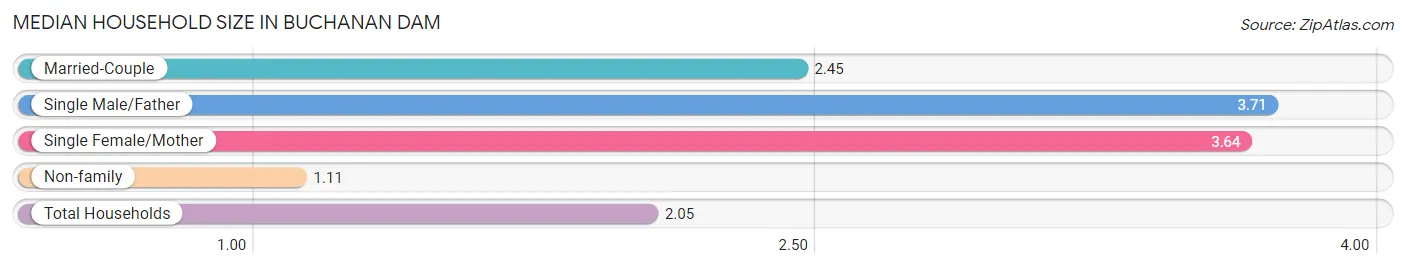
Median Household Size in Buchanan Dam
The median household size in Buchanan Dam is 2.05 persons per household, with single male/father households (7 | 1.1%) accounting for the largest median household size of 3.71 persons per household. non-family households (198 | 31.9%) represent the smallest median household size with 1.11 persons per household.
| Household Type | # Households | Household Size |
| Married-Couple | 404 (65.2%) | 2.45 |
| Single Male/Father | 7 (1.1%) | 3.71 |
| Single Female/Mother | 11 (1.8%) | 3.64 |
| Non-family | 198 (31.9%) | 1.11 |
| Total Households | 620 (100.0%) | 2.05 |
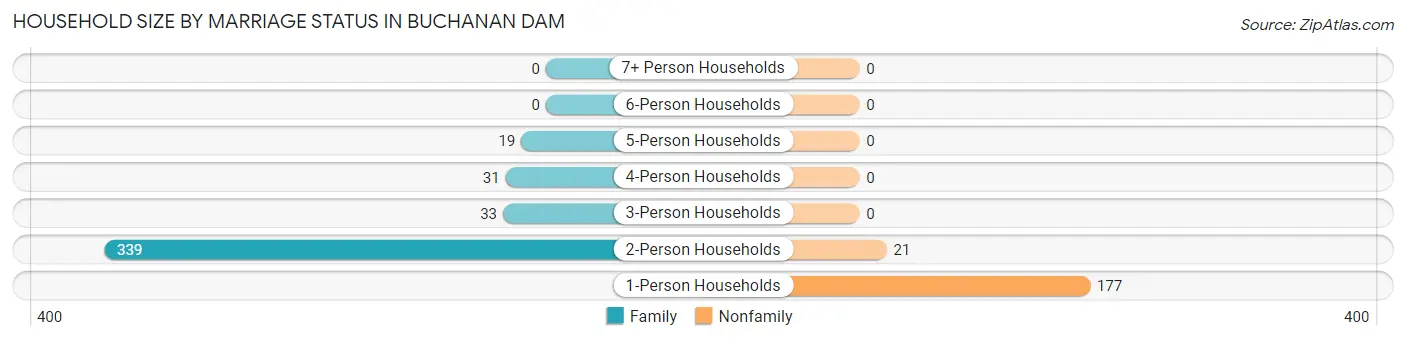
Household Size by Marriage Status in Buchanan Dam
Out of a total of 620 households in Buchanan Dam, 422 (68.1%) are family households, while 198 (31.9%) are nonfamily households. The most numerous type of family households are 2-person households, comprising 339, and the most common type of nonfamily households are 1-person households, comprising 177.
| Household Size | Family Households | Nonfamily Households |
| 1-Person Households | - | 177 (28.5%) |
| 2-Person Households | 339 (54.7%) | 21 (3.4%) |
| 3-Person Households | 33 (5.3%) | 0 (0.0%) |
| 4-Person Households | 31 (5.0%) | 0 (0.0%) |
| 5-Person Households | 19 (3.1%) | 0 (0.0%) |
| 6-Person Households | 0 (0.0%) | 0 (0.0%) |
| 7+ Person Households | 0 (0.0%) | 0 (0.0%) |
| Total | 422 (68.1%) | 198 (31.9%) |
Female Fertility in Buchanan Dam
Fertility by Age in Buchanan Dam
Average fertility rate in Buchanan Dam is 78.0 births per 1,000 women. Women in the age bracket of 20 to 34 years have the highest fertility rate with 409.0 births per 1,000 women. Women in the age bracket of 20 to 34 years acount for 100.0% of all women with births.
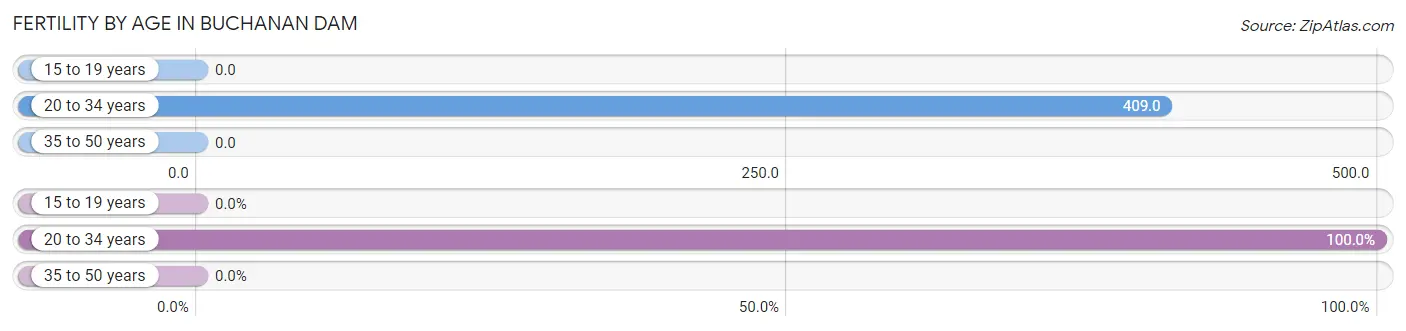
| Age Bracket | Women with Births | Births / 1,000 Women |
| 15 to 19 years | 0 (0.0%) | 0.0 |
| 20 to 34 years | 9 (100.0%) | 409.0 |
| 35 to 50 years | 0 (0.0%) | 0.0 |
| Total | 9 (100.0%) | 78.0 |
Fertility by Age by Marriage Status in Buchanan Dam
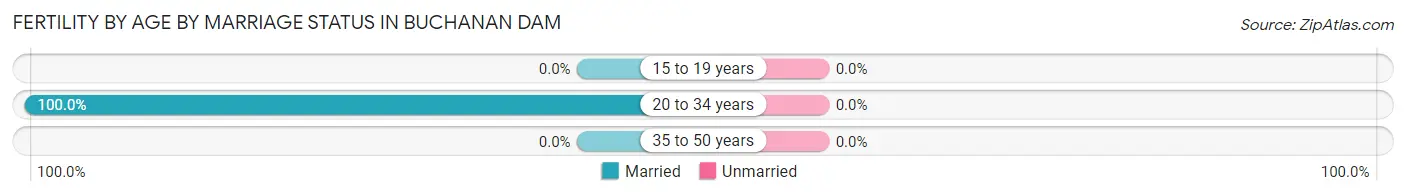
| Age Bracket | Married | Unmarried |
| 15 to 19 years | 0 (0.0%) | 0 (0.0%) |
| 20 to 34 years | 9 (100.0%) | 0 (0.0%) |
| 35 to 50 years | 0 (0.0%) | 0 (0.0%) |
| Total | 9 (100.0%) | 0 (0.0%) |
Fertility by Education in Buchanan Dam
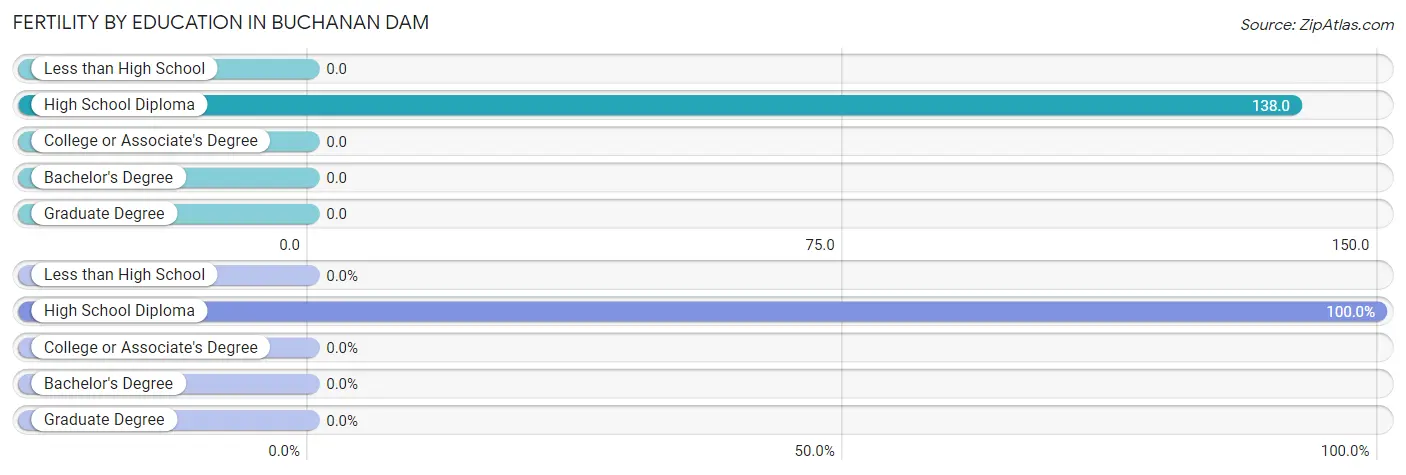
| Educational Attainment | Women with Births | Births / 1,000 Women |
| Less than High School | 0 (0.0%) | 0.0 |
| High School Diploma | 9 (100.0%) | 138.0 |
| College or Associate's Degree | 0 (0.0%) | 0.0 |
| Bachelor's Degree | 0 (0.0%) | 0.0 |
| Graduate Degree | 0 (0.0%) | 0.0 |
| Total | 9 (100.0%) | 78.0 |
Fertility by Education by Marriage Status in Buchanan Dam
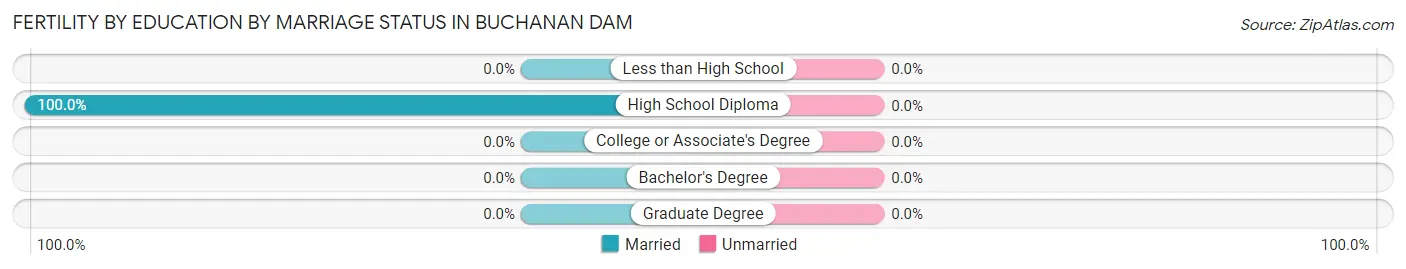
| Educational Attainment | Married | Unmarried |
| Less than High School | 0 (0.0%) | 0 (0.0%) |
| High School Diploma | 9 (100.0%) | 0 (0.0%) |
| College or Associate's Degree | 0 (0.0%) | 0 (0.0%) |
| Bachelor's Degree | 0 (0.0%) | 0 (0.0%) |
| Graduate Degree | 0 (0.0%) | 0 (0.0%) |
| Total | 9 (100.0%) | 0 (0.0%) |
Income in Buchanan Dam
Income Overview in Buchanan Dam
Per Capita Income in Buchanan Dam is $48,882, while median incomes of families and households are $76,364 and $66,250 respectively.
| Characteristic | Number | Measure |
| Per Capita Income | 1,274 | $48,882 |
| Median Family Income | 422 | $76,364 |
| Mean Family Income | 422 | $126,336 |
| Median Household Income | 620 | $66,250 |
| Mean Household Income | 620 | $100,453 |
| Income Deficit | 422 | $14,338 |
| Wage / Income Gap (%) | 1,274 | 42.53% |
| Wage / Income Gap ($) | 1,274 | 57.47¢ per $1 |
| Gini / Inequality Index | 1,274 | 0.52 |
Earnings by Sex in Buchanan Dam
Average Earnings in Buchanan Dam are $42,353, $51,045 for men and $29,338 for women, a difference of 42.5%.
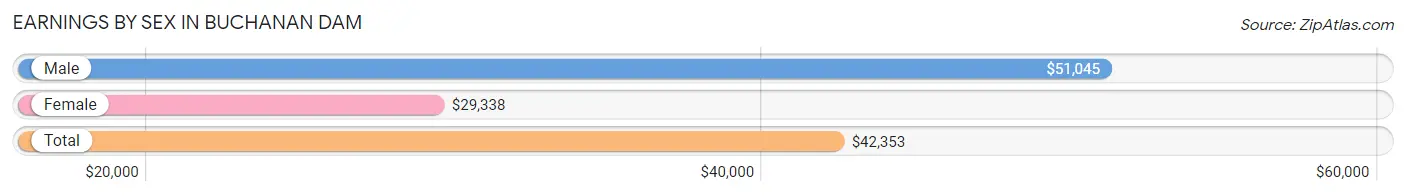
| Sex | Number | Average Earnings |
| Male | 327 (64.1%) | $51,045 |
| Female | 183 (35.9%) | $29,338 |
| Total | 510 (100.0%) | $42,353 |
Earnings by Sex by Income Bracket in Buchanan Dam
The most common earnings brackets in Buchanan Dam are $50,000 to $54,999 for men (98 | 30.0%) and $100,000+ for women (30 | 16.4%).
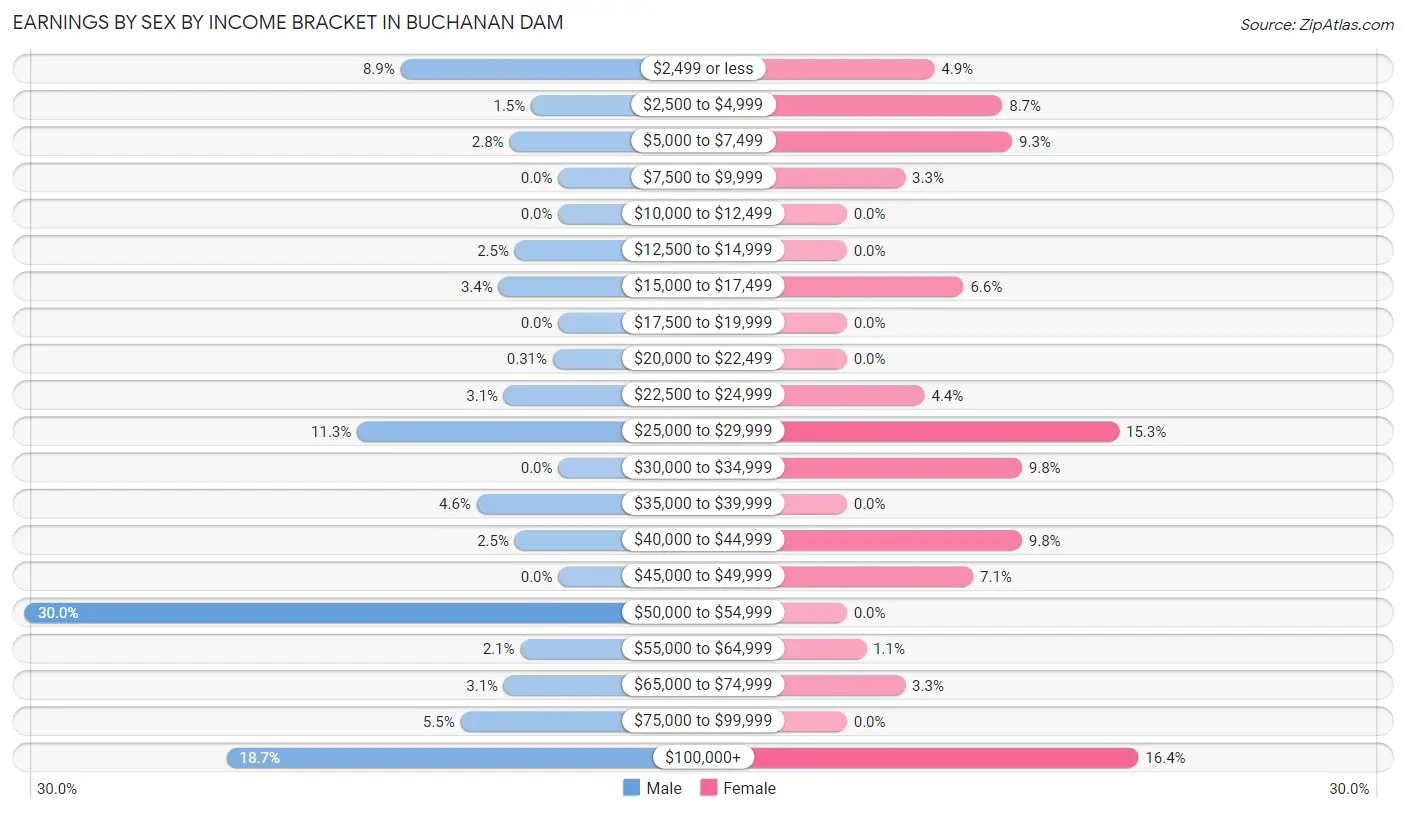
| Income | Male | Female |
| $2,499 or less | 29 (8.9%) | 9 (4.9%) |
| $2,500 to $4,999 | 5 (1.5%) | 16 (8.7%) |
| $5,000 to $7,499 | 9 (2.8%) | 17 (9.3%) |
| $7,500 to $9,999 | 0 (0.0%) | 6 (3.3%) |
| $10,000 to $12,499 | 0 (0.0%) | 0 (0.0%) |
| $12,500 to $14,999 | 8 (2.5%) | 0 (0.0%) |
| $15,000 to $17,499 | 11 (3.4%) | 12 (6.6%) |
| $17,500 to $19,999 | 0 (0.0%) | 0 (0.0%) |
| $20,000 to $22,499 | 1 (0.3%) | 0 (0.0%) |
| $22,500 to $24,999 | 10 (3.1%) | 8 (4.4%) |
| $25,000 to $29,999 | 37 (11.3%) | 28 (15.3%) |
| $30,000 to $34,999 | 0 (0.0%) | 18 (9.8%) |
| $35,000 to $39,999 | 15 (4.6%) | 0 (0.0%) |
| $40,000 to $44,999 | 8 (2.5%) | 18 (9.8%) |
| $45,000 to $49,999 | 0 (0.0%) | 13 (7.1%) |
| $50,000 to $54,999 | 98 (30.0%) | 0 (0.0%) |
| $55,000 to $64,999 | 7 (2.1%) | 2 (1.1%) |
| $65,000 to $74,999 | 10 (3.1%) | 6 (3.3%) |
| $75,000 to $99,999 | 18 (5.5%) | 0 (0.0%) |
| $100,000+ | 61 (18.6%) | 30 (16.4%) |
| Total | 327 (100.0%) | 183 (100.0%) |
Earnings by Sex by Educational Attainment in Buchanan Dam
Average earnings in Buchanan Dam are $51,301 for men and $30,000 for women, a difference of 41.5%. Men with an educational attainment of college or associate's degree enjoy the highest average annual earnings of $57,679, while those with high school diploma education earn the least with $50,478. Women with an educational attainment of college or associate's degree earn the most with the average annual earnings of $44,306, while those with college or associate's degree education have the smallest earnings of $44,306.
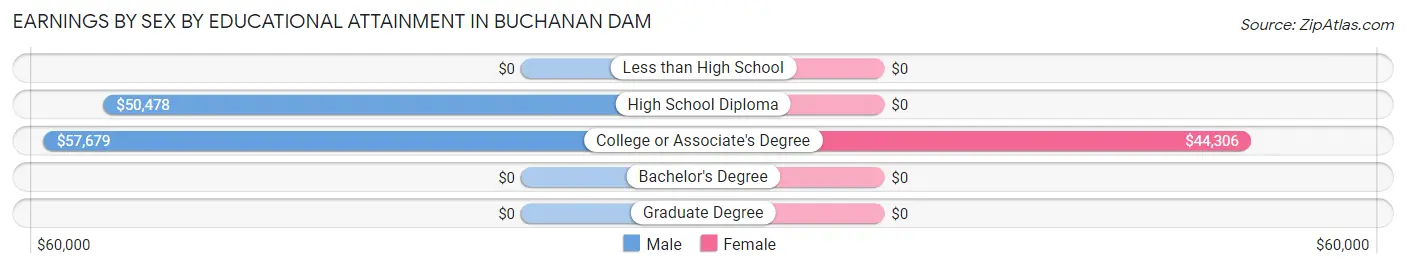
| Educational Attainment | Male Income | Female Income |
| Less than High School | - | - |
| High School Diploma | $50,478 | $0 |
| College or Associate's Degree | $57,679 | $44,306 |
| Bachelor's Degree | - | - |
| Graduate Degree | - | - |
| Total | $51,301 | $30,000 |
Family Income in Buchanan Dam
Family Income Brackets in Buchanan Dam
According to the Buchanan Dam family income data, there are 107 families falling into the $50,000 to $74,999 income range, which is the most common income bracket and makes up 25.4% of all families.
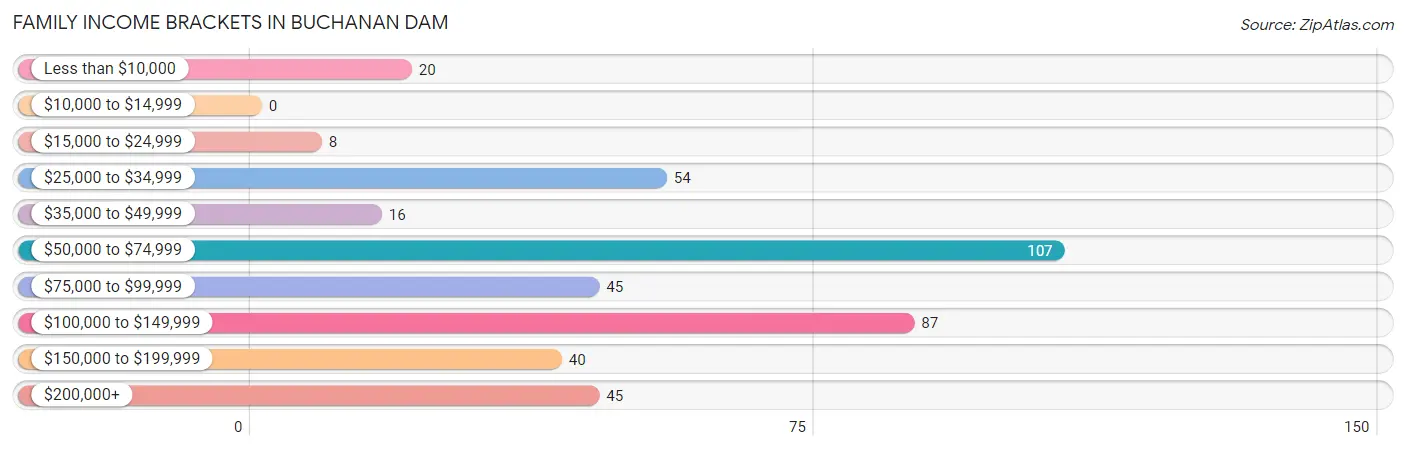
| Income Bracket | # Families | % Families |
| Less than $10,000 | 20 | 4.7% |
| $10,000 to $14,999 | 0 | 0.0% |
| $15,000 to $24,999 | 8 | 1.9% |
| $25,000 to $34,999 | 54 | 12.8% |
| $35,000 to $49,999 | 16 | 3.8% |
| $50,000 to $74,999 | 107 | 25.4% |
| $75,000 to $99,999 | 45 | 10.7% |
| $100,000 to $149,999 | 87 | 20.6% |
| $150,000 to $199,999 | 40 | 9.5% |
| $200,000+ | 45 | 10.7% |
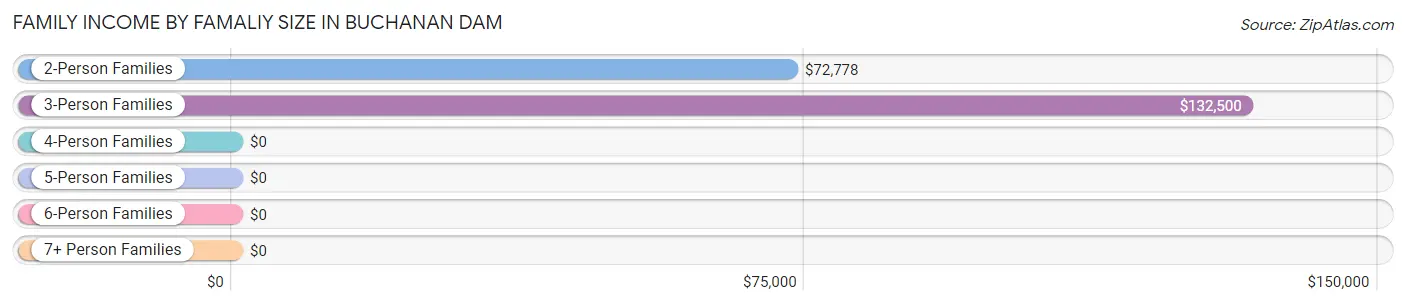
Family Income by Famaliy Size in Buchanan Dam
3-person families (36 | 8.5%) account for the highest median family income in Buchanan Dam with $132,500 per family, while 3-person families (36 | 8.5%) have the highest median income of $44,167 per family member.
| Income Bracket | # Families | Median Income |
| 2-Person Families | 344 (81.5%) | $72,778 |
| 3-Person Families | 36 (8.5%) | $132,500 |
| 4-Person Families | 23 (5.4%) | $0 |
| 5-Person Families | 19 (4.5%) | $0 |
| 6-Person Families | 0 (0.0%) | $0 |
| 7+ Person Families | 0 (0.0%) | $0 |
| Total | 422 (100.0%) | $76,364 |
Family Income by Number of Earners in Buchanan Dam
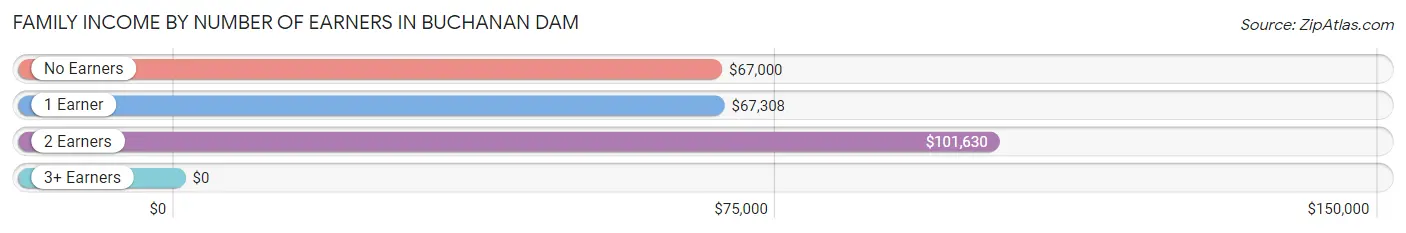
| Number of Earners | # Families | Median Income |
| No Earners | 178 (42.2%) | $67,000 |
| 1 Earner | 104 (24.6%) | $67,308 |
| 2 Earners | 122 (28.9%) | $101,630 |
| 3+ Earners | 18 (4.3%) | $0 |
| Total | 422 (100.0%) | $76,364 |
Household Income in Buchanan Dam
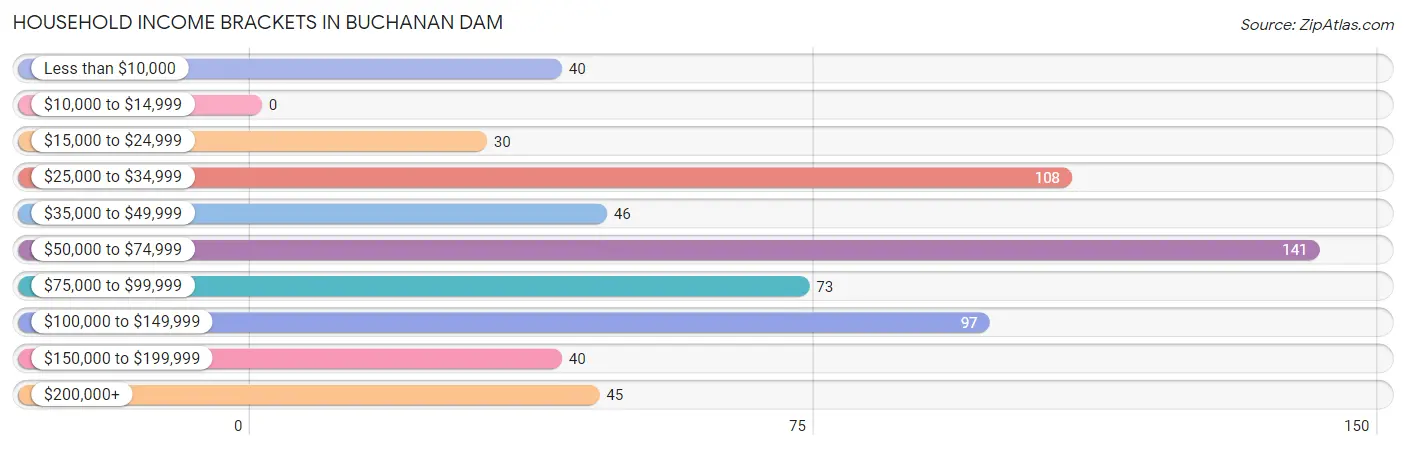
Household Income Brackets in Buchanan Dam
With 141 households falling in the category, the $50,000 to $74,999 income range is the most frequent in Buchanan Dam, accounting for 22.7% of all households.
| Income Bracket | # Households | % Households |
| Less than $10,000 | 40 | 6.5% |
| $10,000 to $14,999 | 0 | 0.0% |
| $15,000 to $24,999 | 30 | 4.8% |
| $25,000 to $34,999 | 108 | 17.4% |
| $35,000 to $49,999 | 46 | 7.4% |
| $50,000 to $74,999 | 141 | 22.7% |
| $75,000 to $99,999 | 73 | 11.8% |
| $100,000 to $149,999 | 97 | 15.6% |
| $150,000 to $199,999 | 40 | 6.5% |
| $200,000+ | 45 | 7.3% |
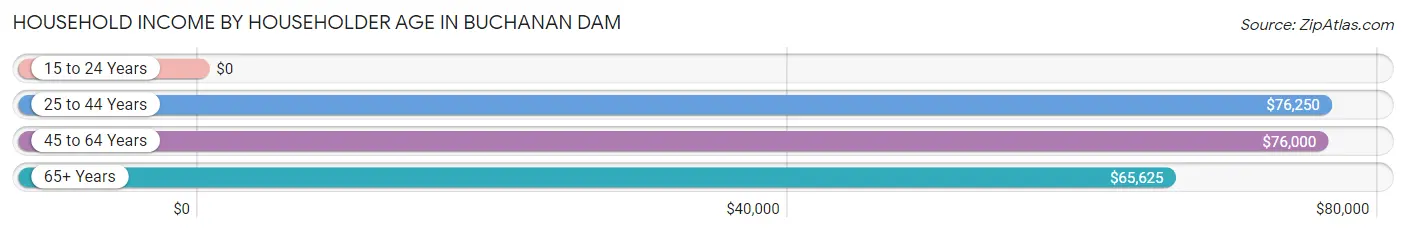
Household Income by Householder Age in Buchanan Dam
The median household income in Buchanan Dam is $66,250, with the highest median household income of $76,250 found in the 25 to 44 years age bracket for the primary householder. A total of 60 households (9.7%) fall into this category. Meanwhile, the 15 to 24 years age bracket for the primary householder has the lowest median household income of $0, with 15 households (2.4%) in this group.
| Income Bracket | # Households | Median Income |
| 15 to 24 Years | 15 (2.4%) | $0 |
| 25 to 44 Years | 60 (9.7%) | $76,250 |
| 45 to 64 Years | 154 (24.8%) | $76,000 |
| 65+ Years | 391 (63.1%) | $65,625 |
| Total | 620 (100.0%) | $66,250 |
Poverty in Buchanan Dam
Income Below Poverty by Sex and Age in Buchanan Dam
With 5.7% poverty level for males and 6.9% for females among the residents of Buchanan Dam, 12 to 14 year old males and 75 year old and over females are the most vulnerable to poverty, with 2 males (22.2%) and 10 females (15.4%) in their respective age groups living below the poverty level.
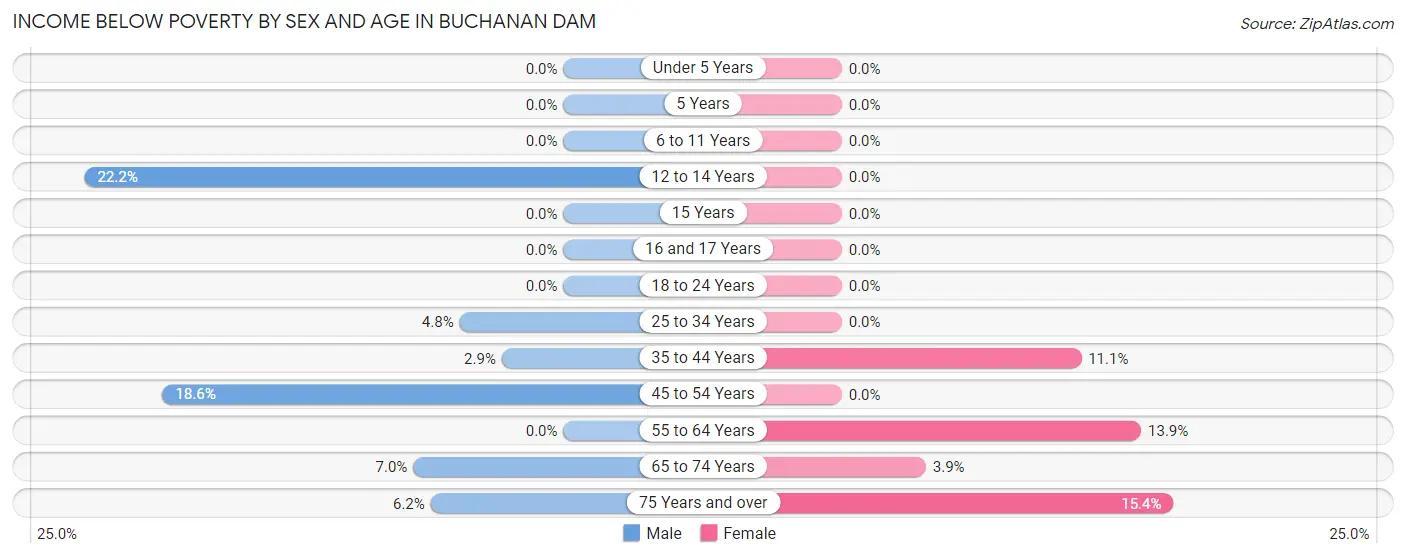
| Age Bracket | Male | Female |
| Under 5 Years | 0 (0.0%) | 0 (0.0%) |
| 5 Years | 0 (0.0%) | 0 (0.0%) |
| 6 to 11 Years | 0 (0.0%) | 0 (0.0%) |
| 12 to 14 Years | 2 (22.2%) | 0 (0.0%) |
| 15 Years | 0 (0.0%) | 0 (0.0%) |
| 16 and 17 Years | 0 (0.0%) | 0 (0.0%) |
| 18 to 24 Years | 0 (0.0%) | 0 (0.0%) |
| 25 to 34 Years | 4 (4.8%) | 0 (0.0%) |
| 35 to 44 Years | 1 (2.9%) | 5 (11.1%) |
| 45 to 54 Years | 8 (18.6%) | 0 (0.0%) |
| 55 to 64 Years | 0 (0.0%) | 15 (13.9%) |
| 65 to 74 Years | 17 (7.0%) | 8 (3.9%) |
| 75 Years and over | 9 (6.2%) | 10 (15.4%) |
| Total | 41 (5.7%) | 38 (6.9%) |
Income Above Poverty by Sex and Age in Buchanan Dam
According to the poverty statistics in Buchanan Dam, males aged 6 to 11 years and females aged under 5 years are the age groups that are most secure financially, with 100.0% of males and 100.0% of females in these age groups living above the poverty line.
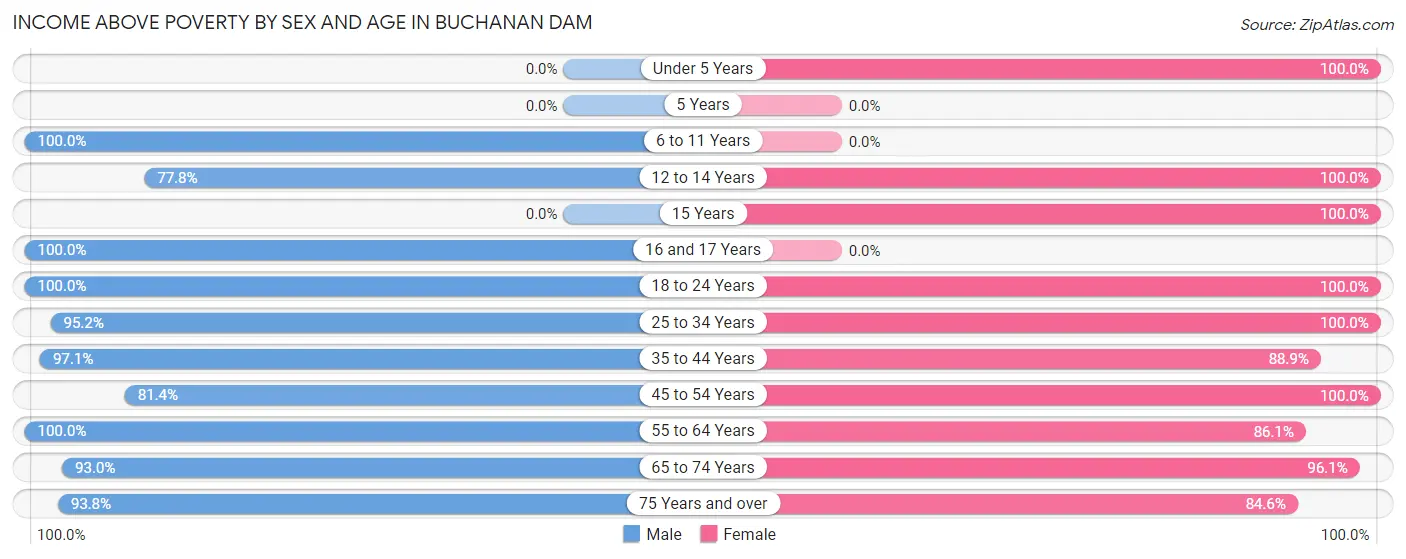
| Age Bracket | Male | Female |
| Under 5 Years | 0 (0.0%) | 41 (100.0%) |
| 5 Years | 0 (0.0%) | 0 (0.0%) |
| 6 to 11 Years | 52 (100.0%) | 0 (0.0%) |
| 12 to 14 Years | 7 (77.8%) | 6 (100.0%) |
| 15 Years | 0 (0.0%) | 11 (100.0%) |
| 16 and 17 Years | 12 (100.0%) | 0 (0.0%) |
| 18 to 24 Years | 15 (100.0%) | 9 (100.0%) |
| 25 to 34 Years | 79 (95.2%) | 13 (100.0%) |
| 35 to 44 Years | 34 (97.1%) | 40 (88.9%) |
| 45 to 54 Years | 35 (81.4%) | 45 (100.0%) |
| 55 to 64 Years | 87 (100.0%) | 93 (86.1%) |
| 65 to 74 Years | 227 (93.0%) | 197 (96.1%) |
| 75 Years and over | 137 (93.8%) | 55 (84.6%) |
| Total | 685 (94.4%) | 510 (93.1%) |
Income Below Poverty Among Married-Couple Families in Buchanan Dam
The poverty statistics for married-couple families in Buchanan Dam show that 5.2% or 21 of the total 404 families live below the poverty line. Families with 1 or 2 children have the highest poverty rate of 5.9%, comprising of 1 families. On the other hand, families with 3 or 4 children have the lowest poverty rate of 0.0%, which includes 0 families.
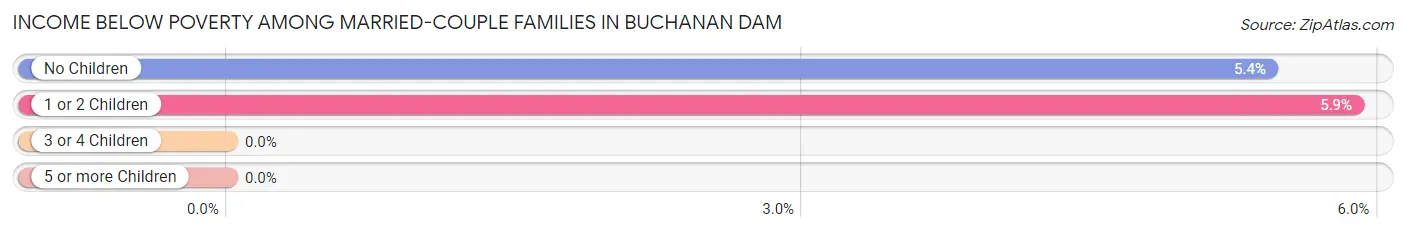
| Children | Above Poverty | Below Poverty |
| No Children | 348 (94.6%) | 20 (5.4%) |
| 1 or 2 Children | 16 (94.1%) | 1 (5.9%) |
| 3 or 4 Children | 19 (100.0%) | 0 (0.0%) |
| 5 or more Children | 0 (0.0%) | 0 (0.0%) |
| Total | 383 (94.8%) | 21 (5.2%) |
Income Below Poverty Among Single-Parent Households in Buchanan Dam
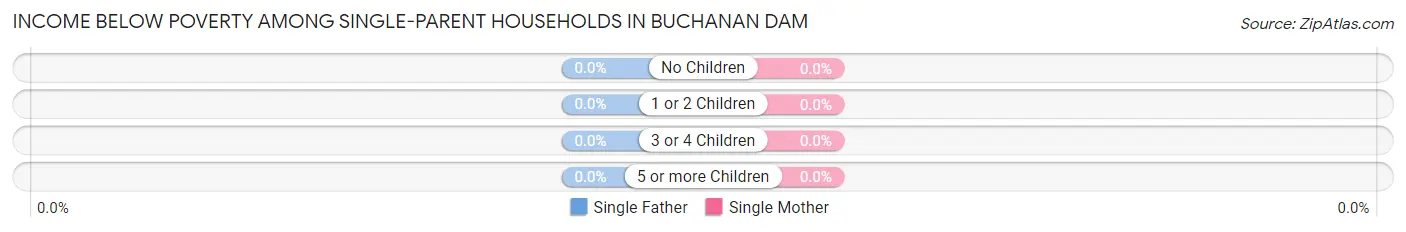
| Children | Single Father | Single Mother |
| No Children | 0 (0.0%) | 0 (0.0%) |
| 1 or 2 Children | 0 (0.0%) | 0 (0.0%) |
| 3 or 4 Children | 0 (0.0%) | 0 (0.0%) |
| 5 or more Children | 0 (0.0%) | 0 (0.0%) |
| Total | 0 (0.0%) | 0 (0.0%) |
Income Below Poverty Among Married-Couple vs Single-Parent Households in Buchanan Dam
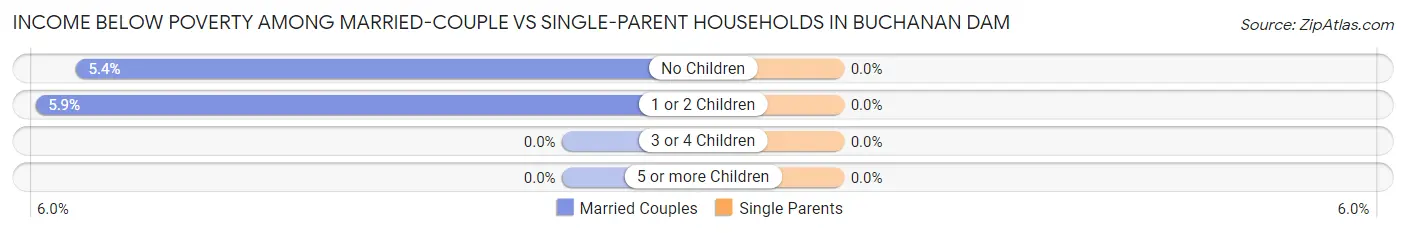
| Children | Married-Couple Families | Single-Parent Households |
| No Children | 20 (5.4%) | 0 (0.0%) |
| 1 or 2 Children | 1 (5.9%) | 0 (0.0%) |
| 3 or 4 Children | 0 (0.0%) | 0 (0.0%) |
| 5 or more Children | 0 (0.0%) | 0 (0.0%) |
| Total | 21 (5.2%) | 0 (0.0%) |
Employment Characteristics in Buchanan Dam
Employment by Class of Employer in Buchanan Dam
Among the 476 employed individuals in Buchanan Dam, private company employees (288 | 60.5%), self-employed (not incorporated) (87 | 18.3%), and self-employed (incorporated) (35 | 7.3%) make up the most common classes of employment.
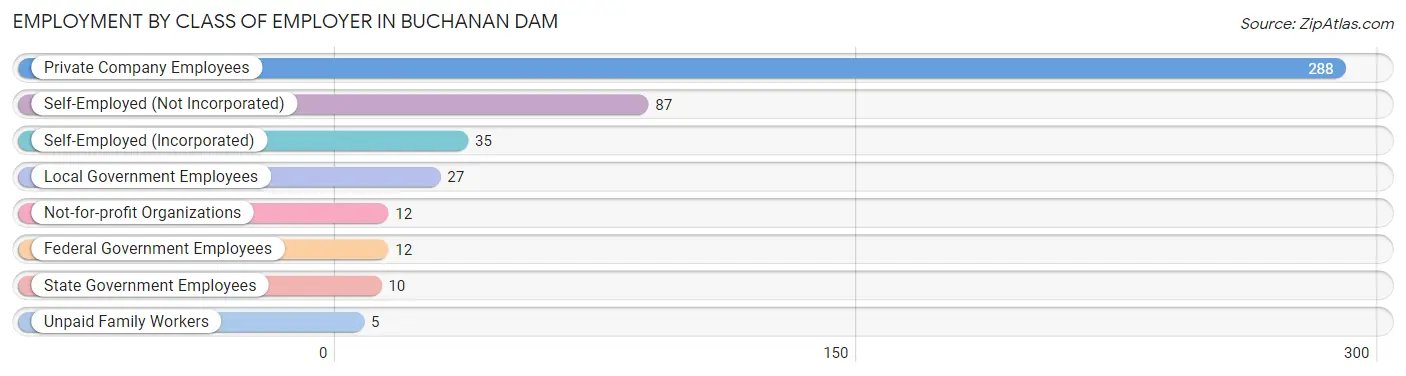
| Employer Class | # Employees | % Employees |
| Private Company Employees | 288 | 60.5% |
| Self-Employed (Incorporated) | 35 | 7.3% |
| Self-Employed (Not Incorporated) | 87 | 18.3% |
| Not-for-profit Organizations | 12 | 2.5% |
| Local Government Employees | 27 | 5.7% |
| State Government Employees | 10 | 2.1% |
| Federal Government Employees | 12 | 2.5% |
| Unpaid Family Workers | 5 | 1.1% |
| Total | 476 | 100.0% |
Employment Status by Age in Buchanan Dam
According to the labor force statistics for Buchanan Dam, out of the total population over 16 years of age (1,155), 42.6% or 492 individuals are in the labor force, with 0.2% or 1 of them unemployed. The age group with the highest labor force participation rate is 20 to 24 years, with 100.0% or 24 individuals in the labor force. Within the labor force, the 35 to 44 years age range has the highest percentage of unemployed individuals, with 1.9% or 1 of them being unemployed.
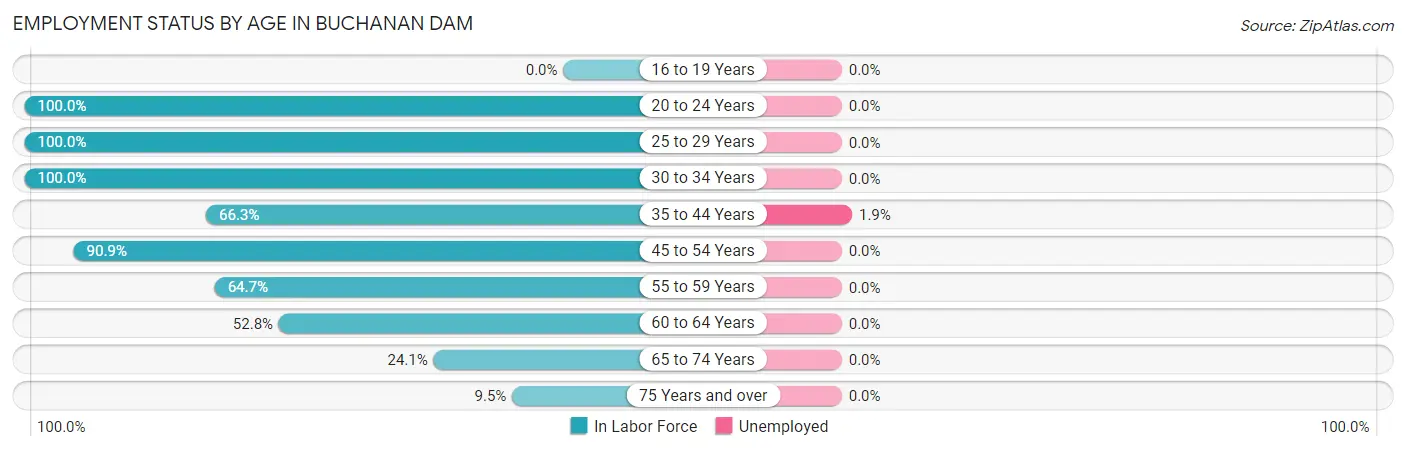
| Age Bracket | In Labor Force | Unemployed |
| 16 to 19 Years | 0 (0.0%) | 0 (0.0%) |
| 20 to 24 Years | 24 (100.0%) | 0 (0.0%) |
| 25 to 29 Years | 37 (100.0%) | 0 (0.0%) |
| 30 to 34 Years | 59 (100.0%) | 0 (0.0%) |
| 35 to 44 Years | 53 (66.3%) | 1 (1.9%) |
| 45 to 54 Years | 80 (90.9%) | 0 (0.0%) |
| 55 to 59 Years | 44 (64.7%) | 0 (0.0%) |
| 60 to 64 Years | 67 (52.8%) | 0 (0.0%) |
| 65 to 74 Years | 108 (24.1%) | 0 (0.0%) |
| 75 Years and over | 20 (9.5%) | 0 (0.0%) |
| Total | 492 (42.6%) | 1 (0.2%) |
Employment Status by Educational Attainment in Buchanan Dam
According to labor force statistics for Buchanan Dam, 74.1% of individuals (340) out of the total population between 25 and 64 years of age (459) are in the labor force, with 0.3% or 1 of them being unemployed. The group with the highest labor force participation rate are those with the educational attainment of bachelor's degree or higher, with 90.5% or 67 individuals in the labor force. Within the labor force, individuals with high school diploma education have the highest percentage of unemployment, with 0.6% or 1 of them being unemployed.
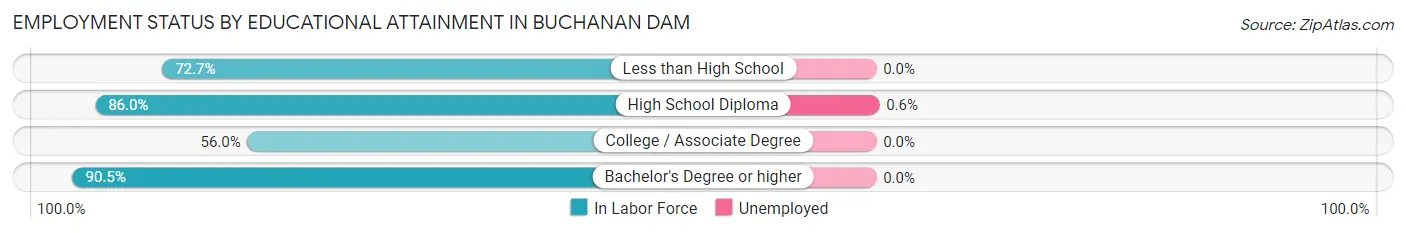
| Educational Attainment | In Labor Force | Unemployed |
| Less than High School | 16 (72.7%) | 0 (0.0%) |
| High School Diploma | 154 (86.0%) | 1 (0.6%) |
| College / Associate Degree | 103 (56.0%) | 0 (0.0%) |
| Bachelor's Degree or higher | 67 (90.5%) | 0 (0.0%) |
| Total | 340 (74.1%) | 1 (0.3%) |
Employment Occupations by Sex in Buchanan Dam
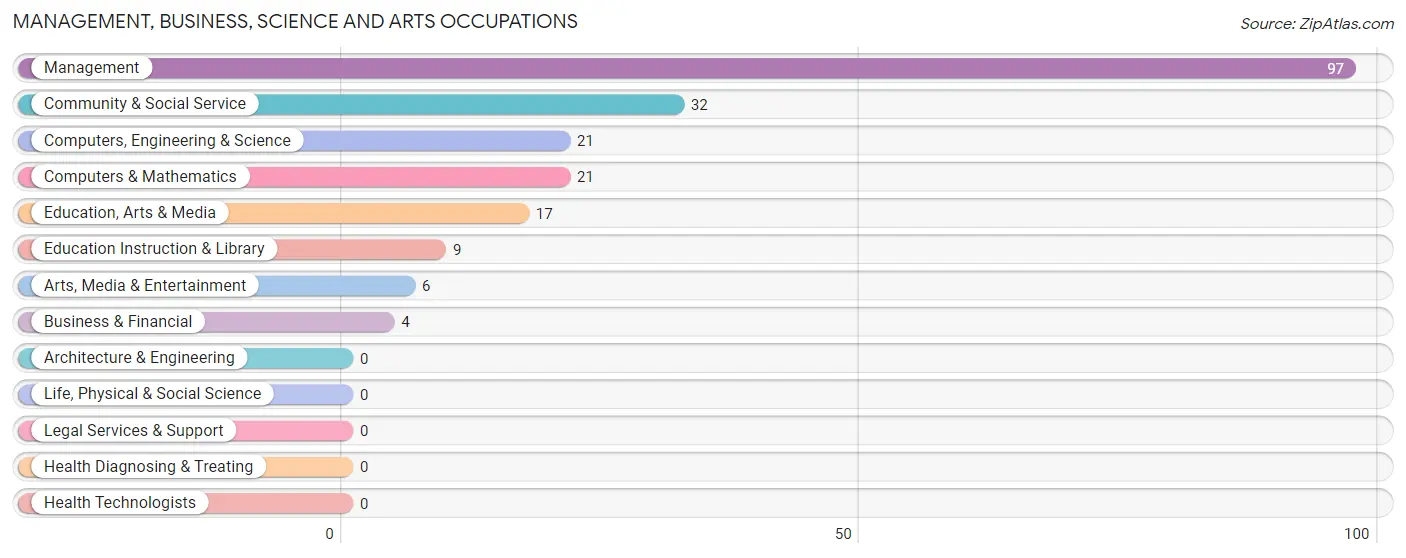
Management, Business, Science and Arts Occupations
The most common Management, Business, Science and Arts occupations in Buchanan Dam are Management (97 | 19.8%), Community & Social Service (32 | 6.5%), Computers, Engineering & Science (21 | 4.3%), Computers & Mathematics (21 | 4.3%), and Education, Arts & Media (17 | 3.5%).
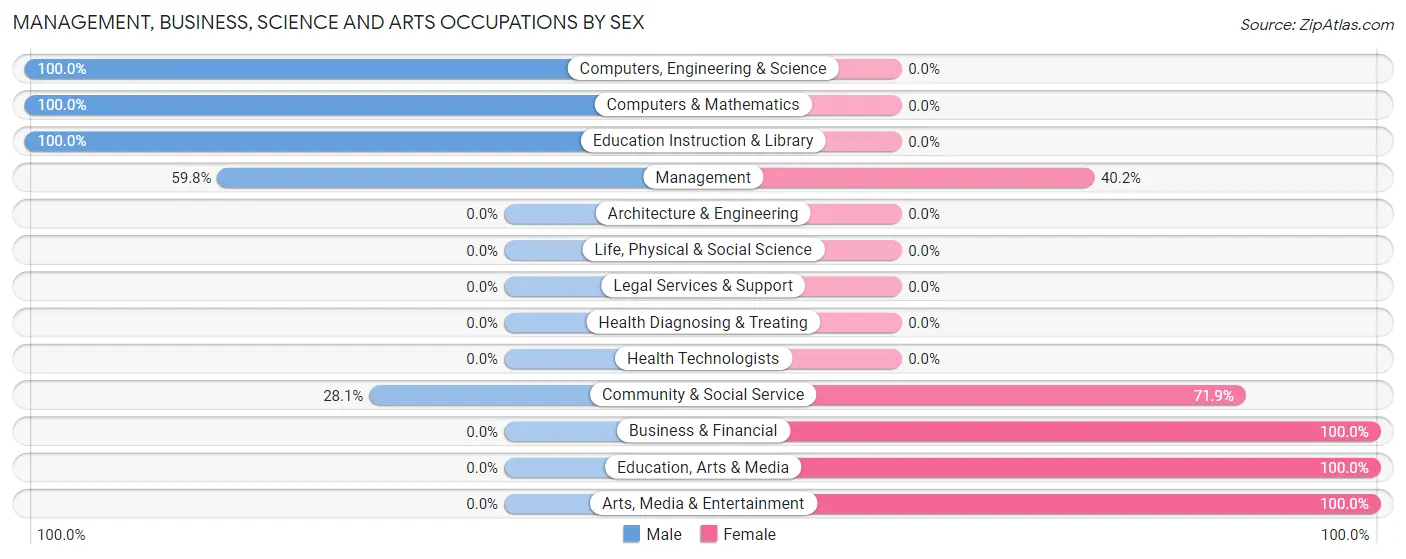
Management, Business, Science and Arts Occupations by Sex
Within the Management, Business, Science and Arts occupations in Buchanan Dam, the most male-oriented occupations are Computers, Engineering & Science (100.0%), Computers & Mathematics (100.0%), and Education Instruction & Library (100.0%), while the most female-oriented occupations are Business & Financial (100.0%), Education, Arts & Media (100.0%), and Arts, Media & Entertainment (100.0%).
| Occupation | Male | Female |
| Management | 58 (59.8%) | 39 (40.2%) |
| Business & Financial | 0 (0.0%) | 4 (100.0%) |
| Computers, Engineering & Science | 21 (100.0%) | 0 (0.0%) |
| Computers & Mathematics | 21 (100.0%) | 0 (0.0%) |
| Architecture & Engineering | 0 (0.0%) | 0 (0.0%) |
| Life, Physical & Social Science | 0 (0.0%) | 0 (0.0%) |
| Community & Social Service | 9 (28.1%) | 23 (71.9%) |
| Education, Arts & Media | 0 (0.0%) | 17 (100.0%) |
| Legal Services & Support | 0 (0.0%) | 0 (0.0%) |
| Education Instruction & Library | 9 (100.0%) | 0 (0.0%) |
| Arts, Media & Entertainment | 0 (0.0%) | 6 (100.0%) |
| Health Diagnosing & Treating | 0 (0.0%) | 0 (0.0%) |
| Health Technologists | 0 (0.0%) | 0 (0.0%) |
| Total (Category) | 88 (57.1%) | 66 (42.9%) |
| Total (Overall) | 316 (64.4%) | 175 (35.6%) |
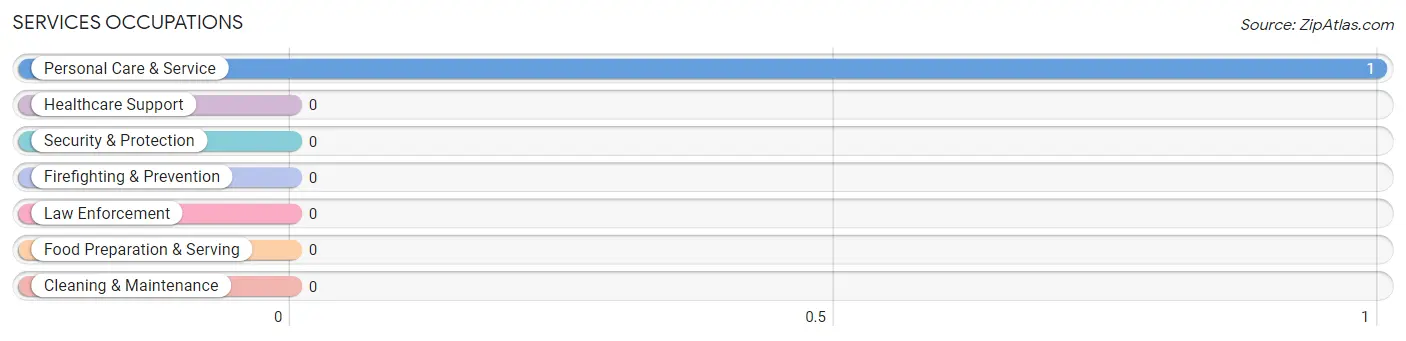
Services Occupations
The most common Services occupations in Buchanan Dam are , and Personal Care & Service (1 | 0.2%).
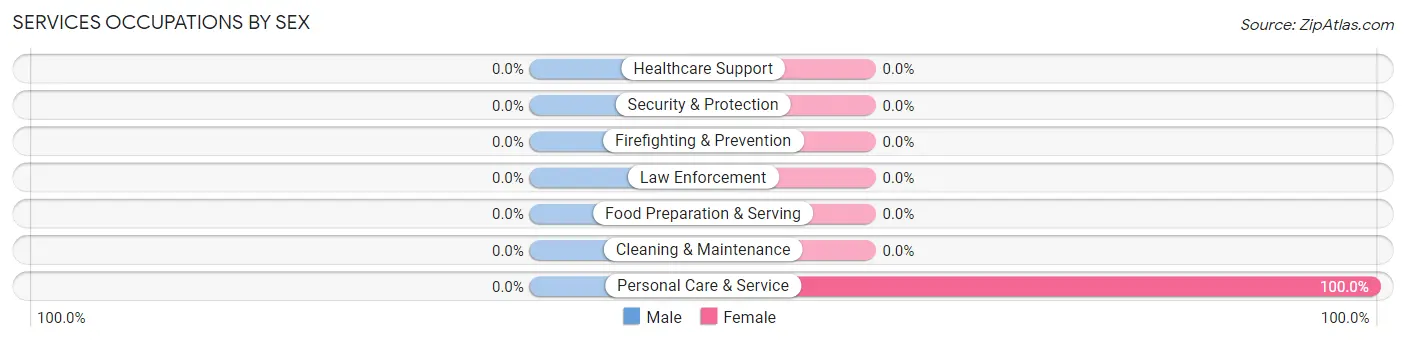
Services Occupations by Sex
| Occupation | Male | Female |
| Healthcare Support | 0 (0.0%) | 0 (0.0%) |
| Security & Protection | 0 (0.0%) | 0 (0.0%) |
| Firefighting & Prevention | 0 (0.0%) | 0 (0.0%) |
| Law Enforcement | 0 (0.0%) | 0 (0.0%) |
| Food Preparation & Serving | 0 (0.0%) | 0 (0.0%) |
| Cleaning & Maintenance | 0 (0.0%) | 0 (0.0%) |
| Personal Care & Service | 0 (0.0%) | 1 (100.0%) |
| Total (Category) | 0 (0.0%) | 1 (100.0%) |
| Total (Overall) | 316 (64.4%) | 175 (35.6%) |
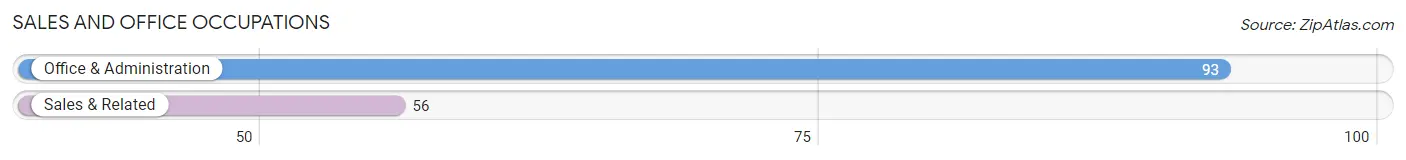
Sales and Office Occupations
The most common Sales and Office occupations in Buchanan Dam are Office & Administration (93 | 18.9%), and Sales & Related (56 | 11.4%).
Sales and Office Occupations by Sex
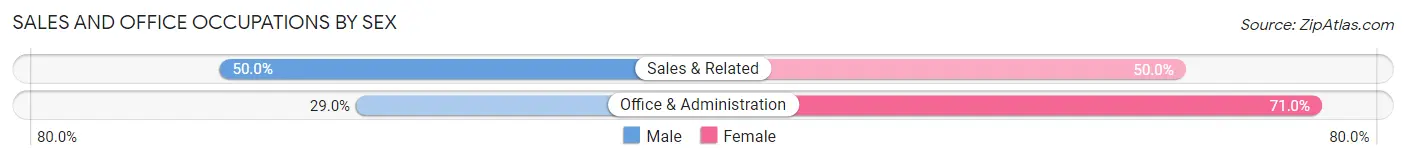
| Occupation | Male | Female |
| Sales & Related | 28 (50.0%) | 28 (50.0%) |
| Office & Administration | 27 (29.0%) | 66 (71.0%) |
| Total (Category) | 55 (36.9%) | 94 (63.1%) |
| Total (Overall) | 316 (64.4%) | 175 (35.6%) |
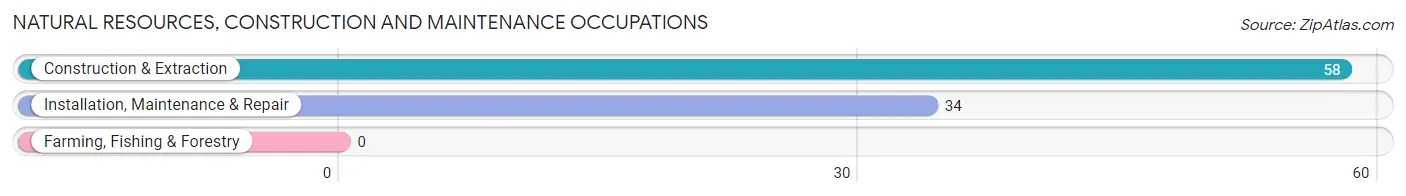
Natural Resources, Construction and Maintenance Occupations
The most common Natural Resources, Construction and Maintenance occupations in Buchanan Dam are Construction & Extraction (58 | 11.8%), and Installation, Maintenance & Repair (34 | 6.9%).
Natural Resources, Construction and Maintenance Occupations by Sex
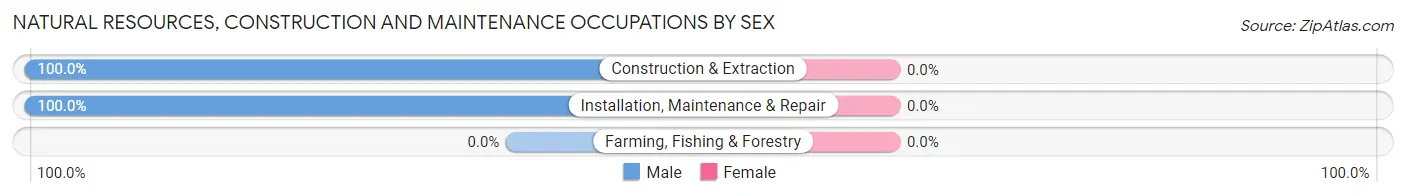
| Occupation | Male | Female |
| Farming, Fishing & Forestry | 0 (0.0%) | 0 (0.0%) |
| Construction & Extraction | 58 (100.0%) | 0 (0.0%) |
| Installation, Maintenance & Repair | 34 (100.0%) | 0 (0.0%) |
| Total (Category) | 92 (100.0%) | 0 (0.0%) |
| Total (Overall) | 316 (64.4%) | 175 (35.6%) |
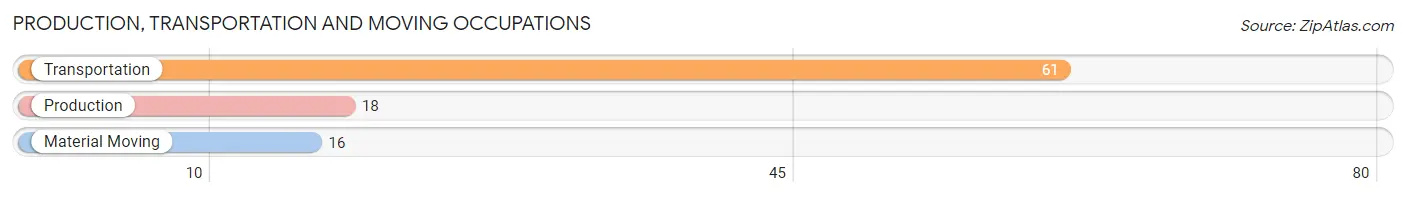
Production, Transportation and Moving Occupations
The most common Production, Transportation and Moving occupations in Buchanan Dam are Transportation (61 | 12.4%), Production (18 | 3.7%), and Material Moving (16 | 3.3%).
Production, Transportation and Moving Occupations by Sex
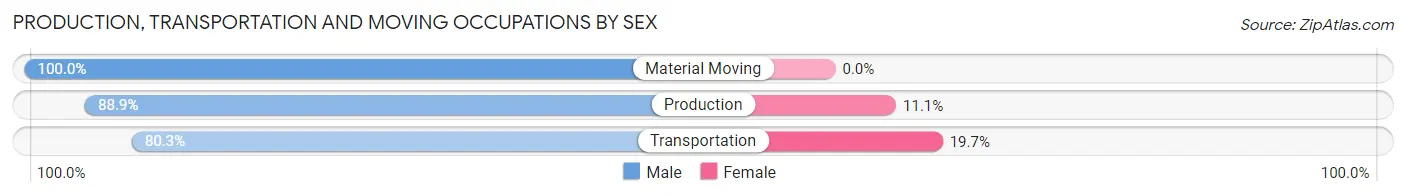
| Occupation | Male | Female |
| Production | 16 (88.9%) | 2 (11.1%) |
| Transportation | 49 (80.3%) | 12 (19.7%) |
| Material Moving | 16 (100.0%) | 0 (0.0%) |
| Total (Category) | 81 (85.3%) | 14 (14.7%) |
| Total (Overall) | 316 (64.4%) | 175 (35.6%) |
Employment Industries by Sex in Buchanan Dam
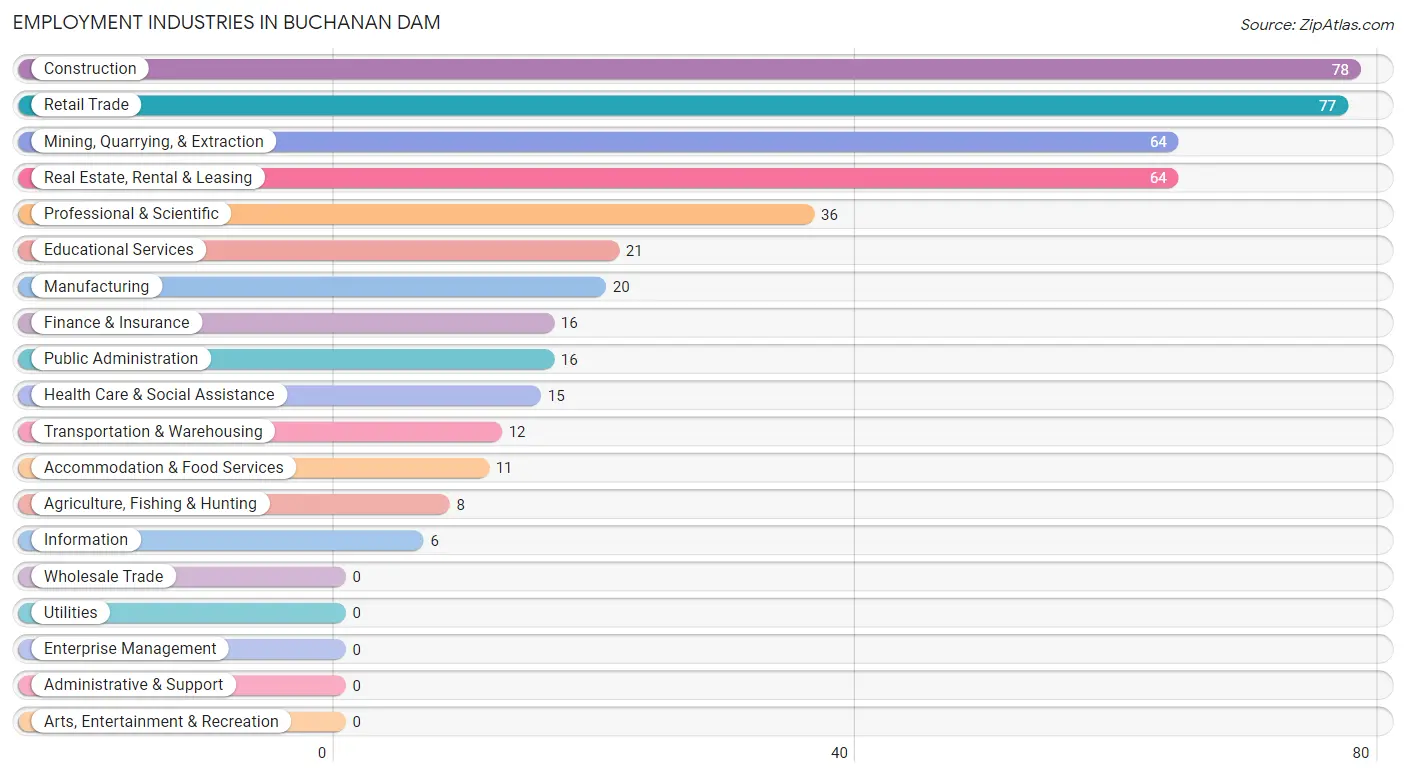
Employment Industries in Buchanan Dam
The major employment industries in Buchanan Dam include Construction (78 | 15.9%), Retail Trade (77 | 15.7%), Mining, Quarrying, & Extraction (64 | 13.0%), Real Estate, Rental & Leasing (64 | 13.0%), and Professional & Scientific (36 | 7.3%).
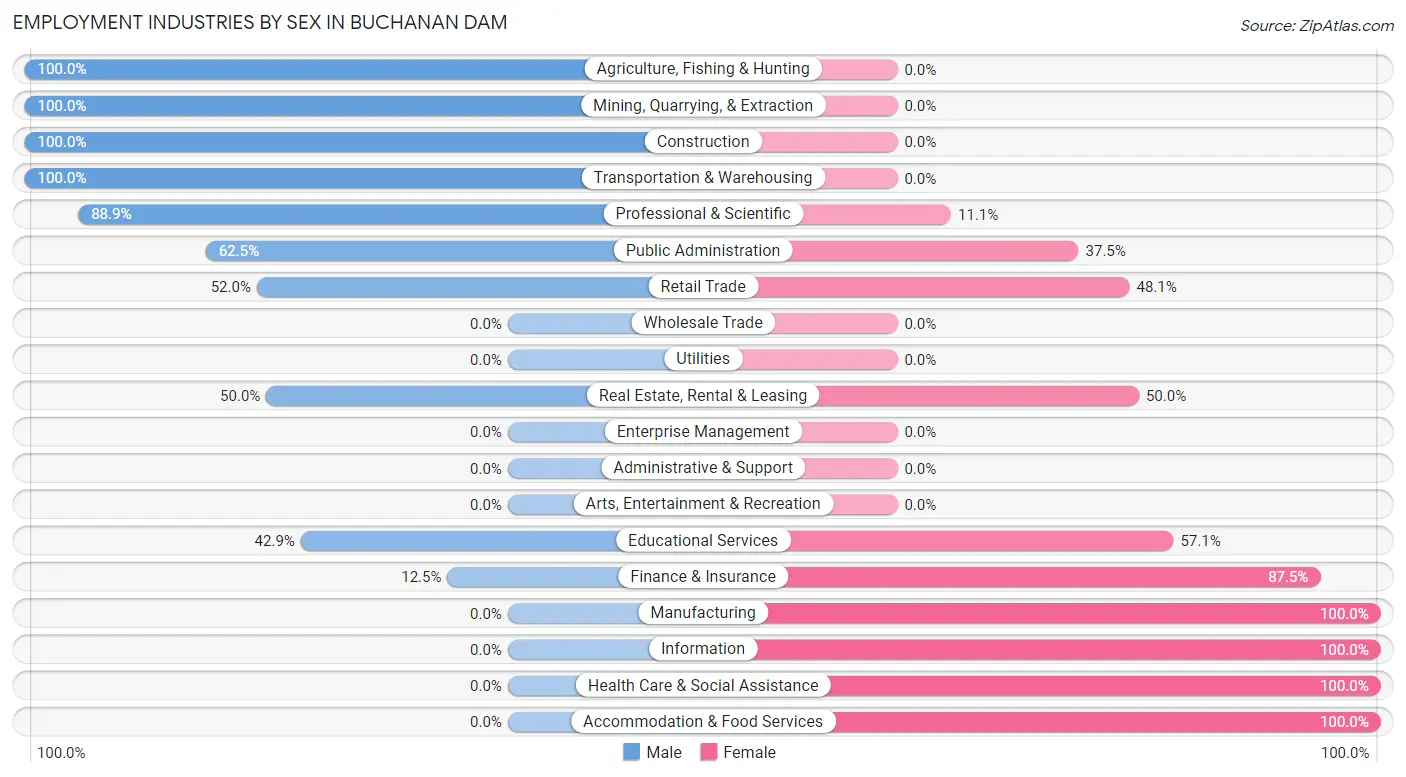
Employment Industries by Sex in Buchanan Dam
The Buchanan Dam industries that see more men than women are Agriculture, Fishing & Hunting (100.0%), Mining, Quarrying, & Extraction (100.0%), and Construction (100.0%), whereas the industries that tend to have a higher number of women are Manufacturing (100.0%), Information (100.0%), and Health Care & Social Assistance (100.0%).
| Industry | Male | Female |
| Agriculture, Fishing & Hunting | 8 (100.0%) | 0 (0.0%) |
| Mining, Quarrying, & Extraction | 64 (100.0%) | 0 (0.0%) |
| Construction | 78 (100.0%) | 0 (0.0%) |
| Manufacturing | 0 (0.0%) | 20 (100.0%) |
| Wholesale Trade | 0 (0.0%) | 0 (0.0%) |
| Retail Trade | 40 (51.9%) | 37 (48.0%) |
| Transportation & Warehousing | 12 (100.0%) | 0 (0.0%) |
| Utilities | 0 (0.0%) | 0 (0.0%) |
| Information | 0 (0.0%) | 6 (100.0%) |
| Finance & Insurance | 2 (12.5%) | 14 (87.5%) |
| Real Estate, Rental & Leasing | 32 (50.0%) | 32 (50.0%) |
| Professional & Scientific | 32 (88.9%) | 4 (11.1%) |
| Enterprise Management | 0 (0.0%) | 0 (0.0%) |
| Administrative & Support | 0 (0.0%) | 0 (0.0%) |
| Educational Services | 9 (42.9%) | 12 (57.1%) |
| Health Care & Social Assistance | 0 (0.0%) | 15 (100.0%) |
| Arts, Entertainment & Recreation | 0 (0.0%) | 0 (0.0%) |
| Accommodation & Food Services | 0 (0.0%) | 11 (100.0%) |
| Public Administration | 10 (62.5%) | 6 (37.5%) |
| Total | 316 (64.4%) | 175 (35.6%) |
Education in Buchanan Dam
School Enrollment in Buchanan Dam
The most common levels of schooling among the 114 students in Buchanan Dam are middle school (44 | 38.6%), elementary school (23 | 20.2%), and high school (23 | 20.2%).
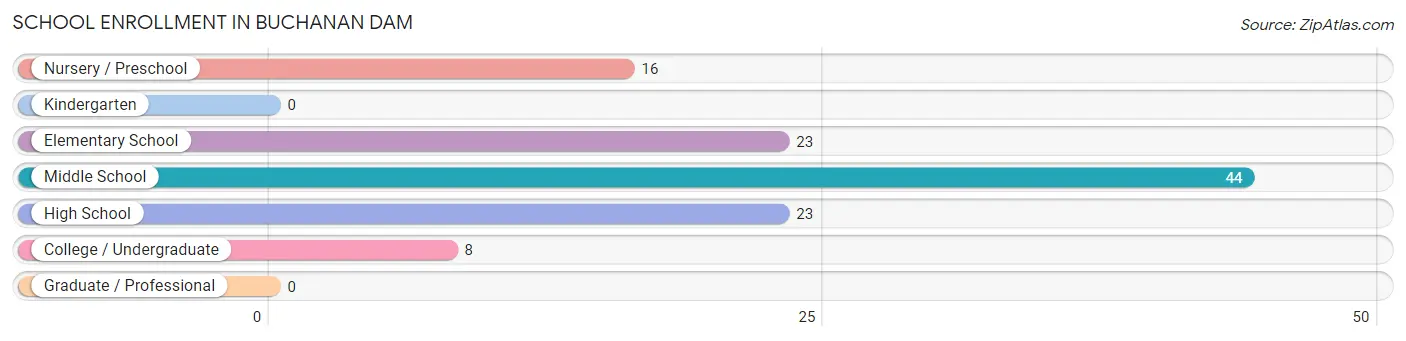
| School Level | # Students | % Students |
| Nursery / Preschool | 16 | 14.0% |
| Kindergarten | 0 | 0.0% |
| Elementary School | 23 | 20.2% |
| Middle School | 44 | 38.6% |
| High School | 23 | 20.2% |
| College / Undergraduate | 8 | 7.0% |
| Graduate / Professional | 0 | 0.0% |
| Total | 114 | 100.0% |
School Enrollment by Age by Funding Source in Buchanan Dam
Out of a total of 114 students who are enrolled in schools in Buchanan Dam, 7 (6.1%) attend a private institution, while the remaining 107 (93.9%) are enrolled in public schools. The age group of 10 to 14 year olds has the highest likelihood of being enrolled in private schools, with 7 (15.9% in the age bracket) enrolled. Conversely, the age group of 3 to 4 year olds has the lowest likelihood of being enrolled in a private school, with 16 (100.0% in the age bracket) attending a public institution.
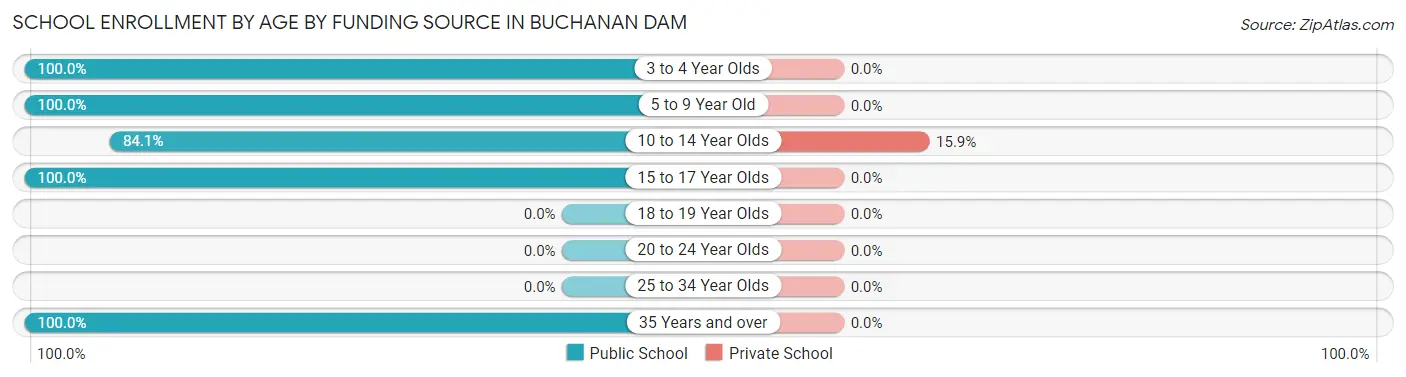
| Age Bracket | Public School | Private School |
| 3 to 4 Year Olds | 16 (100.0%) | 0 (0.0%) |
| 5 to 9 Year Old | 23 (100.0%) | 0 (0.0%) |
| 10 to 14 Year Olds | 37 (84.1%) | 7 (15.9%) |
| 15 to 17 Year Olds | 23 (100.0%) | 0 (0.0%) |
| 18 to 19 Year Olds | 0 (0.0%) | 0 (0.0%) |
| 20 to 24 Year Olds | 0 (0.0%) | 0 (0.0%) |
| 25 to 34 Year Olds | 0 (0.0%) | 0 (0.0%) |
| 35 Years and over | 8 (100.0%) | 0 (0.0%) |
| Total | 107 (93.9%) | 7 (6.1%) |
Educational Attainment by Field of Study in Buchanan Dam
Business (105 | 33.8%), arts & humanities (52 | 16.7%), education (39 | 12.5%), psychology (32 | 10.3%), and multidisciplinary studies (29 | 9.3%) are the most common fields of study among 311 individuals in Buchanan Dam who have obtained a bachelor's degree or higher.
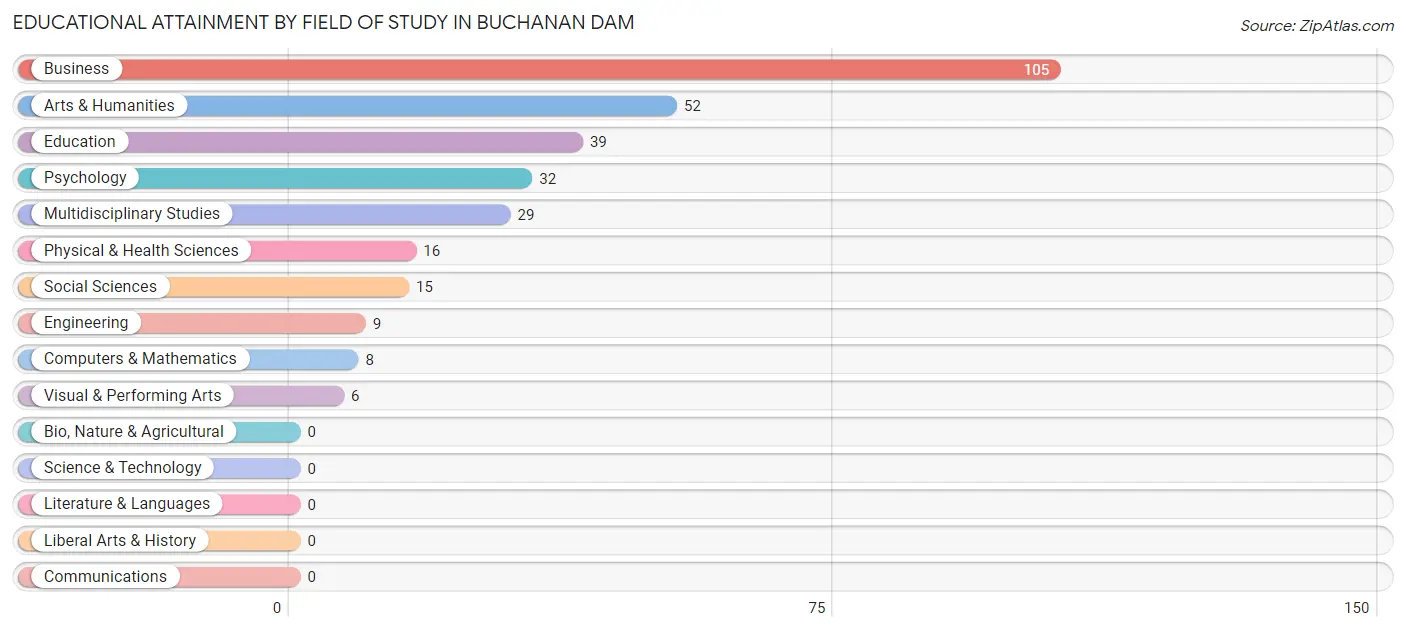
| Field of Study | # Graduates | % Graduates |
| Computers & Mathematics | 8 | 2.6% |
| Bio, Nature & Agricultural | 0 | 0.0% |
| Physical & Health Sciences | 16 | 5.1% |
| Psychology | 32 | 10.3% |
| Social Sciences | 15 | 4.8% |
| Engineering | 9 | 2.9% |
| Multidisciplinary Studies | 29 | 9.3% |
| Science & Technology | 0 | 0.0% |
| Business | 105 | 33.8% |
| Education | 39 | 12.5% |
| Literature & Languages | 0 | 0.0% |
| Liberal Arts & History | 0 | 0.0% |
| Visual & Performing Arts | 6 | 1.9% |
| Communications | 0 | 0.0% |
| Arts & Humanities | 52 | 16.7% |
| Total | 311 | 100.0% |
Transportation & Commute in Buchanan Dam
Vehicle Availability by Sex in Buchanan Dam
The most prevalent vehicle ownership categories in Buchanan Dam are males with 2 vehicles (142, accounting for 47.2%) and females with 2 vehicles (82, making up 81.1%).
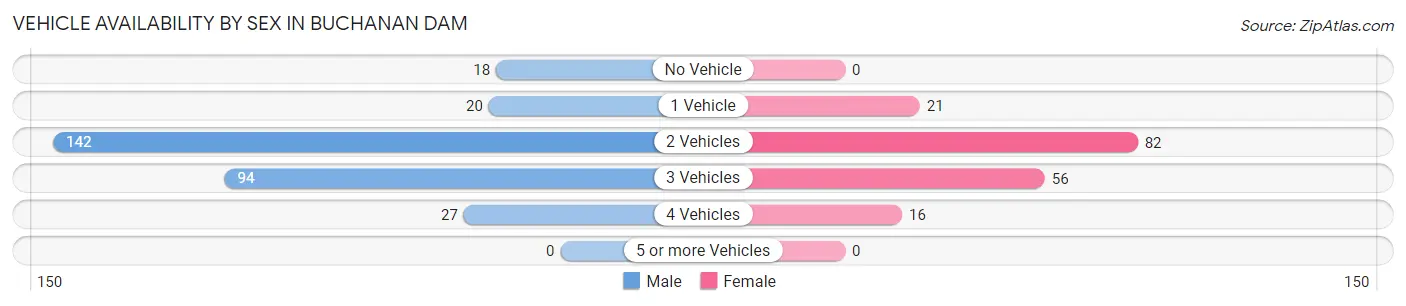
| Vehicles Available | Male | Female |
| No Vehicle | 18 (6.0%) | 0 (0.0%) |
| 1 Vehicle | 20 (6.6%) | 21 (12.0%) |
| 2 Vehicles | 142 (47.2%) | 82 (46.9%) |
| 3 Vehicles | 94 (31.2%) | 56 (32.0%) |
| 4 Vehicles | 27 (9.0%) | 16 (9.1%) |
| 5 or more Vehicles | 0 (0.0%) | 0 (0.0%) |
| Total | 301 (100.0%) | 175 (100.0%) |
Commute Time in Buchanan Dam
The most frequently occuring commute durations in Buchanan Dam are 30 to 34 minutes (163 commuters, 37.2%), 25 to 29 minutes (74 commuters, 16.9%), and 20 to 24 minutes (68 commuters, 15.5%).
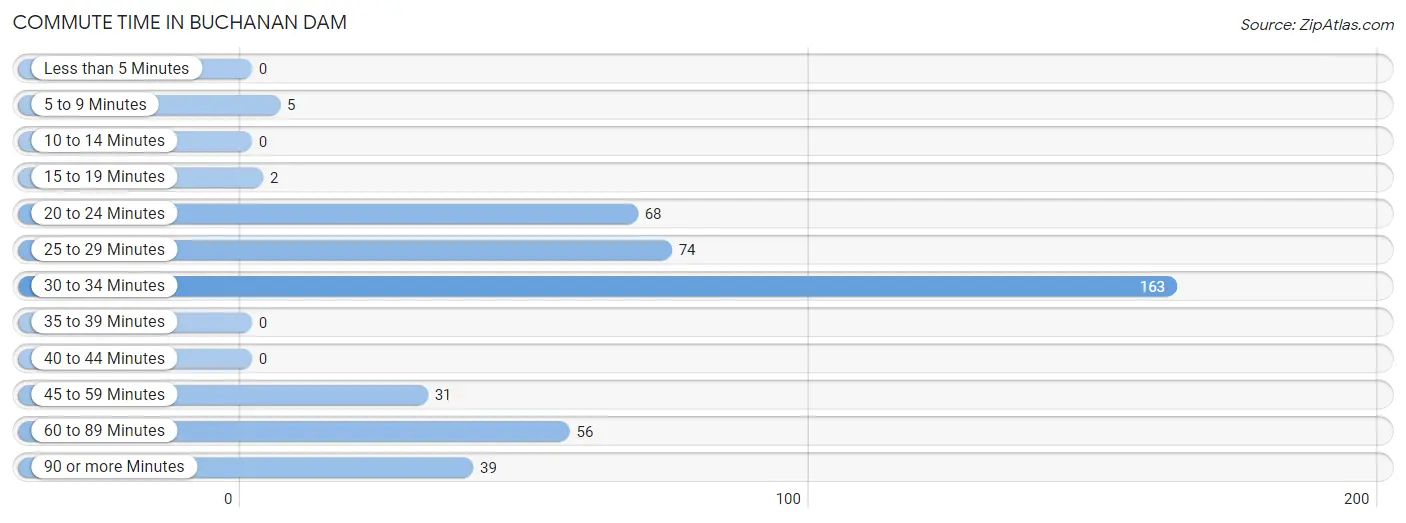
| Commute Time | # Commuters | % Commuters |
| Less than 5 Minutes | 0 | 0.0% |
| 5 to 9 Minutes | 5 | 1.1% |
| 10 to 14 Minutes | 0 | 0.0% |
| 15 to 19 Minutes | 2 | 0.5% |
| 20 to 24 Minutes | 68 | 15.5% |
| 25 to 29 Minutes | 74 | 16.9% |
| 30 to 34 Minutes | 163 | 37.2% |
| 35 to 39 Minutes | 0 | 0.0% |
| 40 to 44 Minutes | 0 | 0.0% |
| 45 to 59 Minutes | 31 | 7.1% |
| 60 to 89 Minutes | 56 | 12.8% |
| 90 or more Minutes | 39 | 8.9% |
Commute Time by Sex in Buchanan Dam
The most common commute times in Buchanan Dam are 30 to 34 minutes (124 commuters, 45.1%) for males and 25 to 29 minutes (39 commuters, 23.9%) for females.
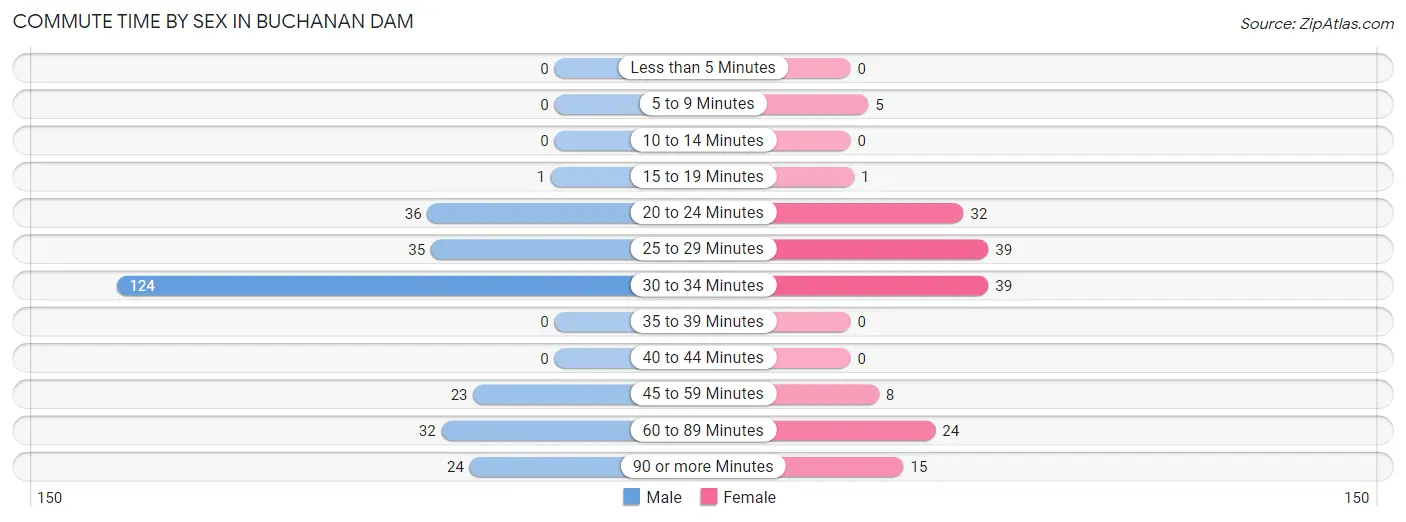
| Commute Time | Male | Female |
| Less than 5 Minutes | 0 (0.0%) | 0 (0.0%) |
| 5 to 9 Minutes | 0 (0.0%) | 5 (3.1%) |
| 10 to 14 Minutes | 0 (0.0%) | 0 (0.0%) |
| 15 to 19 Minutes | 1 (0.4%) | 1 (0.6%) |
| 20 to 24 Minutes | 36 (13.1%) | 32 (19.6%) |
| 25 to 29 Minutes | 35 (12.7%) | 39 (23.9%) |
| 30 to 34 Minutes | 124 (45.1%) | 39 (23.9%) |
| 35 to 39 Minutes | 0 (0.0%) | 0 (0.0%) |
| 40 to 44 Minutes | 0 (0.0%) | 0 (0.0%) |
| 45 to 59 Minutes | 23 (8.4%) | 8 (4.9%) |
| 60 to 89 Minutes | 32 (11.6%) | 24 (14.7%) |
| 90 or more Minutes | 24 (8.7%) | 15 (9.2%) |
Time of Departure to Work by Sex in Buchanan Dam
The most frequent times of departure to work in Buchanan Dam are 7:00 AM to 7:29 AM (69, 25.1%) for males and 7:30 AM to 7:59 AM (36, 22.1%) for females.
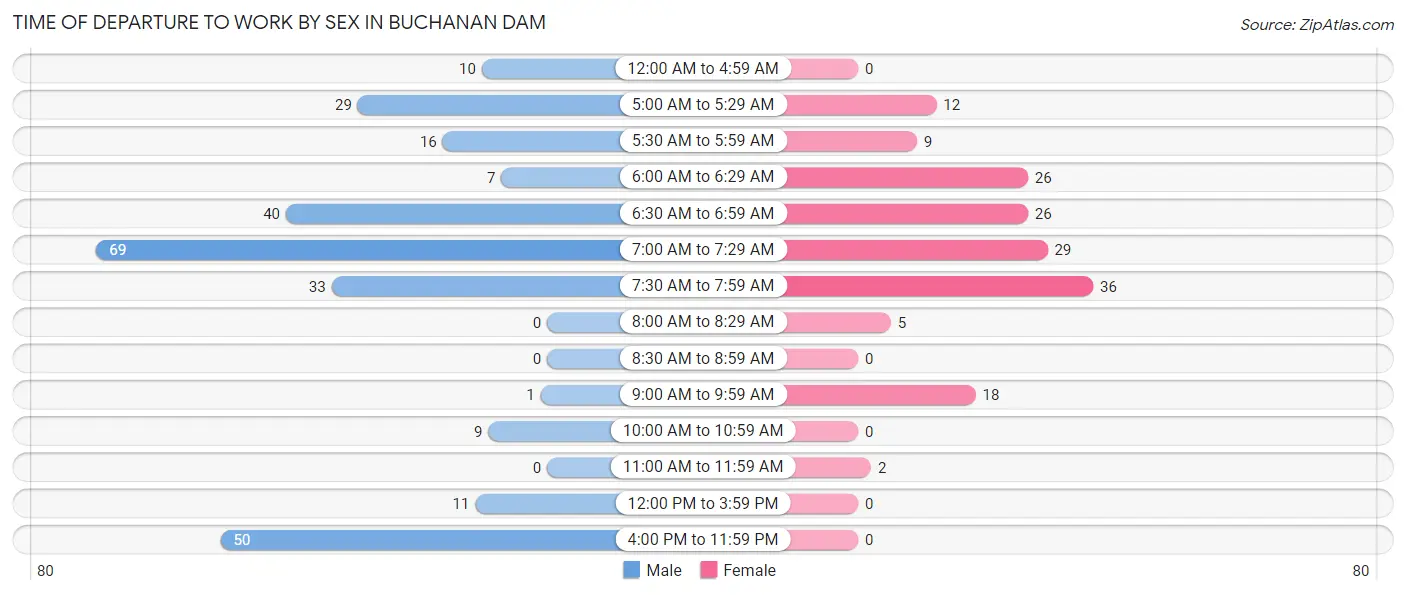
| Time of Departure | Male | Female |
| 12:00 AM to 4:59 AM | 10 (3.6%) | 0 (0.0%) |
| 5:00 AM to 5:29 AM | 29 (10.5%) | 12 (7.4%) |
| 5:30 AM to 5:59 AM | 16 (5.8%) | 9 (5.5%) |
| 6:00 AM to 6:29 AM | 7 (2.5%) | 26 (16.0%) |
| 6:30 AM to 6:59 AM | 40 (14.5%) | 26 (16.0%) |
| 7:00 AM to 7:29 AM | 69 (25.1%) | 29 (17.8%) |
| 7:30 AM to 7:59 AM | 33 (12.0%) | 36 (22.1%) |
| 8:00 AM to 8:29 AM | 0 (0.0%) | 5 (3.1%) |
| 8:30 AM to 8:59 AM | 0 (0.0%) | 0 (0.0%) |
| 9:00 AM to 9:59 AM | 1 (0.4%) | 18 (11.0%) |
| 10:00 AM to 10:59 AM | 9 (3.3%) | 0 (0.0%) |
| 11:00 AM to 11:59 AM | 0 (0.0%) | 2 (1.2%) |
| 12:00 PM to 3:59 PM | 11 (4.0%) | 0 (0.0%) |
| 4:00 PM to 11:59 PM | 50 (18.2%) | 0 (0.0%) |
| Total | 275 (100.0%) | 163 (100.0%) |
Housing Occupancy in Buchanan Dam
Occupancy by Ownership in Buchanan Dam
Of the total 620 dwellings in Buchanan Dam, owner-occupied units account for 504 (81.3%), while renter-occupied units make up 116 (18.7%).
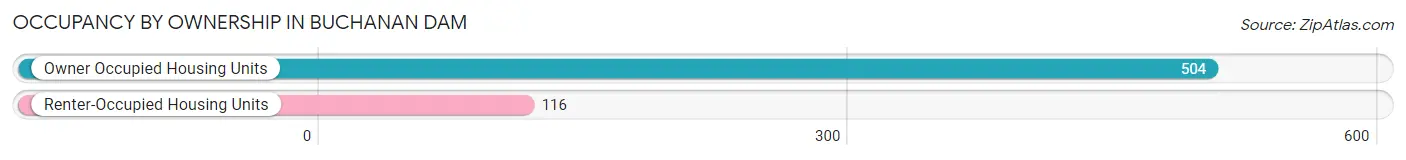
| Occupancy | # Housing Units | % Housing Units |
| Owner Occupied Housing Units | 504 | 81.3% |
| Renter-Occupied Housing Units | 116 | 18.7% |
| Total Occupied Housing Units | 620 | 100.0% |
Occupancy by Household Size in Buchanan Dam
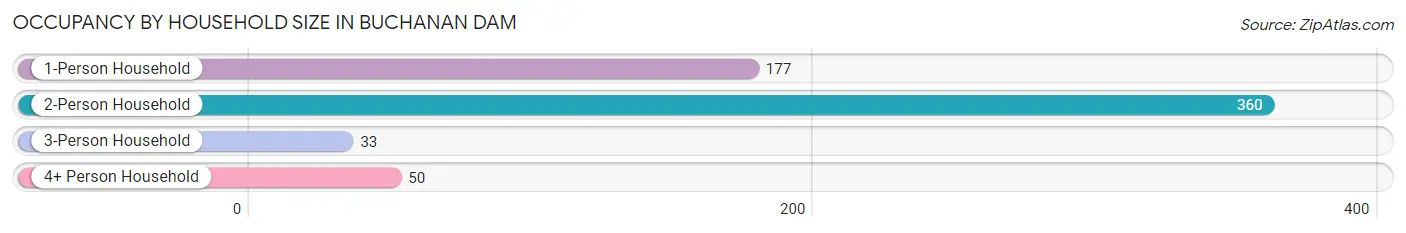
| Household Size | # Housing Units | % Housing Units |
| 1-Person Household | 177 | 28.5% |
| 2-Person Household | 360 | 58.1% |
| 3-Person Household | 33 | 5.3% |
| 4+ Person Household | 50 | 8.1% |
| Total Housing Units | 620 | 100.0% |
Occupancy by Ownership by Household Size in Buchanan Dam
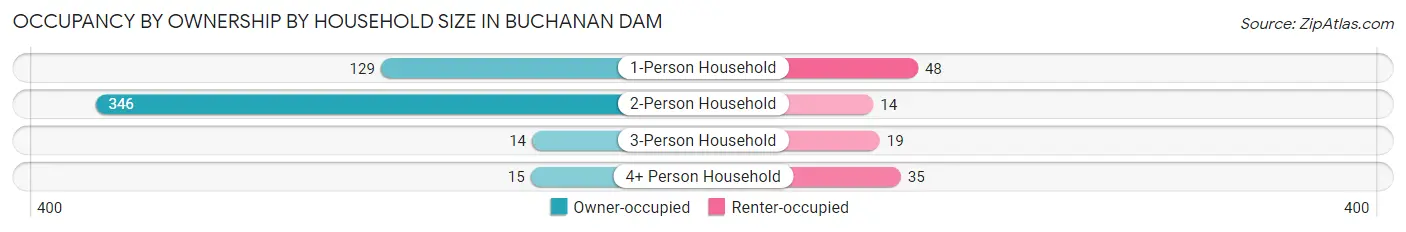
| Household Size | Owner-occupied | Renter-occupied |
| 1-Person Household | 129 (72.9%) | 48 (27.1%) |
| 2-Person Household | 346 (96.1%) | 14 (3.9%) |
| 3-Person Household | 14 (42.4%) | 19 (57.6%) |
| 4+ Person Household | 15 (30.0%) | 35 (70.0%) |
| Total Housing Units | 504 (81.3%) | 116 (18.7%) |
Occupancy by Educational Attainment in Buchanan Dam
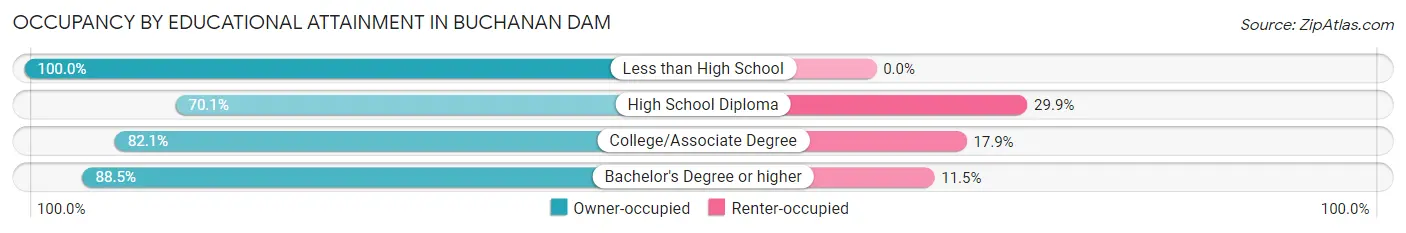
| Household Size | Owner-occupied | Renter-occupied |
| Less than High School | 7 (100.0%) | 0 (0.0%) |
| High School Diploma | 117 (70.1%) | 50 (29.9%) |
| College/Associate Degree | 188 (82.1%) | 41 (17.9%) |
| Bachelor's Degree or higher | 192 (88.5%) | 25 (11.5%) |
Occupancy by Age of Householder in Buchanan Dam
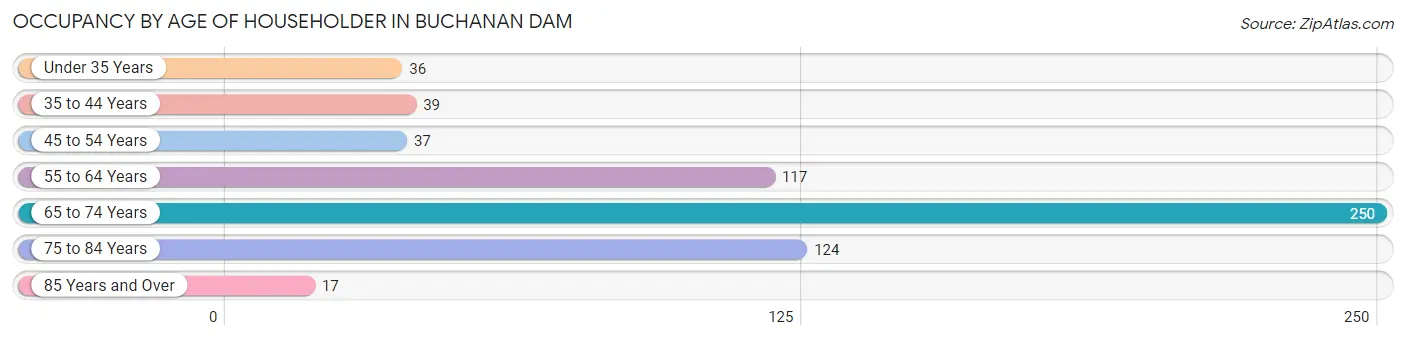
| Age Bracket | # Households | % Households |
| Under 35 Years | 36 | 5.8% |
| 35 to 44 Years | 39 | 6.3% |
| 45 to 54 Years | 37 | 6.0% |
| 55 to 64 Years | 117 | 18.9% |
| 65 to 74 Years | 250 | 40.3% |
| 75 to 84 Years | 124 | 20.0% |
| 85 Years and Over | 17 | 2.7% |
| Total | 620 | 100.0% |
Housing Finances in Buchanan Dam
Median Income by Occupancy in Buchanan Dam
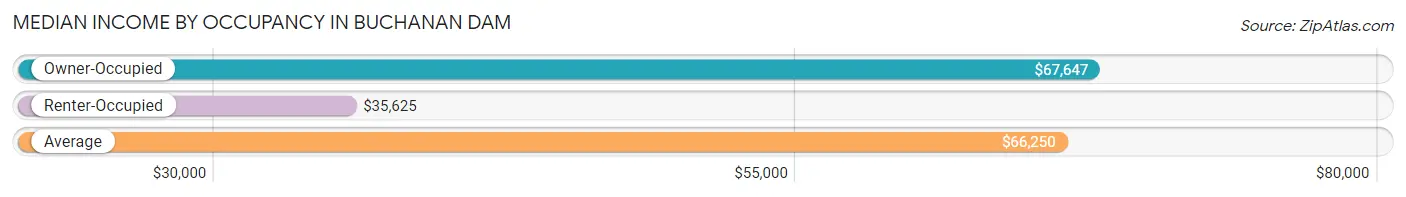
| Occupancy Type | # Households | Median Income |
| Owner-Occupied | 504 (81.3%) | $67,647 |
| Renter-Occupied | 116 (18.7%) | $35,625 |
| Average | 620 (100.0%) | $66,250 |
Occupancy by Householder Income Bracket in Buchanan Dam
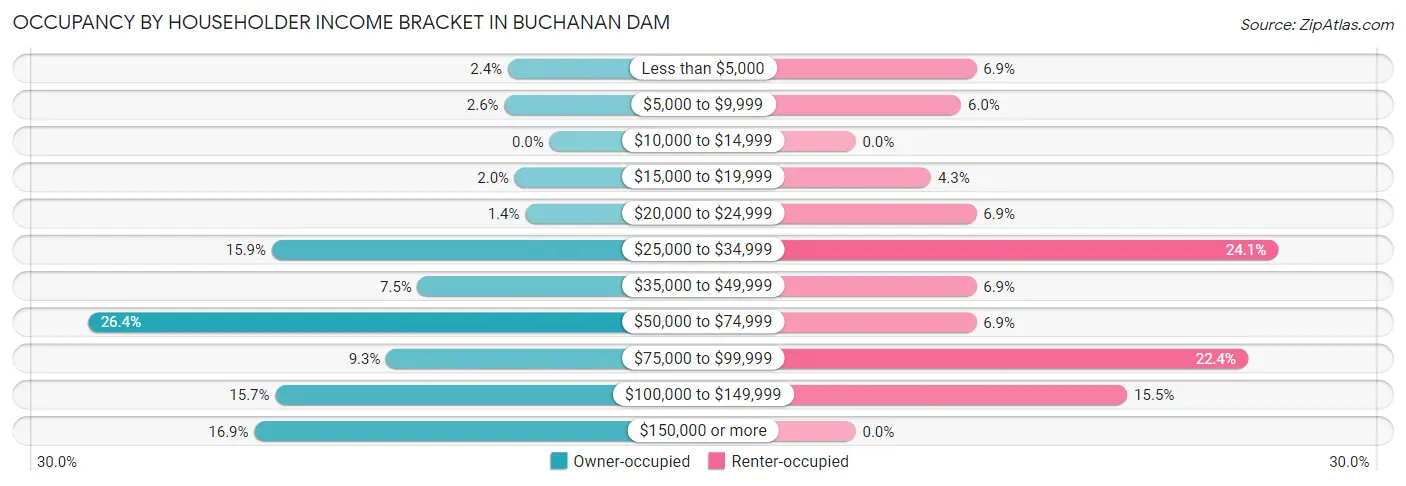
| Income Bracket | Owner-occupied | Renter-occupied |
| Less than $5,000 | 12 (2.4%) | 8 (6.9%) |
| $5,000 to $9,999 | 13 (2.6%) | 7 (6.0%) |
| $10,000 to $14,999 | 0 (0.0%) | 0 (0.0%) |
| $15,000 to $19,999 | 10 (2.0%) | 5 (4.3%) |
| $20,000 to $24,999 | 7 (1.4%) | 8 (6.9%) |
| $25,000 to $34,999 | 80 (15.9%) | 28 (24.1%) |
| $35,000 to $49,999 | 38 (7.5%) | 8 (6.9%) |
| $50,000 to $74,999 | 133 (26.4%) | 8 (6.9%) |
| $75,000 to $99,999 | 47 (9.3%) | 26 (22.4%) |
| $100,000 to $149,999 | 79 (15.7%) | 18 (15.5%) |
| $150,000 or more | 85 (16.9%) | 0 (0.0%) |
| Total | 504 (100.0%) | 116 (100.0%) |
Monthly Housing Cost Tiers in Buchanan Dam
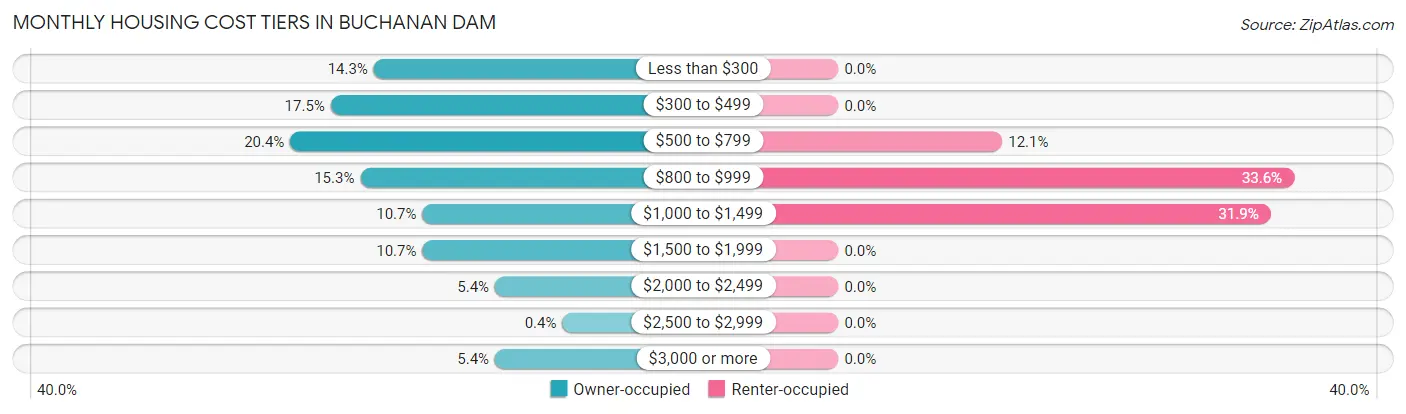
| Monthly Cost | Owner-occupied | Renter-occupied |
| Less than $300 | 72 (14.3%) | 0 (0.0%) |
| $300 to $499 | 88 (17.5%) | 0 (0.0%) |
| $500 to $799 | 103 (20.4%) | 14 (12.1%) |
| $800 to $999 | 77 (15.3%) | 39 (33.6%) |
| $1,000 to $1,499 | 54 (10.7%) | 37 (31.9%) |
| $1,500 to $1,999 | 54 (10.7%) | 0 (0.0%) |
| $2,000 to $2,499 | 27 (5.4%) | 0 (0.0%) |
| $2,500 to $2,999 | 2 (0.4%) | 0 (0.0%) |
| $3,000 or more | 27 (5.4%) | 0 (0.0%) |
| Total | 504 (100.0%) | 116 (100.0%) |
Physical Housing Characteristics in Buchanan Dam
Housing Structures in Buchanan Dam
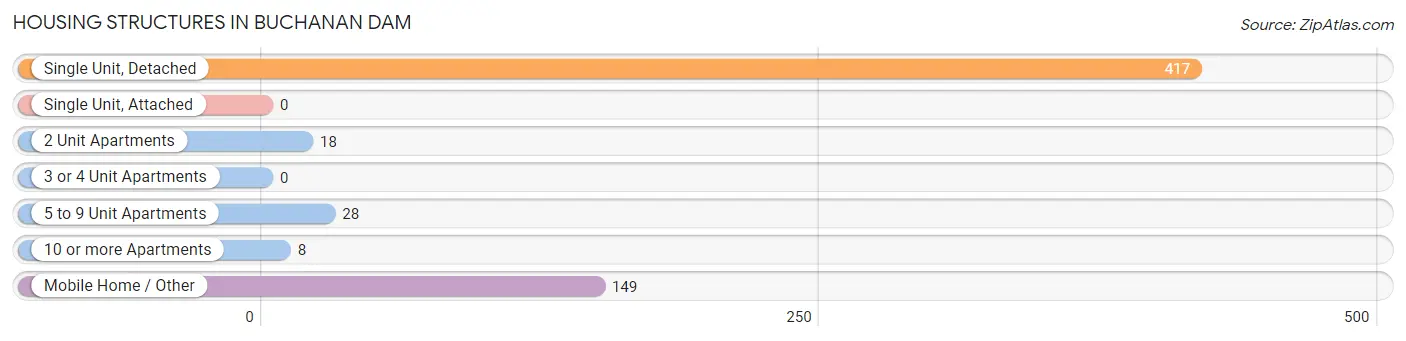
| Structure Type | # Housing Units | % Housing Units |
| Single Unit, Detached | 417 | 67.3% |
| Single Unit, Attached | 0 | 0.0% |
| 2 Unit Apartments | 18 | 2.9% |
| 3 or 4 Unit Apartments | 0 | 0.0% |
| 5 to 9 Unit Apartments | 28 | 4.5% |
| 10 or more Apartments | 8 | 1.3% |
| Mobile Home / Other | 149 | 24.0% |
| Total | 620 | 100.0% |
Housing Structures by Occupancy in Buchanan Dam
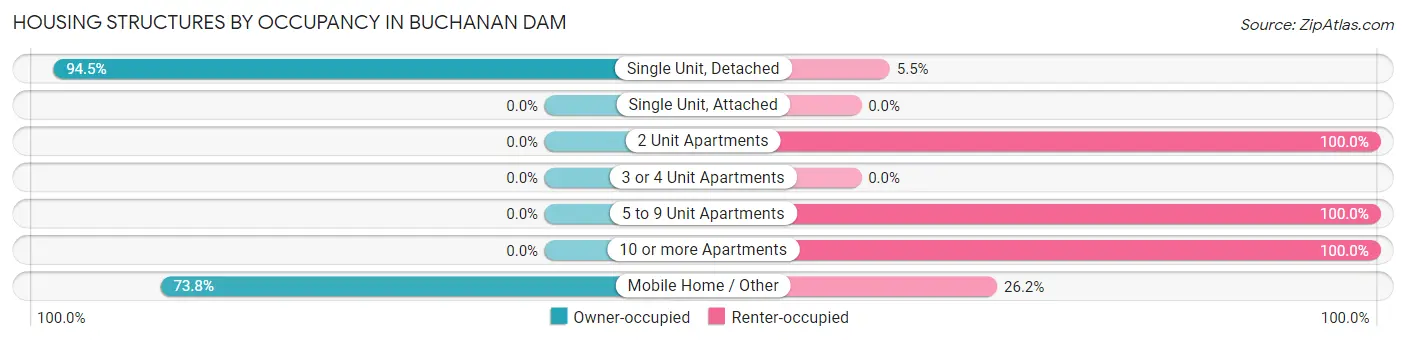
| Structure Type | Owner-occupied | Renter-occupied |
| Single Unit, Detached | 394 (94.5%) | 23 (5.5%) |
| Single Unit, Attached | 0 (0.0%) | 0 (0.0%) |
| 2 Unit Apartments | 0 (0.0%) | 18 (100.0%) |
| 3 or 4 Unit Apartments | 0 (0.0%) | 0 (0.0%) |
| 5 to 9 Unit Apartments | 0 (0.0%) | 28 (100.0%) |
| 10 or more Apartments | 0 (0.0%) | 8 (100.0%) |
| Mobile Home / Other | 110 (73.8%) | 39 (26.2%) |
| Total | 504 (81.3%) | 116 (18.7%) |
Housing Structures by Number of Rooms in Buchanan Dam
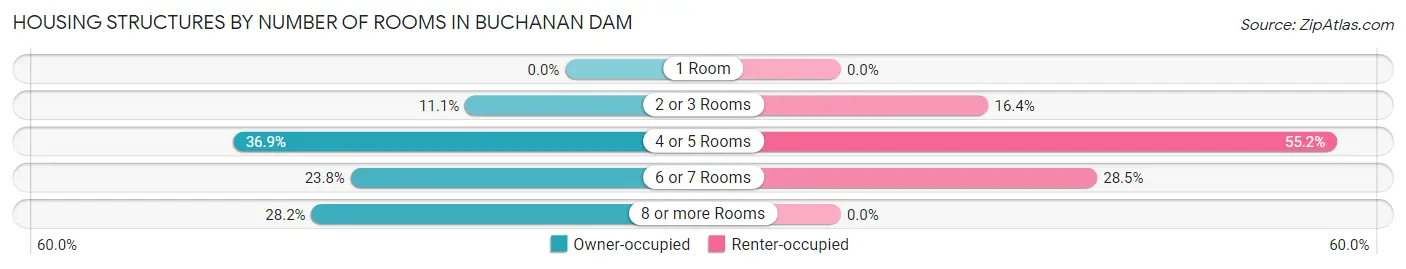
| Number of Rooms | Owner-occupied | Renter-occupied |
| 1 Room | 0 (0.0%) | 0 (0.0%) |
| 2 or 3 Rooms | 56 (11.1%) | 19 (16.4%) |
| 4 or 5 Rooms | 186 (36.9%) | 64 (55.2%) |
| 6 or 7 Rooms | 120 (23.8%) | 33 (28.4%) |
| 8 or more Rooms | 142 (28.2%) | 0 (0.0%) |
| Total | 504 (100.0%) | 116 (100.0%) |
Housing Structure by Heating Type in Buchanan Dam
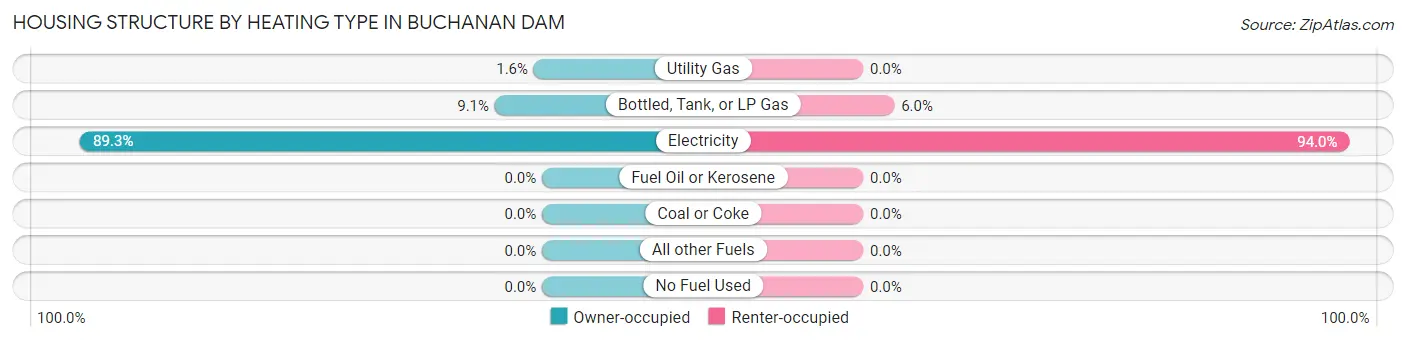
| Heating Type | Owner-occupied | Renter-occupied |
| Utility Gas | 8 (1.6%) | 0 (0.0%) |
| Bottled, Tank, or LP Gas | 46 (9.1%) | 7 (6.0%) |
| Electricity | 450 (89.3%) | 109 (94.0%) |
| Fuel Oil or Kerosene | 0 (0.0%) | 0 (0.0%) |
| Coal or Coke | 0 (0.0%) | 0 (0.0%) |
| All other Fuels | 0 (0.0%) | 0 (0.0%) |
| No Fuel Used | 0 (0.0%) | 0 (0.0%) |
| Total | 504 (100.0%) | 116 (100.0%) |
Household Vehicle Usage in Buchanan Dam
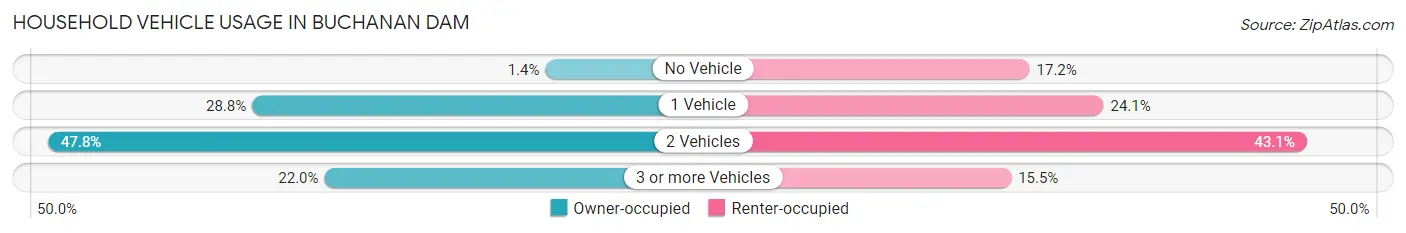
| Vehicles per Household | Owner-occupied | Renter-occupied |
| No Vehicle | 7 (1.4%) | 20 (17.2%) |
| 1 Vehicle | 145 (28.8%) | 28 (24.1%) |
| 2 Vehicles | 241 (47.8%) | 50 (43.1%) |
| 3 or more Vehicles | 111 (22.0%) | 18 (15.5%) |
| Total | 504 (100.0%) | 116 (100.0%) |
Real Estate & Mortgages in Buchanan Dam
Real Estate and Mortgage Overview in Buchanan Dam
| Characteristic | Without Mortgage | With Mortgage |
| Housing Units | 352 | 152 |
| Median Property Value | $202,600 | $294,200 |
| Median Household Income | $56,929 | $31 |
| Monthly Housing Costs | $557 | $27 |
| Real Estate Taxes | $1,620 | $0 |
Property Value by Mortgage Status in Buchanan Dam
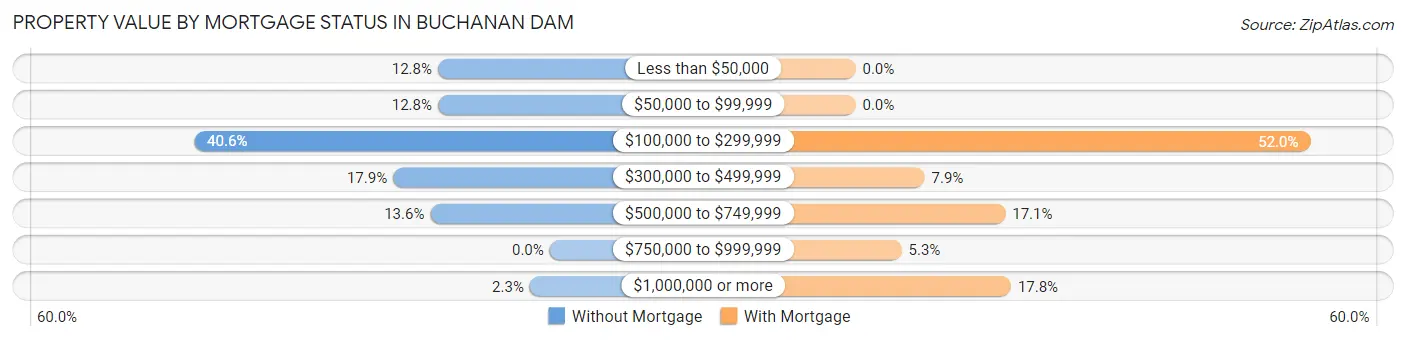
| Property Value | Without Mortgage | With Mortgage |
| Less than $50,000 | 45 (12.8%) | 0 (0.0%) |
| $50,000 to $99,999 | 45 (12.8%) | 0 (0.0%) |
| $100,000 to $299,999 | 143 (40.6%) | 79 (52.0%) |
| $300,000 to $499,999 | 63 (17.9%) | 12 (7.9%) |
| $500,000 to $749,999 | 48 (13.6%) | 26 (17.1%) |
| $750,000 to $999,999 | 0 (0.0%) | 8 (5.3%) |
| $1,000,000 or more | 8 (2.3%) | 27 (17.8%) |
| Total | 352 (100.0%) | 152 (100.0%) |
Household Income by Mortgage Status in Buchanan Dam
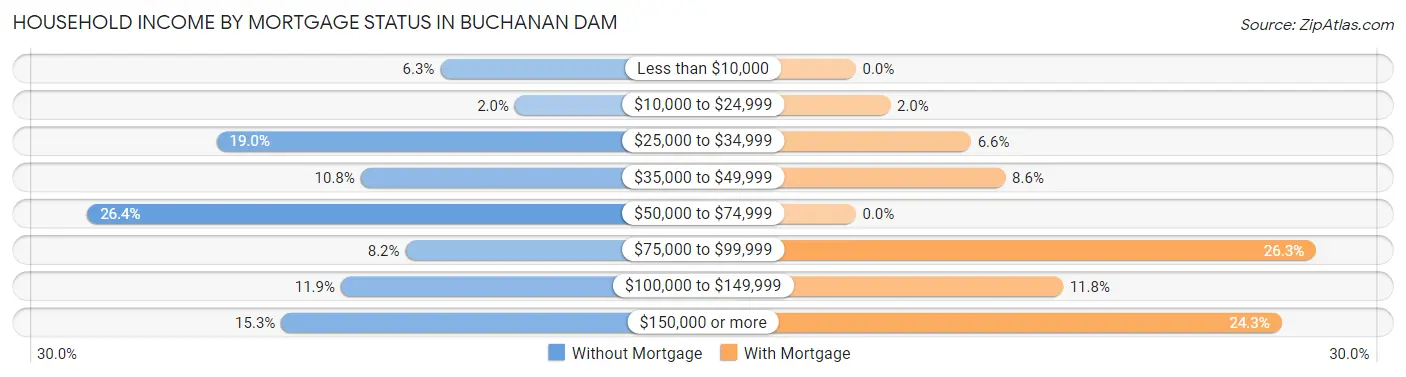
| Household Income | Without Mortgage | With Mortgage |
| Less than $10,000 | 22 (6.2%) | 0 (0.0%) |
| $10,000 to $24,999 | 7 (2.0%) | 3 (2.0%) |
| $25,000 to $34,999 | 67 (19.0%) | 10 (6.6%) |
| $35,000 to $49,999 | 38 (10.8%) | 13 (8.6%) |
| $50,000 to $74,999 | 93 (26.4%) | 0 (0.0%) |
| $75,000 to $99,999 | 29 (8.2%) | 40 (26.3%) |
| $100,000 to $149,999 | 42 (11.9%) | 18 (11.8%) |
| $150,000 or more | 54 (15.3%) | 37 (24.3%) |
| Total | 352 (100.0%) | 152 (100.0%) |
Property Value to Household Income Ratio in Buchanan Dam
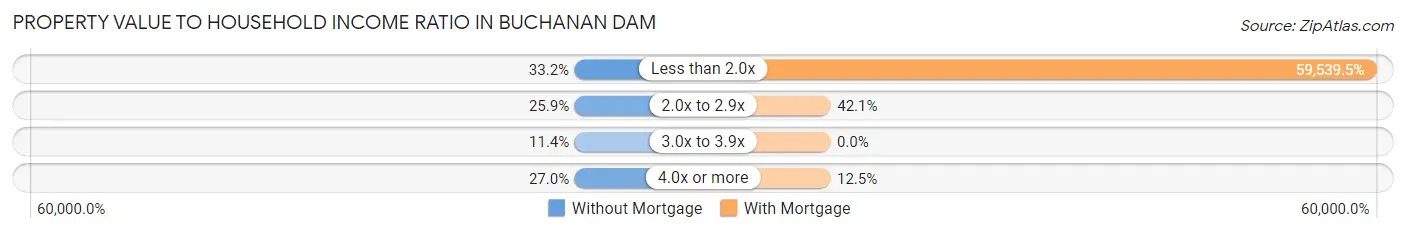
| Value-to-Income Ratio | Without Mortgage | With Mortgage |
| Less than 2.0x | 117 (33.2%) | 90,500 (59,539.5%) |
| 2.0x to 2.9x | 91 (25.9%) | 64 (42.1%) |
| 3.0x to 3.9x | 40 (11.4%) | 0 (0.0%) |
| 4.0x or more | 95 (27.0%) | 19 (12.5%) |
| Total | 352 (100.0%) | 152 (100.0%) |
Real Estate Taxes by Mortgage Status in Buchanan Dam
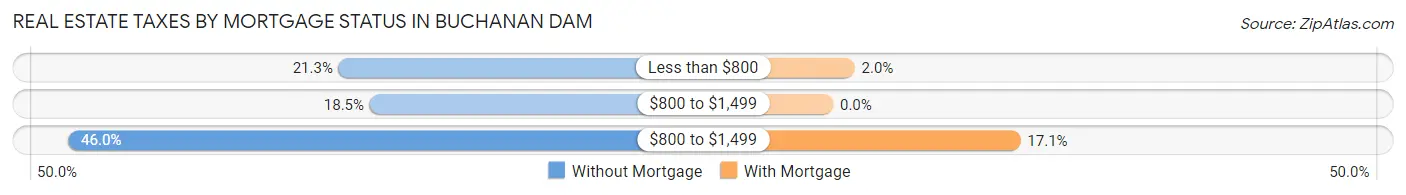
| Property Taxes | Without Mortgage | With Mortgage |
| Less than $800 | 75 (21.3%) | 3 (2.0%) |
| $800 to $1,499 | 65 (18.5%) | 0 (0.0%) |
| $800 to $1,499 | 162 (46.0%) | 26 (17.1%) |
| Total | 352 (100.0%) | 152 (100.0%) |
Health & Disability in Buchanan Dam
Health Insurance Coverage by Age in Buchanan Dam
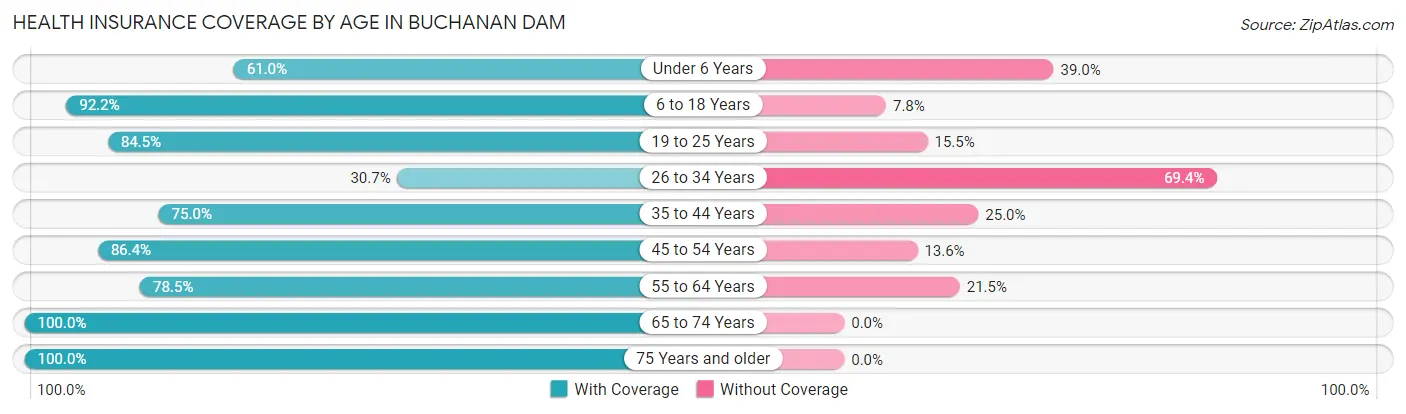
| Age Bracket | With Coverage | Without Coverage |
| Under 6 Years | 25 (61.0%) | 16 (39.0%) |
| 6 to 18 Years | 83 (92.2%) | 7 (7.8%) |
| 19 to 25 Years | 49 (84.5%) | 9 (15.5%) |
| 26 to 34 Years | 19 (30.6%) | 43 (69.4%) |
| 35 to 44 Years | 60 (75.0%) | 20 (25.0%) |
| 45 to 54 Years | 76 (86.4%) | 12 (13.6%) |
| 55 to 64 Years | 153 (78.5%) | 42 (21.5%) |
| 65 to 74 Years | 449 (100.0%) | 0 (0.0%) |
| 75 Years and older | 211 (100.0%) | 0 (0.0%) |
| Total | 1,125 (88.3%) | 149 (11.7%) |
Health Insurance Coverage by Citizenship Status in Buchanan Dam
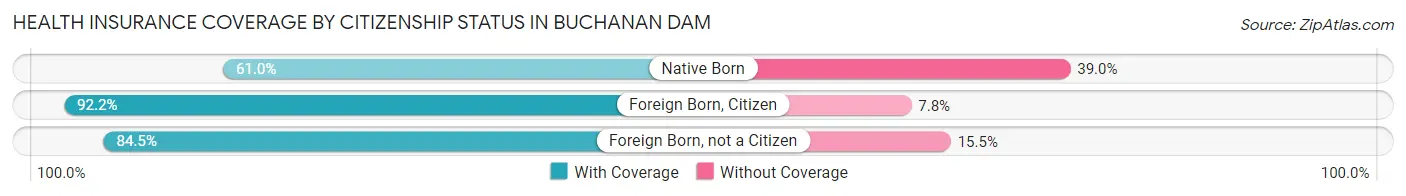
| Citizenship Status | With Coverage | Without Coverage |
| Native Born | 25 (61.0%) | 16 (39.0%) |
| Foreign Born, Citizen | 83 (92.2%) | 7 (7.8%) |
| Foreign Born, not a Citizen | 49 (84.5%) | 9 (15.5%) |
Health Insurance Coverage by Household Income in Buchanan Dam
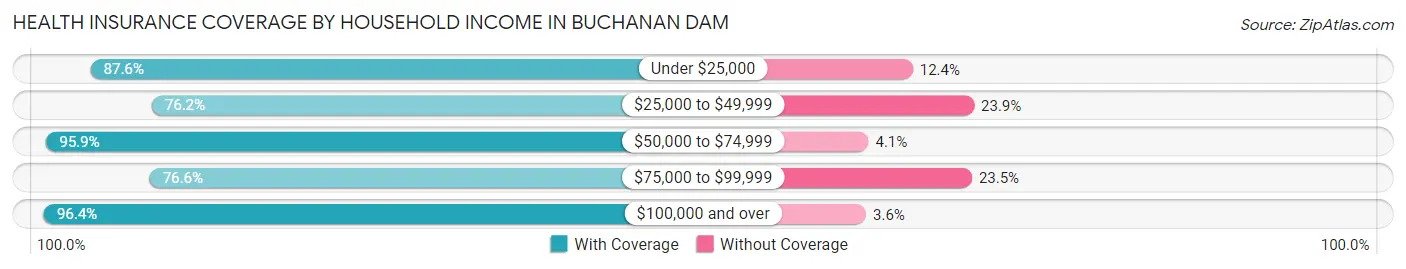
| Household Income | With Coverage | Without Coverage |
| Under $25,000 | 85 (87.6%) | 12 (12.4%) |
| $25,000 to $49,999 | 182 (76.1%) | 57 (23.8%) |
| $50,000 to $74,999 | 259 (95.9%) | 11 (4.1%) |
| $75,000 to $99,999 | 173 (76.5%) | 53 (23.4%) |
| $100,000 and over | 426 (96.4%) | 16 (3.6%) |
Public vs Private Health Insurance Coverage by Age in Buchanan Dam
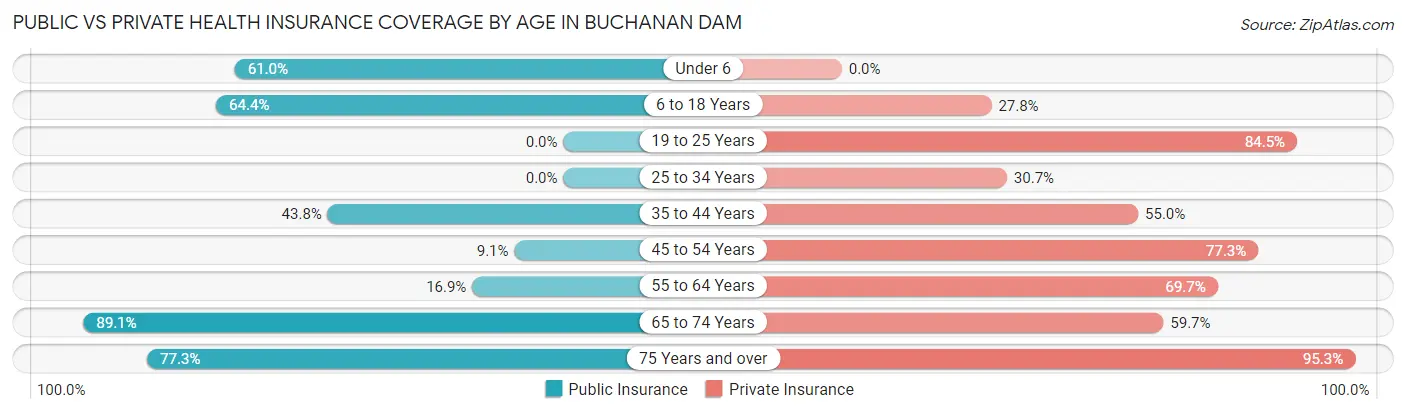
| Age Bracket | Public Insurance | Private Insurance |
| Under 6 | 25 (61.0%) | 0 (0.0%) |
| 6 to 18 Years | 58 (64.4%) | 25 (27.8%) |
| 19 to 25 Years | 0 (0.0%) | 49 (84.5%) |
| 25 to 34 Years | 0 (0.0%) | 19 (30.6%) |
| 35 to 44 Years | 35 (43.8%) | 44 (55.0%) |
| 45 to 54 Years | 8 (9.1%) | 68 (77.3%) |
| 55 to 64 Years | 33 (16.9%) | 136 (69.7%) |
| 65 to 74 Years | 400 (89.1%) | 268 (59.7%) |
| 75 Years and over | 163 (77.2%) | 201 (95.3%) |
| Total | 722 (56.7%) | 810 (63.6%) |
Disability Status by Sex by Age in Buchanan Dam
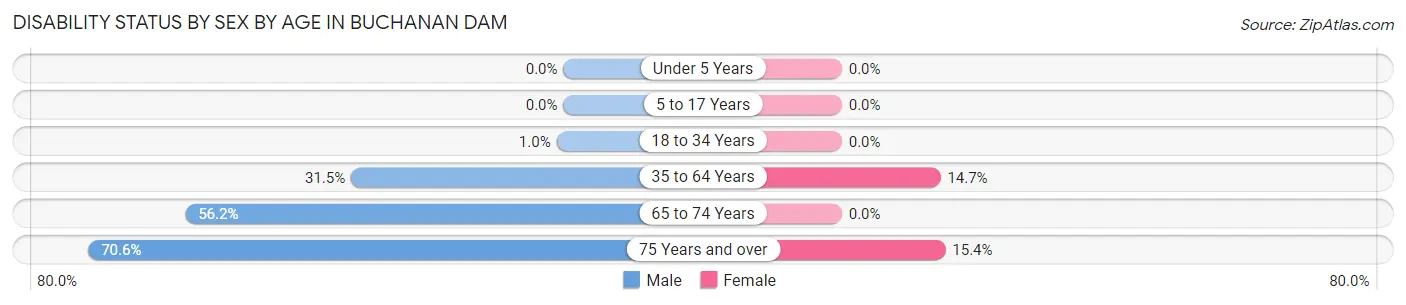
| Age Bracket | Male | Female |
| Under 5 Years | 0 (0.0%) | 0 (0.0%) |
| 5 to 17 Years | 0 (0.0%) | 0 (0.0%) |
| 18 to 34 Years | 1 (1.0%) | 0 (0.0%) |
| 35 to 64 Years | 52 (31.5%) | 29 (14.6%) |
| 65 to 74 Years | 137 (56.1%) | 0 (0.0%) |
| 75 Years and over | 103 (70.6%) | 10 (15.4%) |
Disability Class by Sex by Age in Buchanan Dam
Disability Class: Hearing Difficulty
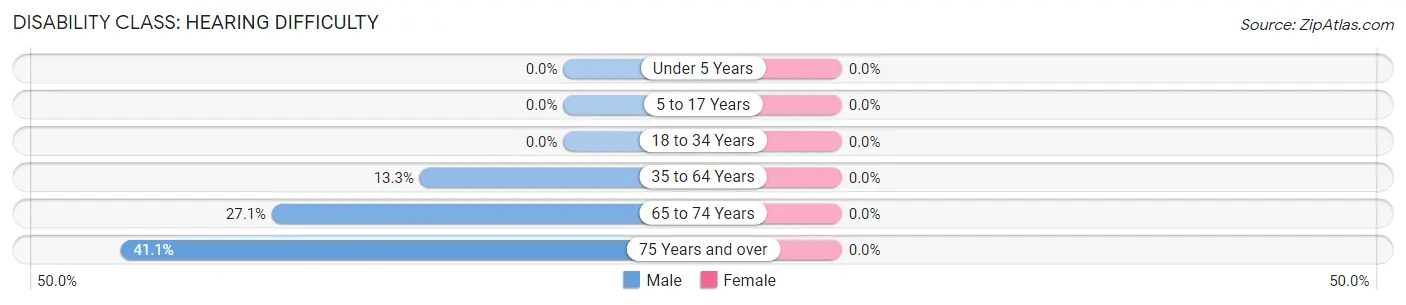
| Age Bracket | Male | Female |
| Under 5 Years | 0 (0.0%) | 0 (0.0%) |
| 5 to 17 Years | 0 (0.0%) | 0 (0.0%) |
| 18 to 34 Years | 0 (0.0%) | 0 (0.0%) |
| 35 to 64 Years | 22 (13.3%) | 0 (0.0%) |
| 65 to 74 Years | 66 (27.1%) | 0 (0.0%) |
| 75 Years and over | 60 (41.1%) | 0 (0.0%) |
Disability Class: Vision Difficulty
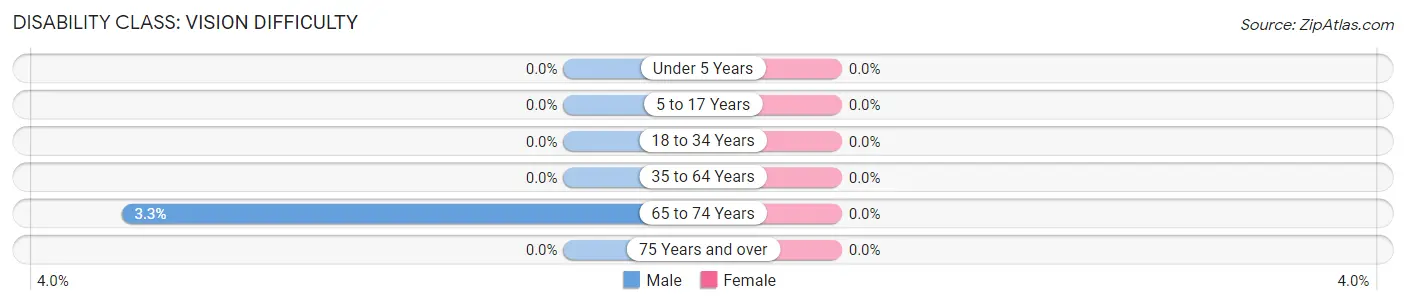
| Age Bracket | Male | Female |
| Under 5 Years | 0 (0.0%) | 0 (0.0%) |
| 5 to 17 Years | 0 (0.0%) | 0 (0.0%) |
| 18 to 34 Years | 0 (0.0%) | 0 (0.0%) |
| 35 to 64 Years | 0 (0.0%) | 0 (0.0%) |
| 65 to 74 Years | 8 (3.3%) | 0 (0.0%) |
| 75 Years and over | 0 (0.0%) | 0 (0.0%) |
Disability Class: Cognitive Difficulty
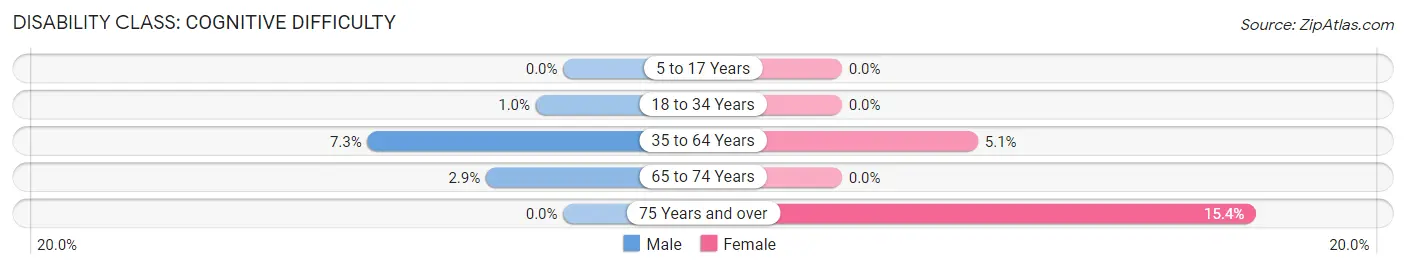
| Age Bracket | Male | Female |
| 5 to 17 Years | 0 (0.0%) | 0 (0.0%) |
| 18 to 34 Years | 1 (1.0%) | 0 (0.0%) |
| 35 to 64 Years | 12 (7.3%) | 10 (5.1%) |
| 65 to 74 Years | 7 (2.9%) | 0 (0.0%) |
| 75 Years and over | 0 (0.0%) | 10 (15.4%) |
Disability Class: Ambulatory Difficulty
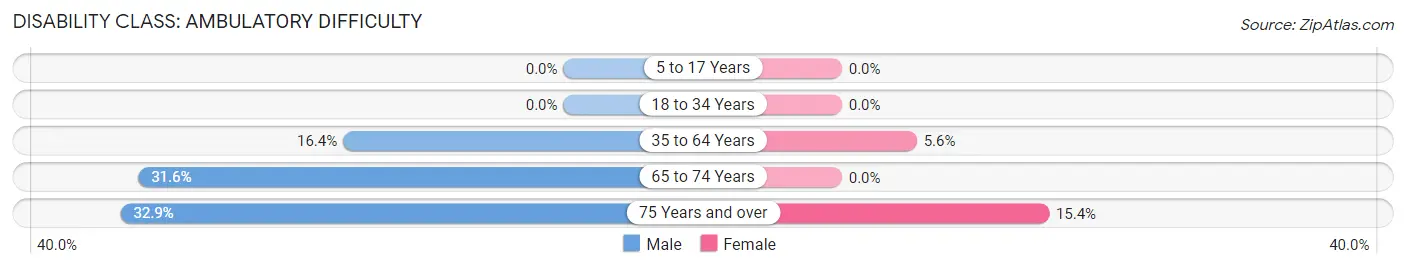
| Age Bracket | Male | Female |
| 5 to 17 Years | 0 (0.0%) | 0 (0.0%) |
| 18 to 34 Years | 0 (0.0%) | 0 (0.0%) |
| 35 to 64 Years | 27 (16.4%) | 11 (5.6%) |
| 65 to 74 Years | 77 (31.6%) | 0 (0.0%) |
| 75 Years and over | 48 (32.9%) | 10 (15.4%) |
Disability Class: Self-Care Difficulty
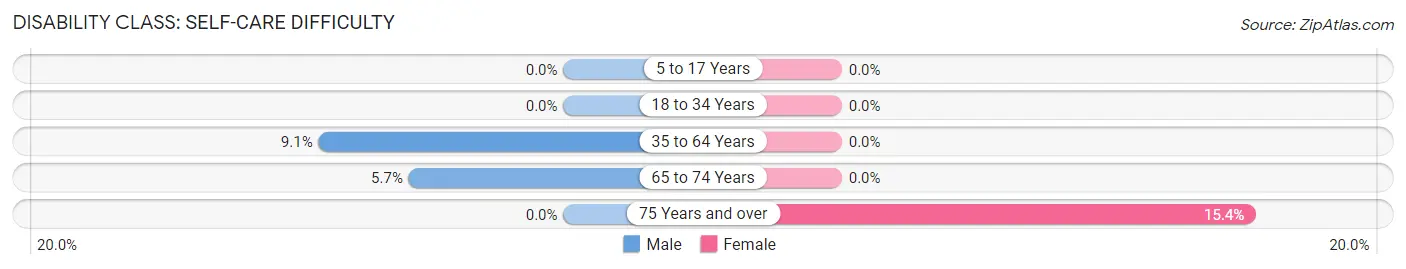
| Age Bracket | Male | Female |
| 5 to 17 Years | 0 (0.0%) | 0 (0.0%) |
| 18 to 34 Years | 0 (0.0%) | 0 (0.0%) |
| 35 to 64 Years | 15 (9.1%) | 0 (0.0%) |
| 65 to 74 Years | 14 (5.7%) | 0 (0.0%) |
| 75 Years and over | 0 (0.0%) | 10 (15.4%) |
Technology Access in Buchanan Dam
Computing Device Access in Buchanan Dam
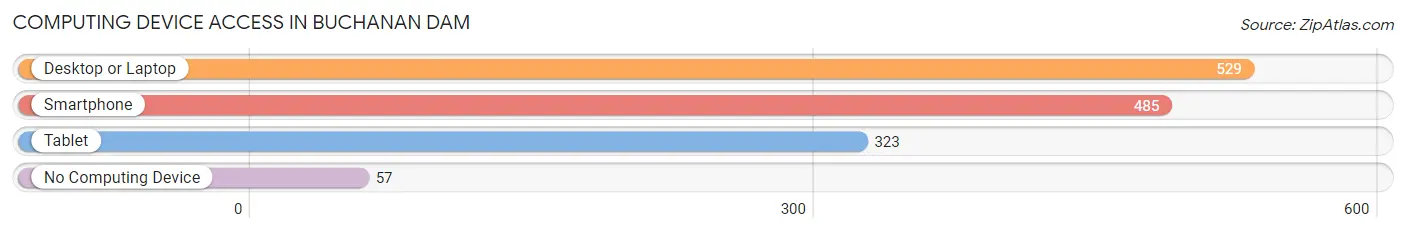
| Device Type | # Households | % Households |
| Desktop or Laptop | 529 | 85.3% |
| Smartphone | 485 | 78.2% |
| Tablet | 323 | 52.1% |
| No Computing Device | 57 | 9.2% |
| Total | 620 | 100.0% |
Internet Access in Buchanan Dam
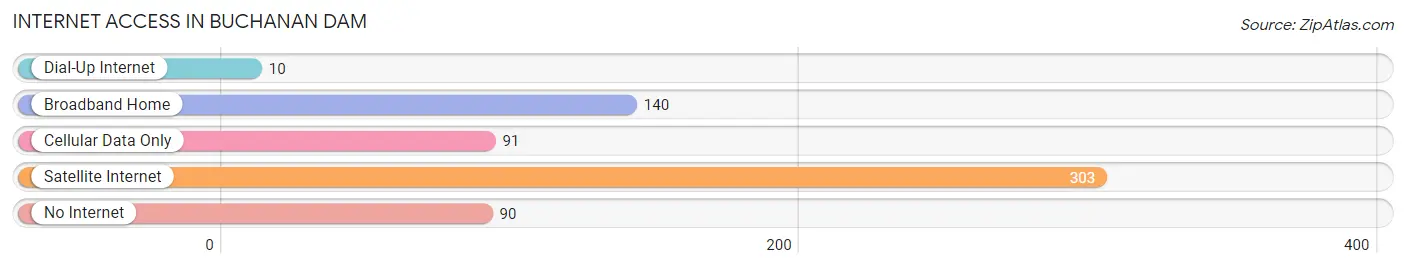
| Internet Type | # Households | % Households |
| Dial-Up Internet | 10 | 1.6% |
| Broadband Home | 140 | 22.6% |
| Cellular Data Only | 91 | 14.7% |
| Satellite Internet | 303 | 48.9% |
| No Internet | 90 | 14.5% |
| Total | 620 | 100.0% |
Buchanan Dam Summary
Buchanan Dam is a small unincorporated community located in Llano County, Texas, United States. It is situated on the north shore of Lake Buchanan, a reservoir on the Colorado River. The community is located approximately 20 miles northwest of the county seat of Llano and about 70 miles northwest of Austin, the state capital.
History
The area around Buchanan Dam was first settled in the late 19th century by ranchers and farmers. The town was originally known as Bluffton, but was renamed in the early 20th century after the construction of the dam. The dam was built in 1937 by the Lower Colorado River Authority (LCRA) to provide hydroelectric power and water for irrigation and municipal use. The dam created Lake Buchanan, which is the largest of the Highland Lakes chain of reservoirs on the Colorado River.
The town of Buchanan Dam grew up around the dam and the lake, and became a popular destination for fishing, boating, and other recreational activities. The town also became a center for the local ranching and farming industries. In the 1950s, the town was home to a number of businesses, including a grocery store, a gas station, a post office, and a hotel.
Geography
Buchanan Dam is located in the Hill Country region of central Texas, about 20 miles northwest of the county seat of Llano and about 70 miles northwest of Austin, the state capital. The town is situated on the north shore of Lake Buchanan, a reservoir on the Colorado River. The lake is the largest of the Highland Lakes chain of reservoirs on the Colorado River.
The terrain around Buchanan Dam is mostly rolling hills, with some flat areas along the lake shore. The area is mostly covered in grasslands, with some wooded areas. The climate is generally mild, with hot summers and cool winters.
Economy
The economy of Buchanan Dam is largely based on tourism and recreation. The town is a popular destination for fishing, boating, and other recreational activities. The town is also home to a number of businesses, including a grocery store, a gas station, a post office, and a hotel.
The town is also home to a number of ranches and farms, which produce a variety of crops, including hay, corn, wheat, and cotton. The area is also home to a number of wineries, which produce a variety of wines.
Demographics
As of the 2010 census, the population of Buchanan Dam was 1,093. The racial makeup of the town was 97.3% White, 0.7% African American, 0.3% Native American, 0.2% Asian, 0.1% Pacific Islander, 0.7% from other races, and 0.9% from two or more races. Hispanic or Latino of any race were 2.3% of the population.
The median household income in Buchanan Dam was $41,250, and the median family income was $45,625. The per capita income for the town was $20,945. About 11.3% of families and 13.2% of the population were below the poverty line, including 17.2% of those under age 18 and 8.3% of those age 65 or over.
Common Questions
What is the Total Population of Buchanan Dam?
Total Population of Buchanan Dam is 1,274.
What is the Total Male Population of Buchanan Dam?
Total Male Population of Buchanan Dam is 726.
What is the Total Female Population of Buchanan Dam?
Total Female Population of Buchanan Dam is 548.
What is the Ratio of Males per 100 Females in Buchanan Dam?
There are 132.48 Males per 100 Females in Buchanan Dam.
What is the Ratio of Females per 100 Males in Buchanan Dam?
There are 75.48 Females per 100 Males in Buchanan Dam.
What is the Median Population Age in Buchanan Dam?
Median Population Age in Buchanan Dam is 65.5 Years.
What is the Average Family Size in Buchanan Dam
Average Family Size in Buchanan Dam is 2.5 People.
What is the Average Household Size in Buchanan Dam
Average Household Size in Buchanan Dam is 2.0 People.
What is Per Capita Income in Buchanan Dam?
Per Capita income in Buchanan Dam is $48,882.
What is the Median Family Income in Buchanan Dam?
Median Family Income in Buchanan Dam is $76,364.
What is the Median Household income in Buchanan Dam?
Median Household Income in Buchanan Dam is $66,250.
What is Income or Wage Gap in Buchanan Dam?
Income or Wage Gap in Buchanan Dam is 42.5%.
Women in Buchanan Dam earn 57.5 cents for every dollar earned by a man.
What is Family Income Deficit in Buchanan Dam?
Family Income Deficit in Buchanan Dam is $14,338.
Families that are below poverty line in Buchanan Dam earn $14,338 less on average than the poverty threshold level.
What is Inequality or Gini Index in Buchanan Dam?
Inequality or Gini Index in Buchanan Dam is 0.52.
How Large is the Labor Force in Buchanan Dam?
There are 492 People in the Labor Forcein in Buchanan Dam.
What is the Percentage of People in the Labor Force in Buchanan Dam?
42.6% of People are in the Labor Force in Buchanan Dam.
What is the Unemployment Rate in Buchanan Dam?
Unemployment Rate in Buchanan Dam is 0.2%.