Kiawah Island, SC
Kiawah Island Map
Kiawah Island Overview
2,130
TOTAL POPULATION
1,042
MALE POPULATION
1,088
FEMALE POPULATION
95.77
MALES / 100 FEMALES
104.41
FEMALES / 100 MALES
66.8
MEDIAN AGE
2.1
AVG FAMILY SIZE
1.9
AVG HOUSEHOLD SIZE
$197,853
PER CAPITA INCOME
$250,001
AVG FAMILY INCOME
$214,250
AVG HOUSEHOLD INCOME
83.1%
WAGE / INCOME GAP [ % ]
16.9¢/ $1
WAGE / INCOME GAP [ $ ]
0.52
INEQUALITY / GINI INDEX
688
LABOR FORCE [ PEOPLE ]
32.6%
PERCENT IN LABOR FORCE
3.8%
UNEMPLOYMENT RATE
Kiawah Island Area Codes
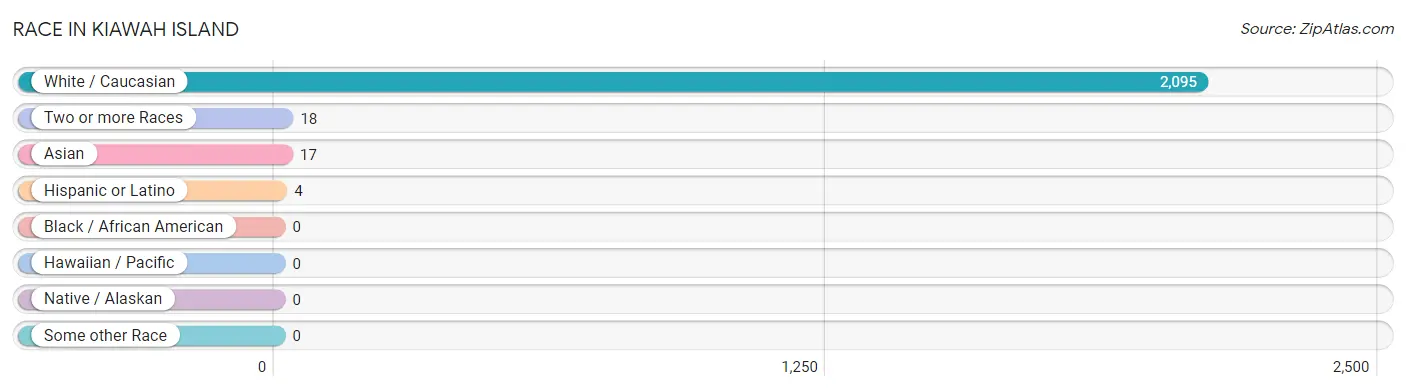
Race in Kiawah Island
The most populous races in Kiawah Island are White / Caucasian (2,095 | 98.4%), Two or more Races (18 | 0.9%), and Asian (17 | 0.8%).
| Race | # Population | % Population |
| Asian | 17 | 0.8% |
| Black / African American | 0 | 0.0% |
| Hawaiian / Pacific | 0 | 0.0% |
| Hispanic or Latino | 4 | 0.2% |
| Native / Alaskan | 0 | 0.0% |
| White / Caucasian | 2,095 | 98.4% |
| Two or more Races | 18 | 0.9% |
| Some other Race | 0 | 0.0% |
| Total | 2,130 | 100.0% |
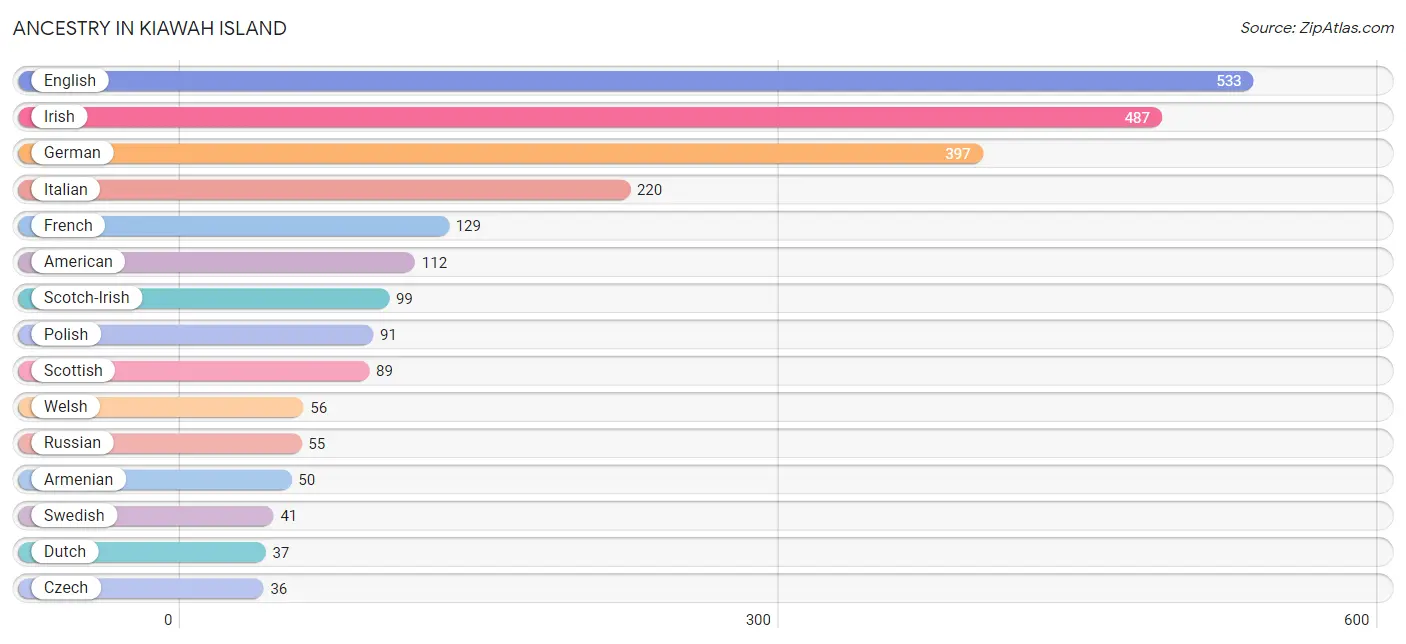
Ancestry in Kiawah Island
The most populous ancestries reported in Kiawah Island are English (533 | 25.0%), Irish (487 | 22.9%), German (397 | 18.6%), Italian (220 | 10.3%), and French (129 | 6.1%), together accounting for 82.9% of all Kiawah Island residents.
| Ancestry | # Population | % Population |
| American | 112 | 5.3% |
| Arab | 29 | 1.4% |
| Armenian | 50 | 2.4% |
| Austrian | 17 | 0.8% |
| Blackfeet | 6 | 0.3% |
| British | 16 | 0.7% |
| Canadian | 12 | 0.6% |
| Cherokee | 8 | 0.4% |
| Croatian | 7 | 0.3% |
| Czech | 36 | 1.7% |
| Danish | 5 | 0.2% |
| Dutch | 37 | 1.7% |
| Eastern European | 5 | 0.2% |
| English | 533 | 25.0% |
| European | 32 | 1.5% |
| Finnish | 3 | 0.1% |
| French | 129 | 6.1% |
| German | 397 | 18.6% |
| Greek | 15 | 0.7% |
| Hungarian | 29 | 1.4% |
| Irish | 487 | 22.9% |
| Italian | 220 | 10.3% |
| Korean | 4 | 0.2% |
| Lebanese | 17 | 0.8% |
| Northern European | 11 | 0.5% |
| Norwegian | 15 | 0.7% |
| Polish | 91 | 4.3% |
| Romanian | 7 | 0.3% |
| Russian | 55 | 2.6% |
| Scotch-Irish | 99 | 4.6% |
| Scottish | 89 | 4.2% |
| Slovak | 13 | 0.6% |
| Spaniard | 4 | 0.2% |
| Swedish | 41 | 1.9% |
| Swiss | 23 | 1.1% |
| Syrian | 12 | 0.6% |
| Thai | 17 | 0.8% |
| Ukrainian | 19 | 0.9% |
| Welsh | 56 | 2.6% | View All 39 Rows |
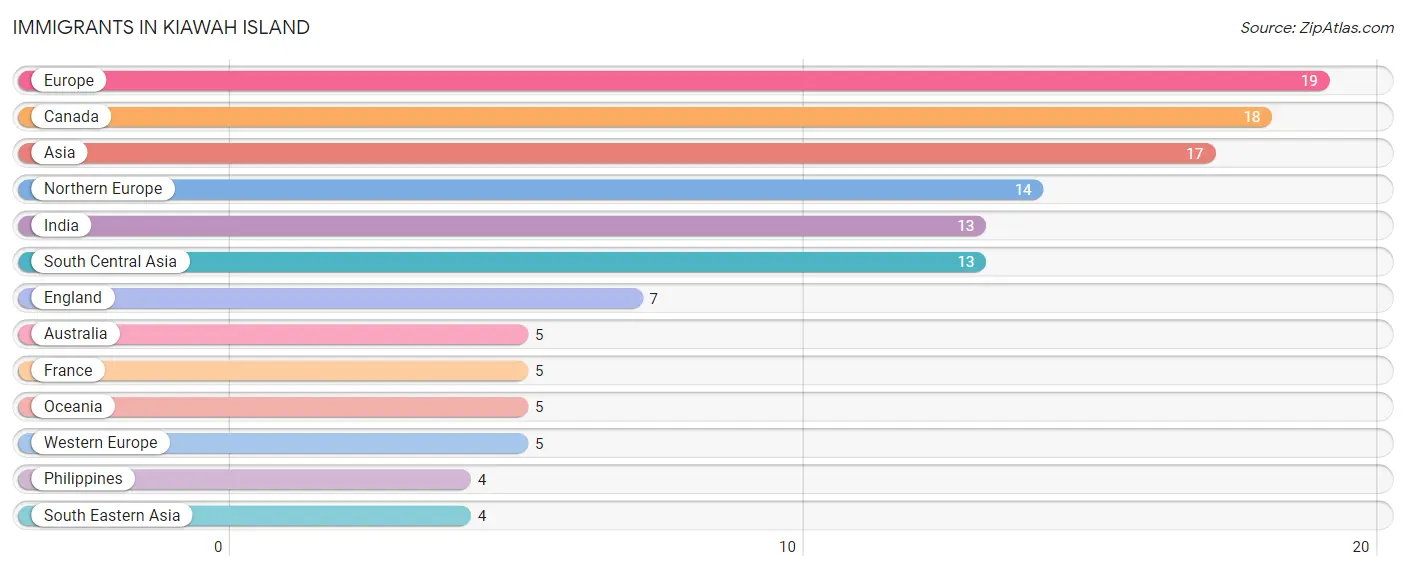
Immigrants in Kiawah Island
The most numerous immigrant groups reported in Kiawah Island came from Europe (19 | 0.9%), Canada (18 | 0.9%), Asia (17 | 0.8%), Northern Europe (14 | 0.7%), and India (13 | 0.6%), together accounting for 3.8% of all Kiawah Island residents.
| Immigration Origin | # Population | % Population |
| Asia | 17 | 0.8% |
| Australia | 5 | 0.2% |
| Canada | 18 | 0.9% |
| England | 7 | 0.3% |
| Europe | 19 | 0.9% |
| France | 5 | 0.2% |
| India | 13 | 0.6% |
| Northern Europe | 14 | 0.7% |
| Oceania | 5 | 0.2% |
| Philippines | 4 | 0.2% |
| South Central Asia | 13 | 0.6% |
| South Eastern Asia | 4 | 0.2% |
| Western Europe | 5 | 0.2% | View All 13 Rows |
Sex and Age in Kiawah Island
Sex and Age in Kiawah Island
The most populous age groups in Kiawah Island are 65 to 69 Years (231 | 22.2%) for men and 60 to 64 Years (268 | 24.6%) for women.
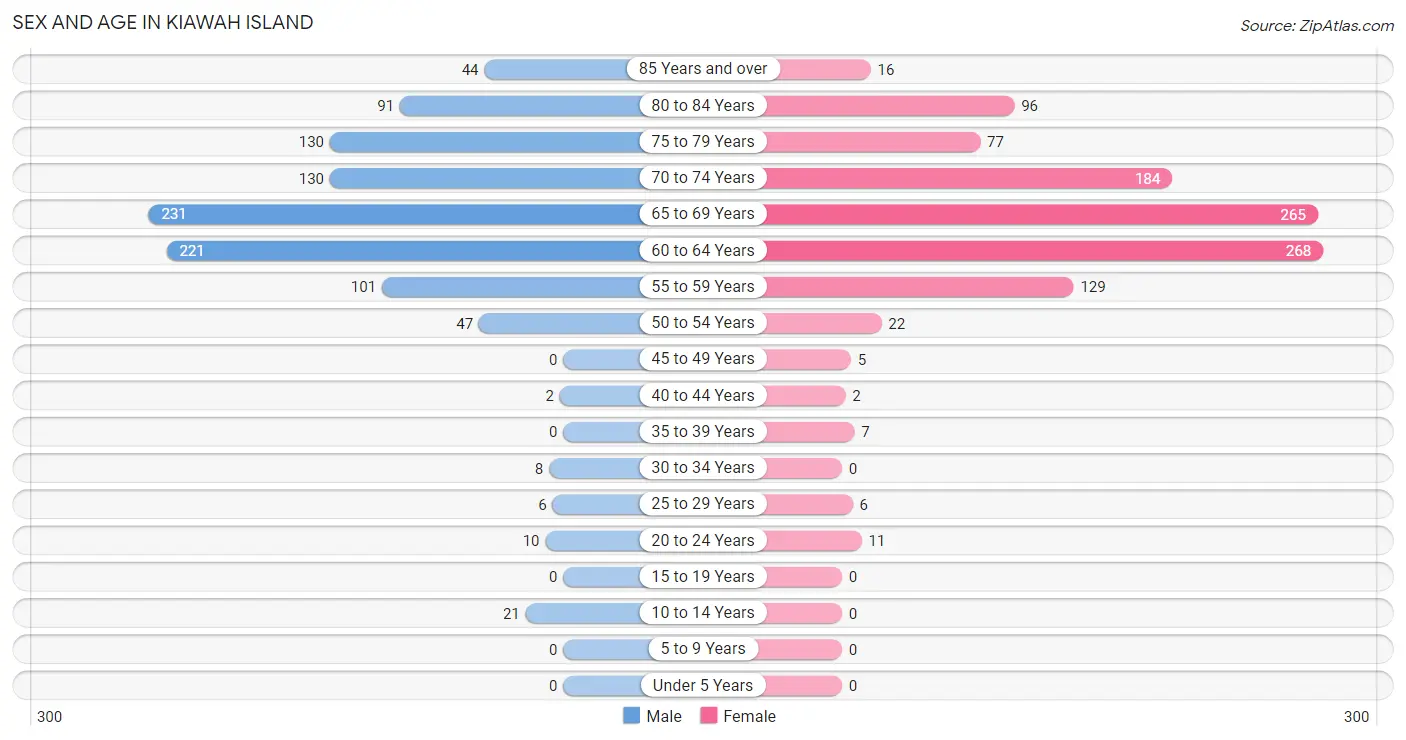
| Age Bracket | Male | Female |
| Under 5 Years | 0 (0.0%) | 0 (0.0%) |
| 5 to 9 Years | 0 (0.0%) | 0 (0.0%) |
| 10 to 14 Years | 21 (2.0%) | 0 (0.0%) |
| 15 to 19 Years | 0 (0.0%) | 0 (0.0%) |
| 20 to 24 Years | 10 (1.0%) | 11 (1.0%) |
| 25 to 29 Years | 6 (0.6%) | 6 (0.5%) |
| 30 to 34 Years | 8 (0.8%) | 0 (0.0%) |
| 35 to 39 Years | 0 (0.0%) | 7 (0.6%) |
| 40 to 44 Years | 2 (0.2%) | 2 (0.2%) |
| 45 to 49 Years | 0 (0.0%) | 5 (0.5%) |
| 50 to 54 Years | 47 (4.5%) | 22 (2.0%) |
| 55 to 59 Years | 101 (9.7%) | 129 (11.9%) |
| 60 to 64 Years | 221 (21.2%) | 268 (24.6%) |
| 65 to 69 Years | 231 (22.2%) | 265 (24.4%) |
| 70 to 74 Years | 130 (12.5%) | 184 (16.9%) |
| 75 to 79 Years | 130 (12.5%) | 77 (7.1%) |
| 80 to 84 Years | 91 (8.7%) | 96 (8.8%) |
| 85 Years and over | 44 (4.2%) | 16 (1.5%) |
| Total | 1,042 (100.0%) | 1,088 (100.0%) |
Families and Households in Kiawah Island
Median Family Size in Kiawah Island
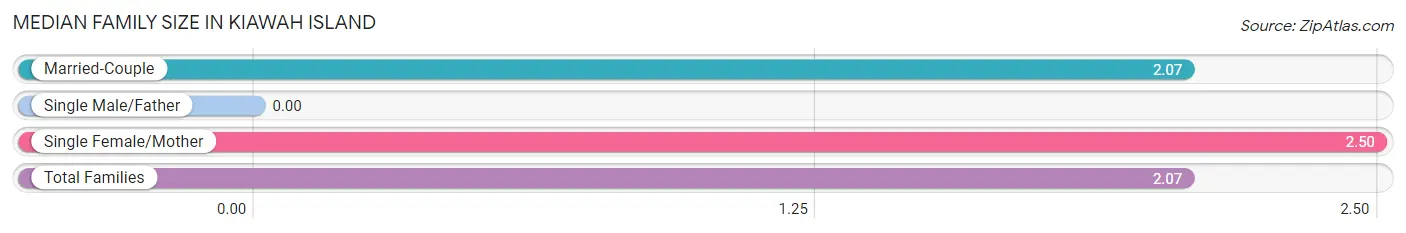
| Family Type | # Families | Family Size |
| Married-Couple | 892 (99.1%) | 2.07 |
| Single Male/Father | 0 (0.0%) | - |
| Single Female/Mother | 8 (0.9%) | 2.50 |
| Total Families | 900 (100.0%) | 2.07 |
Median Household Size in Kiawah Island
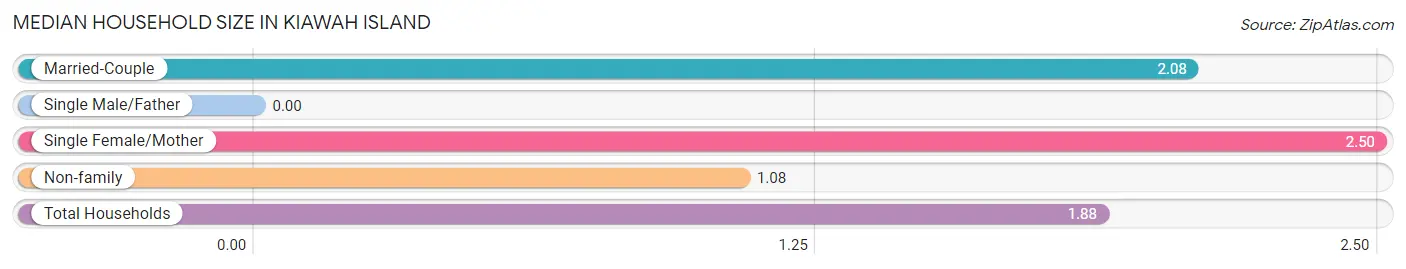
| Household Type | # Households | Household Size |
| Married-Couple | 892 (78.7%) | 2.08 |
| Single Male/Father | 0 (0.0%) | - |
| Single Female/Mother | 8 (0.7%) | 2.50 |
| Non-family | 233 (20.6%) | 1.08 |
| Total Households | 1,133 (100.0%) | 1.88 |
Household Size by Marriage Status in Kiawah Island
Out of a total of 1,133 households in Kiawah Island, 900 (79.4%) are family households, while 233 (20.6%) are nonfamily households. The most numerous type of family households are 2-person households, comprising 860, and the most common type of nonfamily households are 1-person households, comprising 216.
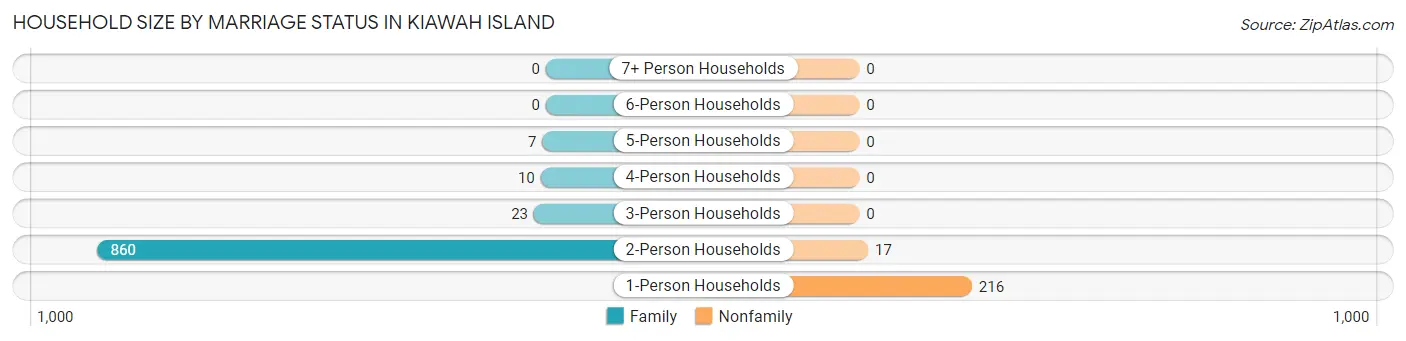
| Household Size | Family Households | Nonfamily Households |
| 1-Person Households | - | 216 (19.1%) |
| 2-Person Households | 860 (75.9%) | 17 (1.5%) |
| 3-Person Households | 23 (2.0%) | 0 (0.0%) |
| 4-Person Households | 10 (0.9%) | 0 (0.0%) |
| 5-Person Households | 7 (0.6%) | 0 (0.0%) |
| 6-Person Households | 0 (0.0%) | 0 (0.0%) |
| 7+ Person Households | 0 (0.0%) | 0 (0.0%) |
| Total | 900 (79.4%) | 233 (20.6%) |
Female Fertility in Kiawah Island
Fertility by Age in Kiawah Island
| Age Bracket | Women with Births | Births / 1,000 Women |
| 15 to 19 years | 0 (0.0%) | 0.0 |
| 20 to 34 years | 0 (0.0%) | 0.0 |
| 35 to 50 years | 0 (0.0%) | 0.0 |
| Total | 0 (0.0%) | 0.0 |
Fertility by Age by Marriage Status in Kiawah Island
| Age Bracket | Married | Unmarried |
| 15 to 19 years | 0 (0.0%) | 0 (0.0%) |
| 20 to 34 years | 0 (0.0%) | 0 (0.0%) |
| 35 to 50 years | 0 (0.0%) | 0 (0.0%) |
| Total | 0 (0.0%) | 0 (0.0%) |
Fertility by Education in Kiawah Island
| Educational Attainment | Women with Births | Births / 1,000 Women |
| Less than High School | 0 (0.0%) | 0.0 |
| High School Diploma | 0 (0.0%) | 0.0 |
| College or Associate's Degree | 0 (0.0%) | 0.0 |
| Bachelor's Degree | 0 (0.0%) | 0.0 |
| Graduate Degree | 0 (0.0%) | 0.0 |
| Total | 0 (0.0%) | 0.0 |
Fertility by Education by Marriage Status in Kiawah Island
| Educational Attainment | Married | Unmarried |
| Less than High School | 0 (0.0%) | 0 (0.0%) |
| High School Diploma | 0 (0.0%) | 0 (0.0%) |
| College or Associate's Degree | 0 (0.0%) | 0 (0.0%) |
| Bachelor's Degree | 0 (0.0%) | 0 (0.0%) |
| Graduate Degree | 0 (0.0%) | 0 (0.0%) |
| Total | 0 (0.0%) | 0 (0.0%) |
Income in Kiawah Island
Income Overview in Kiawah Island
Per Capita Income in Kiawah Island is $197,853, while median incomes of families and households are $250,001 and $214,250 respectively.
| Characteristic | Number | Measure |
| Per Capita Income | 2,130 | $197,853 |
| Median Family Income | 900 | $250,001 |
| Mean Family Income | 900 | $434,377 |
| Median Household Income | 1,133 | $214,250 |
| Mean Household Income | 1,133 | $371,032 |
| Income Deficit | 900 | $0 |
| Wage / Income Gap (%) | 2,130 | 83.07% |
| Wage / Income Gap ($) | 2,130 | 16.93¢ per $1 |
| Gini / Inequality Index | 2,130 | 0.52 |
Earnings by Sex in Kiawah Island
Average Earnings in Kiawah Island are $76,827, $201,000 for men and $34,025 for women, a difference of 83.1%.
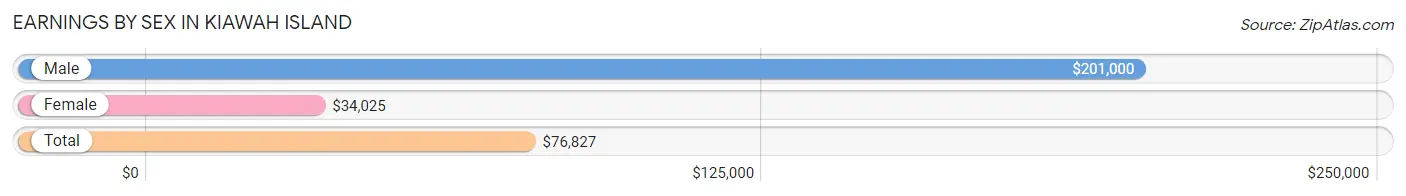
| Sex | Number | Average Earnings |
| Male | 536 (64.0%) | $201,000 |
| Female | 301 (36.0%) | $34,025 |
| Total | 837 (100.0%) | $76,827 |
Earnings by Sex by Income Bracket in Kiawah Island
The most common earnings brackets in Kiawah Island are $100,000+ for men (311 | 58.0%) and $100,000+ for women (56 | 18.6%).
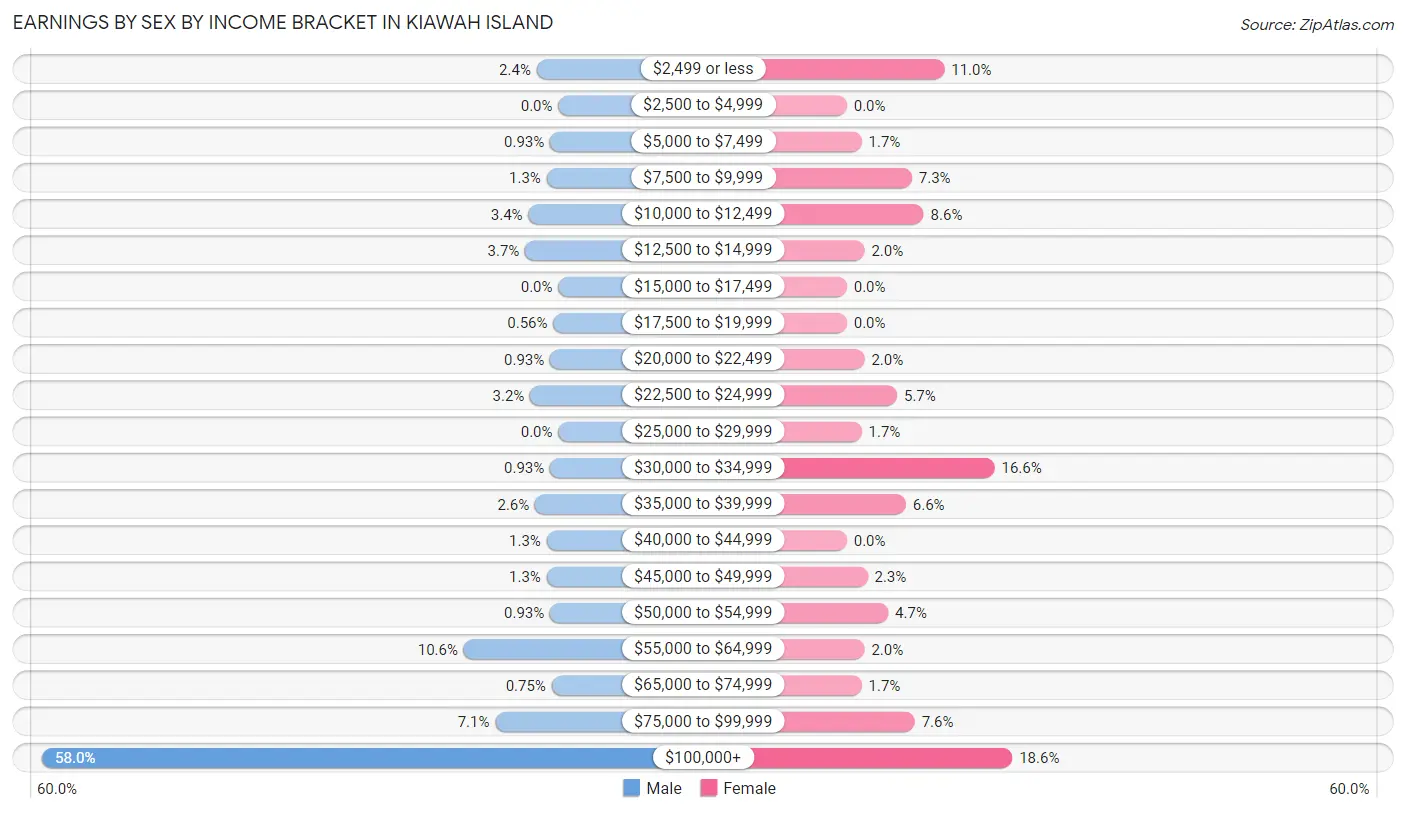
| Income | Male | Female |
| $2,499 or less | 13 (2.4%) | 33 (11.0%) |
| $2,500 to $4,999 | 0 (0.0%) | 0 (0.0%) |
| $5,000 to $7,499 | 5 (0.9%) | 5 (1.7%) |
| $7,500 to $9,999 | 7 (1.3%) | 22 (7.3%) |
| $10,000 to $12,499 | 18 (3.4%) | 26 (8.6%) |
| $12,500 to $14,999 | 20 (3.7%) | 6 (2.0%) |
| $15,000 to $17,499 | 0 (0.0%) | 0 (0.0%) |
| $17,500 to $19,999 | 3 (0.6%) | 0 (0.0%) |
| $20,000 to $22,499 | 5 (0.9%) | 6 (2.0%) |
| $22,500 to $24,999 | 17 (3.2%) | 17 (5.7%) |
| $25,000 to $29,999 | 0 (0.0%) | 5 (1.7%) |
| $30,000 to $34,999 | 5 (0.9%) | 50 (16.6%) |
| $35,000 to $39,999 | 14 (2.6%) | 20 (6.6%) |
| $40,000 to $44,999 | 7 (1.3%) | 0 (0.0%) |
| $45,000 to $49,999 | 7 (1.3%) | 7 (2.3%) |
| $50,000 to $54,999 | 5 (0.9%) | 14 (4.6%) |
| $55,000 to $64,999 | 57 (10.6%) | 6 (2.0%) |
| $65,000 to $74,999 | 4 (0.7%) | 5 (1.7%) |
| $75,000 to $99,999 | 38 (7.1%) | 23 (7.6%) |
| $100,000+ | 311 (58.0%) | 56 (18.6%) |
| Total | 536 (100.0%) | 301 (100.0%) |
Earnings by Sex by Educational Attainment in Kiawah Island
Average earnings in Kiawah Island are $205,833 for men and $34,200 for women, a difference of 83.4%. Men with an educational attainment of graduate degree enjoy the highest average annual earnings of $228,125, while those with college or associate's degree education earn the least with $64,327. Women with an educational attainment of graduate degree earn the most with the average annual earnings of $33,475, while those with graduate degree education have the smallest earnings of $33,475.
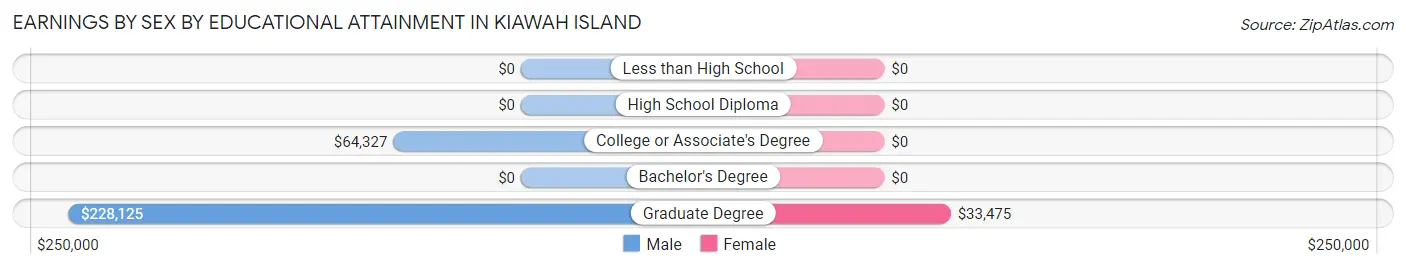
| Educational Attainment | Male Income | Female Income |
| Less than High School | - | - |
| High School Diploma | - | - |
| College or Associate's Degree | $64,327 | $0 |
| Bachelor's Degree | - | - |
| Graduate Degree | $228,125 | $33,475 |
| Total | $205,833 | $34,200 |
Family Income in Kiawah Island
Family Income Brackets in Kiawah Island
According to the Kiawah Island family income data, there are 548 families falling into the $200,000+ income range, which is the most common income bracket and makes up 60.9% of all families.
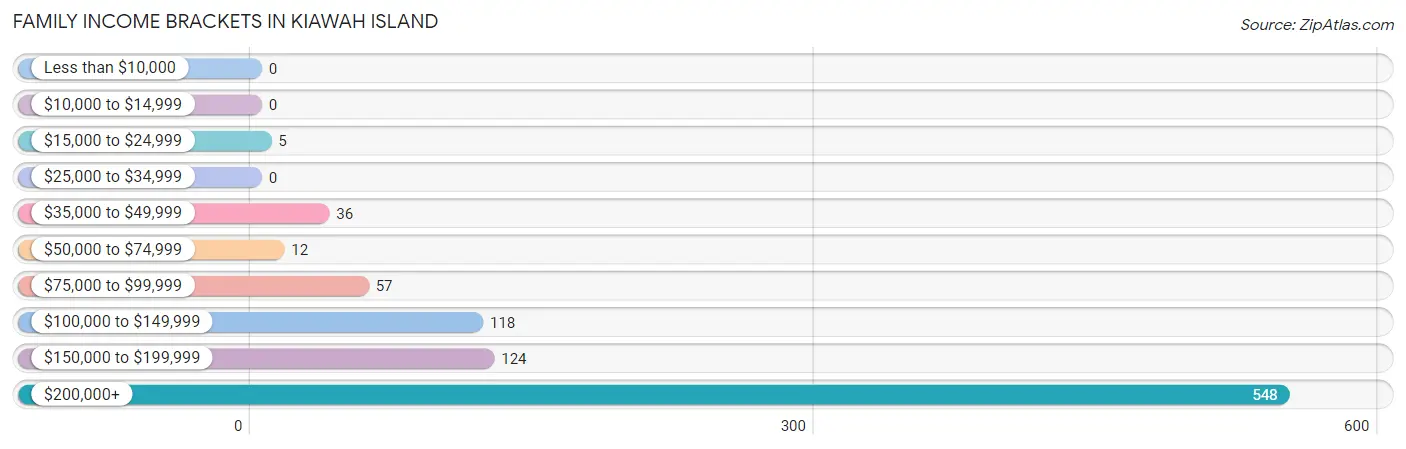
| Income Bracket | # Families | % Families |
| Less than $10,000 | 0 | 0.0% |
| $10,000 to $14,999 | 0 | 0.0% |
| $15,000 to $24,999 | 5 | 0.6% |
| $25,000 to $34,999 | 0 | 0.0% |
| $35,000 to $49,999 | 36 | 4.0% |
| $50,000 to $74,999 | 12 | 1.3% |
| $75,000 to $99,999 | 57 | 6.3% |
| $100,000 to $149,999 | 118 | 13.1% |
| $150,000 to $199,999 | 124 | 13.8% |
| $200,000+ | 548 | 60.9% |
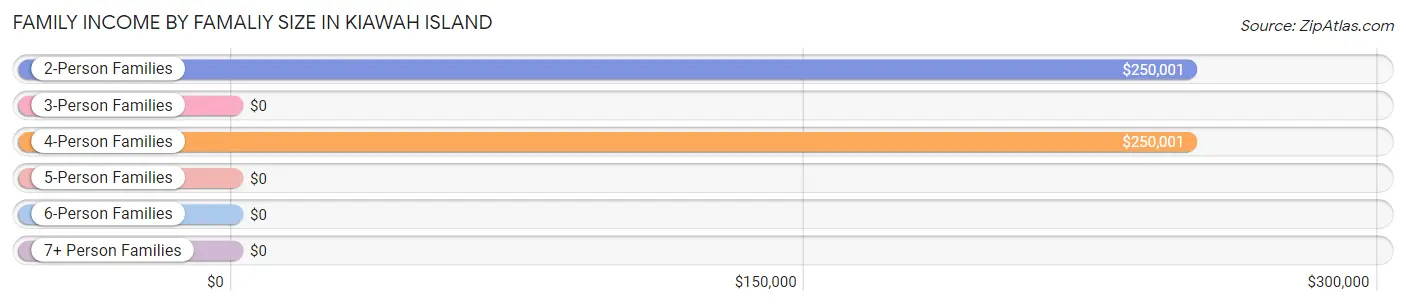
Family Income by Famaliy Size in Kiawah Island
2-person families (866 | 96.2%) account for the highest median family income in Kiawah Island with $250,001 per family, while 2-person families (866 | 96.2%) have the highest median income of $125,000 per family member.
| Income Bracket | # Families | Median Income |
| 2-Person Families | 866 (96.2%) | $250,001 |
| 3-Person Families | 17 (1.9%) | $0 |
| 4-Person Families | 17 (1.9%) | $250,001 |
| 5-Person Families | 0 (0.0%) | $0 |
| 6-Person Families | 0 (0.0%) | $0 |
| 7+ Person Families | 0 (0.0%) | $0 |
| Total | 900 (100.0%) | $250,001 |
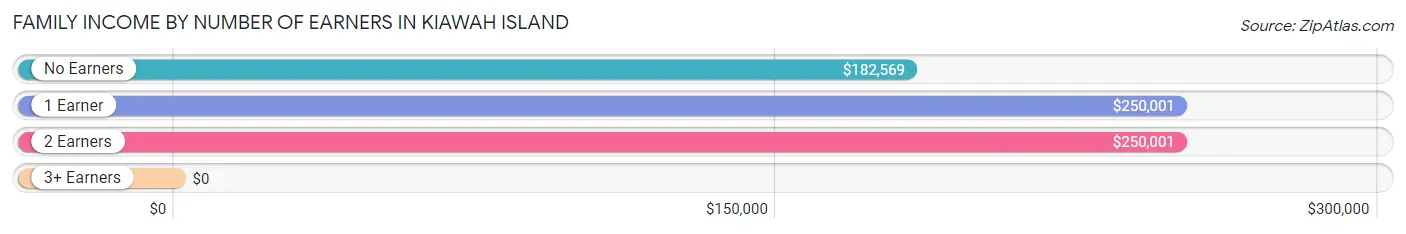
Family Income by Number of Earners in Kiawah Island
| Number of Earners | # Families | Median Income |
| No Earners | 389 (43.2%) | $182,569 |
| 1 Earner | 272 (30.2%) | $250,001 |
| 2 Earners | 234 (26.0%) | $250,001 |
| 3+ Earners | 5 (0.6%) | $0 |
| Total | 900 (100.0%) | $250,001 |
Household Income in Kiawah Island
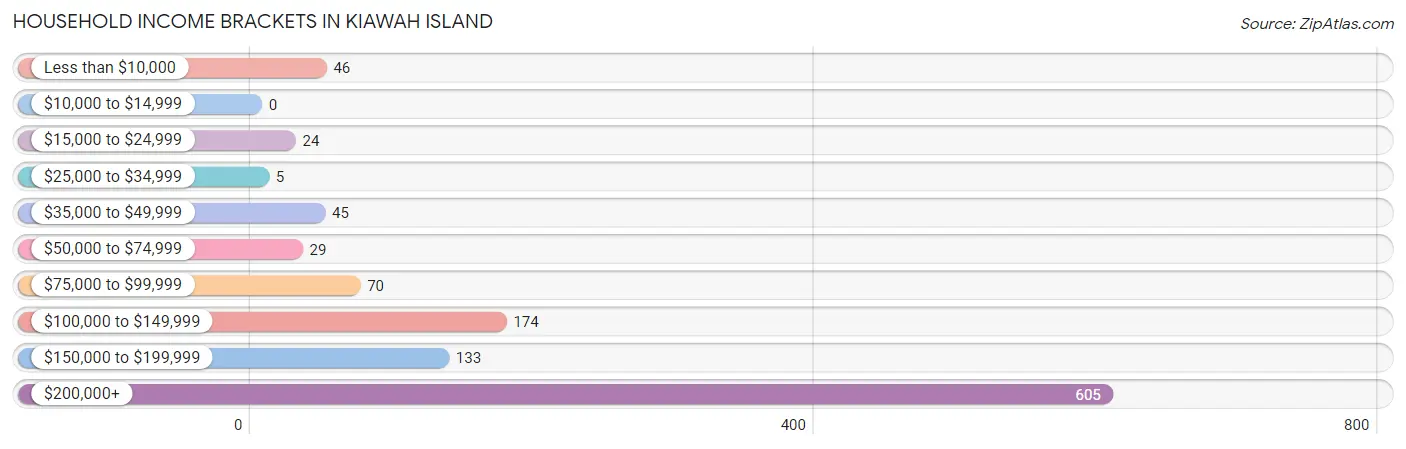
Household Income Brackets in Kiawah Island
With 605 households falling in the category, the $200,000+ income range is the most frequent in Kiawah Island, accounting for 53.4% of all households.
| Income Bracket | # Households | % Households |
| Less than $10,000 | 46 | 4.1% |
| $10,000 to $14,999 | 0 | 0.0% |
| $15,000 to $24,999 | 24 | 2.1% |
| $25,000 to $34,999 | 5 | 0.4% |
| $35,000 to $49,999 | 45 | 4.0% |
| $50,000 to $74,999 | 29 | 2.6% |
| $75,000 to $99,999 | 70 | 6.2% |
| $100,000 to $149,999 | 174 | 15.4% |
| $150,000 to $199,999 | 133 | 11.7% |
| $200,000+ | 605 | 53.4% |
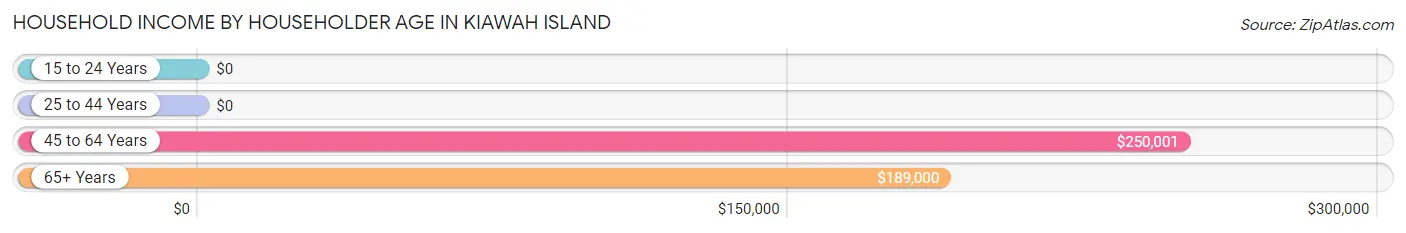
Household Income by Householder Age in Kiawah Island
The median household income in Kiawah Island is $214,250, with the highest median household income of $250,001 found in the 45 to 64 years age bracket for the primary householder. A total of 428 households (37.8%) fall into this category.
| Income Bracket | # Households | Median Income |
| 15 to 24 Years | 0 (0.0%) | $0 |
| 25 to 44 Years | 5 (0.4%) | $0 |
| 45 to 64 Years | 428 (37.8%) | $250,001 |
| 65+ Years | 700 (61.8%) | $189,000 |
| Total | 1,133 (100.0%) | $214,250 |
Poverty in Kiawah Island
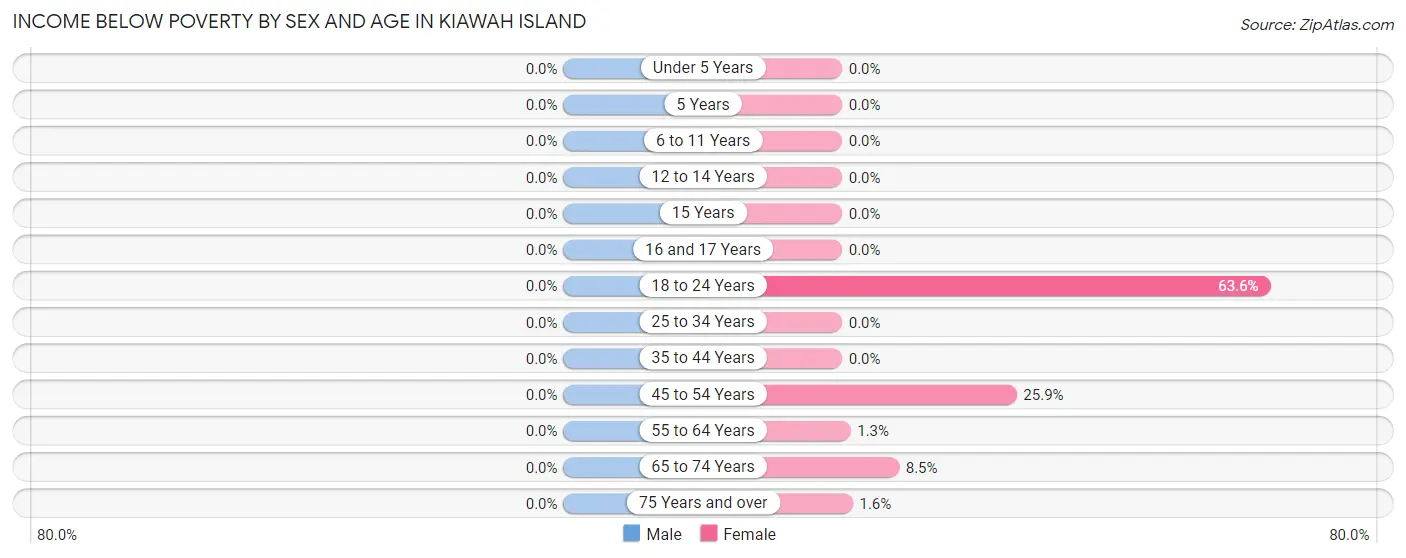
Income Below Poverty by Sex and Age in Kiawah Island
| Age Bracket | Male | Female |
| Under 5 Years | 0 (0.0%) | 0 (0.0%) |
| 5 Years | 0 (0.0%) | 0 (0.0%) |
| 6 to 11 Years | 0 (0.0%) | 0 (0.0%) |
| 12 to 14 Years | 0 (0.0%) | 0 (0.0%) |
| 15 Years | 0 (0.0%) | 0 (0.0%) |
| 16 and 17 Years | 0 (0.0%) | 0 (0.0%) |
| 18 to 24 Years | 0 (0.0%) | 7 (63.6%) |
| 25 to 34 Years | 0 (0.0%) | 0 (0.0%) |
| 35 to 44 Years | 0 (0.0%) | 0 (0.0%) |
| 45 to 54 Years | 0 (0.0%) | 7 (25.9%) |
| 55 to 64 Years | 0 (0.0%) | 5 (1.3%) |
| 65 to 74 Years | 0 (0.0%) | 38 (8.5%) |
| 75 Years and over | 0 (0.0%) | 3 (1.6%) |
| Total | 0 (0.0%) | 60 (5.5%) |
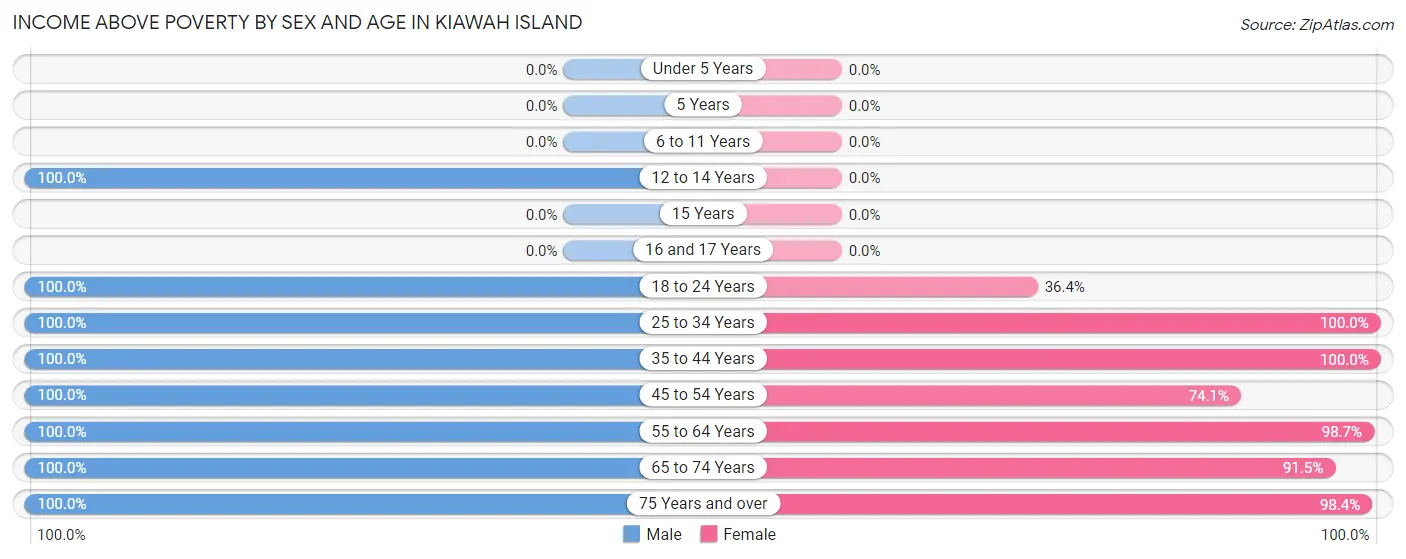
Income Above Poverty by Sex and Age in Kiawah Island
According to the poverty statistics in Kiawah Island, males aged 12 to 14 years and females aged 25 to 34 years are the age groups that are most secure financially, with 100.0% of males and 100.0% of females in these age groups living above the poverty line.
| Age Bracket | Male | Female |
| Under 5 Years | 0 (0.0%) | 0 (0.0%) |
| 5 Years | 0 (0.0%) | 0 (0.0%) |
| 6 to 11 Years | 0 (0.0%) | 0 (0.0%) |
| 12 to 14 Years | 14 (100.0%) | 0 (0.0%) |
| 15 Years | 0 (0.0%) | 0 (0.0%) |
| 16 and 17 Years | 0 (0.0%) | 0 (0.0%) |
| 18 to 24 Years | 10 (100.0%) | 4 (36.4%) |
| 25 to 34 Years | 14 (100.0%) | 6 (100.0%) |
| 35 to 44 Years | 2 (100.0%) | 9 (100.0%) |
| 45 to 54 Years | 47 (100.0%) | 20 (74.1%) |
| 55 to 64 Years | 322 (100.0%) | 392 (98.7%) |
| 65 to 74 Years | 361 (100.0%) | 411 (91.5%) |
| 75 Years and over | 265 (100.0%) | 186 (98.4%) |
| Total | 1,035 (100.0%) | 1,028 (94.5%) |
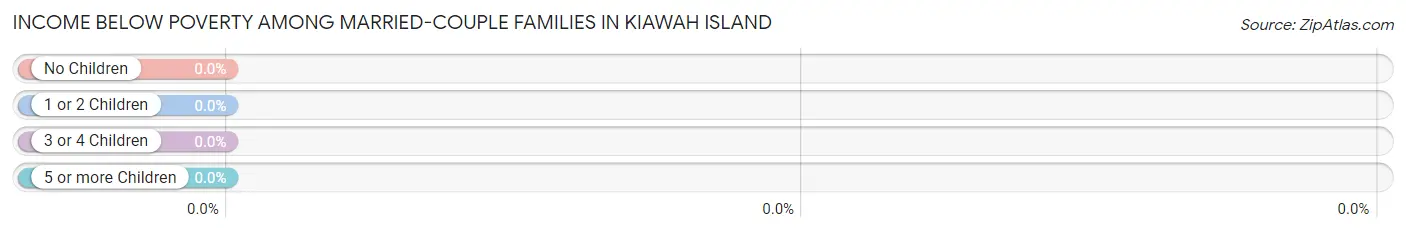
Income Below Poverty Among Married-Couple Families in Kiawah Island
| Children | Above Poverty | Below Poverty |
| No Children | 885 (100.0%) | 0 (0.0%) |
| 1 or 2 Children | 7 (100.0%) | 0 (0.0%) |
| 3 or 4 Children | 0 (0.0%) | 0 (0.0%) |
| 5 or more Children | 0 (0.0%) | 0 (0.0%) |
| Total | 892 (100.0%) | 0 (0.0%) |
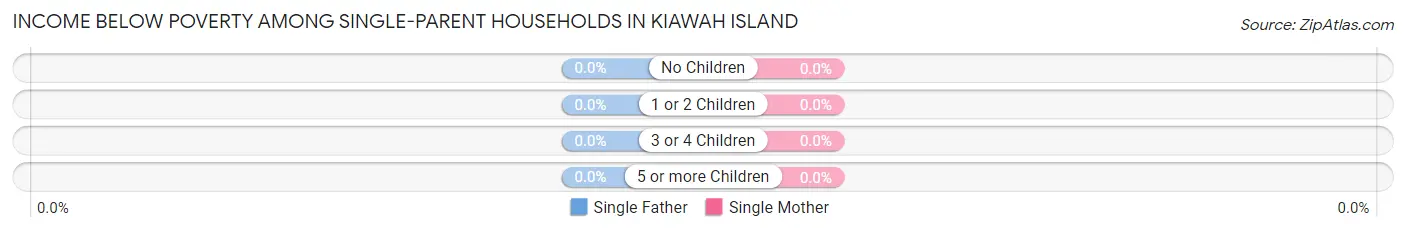
Income Below Poverty Among Single-Parent Households in Kiawah Island
| Children | Single Father | Single Mother |
| No Children | 0 (0.0%) | 0 (0.0%) |
| 1 or 2 Children | 0 (0.0%) | 0 (0.0%) |
| 3 or 4 Children | 0 (0.0%) | 0 (0.0%) |
| 5 or more Children | 0 (0.0%) | 0 (0.0%) |
| Total | 0 (0.0%) | 0 (0.0%) |
Income Below Poverty Among Married-Couple vs Single-Parent Households in Kiawah Island
| Children | Married-Couple Families | Single-Parent Households |
| No Children | 0 (0.0%) | 0 (0.0%) |
| 1 or 2 Children | 0 (0.0%) | 0 (0.0%) |
| 3 or 4 Children | 0 (0.0%) | 0 (0.0%) |
| 5 or more Children | 0 (0.0%) | 0 (0.0%) |
| Total | 0 (0.0%) | 0 (0.0%) |
Employment Characteristics in Kiawah Island
Employment by Class of Employer in Kiawah Island
Among the 657 employed individuals in Kiawah Island, private company employees (325 | 49.5%), self-employed (not incorporated) (163 | 24.8%), and self-employed (incorporated) (83 | 12.6%) make up the most common classes of employment.
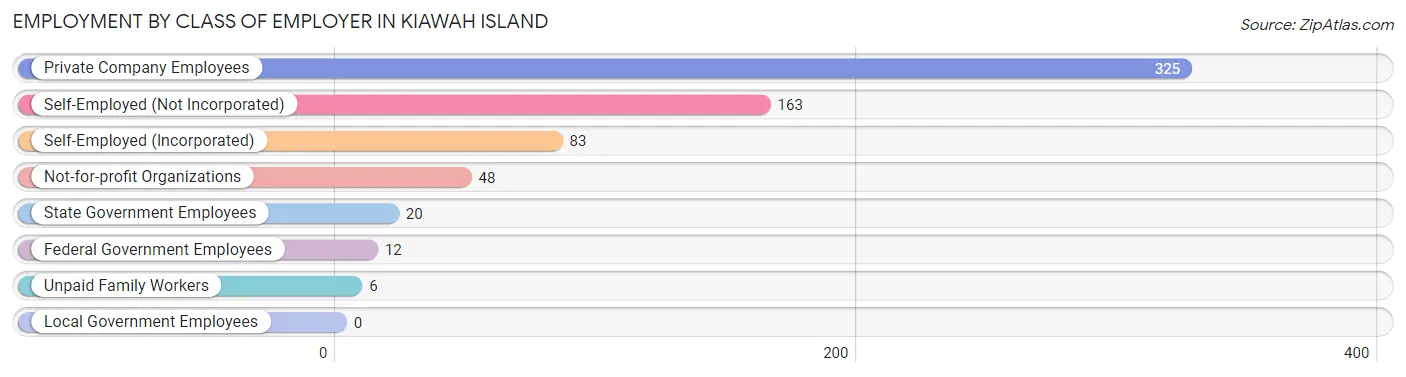
| Employer Class | # Employees | % Employees |
| Private Company Employees | 325 | 49.5% |
| Self-Employed (Incorporated) | 83 | 12.6% |
| Self-Employed (Not Incorporated) | 163 | 24.8% |
| Not-for-profit Organizations | 48 | 7.3% |
| Local Government Employees | 0 | 0.0% |
| State Government Employees | 20 | 3.0% |
| Federal Government Employees | 12 | 1.8% |
| Unpaid Family Workers | 6 | 0.9% |
| Total | 657 | 100.0% |
Employment Status by Age in Kiawah Island
According to the labor force statistics for Kiawah Island, out of the total population over 16 years of age (2,109), 32.6% or 688 individuals are in the labor force, with 3.8% or 26 of them unemployed. The age group with the highest labor force participation rate is 30 to 34 years, with 100.0% or 8 individuals in the labor force. Within the labor force, the 30 to 34 years age range has the highest percentage of unemployed individuals, with 37.5% or 3 of them being unemployed.
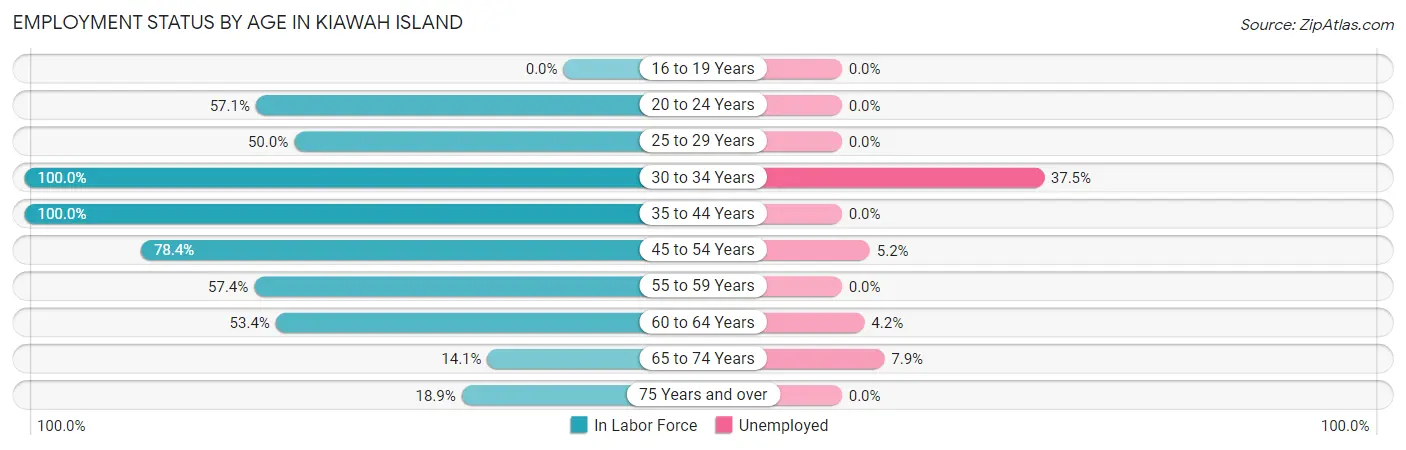
| Age Bracket | In Labor Force | Unemployed |
| 16 to 19 Years | 0 (0.0%) | 0 (0.0%) |
| 20 to 24 Years | 12 (57.1%) | 0 (0.0%) |
| 25 to 29 Years | 6 (50.0%) | 0 (0.0%) |
| 30 to 34 Years | 8 (100.0%) | 3 (37.5%) |
| 35 to 44 Years | 11 (100.0%) | 0 (0.0%) |
| 45 to 54 Years | 58 (78.4%) | 3 (5.2%) |
| 55 to 59 Years | 132 (57.4%) | 0 (0.0%) |
| 60 to 64 Years | 261 (53.4%) | 11 (4.2%) |
| 65 to 74 Years | 114 (14.1%) | 9 (7.9%) |
| 75 Years and over | 86 (18.9%) | 0 (0.0%) |
| Total | 688 (32.6%) | 26 (3.8%) |
Employment Status by Educational Attainment in Kiawah Island
According to labor force statistics for Kiawah Island, 57.8% of individuals (476) out of the total population between 25 and 64 years of age (824) are in the labor force, with 3.6% or 17 of them being unemployed. The group with the highest labor force participation rate are those with the educational attainment of college / associate degree, with 65.8% or 73 individuals in the labor force. Within the labor force, individuals with bachelor's degree or higher education have the highest percentage of unemployment, with 4.2% or 17 of them being unemployed.
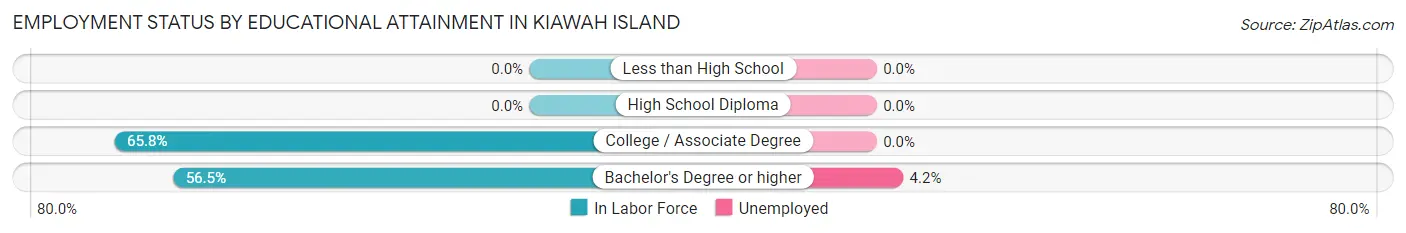
| Educational Attainment | In Labor Force | Unemployed |
| Less than High School | 0 (0.0%) | 0 (0.0%) |
| High School Diploma | 0 (0.0%) | 0 (0.0%) |
| College / Associate Degree | 73 (65.8%) | 0 (0.0%) |
| Bachelor's Degree or higher | 403 (56.5%) | 30 (4.2%) |
| Total | 476 (57.8%) | 30 (3.6%) |
Employment Occupations by Sex in Kiawah Island
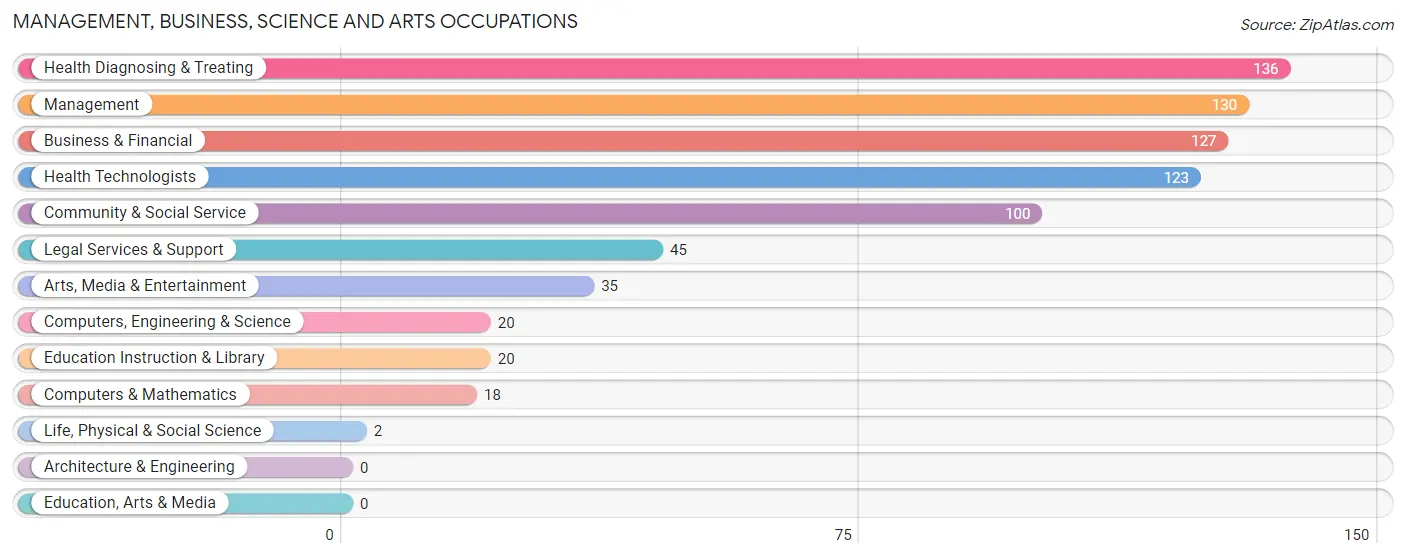
Management, Business, Science and Arts Occupations
The most common Management, Business, Science and Arts occupations in Kiawah Island are Health Diagnosing & Treating (136 | 20.5%), Management (130 | 19.6%), Business & Financial (127 | 19.2%), Health Technologists (123 | 18.6%), and Community & Social Service (100 | 15.1%).
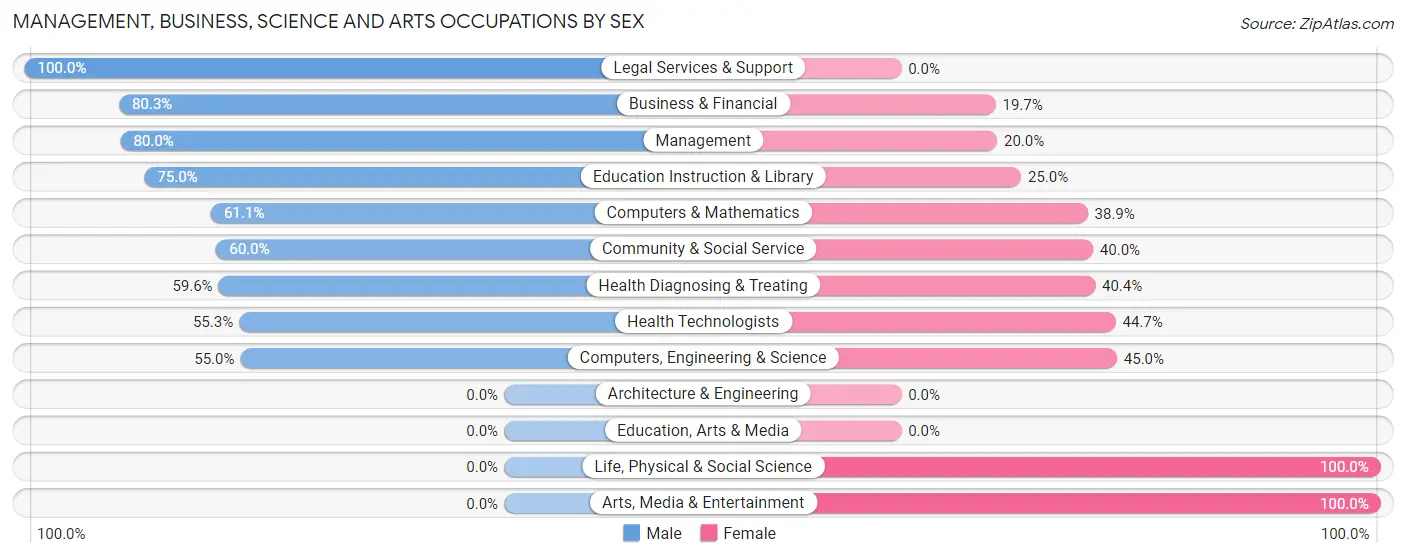
Management, Business, Science and Arts Occupations by Sex
Within the Management, Business, Science and Arts occupations in Kiawah Island, the most male-oriented occupations are Legal Services & Support (100.0%), Business & Financial (80.3%), and Management (80.0%), while the most female-oriented occupations are Life, Physical & Social Science (100.0%), Arts, Media & Entertainment (100.0%), and Computers, Engineering & Science (45.0%).
| Occupation | Male | Female |
| Management | 104 (80.0%) | 26 (20.0%) |
| Business & Financial | 102 (80.3%) | 25 (19.7%) |
| Computers, Engineering & Science | 11 (55.0%) | 9 (45.0%) |
| Computers & Mathematics | 11 (61.1%) | 7 (38.9%) |
| Architecture & Engineering | 0 (0.0%) | 0 (0.0%) |
| Life, Physical & Social Science | 0 (0.0%) | 2 (100.0%) |
| Community & Social Service | 60 (60.0%) | 40 (40.0%) |
| Education, Arts & Media | 0 (0.0%) | 0 (0.0%) |
| Legal Services & Support | 45 (100.0%) | 0 (0.0%) |
| Education Instruction & Library | 15 (75.0%) | 5 (25.0%) |
| Arts, Media & Entertainment | 0 (0.0%) | 35 (100.0%) |
| Health Diagnosing & Treating | 81 (59.6%) | 55 (40.4%) |
| Health Technologists | 68 (55.3%) | 55 (44.7%) |
| Total (Category) | 358 (69.8%) | 155 (30.2%) |
| Total (Overall) | 426 (64.3%) | 236 (35.6%) |
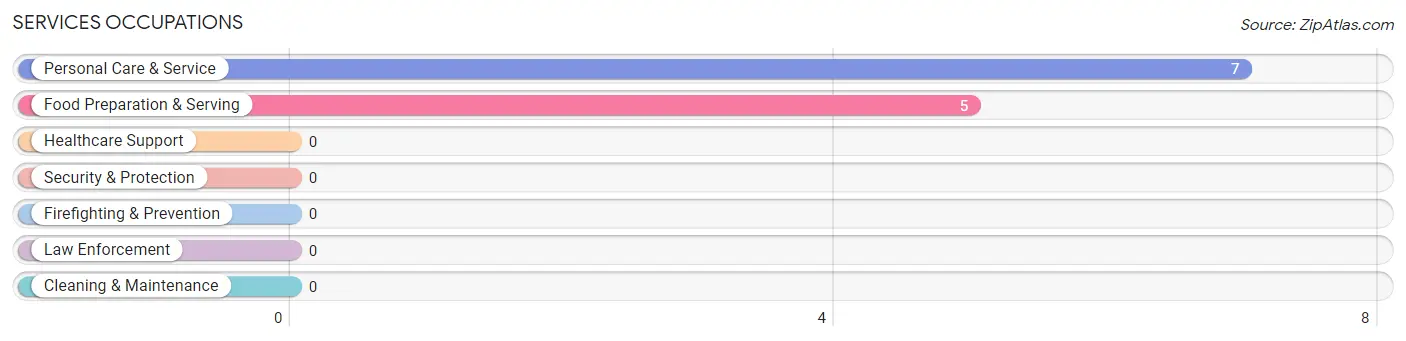
Services Occupations
The most common Services occupations in Kiawah Island are Personal Care & Service (7 | 1.1%), and Food Preparation & Serving (5 | 0.8%).
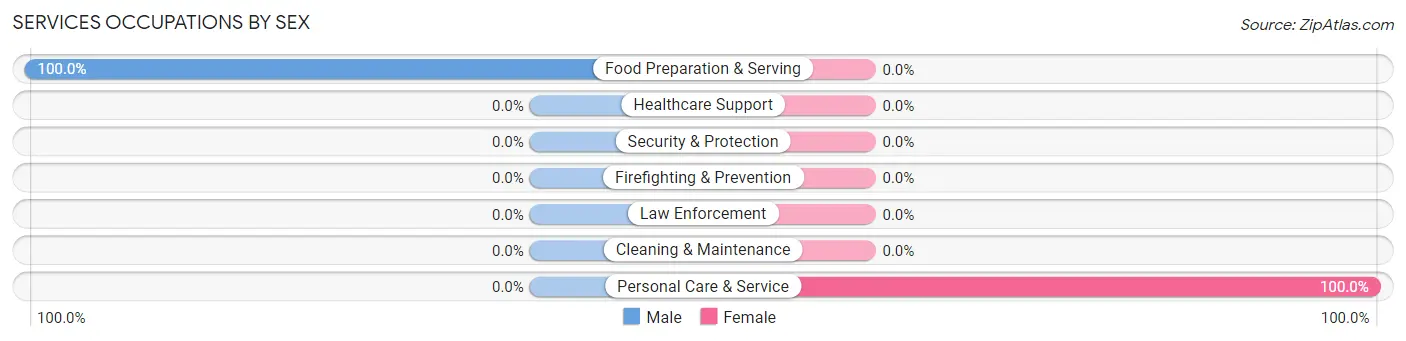
Services Occupations by Sex
| Occupation | Male | Female |
| Healthcare Support | 0 (0.0%) | 0 (0.0%) |
| Security & Protection | 0 (0.0%) | 0 (0.0%) |
| Firefighting & Prevention | 0 (0.0%) | 0 (0.0%) |
| Law Enforcement | 0 (0.0%) | 0 (0.0%) |
| Food Preparation & Serving | 5 (100.0%) | 0 (0.0%) |
| Cleaning & Maintenance | 0 (0.0%) | 0 (0.0%) |
| Personal Care & Service | 0 (0.0%) | 7 (100.0%) |
| Total (Category) | 5 (41.7%) | 7 (58.3%) |
| Total (Overall) | 426 (64.3%) | 236 (35.6%) |
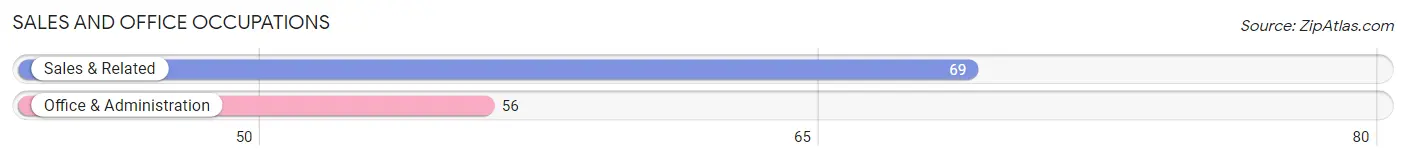
Sales and Office Occupations
The most common Sales and Office occupations in Kiawah Island are Sales & Related (69 | 10.4%), and Office & Administration (56 | 8.5%).
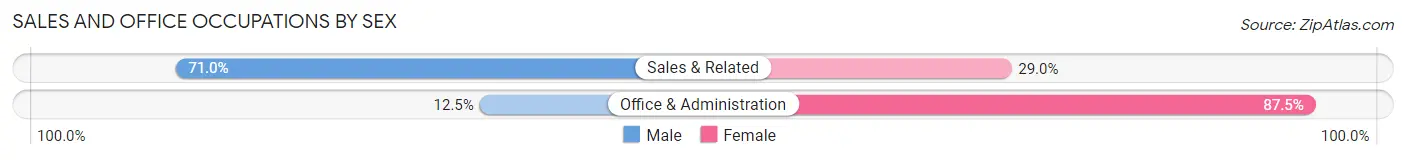
Sales and Office Occupations by Sex
| Occupation | Male | Female |
| Sales & Related | 49 (71.0%) | 20 (29.0%) |
| Office & Administration | 7 (12.5%) | 49 (87.5%) |
| Total (Category) | 56 (44.8%) | 69 (55.2%) |
| Total (Overall) | 426 (64.3%) | 236 (35.6%) |
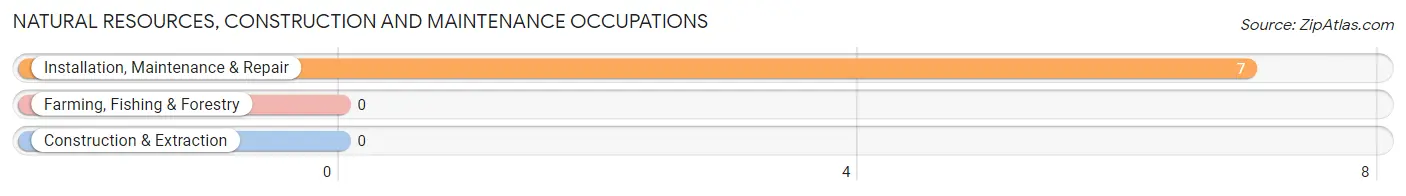
Natural Resources, Construction and Maintenance Occupations
The most common Natural Resources, Construction and Maintenance occupations in Kiawah Island are , and Installation, Maintenance & Repair (7 | 1.1%).
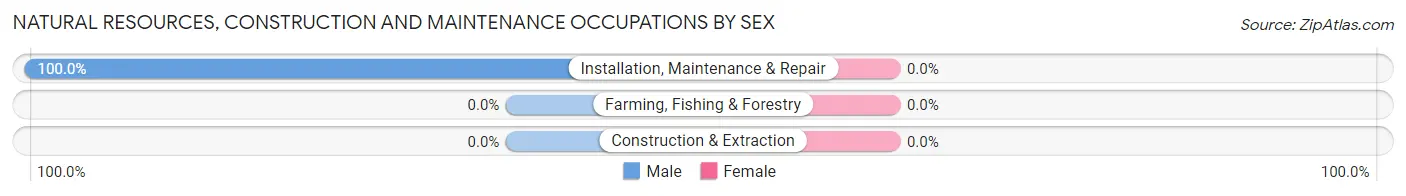
Natural Resources, Construction and Maintenance Occupations by Sex
| Occupation | Male | Female |
| Farming, Fishing & Forestry | 0 (0.0%) | 0 (0.0%) |
| Construction & Extraction | 0 (0.0%) | 0 (0.0%) |
| Installation, Maintenance & Repair | 7 (100.0%) | 0 (0.0%) |
| Total (Category) | 7 (100.0%) | 0 (0.0%) |
| Total (Overall) | 426 (64.3%) | 236 (35.6%) |
Production, Transportation and Moving Occupations
The most common Production, Transportation and Moving occupations in Kiawah Island are , and Production (5 | 0.8%).
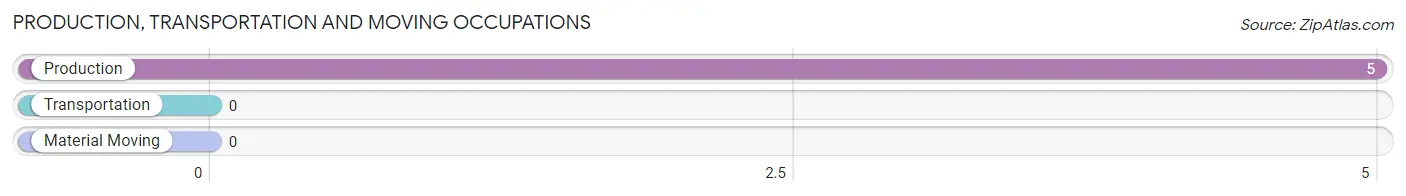
Production, Transportation and Moving Occupations by Sex
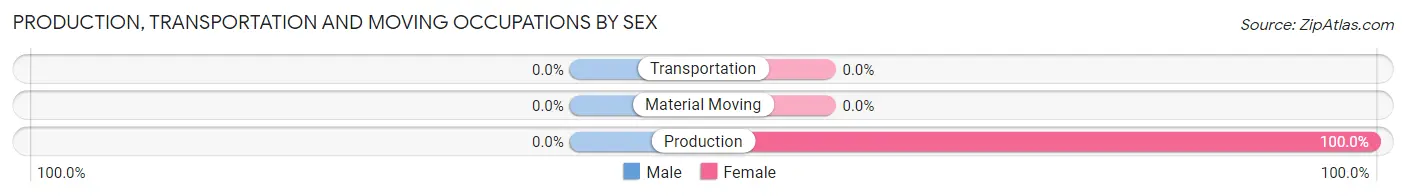
| Occupation | Male | Female |
| Production | 0 (0.0%) | 5 (100.0%) |
| Transportation | 0 (0.0%) | 0 (0.0%) |
| Material Moving | 0 (0.0%) | 0 (0.0%) |
| Total (Category) | 0 (0.0%) | 5 (100.0%) |
| Total (Overall) | 426 (64.3%) | 236 (35.6%) |
Employment Industries by Sex in Kiawah Island
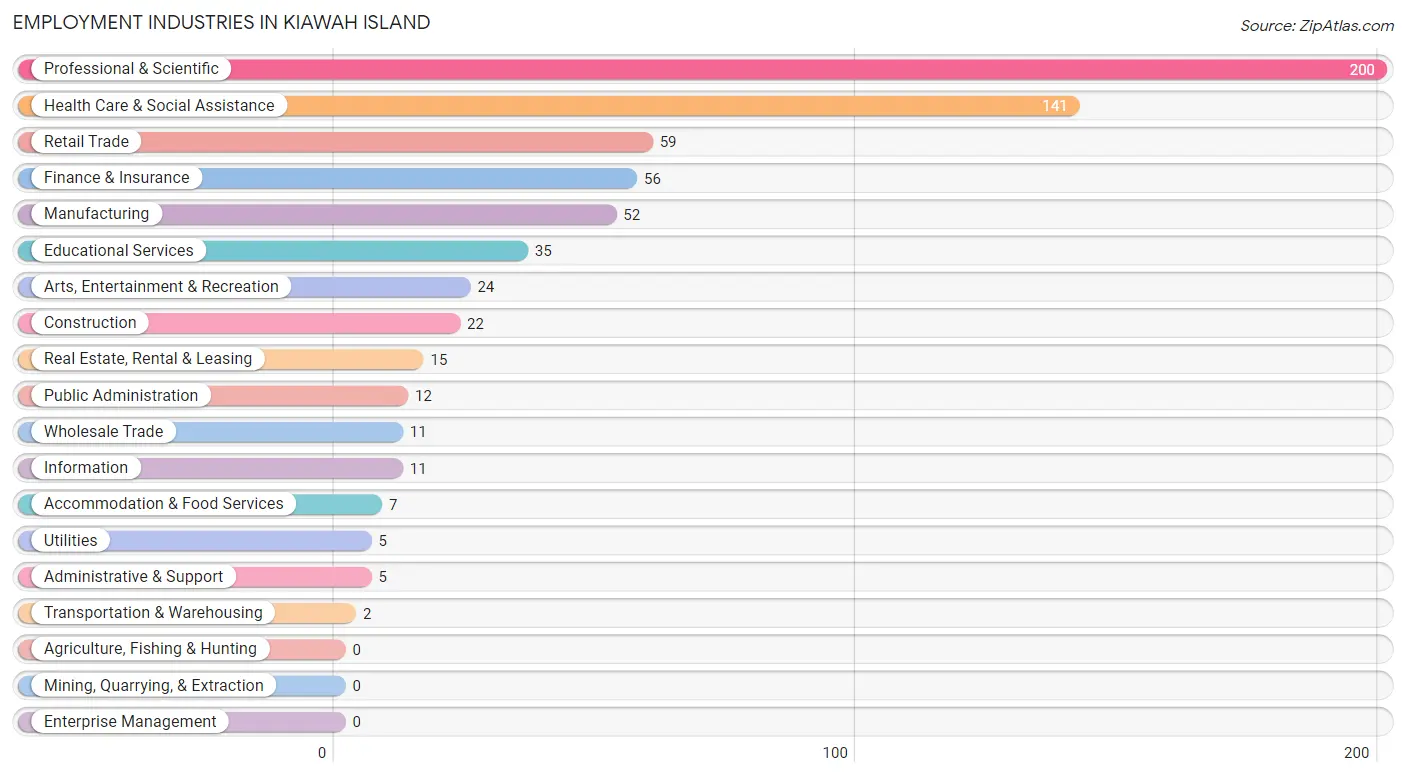
Employment Industries in Kiawah Island
The major employment industries in Kiawah Island include Professional & Scientific (200 | 30.2%), Health Care & Social Assistance (141 | 21.3%), Retail Trade (59 | 8.9%), Finance & Insurance (56 | 8.5%), and Manufacturing (52 | 7.9%).
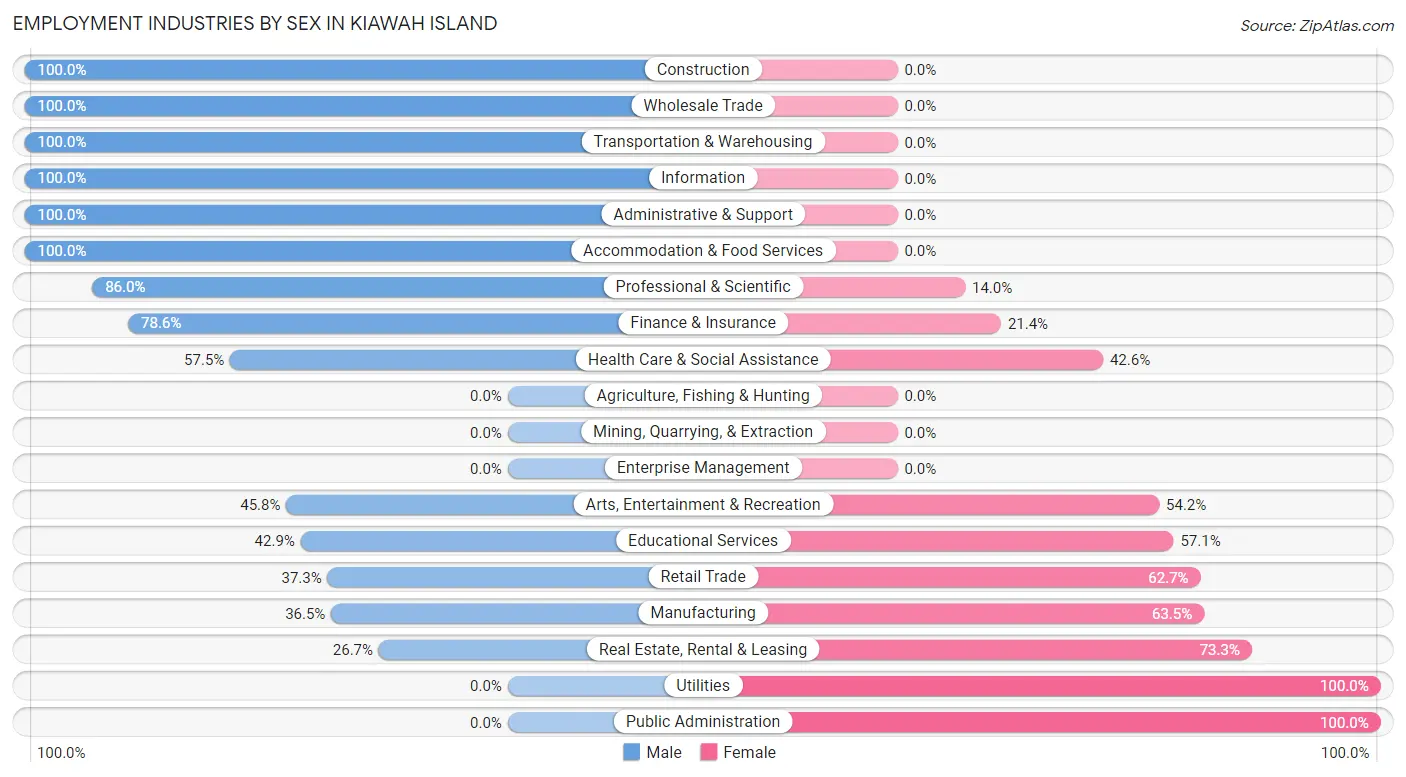
Employment Industries by Sex in Kiawah Island
The Kiawah Island industries that see more men than women are Construction (100.0%), Wholesale Trade (100.0%), and Transportation & Warehousing (100.0%), whereas the industries that tend to have a higher number of women are Utilities (100.0%), Public Administration (100.0%), and Real Estate, Rental & Leasing (73.3%).
| Industry | Male | Female |
| Agriculture, Fishing & Hunting | 0 (0.0%) | 0 (0.0%) |
| Mining, Quarrying, & Extraction | 0 (0.0%) | 0 (0.0%) |
| Construction | 22 (100.0%) | 0 (0.0%) |
| Manufacturing | 19 (36.5%) | 33 (63.5%) |
| Wholesale Trade | 11 (100.0%) | 0 (0.0%) |
| Retail Trade | 22 (37.3%) | 37 (62.7%) |
| Transportation & Warehousing | 2 (100.0%) | 0 (0.0%) |
| Utilities | 0 (0.0%) | 5 (100.0%) |
| Information | 11 (100.0%) | 0 (0.0%) |
| Finance & Insurance | 44 (78.6%) | 12 (21.4%) |
| Real Estate, Rental & Leasing | 4 (26.7%) | 11 (73.3%) |
| Professional & Scientific | 172 (86.0%) | 28 (14.0%) |
| Enterprise Management | 0 (0.0%) | 0 (0.0%) |
| Administrative & Support | 5 (100.0%) | 0 (0.0%) |
| Educational Services | 15 (42.9%) | 20 (57.1%) |
| Health Care & Social Assistance | 81 (57.5%) | 60 (42.5%) |
| Arts, Entertainment & Recreation | 11 (45.8%) | 13 (54.2%) |
| Accommodation & Food Services | 7 (100.0%) | 0 (0.0%) |
| Public Administration | 0 (0.0%) | 12 (100.0%) |
| Total | 426 (64.3%) | 236 (35.6%) |
Education in Kiawah Island
School Enrollment in Kiawah Island
The most common levels of schooling among the 95 students in Kiawah Island are college / undergraduate (49 | 51.6%), graduate / professional (25 | 26.3%), and middle school (21 | 22.1%).
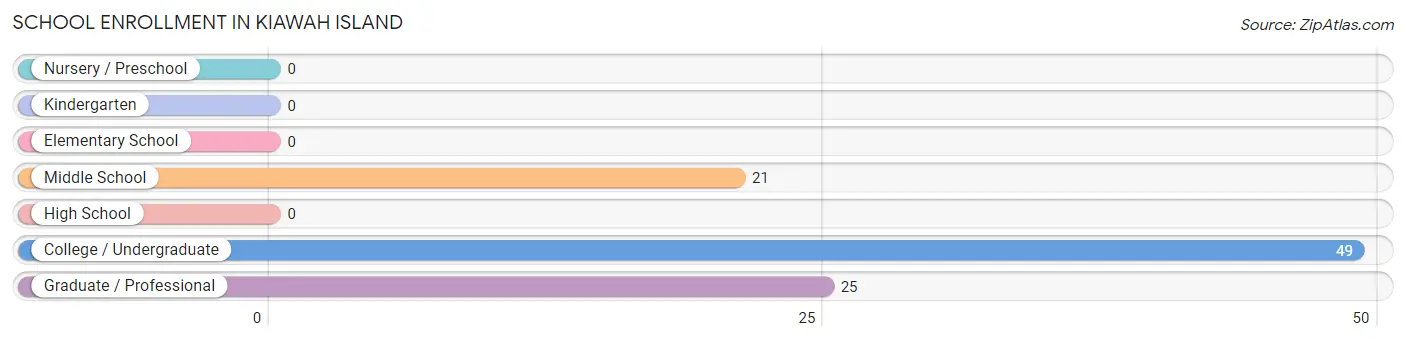
| School Level | # Students | % Students |
| Nursery / Preschool | 0 | 0.0% |
| Kindergarten | 0 | 0.0% |
| Elementary School | 0 | 0.0% |
| Middle School | 21 | 22.1% |
| High School | 0 | 0.0% |
| College / Undergraduate | 49 | 51.6% |
| Graduate / Professional | 25 | 26.3% |
| Total | 95 | 100.0% |
School Enrollment by Age by Funding Source in Kiawah Island
Out of a total of 95 students who are enrolled in schools in Kiawah Island, 58 (61.1%) attend a private institution, while the remaining 37 (38.9%) are enrolled in public schools. The age group of 10 to 14 year olds has the highest likelihood of being enrolled in private schools, with 21 (100.0% in the age bracket) enrolled. Conversely, the age group of 35 years and over has the lowest likelihood of being enrolled in a private school, with 32 (61.5% in the age bracket) attending a public institution.
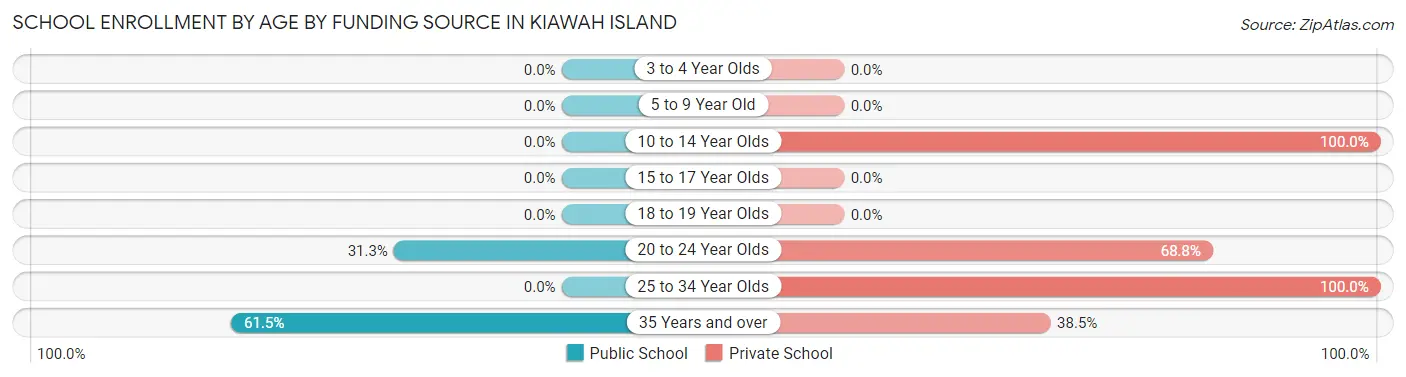
| Age Bracket | Public School | Private School |
| 3 to 4 Year Olds | 0 (0.0%) | 0 (0.0%) |
| 5 to 9 Year Old | 0 (0.0%) | 0 (0.0%) |
| 10 to 14 Year Olds | 0 (0.0%) | 21 (100.0%) |
| 15 to 17 Year Olds | 0 (0.0%) | 0 (0.0%) |
| 18 to 19 Year Olds | 0 (0.0%) | 0 (0.0%) |
| 20 to 24 Year Olds | 5 (31.2%) | 11 (68.8%) |
| 25 to 34 Year Olds | 0 (0.0%) | 6 (100.0%) |
| 35 Years and over | 32 (61.5%) | 20 (38.5%) |
| Total | 37 (38.9%) | 58 (61.1%) |
Educational Attainment by Field of Study in Kiawah Island
Business (377 | 19.5%), social sciences (292 | 15.1%), education (267 | 13.8%), physical & health sciences (215 | 11.1%), and literature & languages (121 | 6.2%) are the most common fields of study among 1,935 individuals in Kiawah Island who have obtained a bachelor's degree or higher.
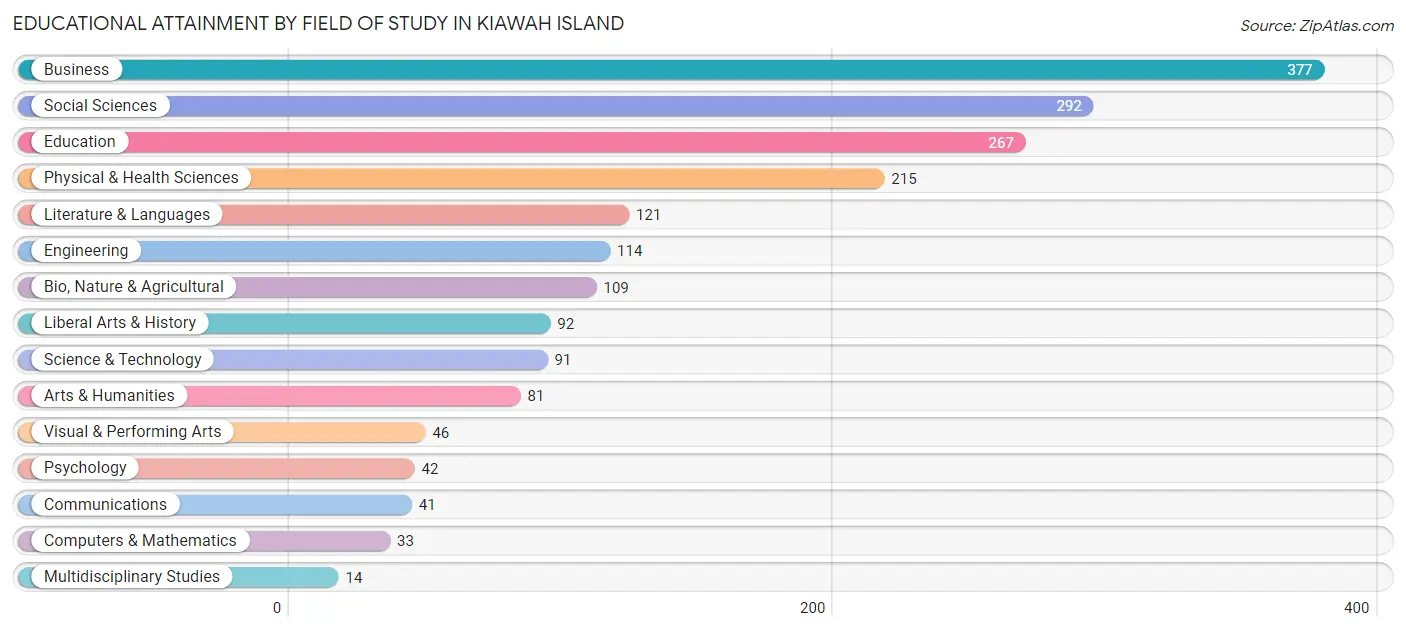
| Field of Study | # Graduates | % Graduates |
| Computers & Mathematics | 33 | 1.7% |
| Bio, Nature & Agricultural | 109 | 5.6% |
| Physical & Health Sciences | 215 | 11.1% |
| Psychology | 42 | 2.2% |
| Social Sciences | 292 | 15.1% |
| Engineering | 114 | 5.9% |
| Multidisciplinary Studies | 14 | 0.7% |
| Science & Technology | 91 | 4.7% |
| Business | 377 | 19.5% |
| Education | 267 | 13.8% |
| Literature & Languages | 121 | 6.2% |
| Liberal Arts & History | 92 | 4.8% |
| Visual & Performing Arts | 46 | 2.4% |
| Communications | 41 | 2.1% |
| Arts & Humanities | 81 | 4.2% |
| Total | 1,935 | 100.0% |
Transportation & Commute in Kiawah Island
Vehicle Availability by Sex in Kiawah Island
The most prevalent vehicle ownership categories in Kiawah Island are males with 2 vehicles (266, accounting for 62.4%) and females with 2 vehicles (177, making up 115.1%).
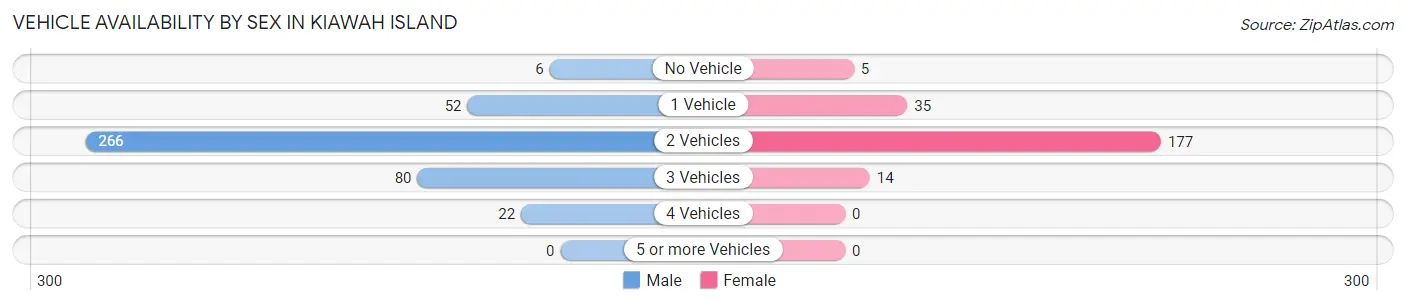
| Vehicles Available | Male | Female |
| No Vehicle | 6 (1.4%) | 5 (2.2%) |
| 1 Vehicle | 52 (12.2%) | 35 (15.1%) |
| 2 Vehicles | 266 (62.4%) | 177 (76.6%) |
| 3 Vehicles | 80 (18.8%) | 14 (6.1%) |
| 4 Vehicles | 22 (5.2%) | 0 (0.0%) |
| 5 or more Vehicles | 0 (0.0%) | 0 (0.0%) |
| Total | 426 (100.0%) | 231 (100.0%) |
Commute Time in Kiawah Island
The most frequently occuring commute durations in Kiawah Island are 30 to 34 minutes (118 commuters, 37.6%), 20 to 24 minutes (43 commuters, 13.7%), and 60 to 89 minutes (33 commuters, 10.5%).
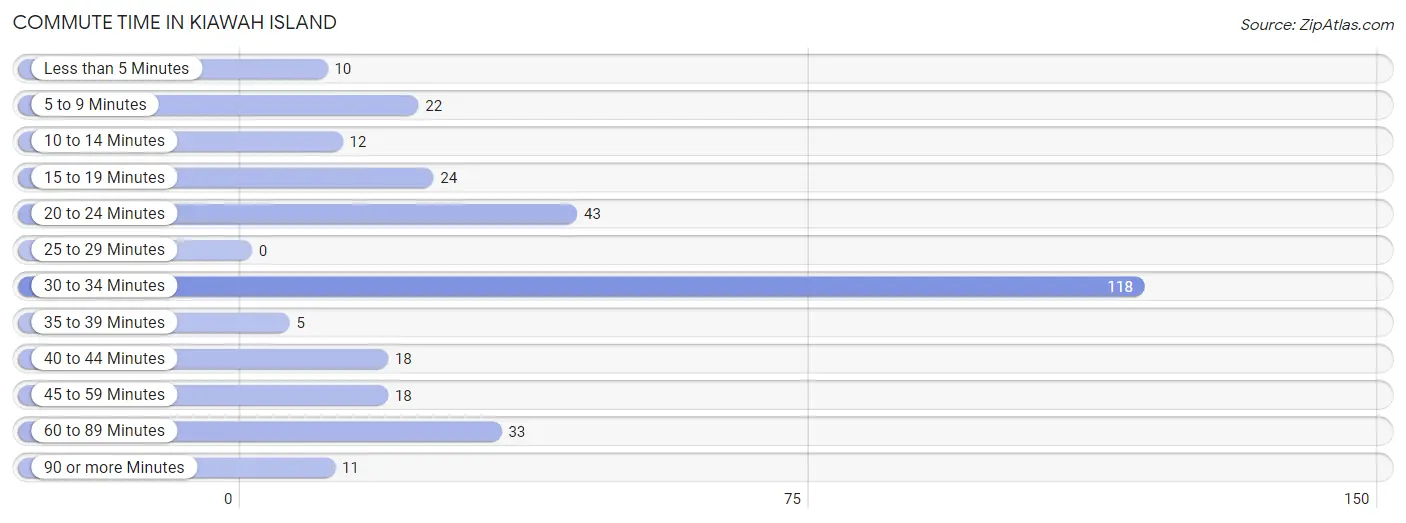
| Commute Time | # Commuters | % Commuters |
| Less than 5 Minutes | 10 | 3.2% |
| 5 to 9 Minutes | 22 | 7.0% |
| 10 to 14 Minutes | 12 | 3.8% |
| 15 to 19 Minutes | 24 | 7.6% |
| 20 to 24 Minutes | 43 | 13.7% |
| 25 to 29 Minutes | 0 | 0.0% |
| 30 to 34 Minutes | 118 | 37.6% |
| 35 to 39 Minutes | 5 | 1.6% |
| 40 to 44 Minutes | 18 | 5.7% |
| 45 to 59 Minutes | 18 | 5.7% |
| 60 to 89 Minutes | 33 | 10.5% |
| 90 or more Minutes | 11 | 3.5% |
Commute Time by Sex in Kiawah Island
The most common commute times in Kiawah Island are 30 to 34 minutes (68 commuters, 33.5%) for males and 30 to 34 minutes (50 commuters, 45.1%) for females.
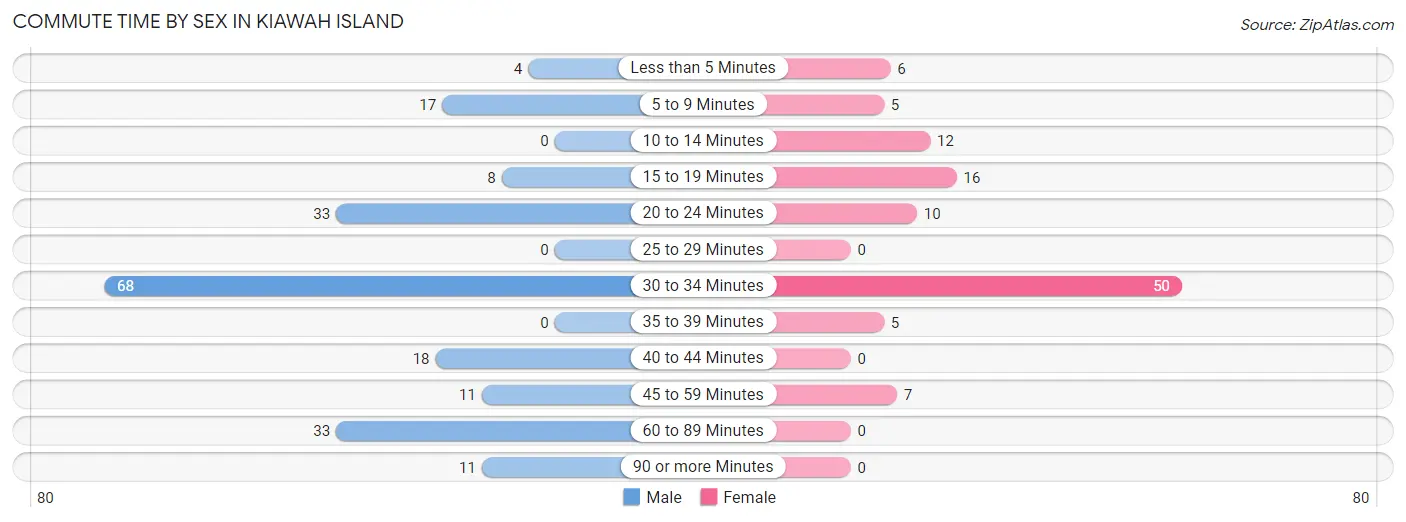
| Commute Time | Male | Female |
| Less than 5 Minutes | 4 (2.0%) | 6 (5.4%) |
| 5 to 9 Minutes | 17 (8.4%) | 5 (4.5%) |
| 10 to 14 Minutes | 0 (0.0%) | 12 (10.8%) |
| 15 to 19 Minutes | 8 (3.9%) | 16 (14.4%) |
| 20 to 24 Minutes | 33 (16.3%) | 10 (9.0%) |
| 25 to 29 Minutes | 0 (0.0%) | 0 (0.0%) |
| 30 to 34 Minutes | 68 (33.5%) | 50 (45.1%) |
| 35 to 39 Minutes | 0 (0.0%) | 5 (4.5%) |
| 40 to 44 Minutes | 18 (8.9%) | 0 (0.0%) |
| 45 to 59 Minutes | 11 (5.4%) | 7 (6.3%) |
| 60 to 89 Minutes | 33 (16.3%) | 0 (0.0%) |
| 90 or more Minutes | 11 (5.4%) | 0 (0.0%) |
Time of Departure to Work by Sex in Kiawah Island
The most frequent times of departure to work in Kiawah Island are 7:00 AM to 7:29 AM (80, 39.4%) for males and 7:00 AM to 7:29 AM (50, 45.1%) for females.
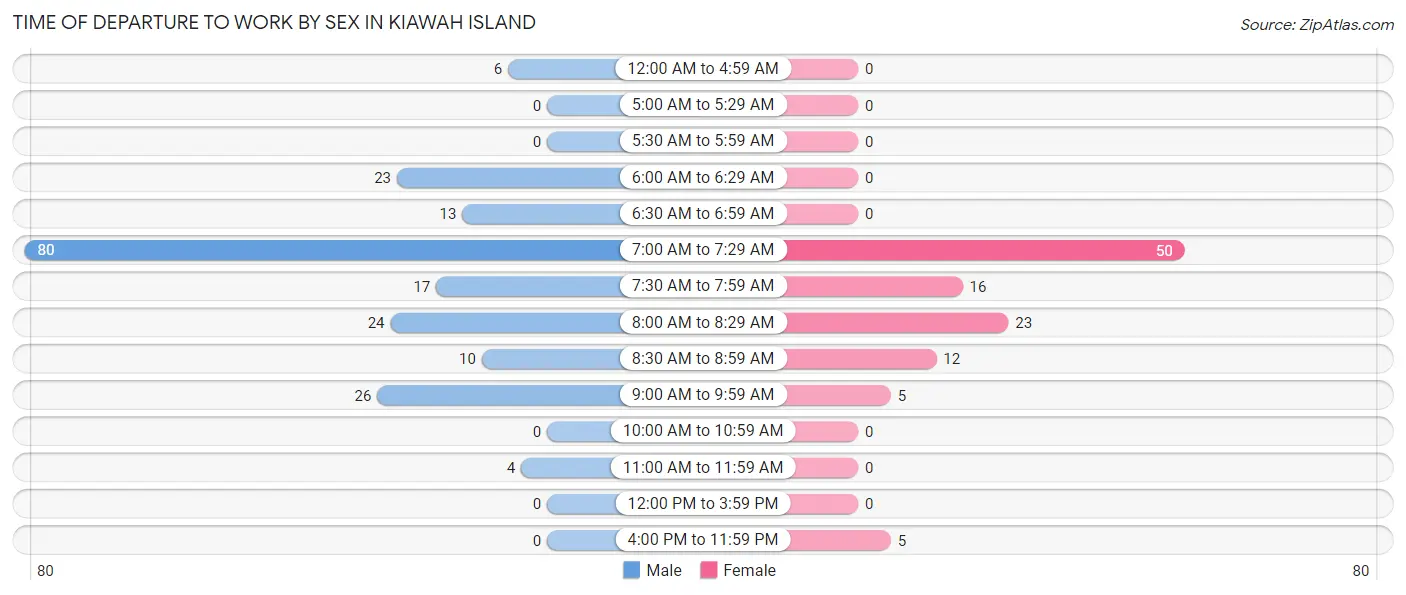
| Time of Departure | Male | Female |
| 12:00 AM to 4:59 AM | 6 (3.0%) | 0 (0.0%) |
| 5:00 AM to 5:29 AM | 0 (0.0%) | 0 (0.0%) |
| 5:30 AM to 5:59 AM | 0 (0.0%) | 0 (0.0%) |
| 6:00 AM to 6:29 AM | 23 (11.3%) | 0 (0.0%) |
| 6:30 AM to 6:59 AM | 13 (6.4%) | 0 (0.0%) |
| 7:00 AM to 7:29 AM | 80 (39.4%) | 50 (45.1%) |
| 7:30 AM to 7:59 AM | 17 (8.4%) | 16 (14.4%) |
| 8:00 AM to 8:29 AM | 24 (11.8%) | 23 (20.7%) |
| 8:30 AM to 8:59 AM | 10 (4.9%) | 12 (10.8%) |
| 9:00 AM to 9:59 AM | 26 (12.8%) | 5 (4.5%) |
| 10:00 AM to 10:59 AM | 0 (0.0%) | 0 (0.0%) |
| 11:00 AM to 11:59 AM | 4 (2.0%) | 0 (0.0%) |
| 12:00 PM to 3:59 PM | 0 (0.0%) | 0 (0.0%) |
| 4:00 PM to 11:59 PM | 0 (0.0%) | 5 (4.5%) |
| Total | 203 (100.0%) | 111 (100.0%) |
Housing Occupancy in Kiawah Island
Occupancy by Ownership in Kiawah Island
Of the total 1,133 dwellings in Kiawah Island, owner-occupied units account for 1,112 (98.2%), while renter-occupied units make up 21 (1.8%).
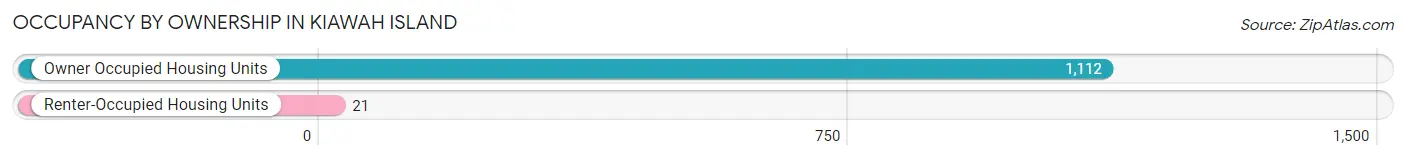
| Occupancy | # Housing Units | % Housing Units |
| Owner Occupied Housing Units | 1,112 | 98.2% |
| Renter-Occupied Housing Units | 21 | 1.8% |
| Total Occupied Housing Units | 1,133 | 100.0% |
Occupancy by Household Size in Kiawah Island
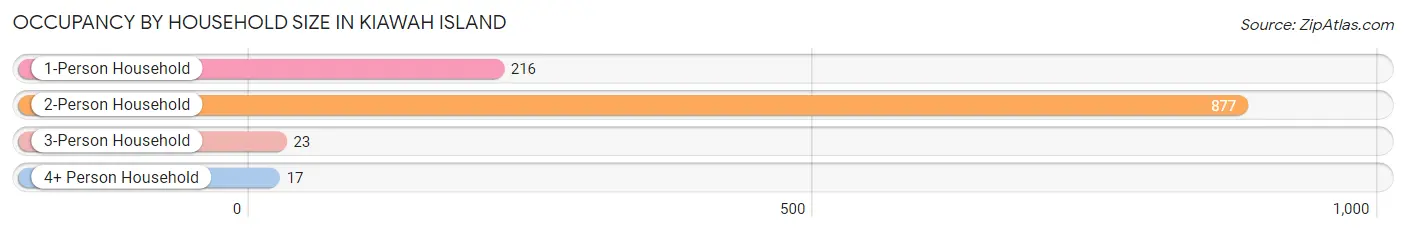
| Household Size | # Housing Units | % Housing Units |
| 1-Person Household | 216 | 19.1% |
| 2-Person Household | 877 | 77.4% |
| 3-Person Household | 23 | 2.0% |
| 4+ Person Household | 17 | 1.5% |
| Total Housing Units | 1,133 | 100.0% |
Occupancy by Ownership by Household Size in Kiawah Island
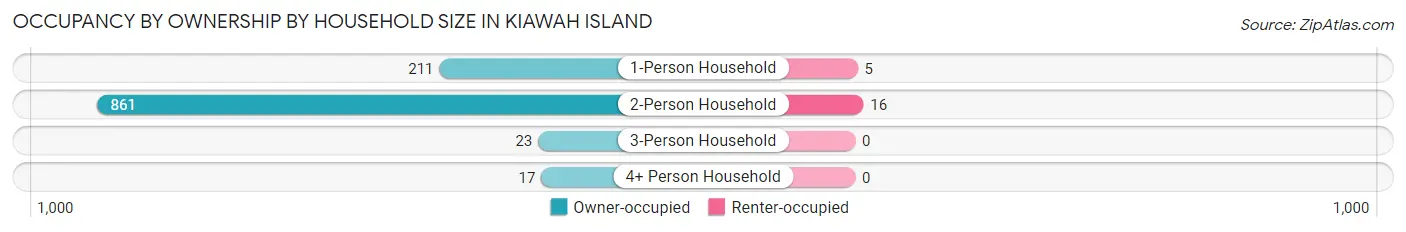
| Household Size | Owner-occupied | Renter-occupied |
| 1-Person Household | 211 (97.7%) | 5 (2.3%) |
| 2-Person Household | 861 (98.2%) | 16 (1.8%) |
| 3-Person Household | 23 (100.0%) | 0 (0.0%) |
| 4+ Person Household | 17 (100.0%) | 0 (0.0%) |
| Total Housing Units | 1,112 (98.2%) | 21 (1.8%) |
Occupancy by Educational Attainment in Kiawah Island
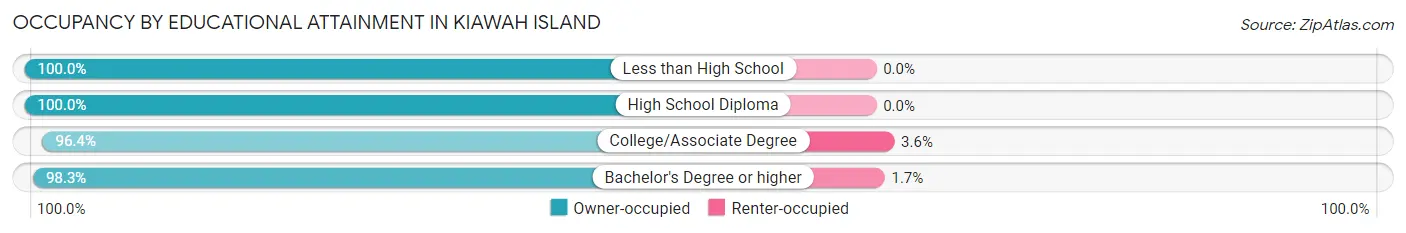
| Household Size | Owner-occupied | Renter-occupied |
| Less than High School | 10 (100.0%) | 0 (0.0%) |
| High School Diploma | 20 (100.0%) | 0 (0.0%) |
| College/Associate Degree | 135 (96.4%) | 5 (3.6%) |
| Bachelor's Degree or higher | 947 (98.3%) | 16 (1.7%) |
Occupancy by Age of Householder in Kiawah Island
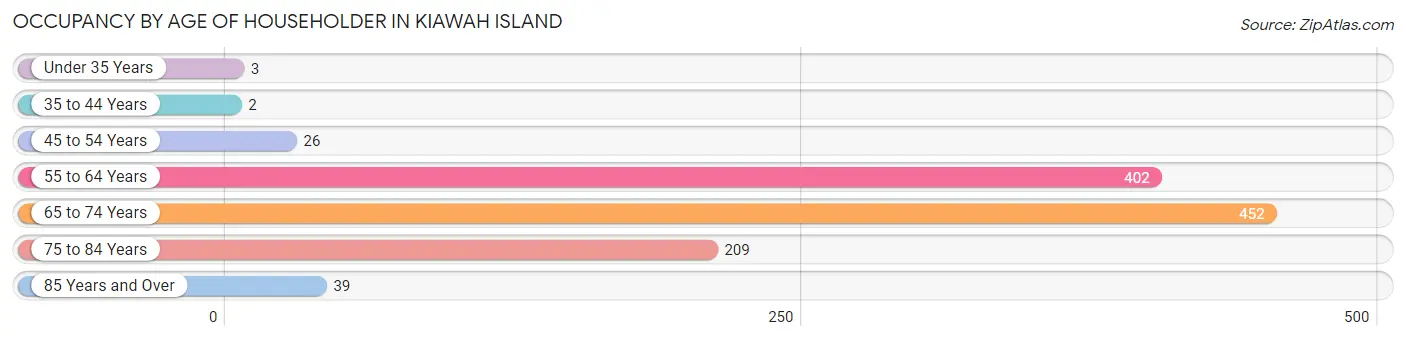
| Age Bracket | # Households | % Households |
| Under 35 Years | 3 | 0.3% |
| 35 to 44 Years | 2 | 0.2% |
| 45 to 54 Years | 26 | 2.3% |
| 55 to 64 Years | 402 | 35.5% |
| 65 to 74 Years | 452 | 39.9% |
| 75 to 84 Years | 209 | 18.4% |
| 85 Years and Over | 39 | 3.4% |
| Total | 1,133 | 100.0% |
Housing Finances in Kiawah Island
Median Income by Occupancy in Kiawah Island
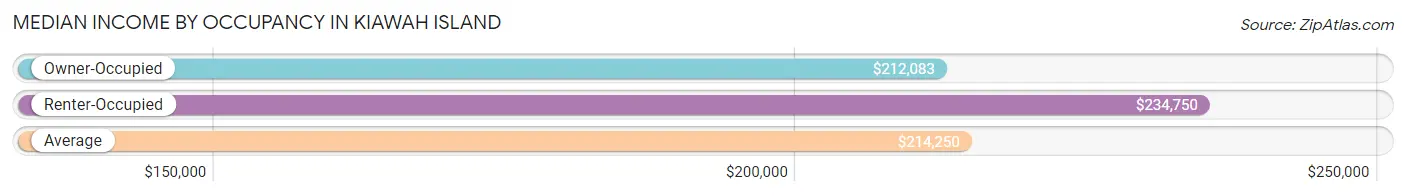
| Occupancy Type | # Households | Median Income |
| Owner-Occupied | 1,112 (98.2%) | $212,083 |
| Renter-Occupied | 21 (1.8%) | $234,750 |
| Average | 1,133 (100.0%) | $214,250 |
Occupancy by Householder Income Bracket in Kiawah Island
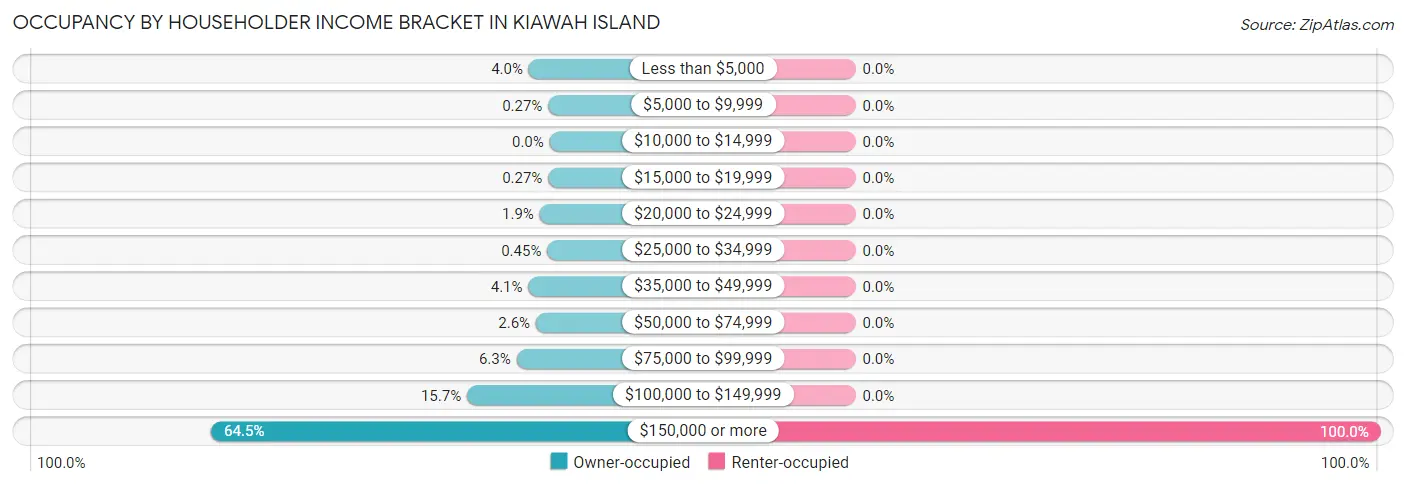
| Income Bracket | Owner-occupied | Renter-occupied |
| Less than $5,000 | 44 (4.0%) | 0 (0.0%) |
| $5,000 to $9,999 | 3 (0.3%) | 0 (0.0%) |
| $10,000 to $14,999 | 0 (0.0%) | 0 (0.0%) |
| $15,000 to $19,999 | 3 (0.3%) | 0 (0.0%) |
| $20,000 to $24,999 | 21 (1.9%) | 0 (0.0%) |
| $25,000 to $34,999 | 5 (0.4%) | 0 (0.0%) |
| $35,000 to $49,999 | 45 (4.1%) | 0 (0.0%) |
| $50,000 to $74,999 | 29 (2.6%) | 0 (0.0%) |
| $75,000 to $99,999 | 70 (6.3%) | 0 (0.0%) |
| $100,000 to $149,999 | 175 (15.7%) | 0 (0.0%) |
| $150,000 or more | 717 (64.5%) | 21 (100.0%) |
| Total | 1,112 (100.0%) | 21 (100.0%) |
Monthly Housing Cost Tiers in Kiawah Island
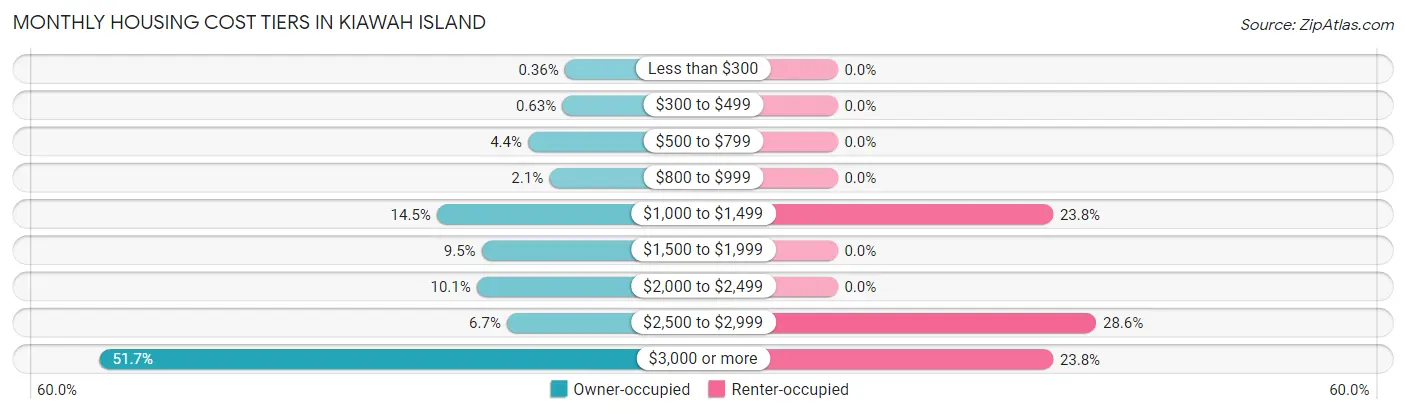
| Monthly Cost | Owner-occupied | Renter-occupied |
| Less than $300 | 4 (0.4%) | 0 (0.0%) |
| $300 to $499 | 7 (0.6%) | 0 (0.0%) |
| $500 to $799 | 49 (4.4%) | 0 (0.0%) |
| $800 to $999 | 23 (2.1%) | 0 (0.0%) |
| $1,000 to $1,499 | 161 (14.5%) | 5 (23.8%) |
| $1,500 to $1,999 | 106 (9.5%) | 0 (0.0%) |
| $2,000 to $2,499 | 112 (10.1%) | 0 (0.0%) |
| $2,500 to $2,999 | 75 (6.7%) | 6 (28.6%) |
| $3,000 or more | 575 (51.7%) | 5 (23.8%) |
| Total | 1,112 (100.0%) | 21 (100.0%) |
Physical Housing Characteristics in Kiawah Island
Housing Structures in Kiawah Island
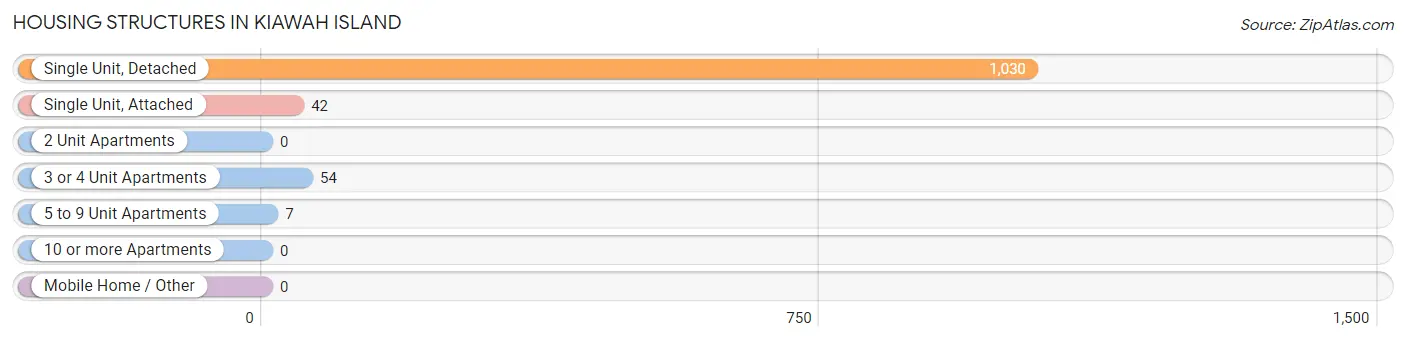
| Structure Type | # Housing Units | % Housing Units |
| Single Unit, Detached | 1,030 | 90.9% |
| Single Unit, Attached | 42 | 3.7% |
| 2 Unit Apartments | 0 | 0.0% |
| 3 or 4 Unit Apartments | 54 | 4.8% |
| 5 to 9 Unit Apartments | 7 | 0.6% |
| 10 or more Apartments | 0 | 0.0% |
| Mobile Home / Other | 0 | 0.0% |
| Total | 1,133 | 100.0% |
Housing Structures by Occupancy in Kiawah Island
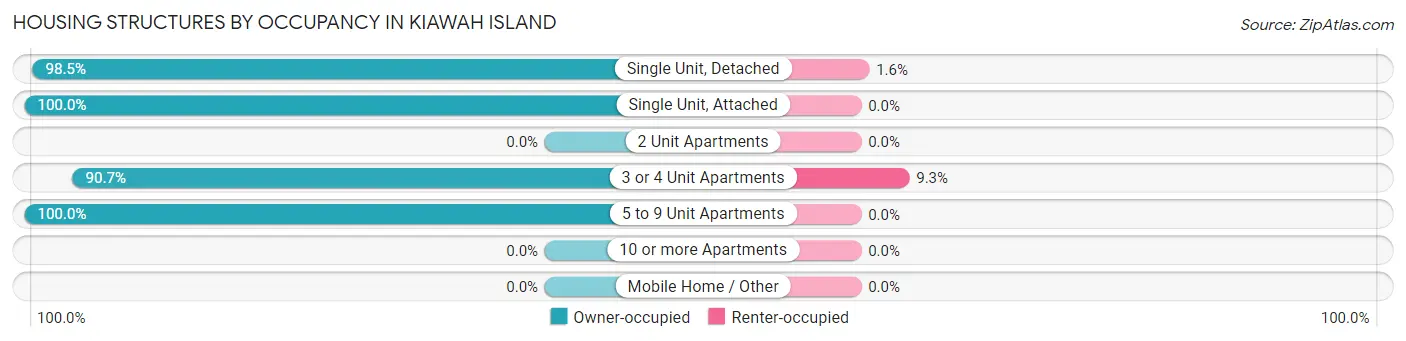
| Structure Type | Owner-occupied | Renter-occupied |
| Single Unit, Detached | 1,014 (98.5%) | 16 (1.5%) |
| Single Unit, Attached | 42 (100.0%) | 0 (0.0%) |
| 2 Unit Apartments | 0 (0.0%) | 0 (0.0%) |
| 3 or 4 Unit Apartments | 49 (90.7%) | 5 (9.3%) |
| 5 to 9 Unit Apartments | 7 (100.0%) | 0 (0.0%) |
| 10 or more Apartments | 0 (0.0%) | 0 (0.0%) |
| Mobile Home / Other | 0 (0.0%) | 0 (0.0%) |
| Total | 1,112 (98.2%) | 21 (1.8%) |
Housing Structures by Number of Rooms in Kiawah Island
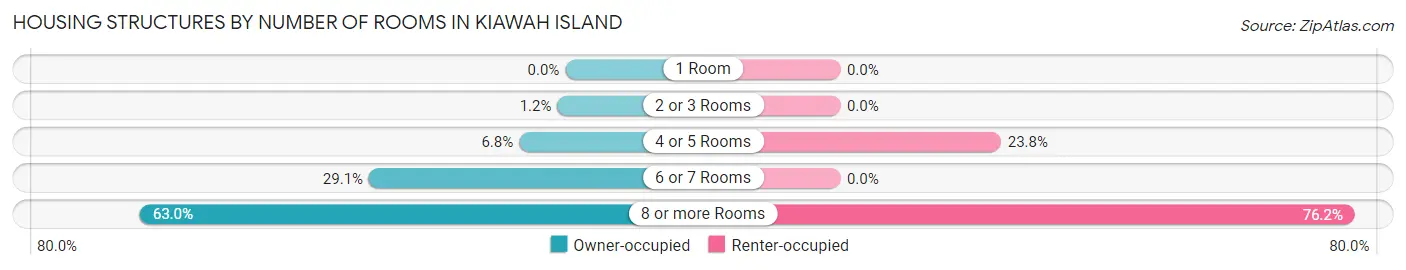
| Number of Rooms | Owner-occupied | Renter-occupied |
| 1 Room | 0 (0.0%) | 0 (0.0%) |
| 2 or 3 Rooms | 13 (1.2%) | 0 (0.0%) |
| 4 or 5 Rooms | 76 (6.8%) | 5 (23.8%) |
| 6 or 7 Rooms | 323 (29.0%) | 0 (0.0%) |
| 8 or more Rooms | 700 (62.9%) | 16 (76.2%) |
| Total | 1,112 (100.0%) | 21 (100.0%) |
Housing Structure by Heating Type in Kiawah Island
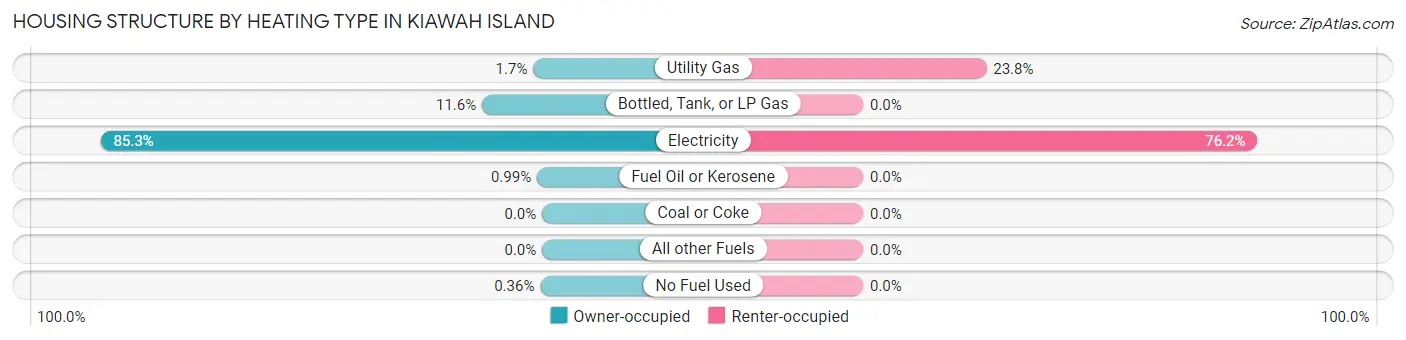
| Heating Type | Owner-occupied | Renter-occupied |
| Utility Gas | 19 (1.7%) | 5 (23.8%) |
| Bottled, Tank, or LP Gas | 129 (11.6%) | 0 (0.0%) |
| Electricity | 949 (85.3%) | 16 (76.2%) |
| Fuel Oil or Kerosene | 11 (1.0%) | 0 (0.0%) |
| Coal or Coke | 0 (0.0%) | 0 (0.0%) |
| All other Fuels | 0 (0.0%) | 0 (0.0%) |
| No Fuel Used | 4 (0.4%) | 0 (0.0%) |
| Total | 1,112 (100.0%) | 21 (100.0%) |
Household Vehicle Usage in Kiawah Island
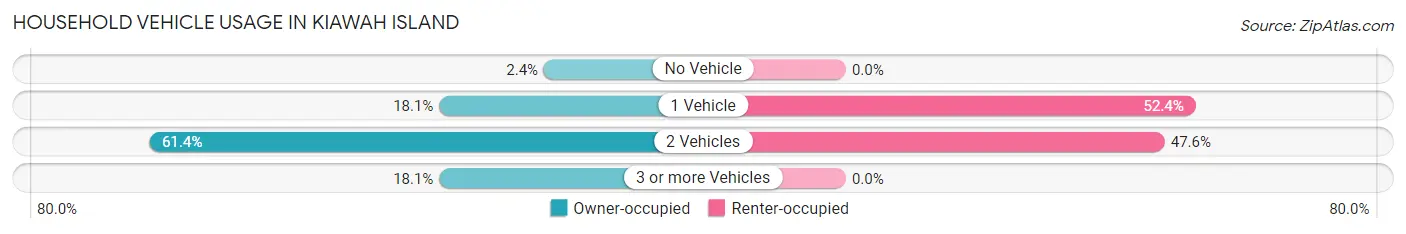
| Vehicles per Household | Owner-occupied | Renter-occupied |
| No Vehicle | 27 (2.4%) | 0 (0.0%) |
| 1 Vehicle | 201 (18.1%) | 11 (52.4%) |
| 2 Vehicles | 683 (61.4%) | 10 (47.6%) |
| 3 or more Vehicles | 201 (18.1%) | 0 (0.0%) |
| Total | 1,112 (100.0%) | 21 (100.0%) |
Real Estate & Mortgages in Kiawah Island
Real Estate and Mortgage Overview in Kiawah Island
| Characteristic | Without Mortgage | With Mortgage |
| Housing Units | 585 | 527 |
| Median Property Value | $1,471,900 | $1,387,000 |
| Median Household Income | $184,792 | $346 |
| Monthly Housing Costs | $1,501 | $457 |
| Real Estate Taxes | $7,689 | $11 |
Property Value by Mortgage Status in Kiawah Island
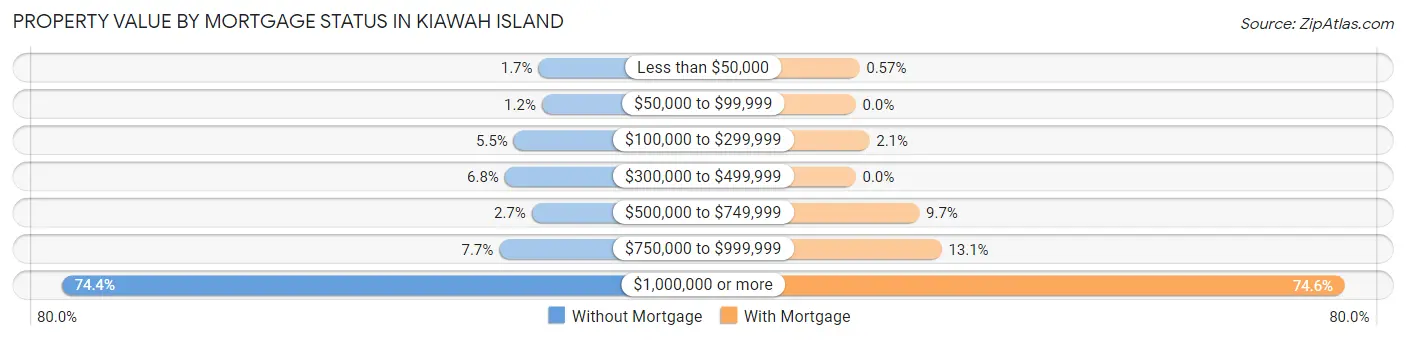
| Property Value | Without Mortgage | With Mortgage |
| Less than $50,000 | 10 (1.7%) | 3 (0.6%) |
| $50,000 to $99,999 | 7 (1.2%) | 0 (0.0%) |
| $100,000 to $299,999 | 32 (5.5%) | 11 (2.1%) |
| $300,000 to $499,999 | 40 (6.8%) | 0 (0.0%) |
| $500,000 to $749,999 | 16 (2.7%) | 51 (9.7%) |
| $750,000 to $999,999 | 45 (7.7%) | 69 (13.1%) |
| $1,000,000 or more | 435 (74.4%) | 393 (74.6%) |
| Total | 585 (100.0%) | 527 (100.0%) |
Household Income by Mortgage Status in Kiawah Island
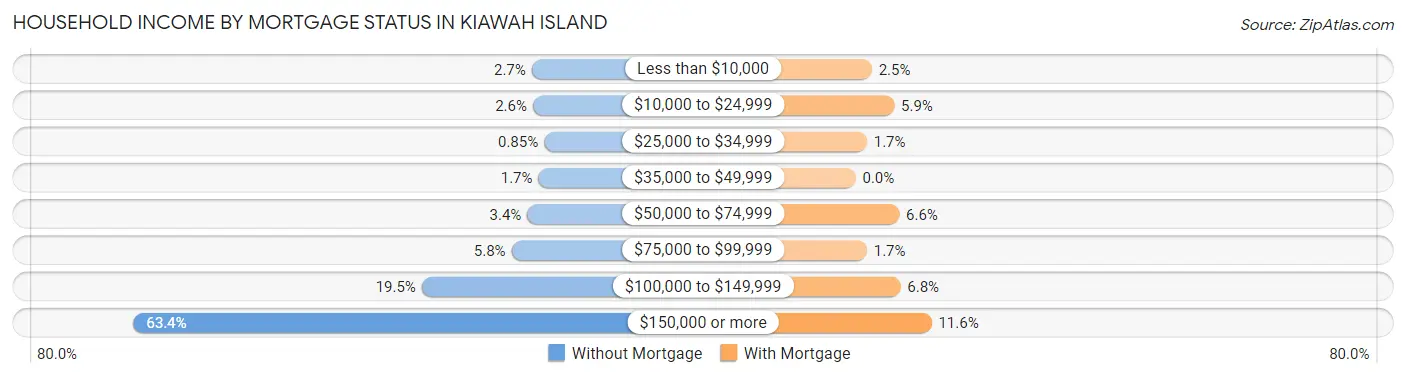
| Household Income | Without Mortgage | With Mortgage |
| Less than $10,000 | 16 (2.7%) | 13 (2.5%) |
| $10,000 to $24,999 | 15 (2.6%) | 31 (5.9%) |
| $25,000 to $34,999 | 5 (0.9%) | 9 (1.7%) |
| $35,000 to $49,999 | 10 (1.7%) | 0 (0.0%) |
| $50,000 to $74,999 | 20 (3.4%) | 35 (6.6%) |
| $75,000 to $99,999 | 34 (5.8%) | 9 (1.7%) |
| $100,000 to $149,999 | 114 (19.5%) | 36 (6.8%) |
| $150,000 or more | 371 (63.4%) | 61 (11.6%) |
| Total | 585 (100.0%) | 527 (100.0%) |
Property Value to Household Income Ratio in Kiawah Island
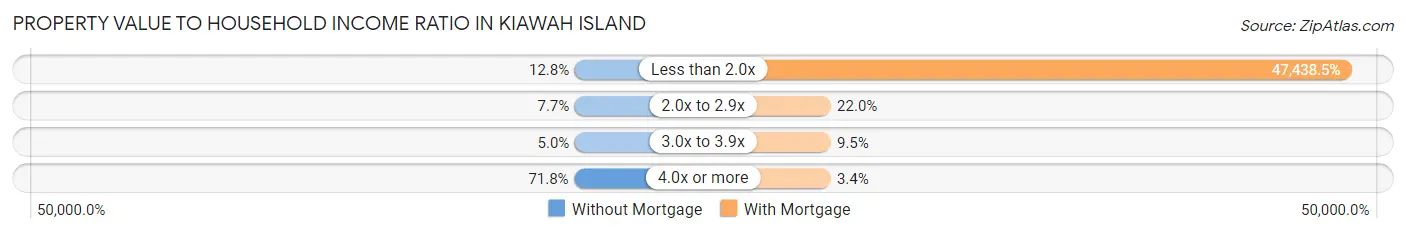
| Value-to-Income Ratio | Without Mortgage | With Mortgage |
| Less than 2.0x | 75 (12.8%) | 250,001 (47,438.5%) |
| 2.0x to 2.9x | 45 (7.7%) | 116 (22.0%) |
| 3.0x to 3.9x | 29 (5.0%) | 50 (9.5%) |
| 4.0x or more | 420 (71.8%) | 18 (3.4%) |
| Total | 585 (100.0%) | 527 (100.0%) |
Real Estate Taxes by Mortgage Status in Kiawah Island
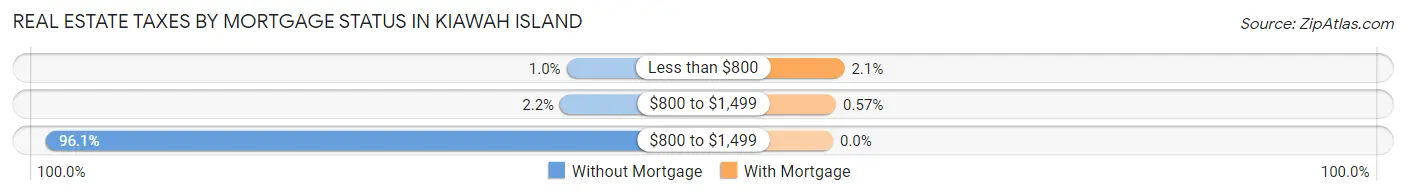
| Property Taxes | Without Mortgage | With Mortgage |
| Less than $800 | 6 (1.0%) | 11 (2.1%) |
| $800 to $1,499 | 13 (2.2%) | 3 (0.6%) |
| $800 to $1,499 | 562 (96.1%) | 0 (0.0%) |
| Total | 585 (100.0%) | 527 (100.0%) |
Health & Disability in Kiawah Island
Health Insurance Coverage by Age in Kiawah Island
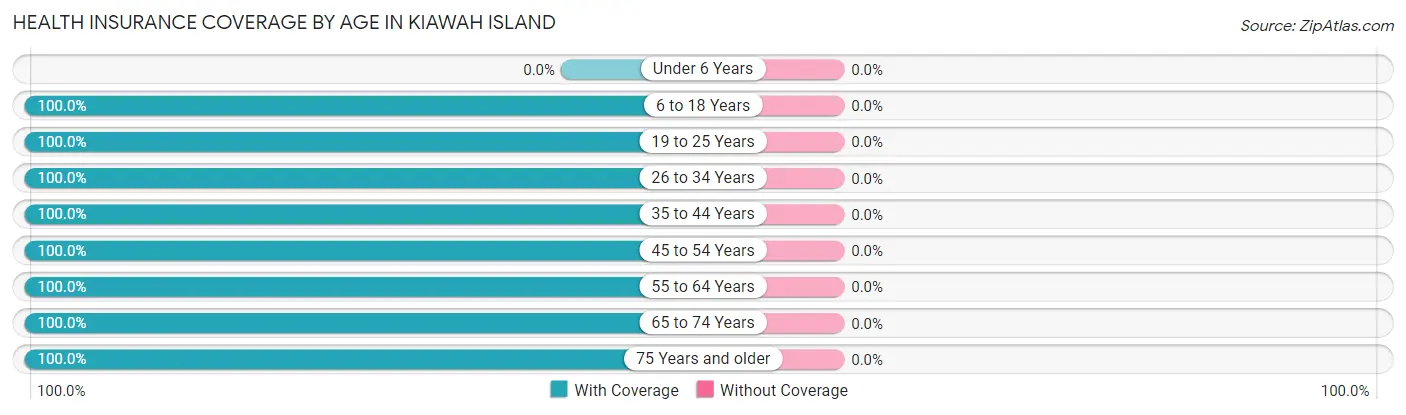
| Age Bracket | With Coverage | Without Coverage |
| Under 6 Years | 0 (0.0%) | 0 (0.0%) |
| 6 to 18 Years | 21 (100.0%) | 0 (0.0%) |
| 19 to 25 Years | 27 (100.0%) | 0 (0.0%) |
| 26 to 34 Years | 14 (100.0%) | 0 (0.0%) |
| 35 to 44 Years | 11 (100.0%) | 0 (0.0%) |
| 45 to 54 Years | 74 (100.0%) | 0 (0.0%) |
| 55 to 64 Years | 719 (100.0%) | 0 (0.0%) |
| 65 to 74 Years | 810 (100.0%) | 0 (0.0%) |
| 75 Years and older | 454 (100.0%) | 0 (0.0%) |
| Total | 2,130 (100.0%) | 0 (0.0%) |
Health Insurance Coverage by Citizenship Status in Kiawah Island
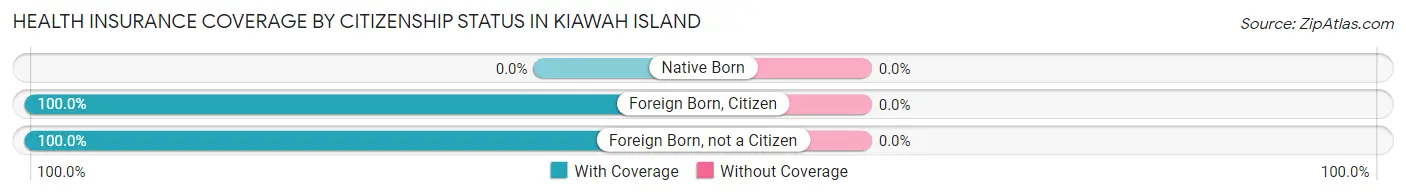
| Citizenship Status | With Coverage | Without Coverage |
| Native Born | 0 (0.0%) | 0 (0.0%) |
| Foreign Born, Citizen | 21 (100.0%) | 0 (0.0%) |
| Foreign Born, not a Citizen | 27 (100.0%) | 0 (0.0%) |
Health Insurance Coverage by Household Income in Kiawah Island
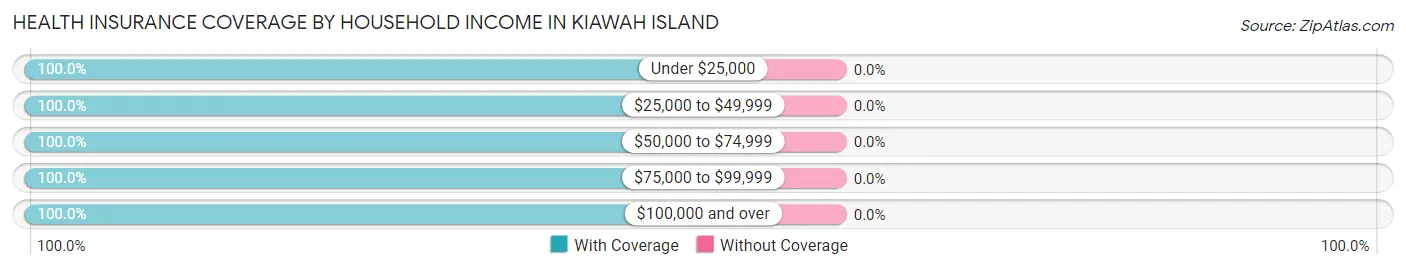
| Household Income | With Coverage | Without Coverage |
| Under $25,000 | 77 (100.0%) | 0 (0.0%) |
| $25,000 to $49,999 | 86 (100.0%) | 0 (0.0%) |
| $50,000 to $74,999 | 40 (100.0%) | 0 (0.0%) |
| $75,000 to $99,999 | 144 (100.0%) | 0 (0.0%) |
| $100,000 and over | 1,783 (100.0%) | 0 (0.0%) |
Public vs Private Health Insurance Coverage by Age in Kiawah Island
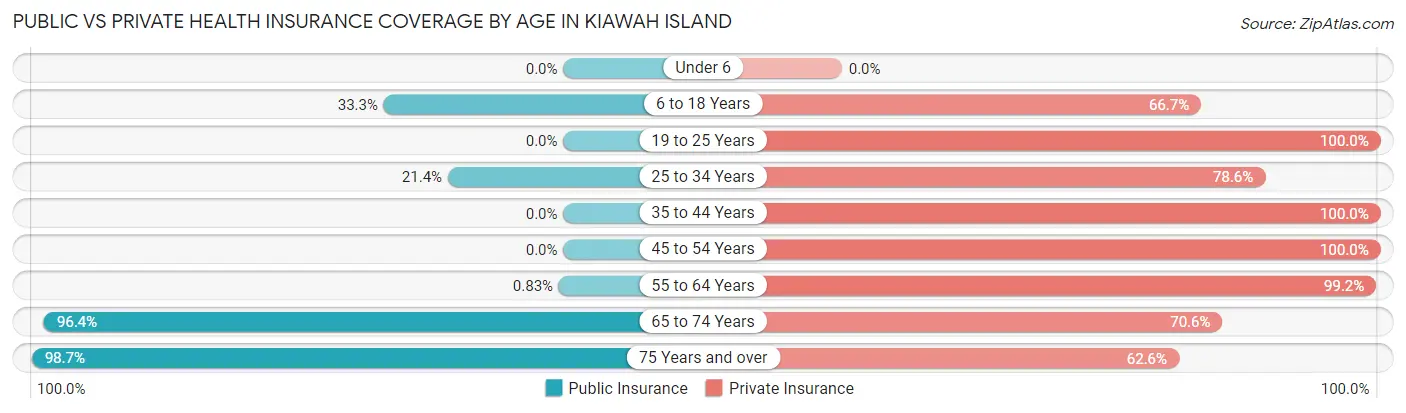
| Age Bracket | Public Insurance | Private Insurance |
| Under 6 | 0 (0.0%) | 0 (0.0%) |
| 6 to 18 Years | 7 (33.3%) | 14 (66.7%) |
| 19 to 25 Years | 0 (0.0%) | 27 (100.0%) |
| 25 to 34 Years | 3 (21.4%) | 11 (78.6%) |
| 35 to 44 Years | 0 (0.0%) | 11 (100.0%) |
| 45 to 54 Years | 0 (0.0%) | 74 (100.0%) |
| 55 to 64 Years | 6 (0.8%) | 713 (99.2%) |
| 65 to 74 Years | 781 (96.4%) | 572 (70.6%) |
| 75 Years and over | 448 (98.7%) | 284 (62.6%) |
| Total | 1,245 (58.5%) | 1,706 (80.1%) |
Disability Status by Sex by Age in Kiawah Island
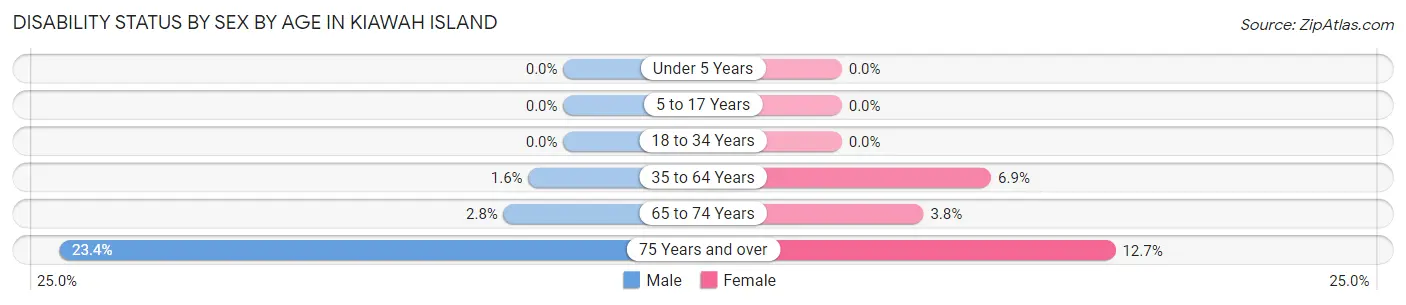
| Age Bracket | Male | Female |
| Under 5 Years | 0 (0.0%) | 0 (0.0%) |
| 5 to 17 Years | 0 (0.0%) | 0 (0.0%) |
| 18 to 34 Years | 0 (0.0%) | 0 (0.0%) |
| 35 to 64 Years | 6 (1.6%) | 30 (6.9%) |
| 65 to 74 Years | 10 (2.8%) | 17 (3.8%) |
| 75 Years and over | 62 (23.4%) | 24 (12.7%) |
Disability Class by Sex by Age in Kiawah Island
Disability Class: Hearing Difficulty
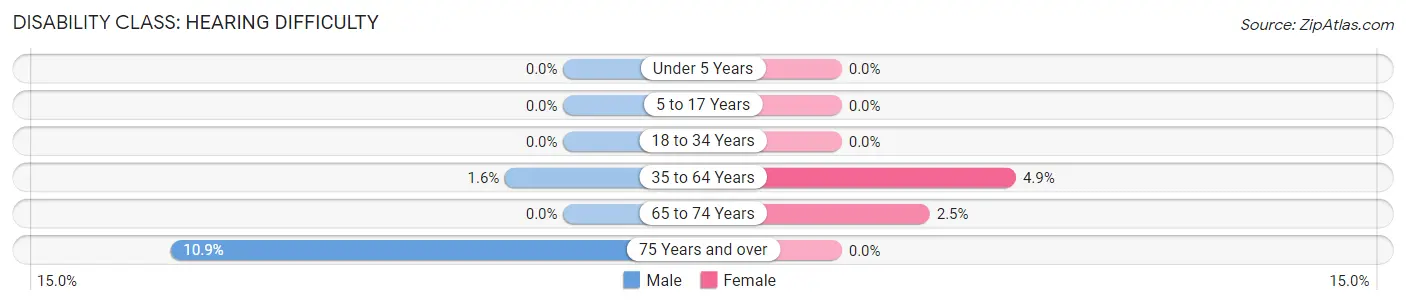
| Age Bracket | Male | Female |
| Under 5 Years | 0 (0.0%) | 0 (0.0%) |
| 5 to 17 Years | 0 (0.0%) | 0 (0.0%) |
| 18 to 34 Years | 0 (0.0%) | 0 (0.0%) |
| 35 to 64 Years | 6 (1.6%) | 21 (4.9%) |
| 65 to 74 Years | 0 (0.0%) | 11 (2.5%) |
| 75 Years and over | 29 (10.9%) | 0 (0.0%) |
Disability Class: Vision Difficulty
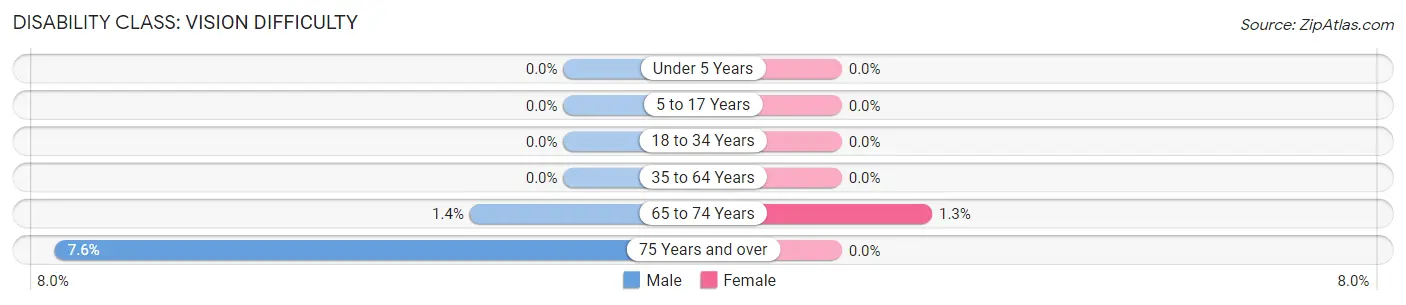
| Age Bracket | Male | Female |
| Under 5 Years | 0 (0.0%) | 0 (0.0%) |
| 5 to 17 Years | 0 (0.0%) | 0 (0.0%) |
| 18 to 34 Years | 0 (0.0%) | 0 (0.0%) |
| 35 to 64 Years | 0 (0.0%) | 0 (0.0%) |
| 65 to 74 Years | 5 (1.4%) | 6 (1.3%) |
| 75 Years and over | 20 (7.5%) | 0 (0.0%) |
Disability Class: Cognitive Difficulty
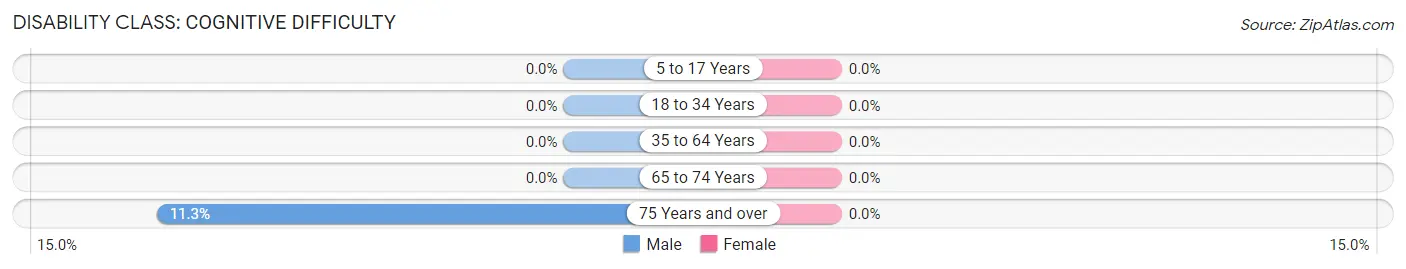
| Age Bracket | Male | Female |
| 5 to 17 Years | 0 (0.0%) | 0 (0.0%) |
| 18 to 34 Years | 0 (0.0%) | 0 (0.0%) |
| 35 to 64 Years | 0 (0.0%) | 0 (0.0%) |
| 65 to 74 Years | 0 (0.0%) | 0 (0.0%) |
| 75 Years and over | 30 (11.3%) | 0 (0.0%) |
Disability Class: Ambulatory Difficulty
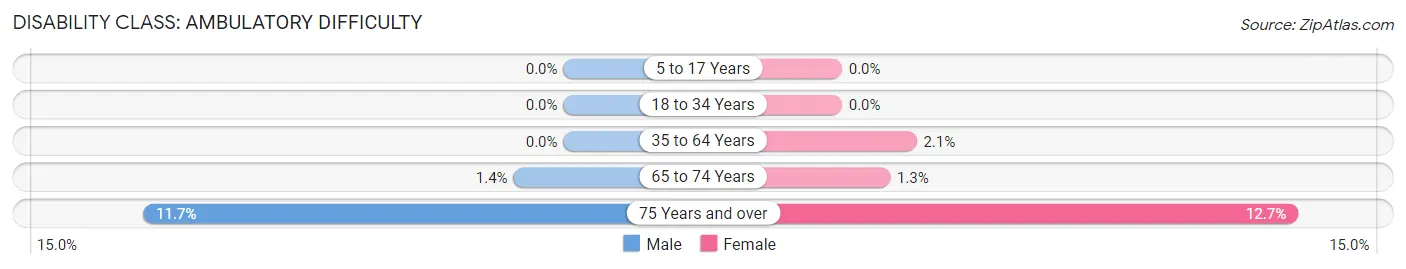
| Age Bracket | Male | Female |
| 5 to 17 Years | 0 (0.0%) | 0 (0.0%) |
| 18 to 34 Years | 0 (0.0%) | 0 (0.0%) |
| 35 to 64 Years | 0 (0.0%) | 9 (2.1%) |
| 65 to 74 Years | 5 (1.4%) | 6 (1.3%) |
| 75 Years and over | 31 (11.7%) | 24 (12.7%) |
Disability Class: Self-Care Difficulty
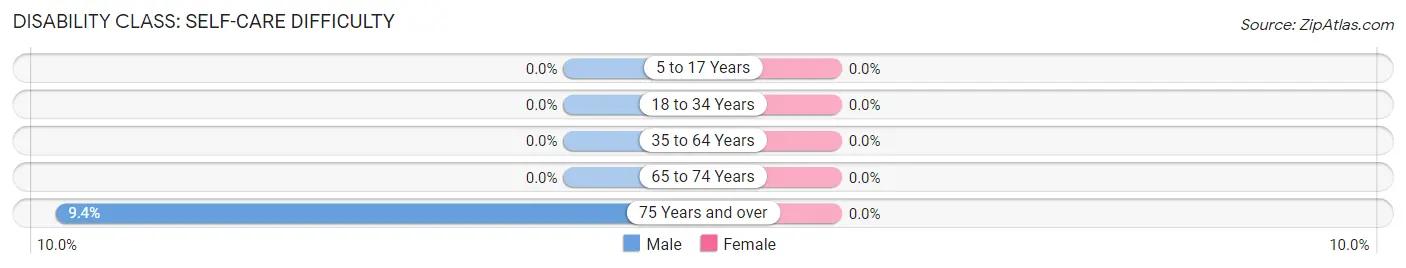
| Age Bracket | Male | Female |
| 5 to 17 Years | 0 (0.0%) | 0 (0.0%) |
| 18 to 34 Years | 0 (0.0%) | 0 (0.0%) |
| 35 to 64 Years | 0 (0.0%) | 0 (0.0%) |
| 65 to 74 Years | 0 (0.0%) | 0 (0.0%) |
| 75 Years and over | 25 (9.4%) | 0 (0.0%) |
Technology Access in Kiawah Island
Computing Device Access in Kiawah Island
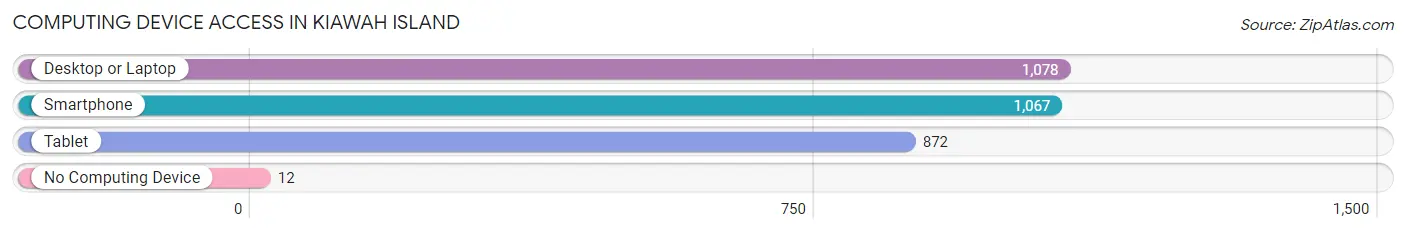
| Device Type | # Households | % Households |
| Desktop or Laptop | 1,078 | 95.2% |
| Smartphone | 1,067 | 94.2% |
| Tablet | 872 | 77.0% |
| No Computing Device | 12 | 1.1% |
| Total | 1,133 | 100.0% |
Internet Access in Kiawah Island
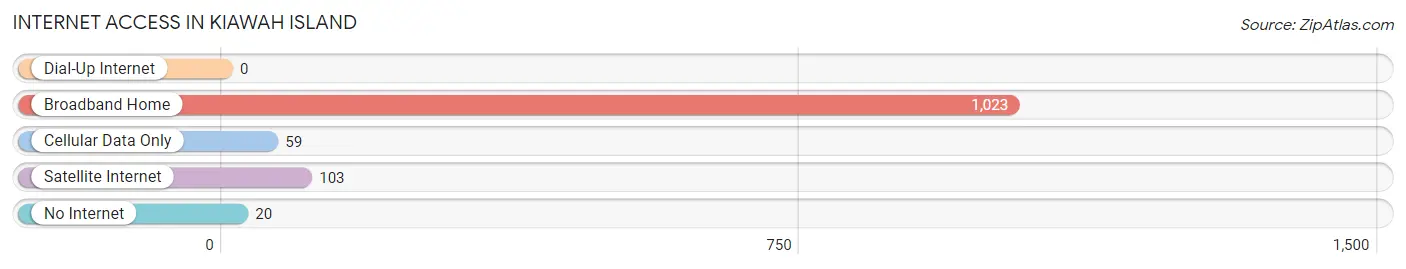
| Internet Type | # Households | % Households |
| Dial-Up Internet | 0 | 0.0% |
| Broadband Home | 1,023 | 90.3% |
| Cellular Data Only | 59 | 5.2% |
| Satellite Internet | 103 | 9.1% |
| No Internet | 20 | 1.8% |
| Total | 1,133 | 100.0% |
Kiawah Island Summary
Kiawah Island is a barrier island located off the coast of South Carolina, approximately 30 miles south of Charleston. It is part of the Sea Islands chain, which stretches along the Atlantic coast from North Carolina to Florida. The island is 10 miles long and 5 miles wide, and is home to a variety of wildlife, including loggerhead turtles, bald eagles, and alligators. Kiawah Island is known for its pristine beaches, lush maritime forests, and world-class golf courses.
History
Kiawah Island has a long and varied history. The island was originally inhabited by the Kiawah Indians, who lived in the area for thousands of years before the arrival of Europeans. The island was first explored by the Spanish in 1521, and was later claimed by the English in 1670. In the late 1700s, the island was used as a plantation, and was home to a variety of crops, including indigo, rice, and cotton.
In the early 1900s, the island was purchased by a group of investors, who developed it into a resort destination. The island was home to a variety of hotels and resorts, and was a popular destination for wealthy vacationers. In the 1950s, the island was sold to a developer, who began to build homes and golf courses.
In the 1970s, the island was purchased by the Kiawah Island Company, which began to develop the island into a residential community. The company built a variety of homes, as well as a variety of amenities, including golf courses, tennis courts, and a marina. In the 1980s, the island was designated as a wildlife refuge, and is now home to a variety of wildlife, including loggerhead turtles, bald eagles, and alligators.
Geography
Kiawah Island is located off the coast of South Carolina, approximately 30 miles south of Charleston. The island is 10 miles long and 5 miles wide, and is part of the Sea Islands chain, which stretches along the Atlantic coast from North Carolina to Florida. The island is bordered by the Kiawah River to the north, the Stono River to the east, and the Atlantic Ocean to the south and west.
The island is home to a variety of ecosystems, including maritime forests, salt marshes, and beaches. The island is also home to a variety of wildlife, including loggerhead turtles, bald eagles, and alligators.
Economy
Kiawah Island is a popular tourist destination, and is home to a variety of resorts, hotels, and restaurants. The island is also home to a variety of retail stores, including art galleries, clothing stores, and souvenir shops. The island is also home to a variety of golf courses, tennis courts, and marinas.
The island is also home to a variety of businesses, including real estate companies, construction companies, and financial services firms. The island is also home to a variety of professional services, including law firms, accounting firms, and consulting firms.
Demographics
As of the 2010 census, the population of Kiawah Island was 2,053. The population is predominantly white (94.3%), with a small percentage of African Americans (3.2%) and Hispanics (1.2%). The median household income is $90,000, and the median home value is $1.2 million. The island is home to a variety of professionals, including doctors, lawyers, and business executives.
Common Questions
What is the Total Population of Kiawah Island?
Total Population of Kiawah Island is 2,130.
What is the Total Male Population of Kiawah Island?
Total Male Population of Kiawah Island is 1,042.
What is the Total Female Population of Kiawah Island?
Total Female Population of Kiawah Island is 1,088.
What is the Ratio of Males per 100 Females in Kiawah Island?
There are 95.77 Males per 100 Females in Kiawah Island.
What is the Ratio of Females per 100 Males in Kiawah Island?
There are 104.41 Females per 100 Males in Kiawah Island.
What is the Median Population Age in Kiawah Island?
Median Population Age in Kiawah Island is 66.8 Years.
What is the Average Family Size in Kiawah Island
Average Family Size in Kiawah Island is 2.1 People.
What is the Average Household Size in Kiawah Island
Average Household Size in Kiawah Island is 1.9 People.
What is Per Capita Income in Kiawah Island?
Per Capita income in Kiawah Island is $197,853.
What is the Median Family Income in Kiawah Island?
Median Family Income in Kiawah Island is $250,001.
What is the Median Household income in Kiawah Island?
Median Household Income in Kiawah Island is $214,250.
What is Income or Wage Gap in Kiawah Island?
Income or Wage Gap in Kiawah Island is 83.1%.
Women in Kiawah Island earn 16.9 cents for every dollar earned by a man.
What is Inequality or Gini Index in Kiawah Island?
Inequality or Gini Index in Kiawah Island is 0.52.
How Large is the Labor Force in Kiawah Island?
There are 688 People in the Labor Forcein in Kiawah Island.
What is the Percentage of People in the Labor Force in Kiawah Island?
32.6% of People are in the Labor Force in Kiawah Island.
What is the Unemployment Rate in Kiawah Island?
Unemployment Rate in Kiawah Island is 3.8%.