McClellanville, SC
McClellanville Map
McClellanville Overview
770
TOTAL POPULATION
399
MALE POPULATION
371
FEMALE POPULATION
107.55
MALES / 100 FEMALES
92.98
FEMALES / 100 MALES
44.4
MEDIAN AGE
3.4
AVG FAMILY SIZE
2.6
AVG HOUSEHOLD SIZE
$50,888
PER CAPITA INCOME
$137,422
AVG FAMILY INCOME
$110,000
AVG HOUSEHOLD INCOME
47.3%
WAGE / INCOME GAP [ % ]
52.7¢/ $1
WAGE / INCOME GAP [ $ ]
0.41
INEQUALITY / GINI INDEX
290
LABOR FORCE [ PEOPLE ]
52.2%
PERCENT IN LABOR FORCE
1.0%
UNEMPLOYMENT RATE
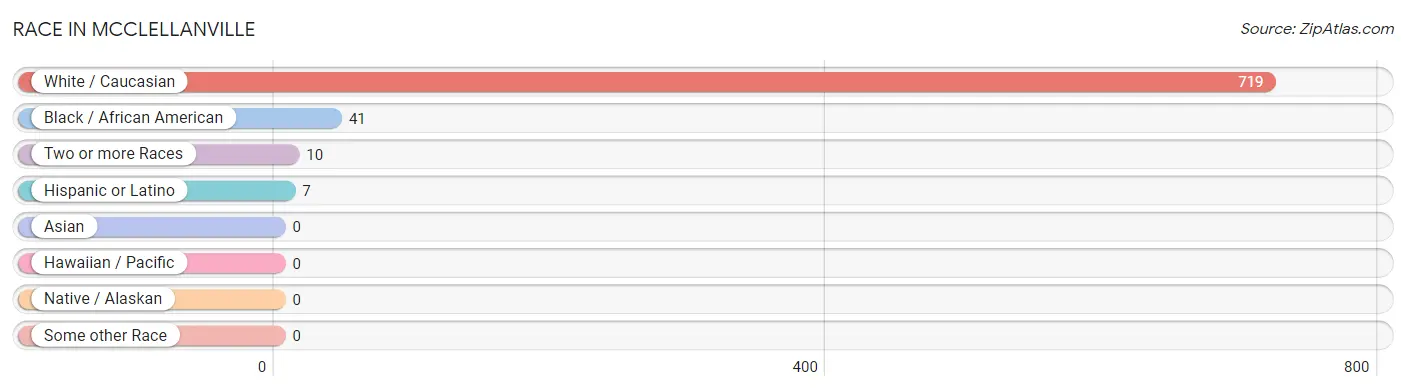
Race in McClellanville
The most populous races in McClellanville are White / Caucasian (719 | 93.4%), Black / African American (41 | 5.3%), and Two or more Races (10 | 1.3%).
| Race | # Population | % Population |
| Asian | 0 | 0.0% |
| Black / African American | 41 | 5.3% |
| Hawaiian / Pacific | 0 | 0.0% |
| Hispanic or Latino | 7 | 0.9% |
| Native / Alaskan | 0 | 0.0% |
| White / Caucasian | 719 | 93.4% |
| Two or more Races | 10 | 1.3% |
| Some other Race | 0 | 0.0% |
| Total | 770 | 100.0% |
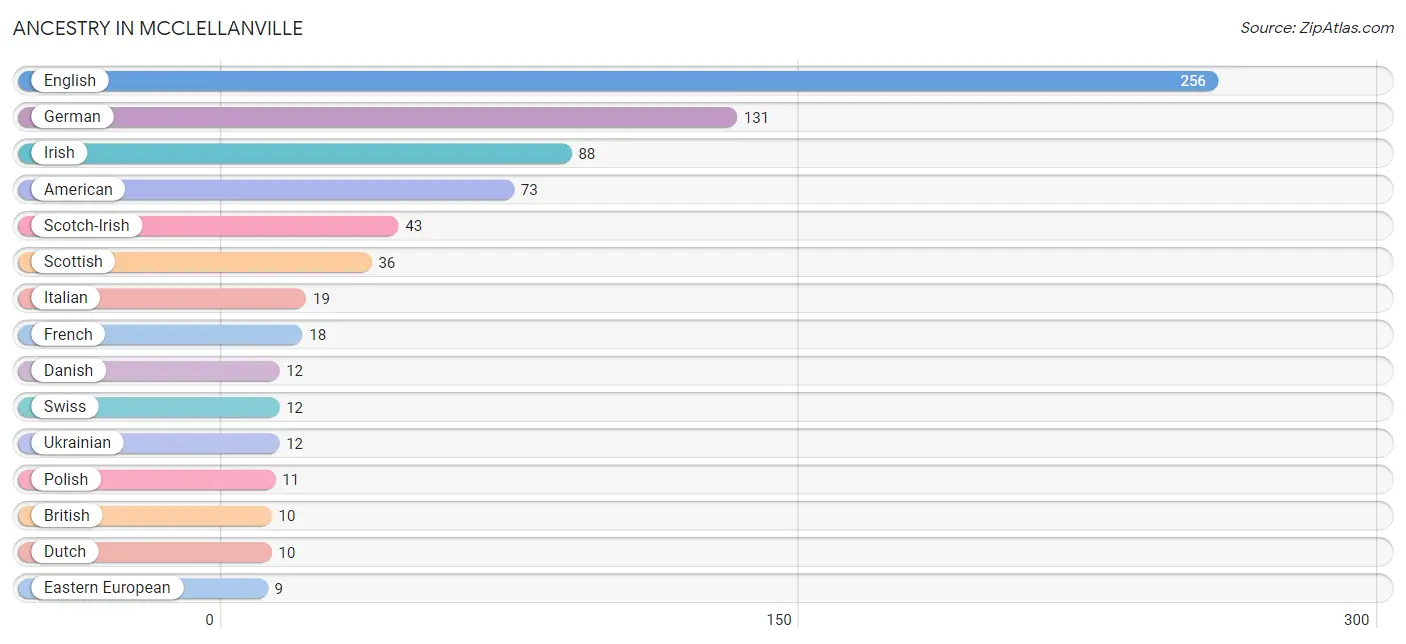
Ancestry in McClellanville
The most populous ancestries reported in McClellanville are English (256 | 33.3%), German (131 | 17.0%), Irish (88 | 11.4%), American (73 | 9.5%), and Scotch-Irish (43 | 5.6%), together accounting for 76.7% of all McClellanville residents.
| Ancestry | # Population | % Population |
| American | 73 | 9.5% |
| Arab | 7 | 0.9% |
| British | 10 | 1.3% |
| Danish | 12 | 1.6% |
| Dutch | 10 | 1.3% |
| Eastern European | 9 | 1.2% |
| English | 256 | 33.3% |
| European | 6 | 0.8% |
| Finnish | 3 | 0.4% |
| French | 18 | 2.3% |
| German | 131 | 17.0% |
| Greek | 2 | 0.3% |
| Irish | 88 | 11.4% |
| Italian | 19 | 2.5% |
| Lebanese | 7 | 0.9% |
| Northern European | 3 | 0.4% |
| Polish | 11 | 1.4% |
| Puerto Rican | 7 | 0.9% |
| Romanian | 2 | 0.3% |
| Scotch-Irish | 43 | 5.6% |
| Scottish | 36 | 4.7% |
| Swedish | 5 | 0.6% |
| Swiss | 12 | 1.6% |
| Ukrainian | 12 | 1.6% |
| Welsh | 7 | 0.9% | View All 25 Rows |
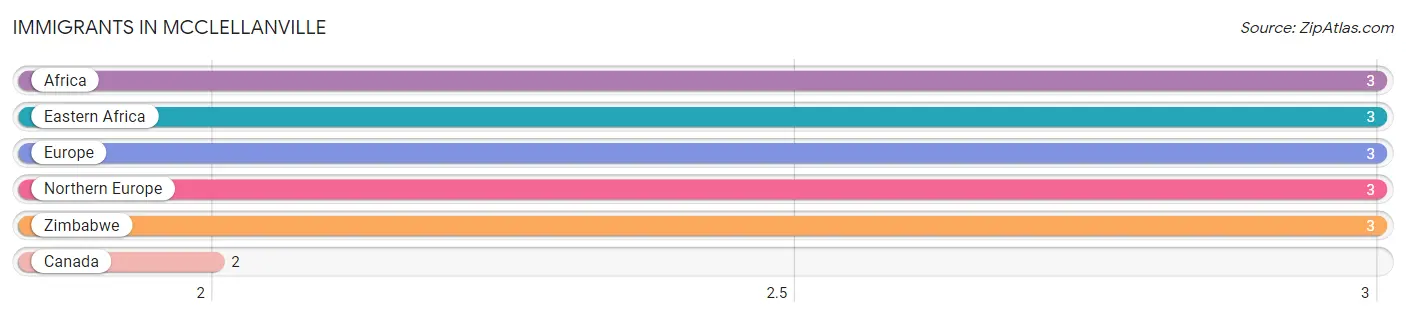
Immigrants in McClellanville
The most numerous immigrant groups reported in McClellanville came from Africa (3 | 0.4%), Eastern Africa (3 | 0.4%), Europe (3 | 0.4%), Northern Europe (3 | 0.4%), and Zimbabwe (3 | 0.4%), together accounting for 1.9% of all McClellanville residents.
| Immigration Origin | # Population | % Population |
| Africa | 3 | 0.4% |
| Canada | 2 | 0.3% |
| Eastern Africa | 3 | 0.4% |
| Europe | 3 | 0.4% |
| Northern Europe | 3 | 0.4% |
| Zimbabwe | 3 | 0.4% | View All 6 Rows |
Sex and Age in McClellanville
Sex and Age in McClellanville
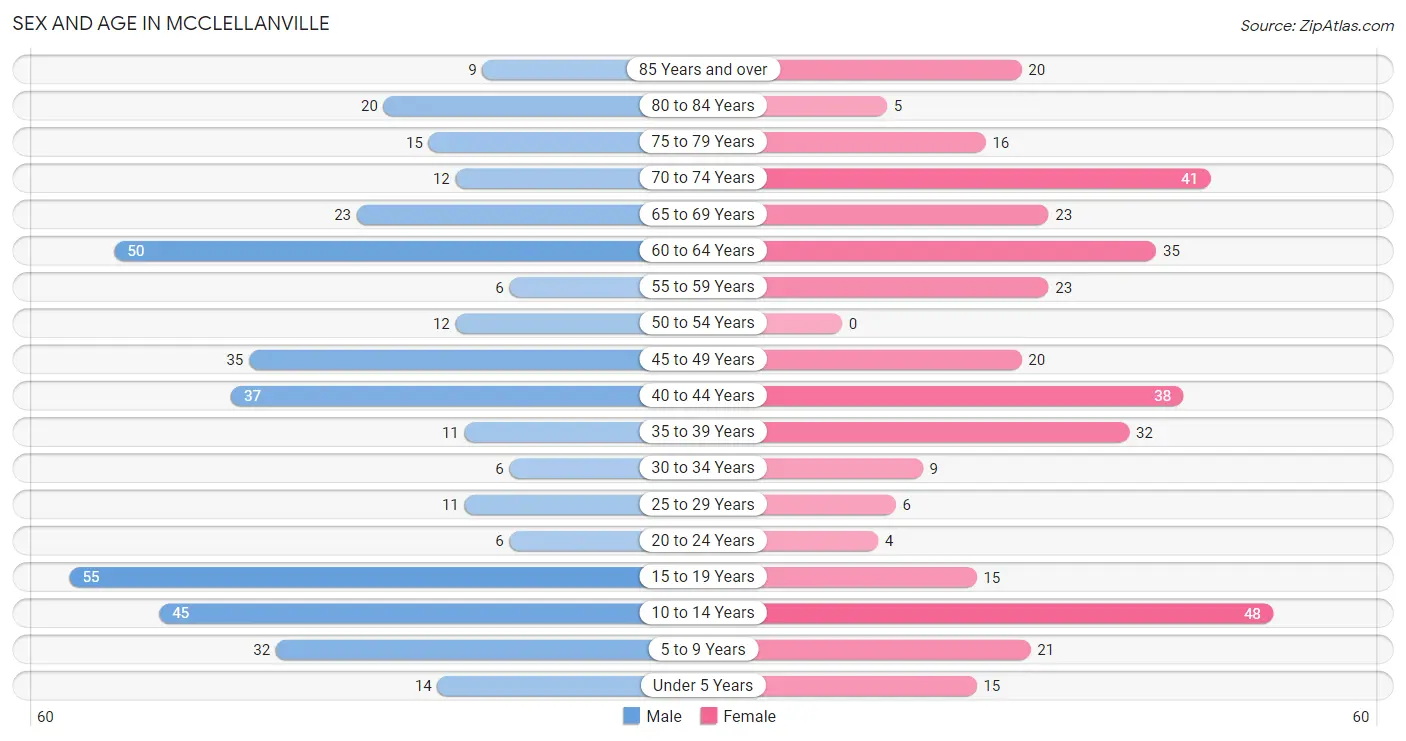
The most populous age groups in McClellanville are 15 to 19 Years (55 | 13.8%) for men and 10 to 14 Years (48 | 12.9%) for women.
| Age Bracket | Male | Female |
| Under 5 Years | 14 (3.5%) | 15 (4.0%) |
| 5 to 9 Years | 32 (8.0%) | 21 (5.7%) |
| 10 to 14 Years | 45 (11.3%) | 48 (12.9%) |
| 15 to 19 Years | 55 (13.8%) | 15 (4.0%) |
| 20 to 24 Years | 6 (1.5%) | 4 (1.1%) |
| 25 to 29 Years | 11 (2.8%) | 6 (1.6%) |
| 30 to 34 Years | 6 (1.5%) | 9 (2.4%) |
| 35 to 39 Years | 11 (2.8%) | 32 (8.6%) |
| 40 to 44 Years | 37 (9.3%) | 38 (10.2%) |
| 45 to 49 Years | 35 (8.8%) | 20 (5.4%) |
| 50 to 54 Years | 12 (3.0%) | 0 (0.0%) |
| 55 to 59 Years | 6 (1.5%) | 23 (6.2%) |
| 60 to 64 Years | 50 (12.5%) | 35 (9.4%) |
| 65 to 69 Years | 23 (5.8%) | 23 (6.2%) |
| 70 to 74 Years | 12 (3.0%) | 41 (11.1%) |
| 75 to 79 Years | 15 (3.8%) | 16 (4.3%) |
| 80 to 84 Years | 20 (5.0%) | 5 (1.3%) |
| 85 Years and over | 9 (2.3%) | 20 (5.4%) |
| Total | 399 (100.0%) | 371 (100.0%) |
Families and Households in McClellanville
Median Family Size in McClellanville
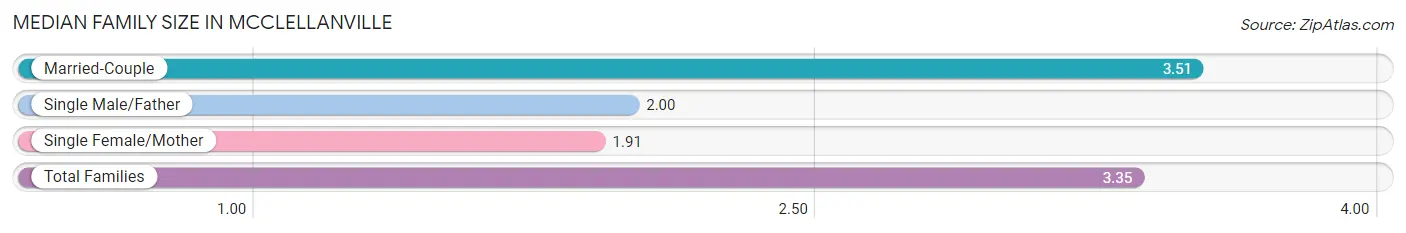
The median family size in McClellanville is 3.35 persons per family, with married-couple families (175 | 89.7%) accounting for the largest median family size of 3.51 persons per family. On the other hand, single female/mother families (11 | 5.6%) represent the smallest median family size with 1.91 persons per family.
| Family Type | # Families | Family Size |
| Married-Couple | 175 (89.7%) | 3.51 |
| Single Male/Father | 9 (4.6%) | 2.00 |
| Single Female/Mother | 11 (5.6%) | 1.91 |
| Total Families | 195 (100.0%) | 3.35 |
Median Household Size in McClellanville
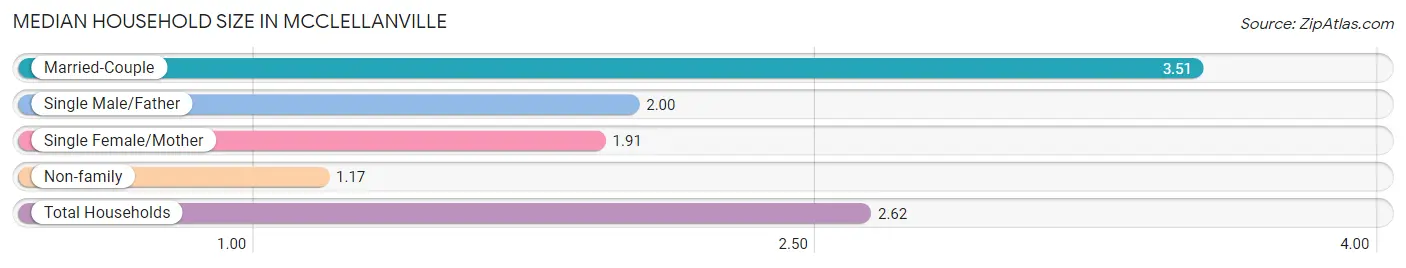
The median household size in McClellanville is 2.62 persons per household, with married-couple households (175 | 59.5%) accounting for the largest median household size of 3.51 persons per household. non-family households (99 | 33.7%) represent the smallest median household size with 1.17 persons per household.
| Household Type | # Households | Household Size |
| Married-Couple | 175 (59.5%) | 3.51 |
| Single Male/Father | 9 (3.1%) | 2.00 |
| Single Female/Mother | 11 (3.7%) | 1.91 |
| Non-family | 99 (33.7%) | 1.17 |
| Total Households | 294 (100.0%) | 2.62 |
Household Size by Marriage Status in McClellanville
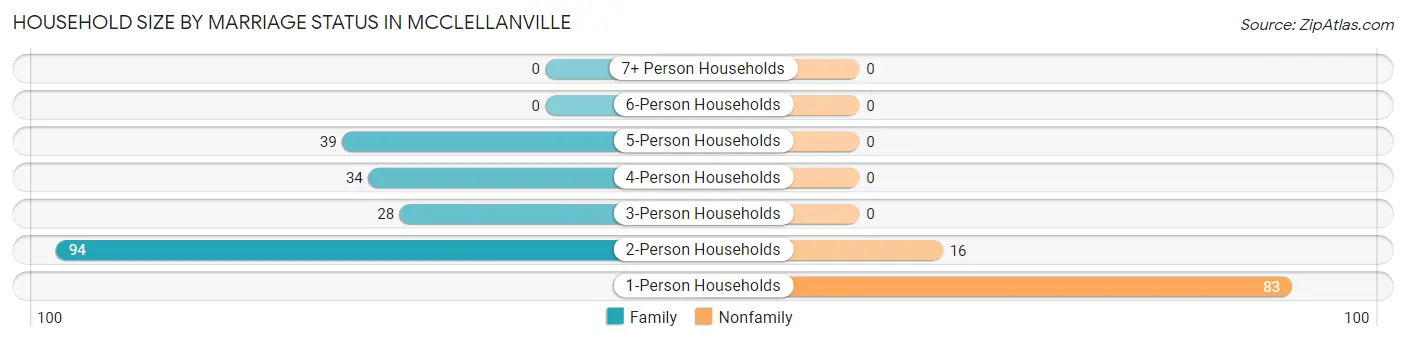
Out of a total of 294 households in McClellanville, 195 (66.3%) are family households, while 99 (33.7%) are nonfamily households. The most numerous type of family households are 2-person households, comprising 94, and the most common type of nonfamily households are 1-person households, comprising 83.
| Household Size | Family Households | Nonfamily Households |
| 1-Person Households | - | 83 (28.2%) |
| 2-Person Households | 94 (32.0%) | 16 (5.4%) |
| 3-Person Households | 28 (9.5%) | 0 (0.0%) |
| 4-Person Households | 34 (11.6%) | 0 (0.0%) |
| 5-Person Households | 39 (13.3%) | 0 (0.0%) |
| 6-Person Households | 0 (0.0%) | 0 (0.0%) |
| 7+ Person Households | 0 (0.0%) | 0 (0.0%) |
| Total | 195 (66.3%) | 99 (33.7%) |
Female Fertility in McClellanville
Fertility by Age in McClellanville
Average fertility rate in McClellanville is 73.0 births per 1,000 women. Women in the age bracket of 20 to 34 years have the highest fertility rate with 316.0 births per 1,000 women. Women in the age bracket of 20 to 34 years acount for 66.7% of all women with births.
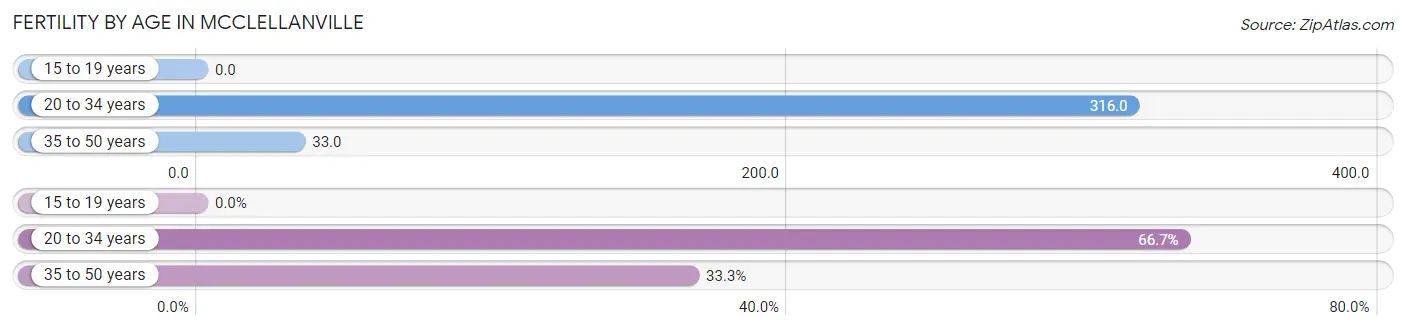
| Age Bracket | Women with Births | Births / 1,000 Women |
| 15 to 19 years | 0 (0.0%) | 0.0 |
| 20 to 34 years | 6 (66.7%) | 316.0 |
| 35 to 50 years | 3 (33.3%) | 33.0 |
| Total | 9 (100.0%) | 73.0 |
Fertility by Age by Marriage Status in McClellanville
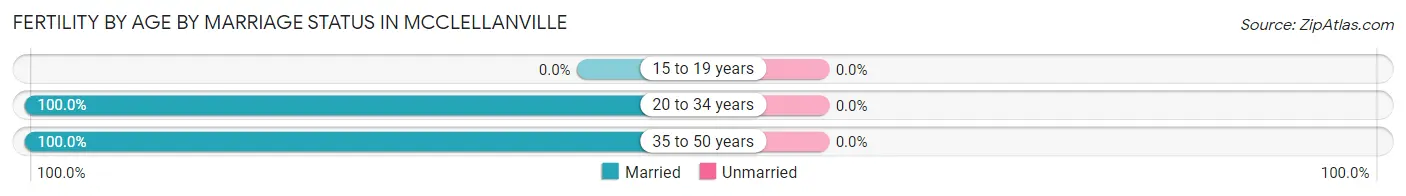
| Age Bracket | Married | Unmarried |
| 15 to 19 years | 0 (0.0%) | 0 (0.0%) |
| 20 to 34 years | 6 (100.0%) | 0 (0.0%) |
| 35 to 50 years | 3 (100.0%) | 0 (0.0%) |
| Total | 9 (100.0%) | 0 (0.0%) |
Fertility by Education in McClellanville
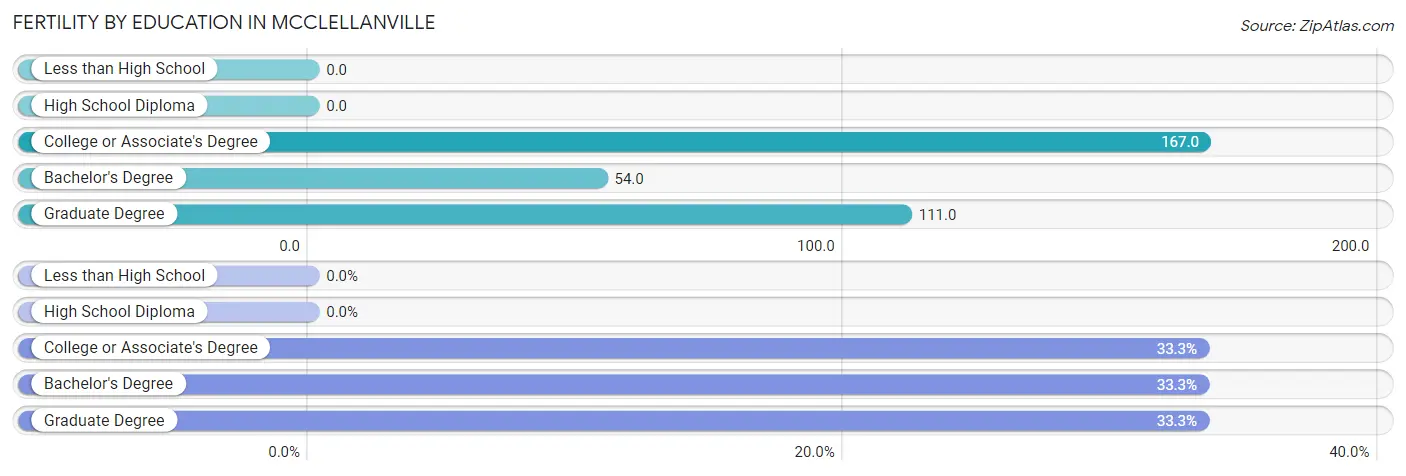
| Educational Attainment | Women with Births | Births / 1,000 Women |
| Less than High School | 0 (0.0%) | 0.0 |
| High School Diploma | 0 (0.0%) | 0.0 |
| College or Associate's Degree | 3 (33.3%) | 167.0 |
| Bachelor's Degree | 3 (33.3%) | 54.0 |
| Graduate Degree | 3 (33.3%) | 111.0 |
| Total | 9 (100.0%) | 73.0 |
Fertility by Education by Marriage Status in McClellanville
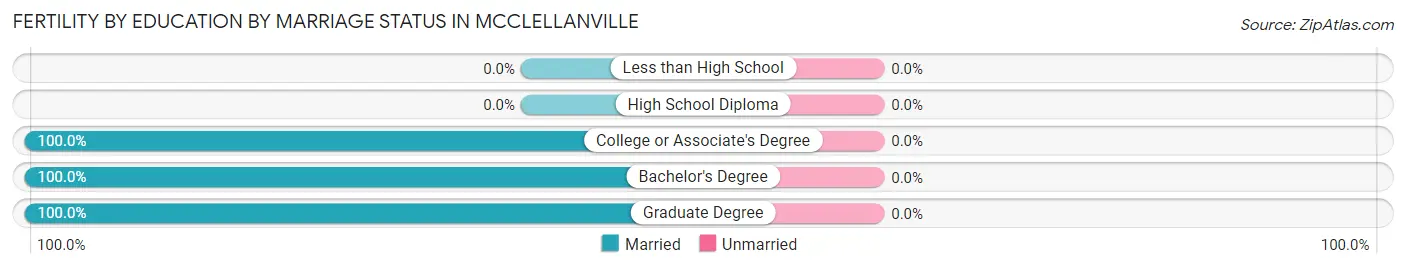
| Educational Attainment | Married | Unmarried |
| Less than High School | 0 (0.0%) | 0 (0.0%) |
| High School Diploma | 0 (0.0%) | 0 (0.0%) |
| College or Associate's Degree | 3 (100.0%) | 0 (0.0%) |
| Bachelor's Degree | 3 (100.0%) | 0 (0.0%) |
| Graduate Degree | 3 (100.0%) | 0 (0.0%) |
| Total | 9 (100.0%) | 0 (0.0%) |
Income in McClellanville
Income Overview in McClellanville
Per Capita Income in McClellanville is $50,888, while median incomes of families and households are $137,422 and $110,000 respectively.
| Characteristic | Number | Measure |
| Per Capita Income | 770 | $50,888 |
| Median Family Income | 195 | $137,422 |
| Mean Family Income | 195 | $166,247 |
| Median Household Income | 294 | $110,000 |
| Mean Household Income | 294 | $129,238 |
| Income Deficit | 195 | $0 |
| Wage / Income Gap (%) | 770 | 47.30% |
| Wage / Income Gap ($) | 770 | 52.70¢ per $1 |
| Gini / Inequality Index | 770 | 0.41 |
Earnings by Sex in McClellanville
Average Earnings in McClellanville are $65,104, $95,000 for men and $50,069 for women, a difference of 47.3%.
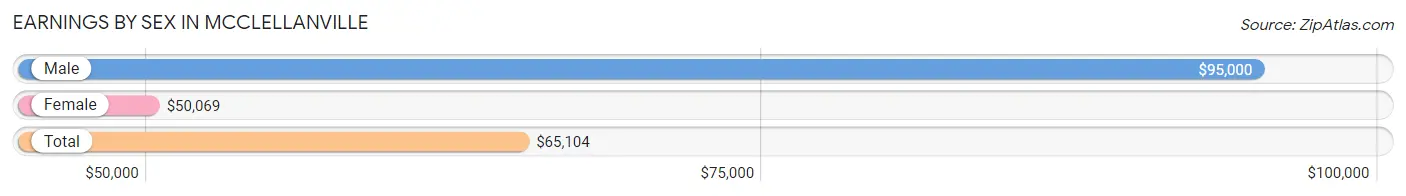
| Sex | Number | Average Earnings |
| Male | 166 (50.8%) | $95,000 |
| Female | 161 (49.2%) | $50,069 |
| Total | 327 (100.0%) | $65,104 |
Earnings by Sex by Income Bracket in McClellanville
The most common earnings brackets in McClellanville are $100,000+ for men (80 | 48.2%) and $50,000 to $54,999 for women (29 | 18.0%).
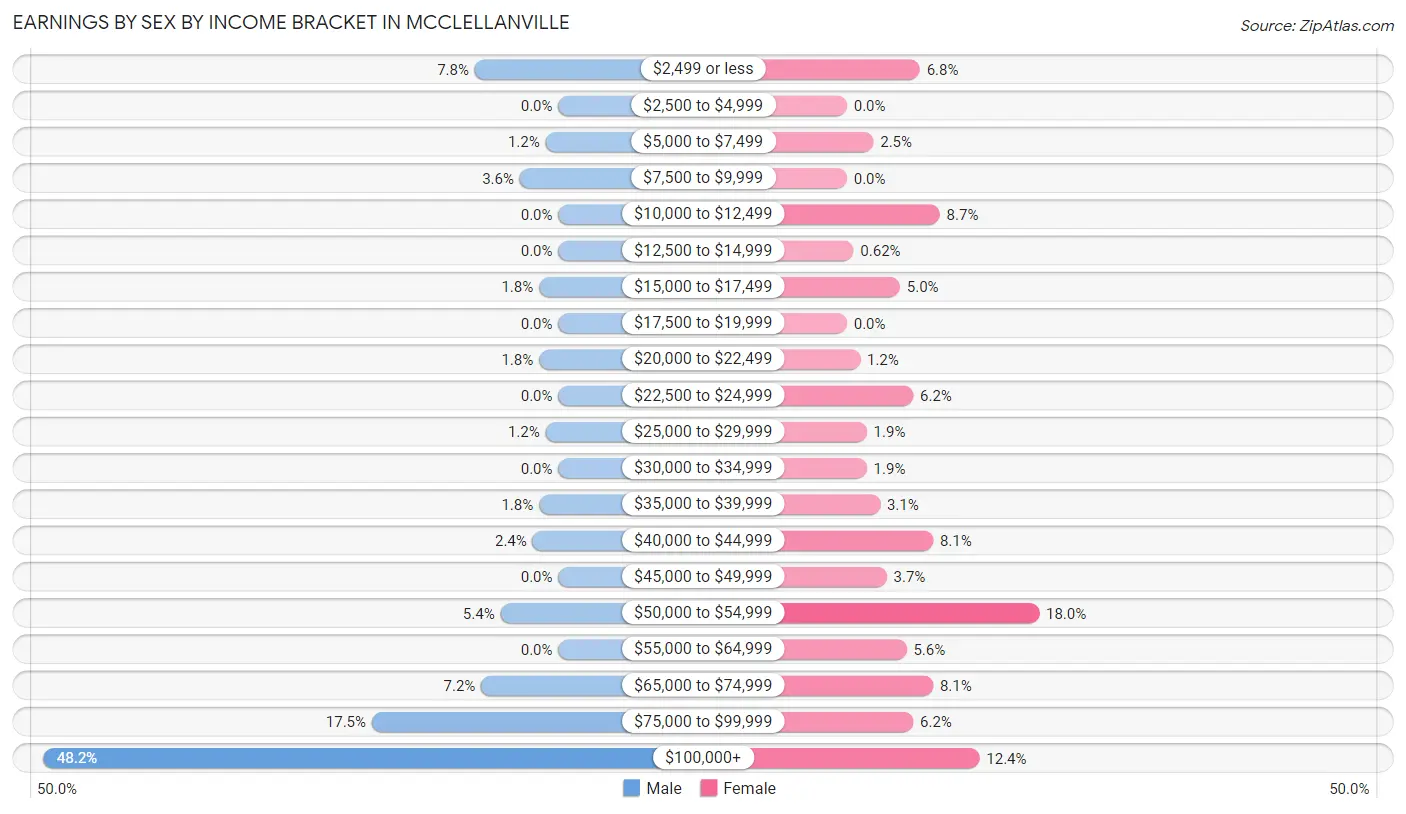
| Income | Male | Female |
| $2,499 or less | 13 (7.8%) | 11 (6.8%) |
| $2,500 to $4,999 | 0 (0.0%) | 0 (0.0%) |
| $5,000 to $7,499 | 2 (1.2%) | 4 (2.5%) |
| $7,500 to $9,999 | 6 (3.6%) | 0 (0.0%) |
| $10,000 to $12,499 | 0 (0.0%) | 14 (8.7%) |
| $12,500 to $14,999 | 0 (0.0%) | 1 (0.6%) |
| $15,000 to $17,499 | 3 (1.8%) | 8 (5.0%) |
| $17,500 to $19,999 | 0 (0.0%) | 0 (0.0%) |
| $20,000 to $22,499 | 3 (1.8%) | 2 (1.2%) |
| $22,500 to $24,999 | 0 (0.0%) | 10 (6.2%) |
| $25,000 to $29,999 | 2 (1.2%) | 3 (1.9%) |
| $30,000 to $34,999 | 0 (0.0%) | 3 (1.9%) |
| $35,000 to $39,999 | 3 (1.8%) | 5 (3.1%) |
| $40,000 to $44,999 | 4 (2.4%) | 13 (8.1%) |
| $45,000 to $49,999 | 0 (0.0%) | 6 (3.7%) |
| $50,000 to $54,999 | 9 (5.4%) | 29 (18.0%) |
| $55,000 to $64,999 | 0 (0.0%) | 9 (5.6%) |
| $65,000 to $74,999 | 12 (7.2%) | 13 (8.1%) |
| $75,000 to $99,999 | 29 (17.5%) | 10 (6.2%) |
| $100,000+ | 80 (48.2%) | 20 (12.4%) |
| Total | 166 (100.0%) | 161 (100.0%) |
Earnings by Sex by Educational Attainment in McClellanville
Average earnings in McClellanville are $105,125 for men and $50,903 for women, a difference of 51.6%. Men with an educational attainment of graduate degree enjoy the highest average annual earnings of $133,750, while those with bachelor's degree education earn the least with $90,313. Women with an educational attainment of graduate degree earn the most with the average annual earnings of $54,773, while those with bachelor's degree education have the smallest earnings of $50,139.
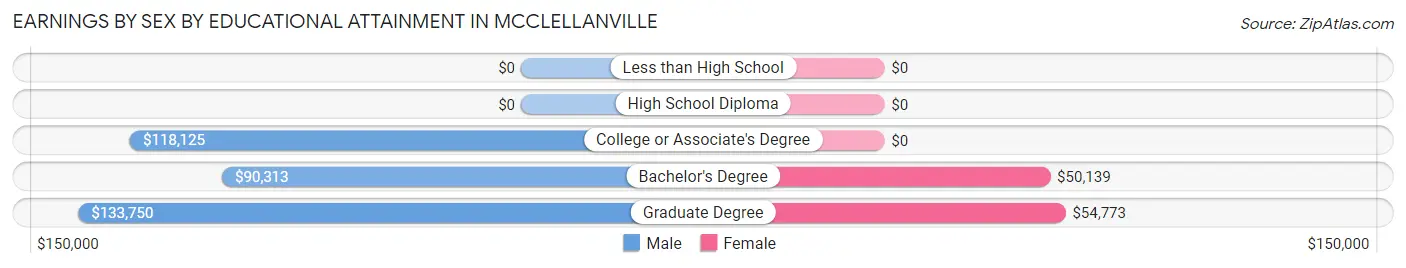
| Educational Attainment | Male Income | Female Income |
| Less than High School | - | - |
| High School Diploma | - | - |
| College or Associate's Degree | $118,125 | $0 |
| Bachelor's Degree | $90,313 | $50,139 |
| Graduate Degree | $133,750 | $54,773 |
| Total | $105,125 | $50,903 |
Family Income in McClellanville
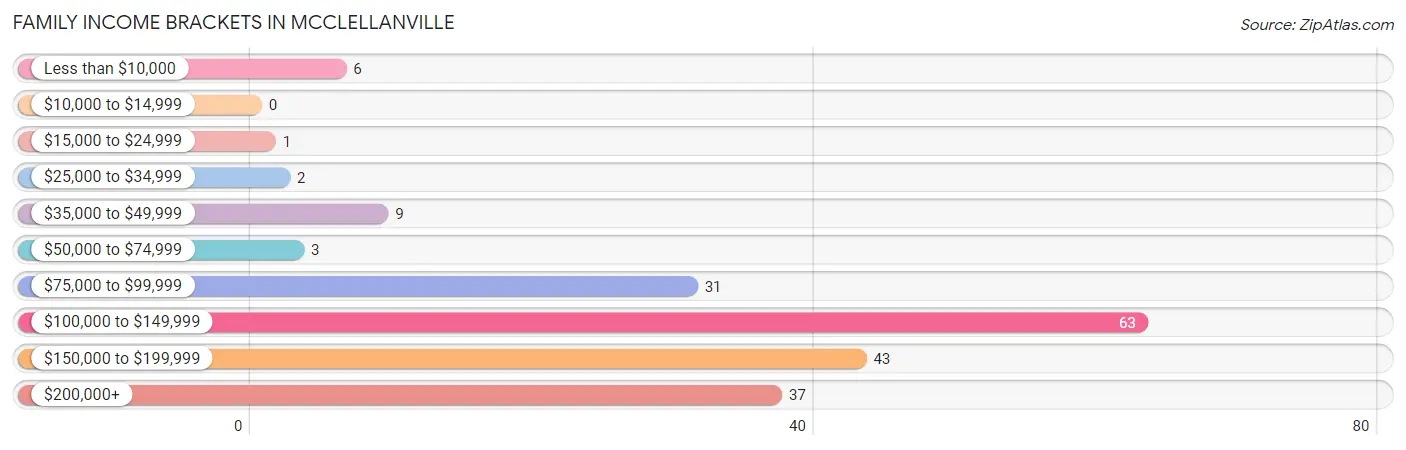
Family Income Brackets in McClellanville
According to the McClellanville family income data, there are 63 families falling into the $100,000 to $149,999 income range, which is the most common income bracket and makes up 32.3% of all families.
| Income Bracket | # Families | % Families |
| Less than $10,000 | 6 | 3.1% |
| $10,000 to $14,999 | 0 | 0.0% |
| $15,000 to $24,999 | 1 | 0.5% |
| $25,000 to $34,999 | 2 | 1.0% |
| $35,000 to $49,999 | 9 | 4.6% |
| $50,000 to $74,999 | 3 | 1.5% |
| $75,000 to $99,999 | 31 | 15.9% |
| $100,000 to $149,999 | 63 | 32.3% |
| $150,000 to $199,999 | 43 | 22.1% |
| $200,000+ | 37 | 19.0% |
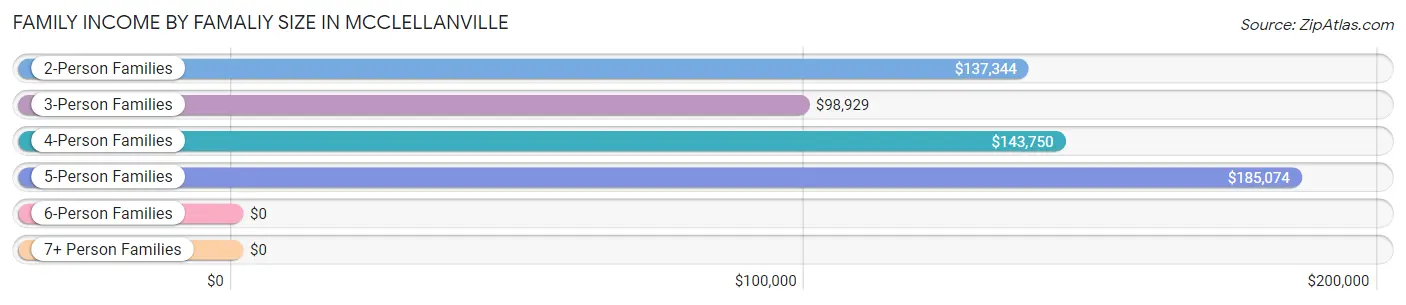
Family Income by Famaliy Size in McClellanville
5-person families (39 | 20.0%) account for the highest median family income in McClellanville with $185,074 per family, while 2-person families (94 | 48.2%) have the highest median income of $68,672 per family member.
| Income Bracket | # Families | Median Income |
| 2-Person Families | 94 (48.2%) | $137,344 |
| 3-Person Families | 28 (14.4%) | $98,929 |
| 4-Person Families | 34 (17.4%) | $143,750 |
| 5-Person Families | 39 (20.0%) | $185,074 |
| 6-Person Families | 0 (0.0%) | $0 |
| 7+ Person Families | 0 (0.0%) | $0 |
| Total | 195 (100.0%) | $137,422 |
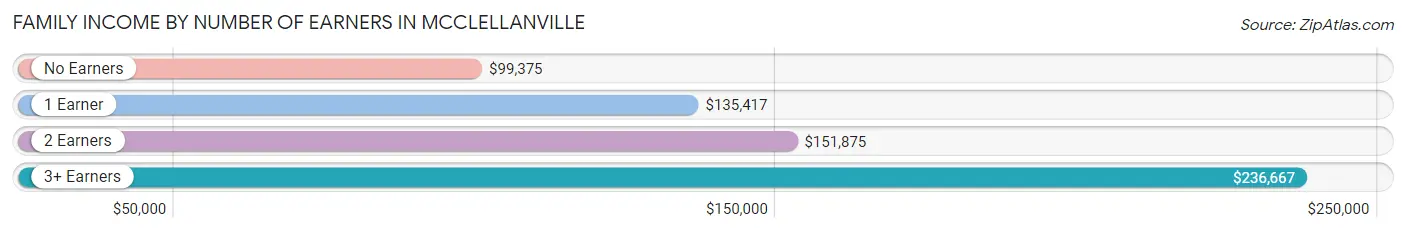
Family Income by Number of Earners in McClellanville
The median family income in McClellanville is $137,422, with families comprising 3+ earners (12) having the highest median family income of $236,667, while families with no earners (43) have the lowest median family income of $99,375, accounting for 6.1% and 22.1% of families, respectively.
| Number of Earners | # Families | Median Income |
| No Earners | 43 (22.1%) | $99,375 |
| 1 Earner | 47 (24.1%) | $135,417 |
| 2 Earners | 93 (47.7%) | $151,875 |
| 3+ Earners | 12 (6.1%) | $236,667 |
| Total | 195 (100.0%) | $137,422 |
Household Income in McClellanville
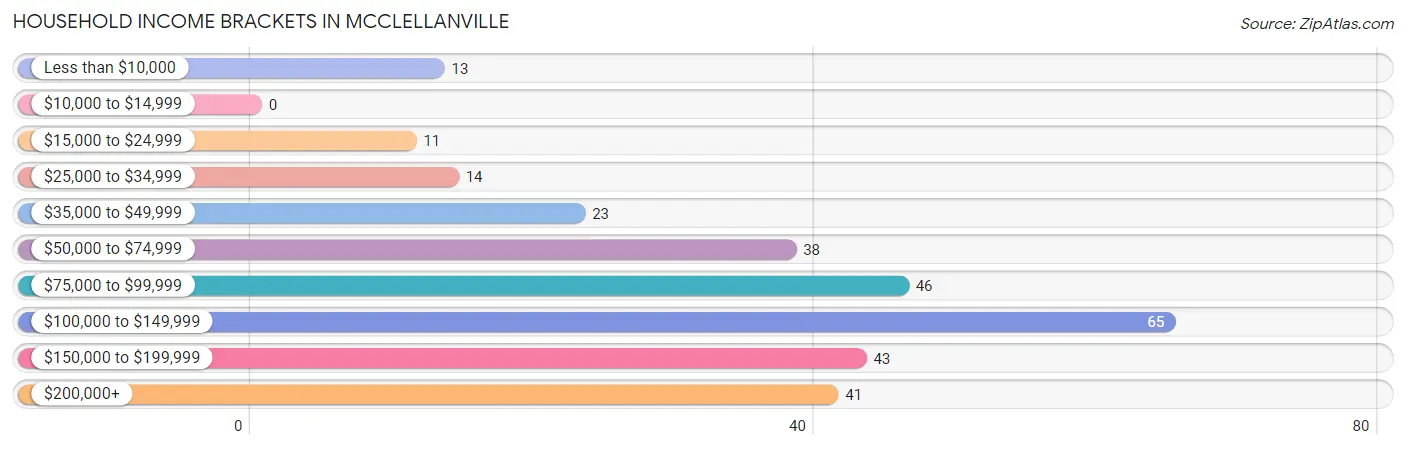
Household Income Brackets in McClellanville
With 65 households falling in the category, the $100,000 to $149,999 income range is the most frequent in McClellanville, accounting for 22.1% of all households.
| Income Bracket | # Households | % Households |
| Less than $10,000 | 13 | 4.4% |
| $10,000 to $14,999 | 0 | 0.0% |
| $15,000 to $24,999 | 11 | 3.7% |
| $25,000 to $34,999 | 14 | 4.8% |
| $35,000 to $49,999 | 23 | 7.8% |
| $50,000 to $74,999 | 38 | 12.9% |
| $75,000 to $99,999 | 46 | 15.6% |
| $100,000 to $149,999 | 65 | 22.1% |
| $150,000 to $199,999 | 43 | 14.6% |
| $200,000+ | 41 | 13.9% |
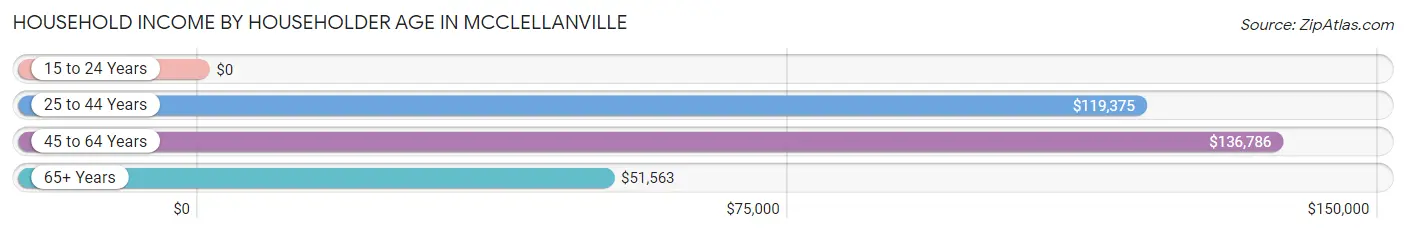
Household Income by Householder Age in McClellanville
The median household income in McClellanville is $110,000, with the highest median household income of $136,786 found in the 45 to 64 years age bracket for the primary householder. A total of 88 households (29.9%) fall into this category. Meanwhile, the 15 to 24 years age bracket for the primary householder has the lowest median household income of $0, with 2 households (0.7%) in this group.
| Income Bracket | # Households | Median Income |
| 15 to 24 Years | 2 (0.7%) | $0 |
| 25 to 44 Years | 84 (28.6%) | $119,375 |
| 45 to 64 Years | 88 (29.9%) | $136,786 |
| 65+ Years | 120 (40.8%) | $51,563 |
| Total | 294 (100.0%) | $110,000 |
Poverty in McClellanville
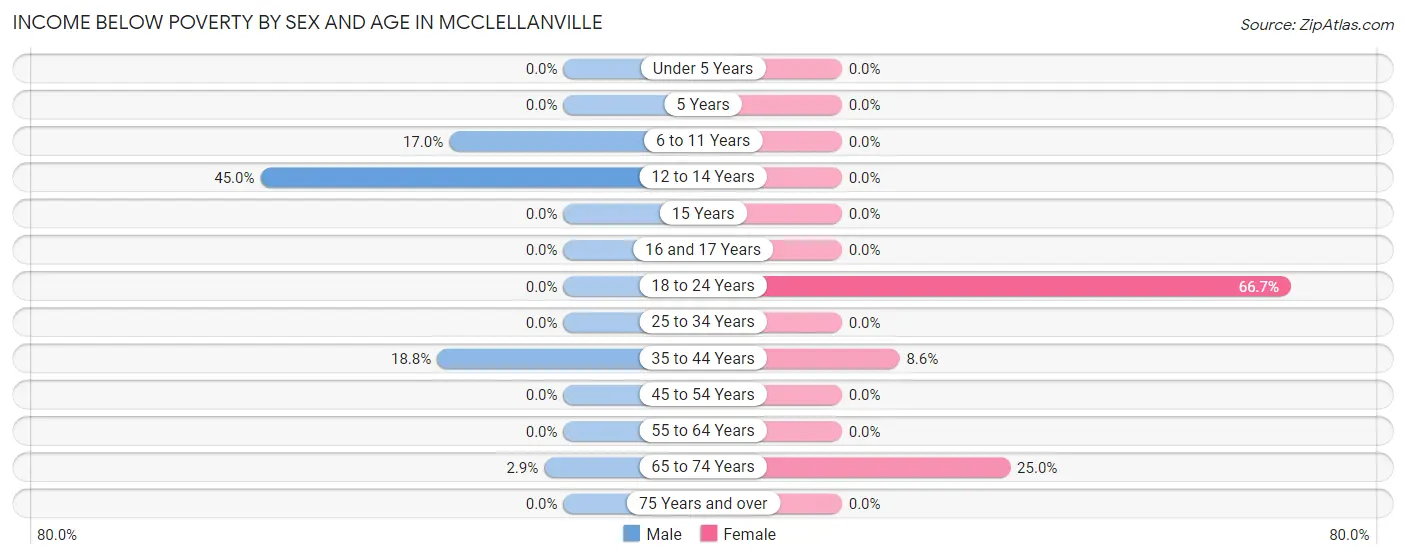
Income Below Poverty by Sex and Age in McClellanville
With 7.0% poverty level for males and 8.1% for females among the residents of McClellanville, 12 to 14 year old males and 18 to 24 year old females are the most vulnerable to poverty, with 9 males (45.0%) and 8 females (66.7%) in their respective age groups living below the poverty level.
| Age Bracket | Male | Female |
| Under 5 Years | 0 (0.0%) | 0 (0.0%) |
| 5 Years | 0 (0.0%) | 0 (0.0%) |
| 6 to 11 Years | 9 (17.0%) | 0 (0.0%) |
| 12 to 14 Years | 9 (45.0%) | 0 (0.0%) |
| 15 Years | 0 (0.0%) | 0 (0.0%) |
| 16 and 17 Years | 0 (0.0%) | 0 (0.0%) |
| 18 to 24 Years | 0 (0.0%) | 8 (66.7%) |
| 25 to 34 Years | 0 (0.0%) | 0 (0.0%) |
| 35 to 44 Years | 9 (18.8%) | 6 (8.6%) |
| 45 to 54 Years | 0 (0.0%) | 0 (0.0%) |
| 55 to 64 Years | 0 (0.0%) | 0 (0.0%) |
| 65 to 74 Years | 1 (2.9%) | 16 (25.0%) |
| 75 Years and over | 0 (0.0%) | 0 (0.0%) |
| Total | 28 (7.0%) | 30 (8.1%) |
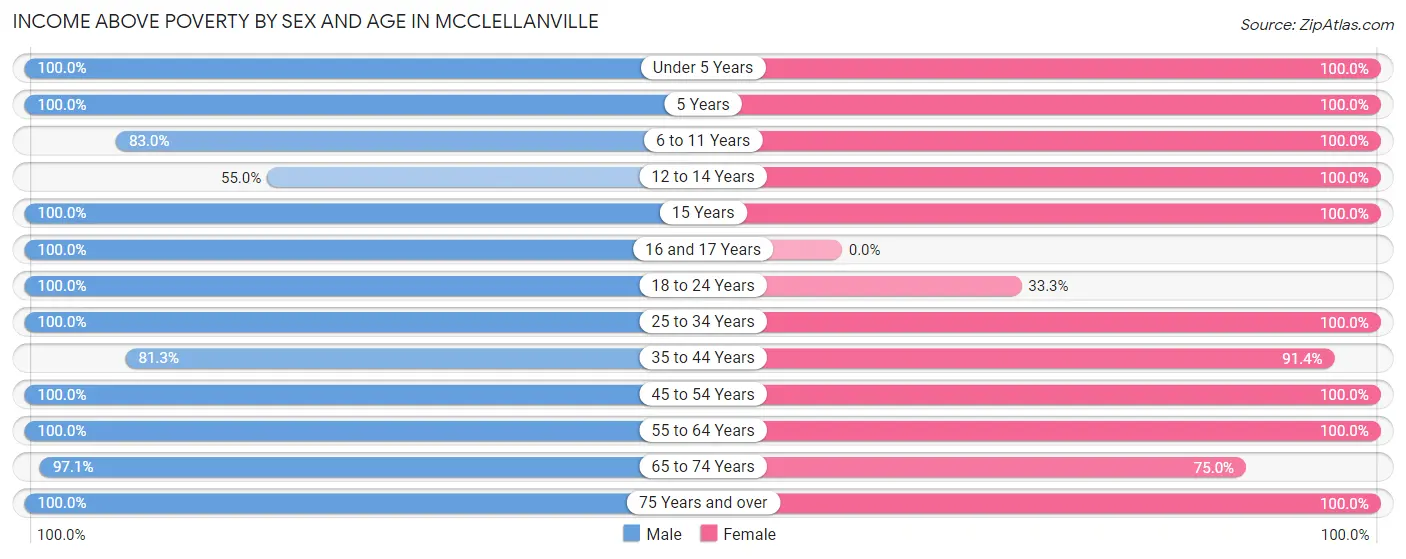
Income Above Poverty by Sex and Age in McClellanville
According to the poverty statistics in McClellanville, males aged under 5 years and females aged under 5 years are the age groups that are most secure financially, with 100.0% of males and 100.0% of females in these age groups living above the poverty line.
| Age Bracket | Male | Female |
| Under 5 Years | 14 (100.0%) | 15 (100.0%) |
| 5 Years | 4 (100.0%) | 6 (100.0%) |
| 6 to 11 Years | 44 (83.0%) | 38 (100.0%) |
| 12 to 14 Years | 11 (55.0%) | 25 (100.0%) |
| 15 Years | 32 (100.0%) | 7 (100.0%) |
| 16 and 17 Years | 20 (100.0%) | 0 (0.0%) |
| 18 to 24 Years | 9 (100.0%) | 4 (33.3%) |
| 25 to 34 Years | 17 (100.0%) | 15 (100.0%) |
| 35 to 44 Years | 39 (81.2%) | 64 (91.4%) |
| 45 to 54 Years | 47 (100.0%) | 20 (100.0%) |
| 55 to 64 Years | 56 (100.0%) | 58 (100.0%) |
| 65 to 74 Years | 34 (97.1%) | 48 (75.0%) |
| 75 Years and over | 44 (100.0%) | 41 (100.0%) |
| Total | 371 (93.0%) | 341 (91.9%) |
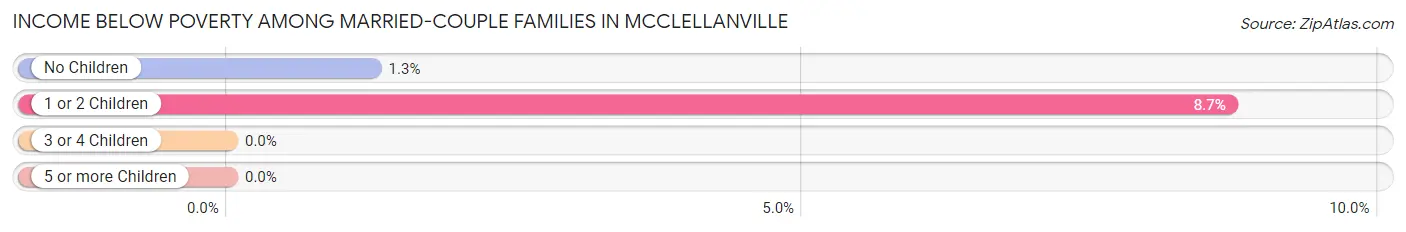
Income Below Poverty Among Married-Couple Families in McClellanville
The poverty statistics for married-couple families in McClellanville show that 4.0% or 7 of the total 175 families live below the poverty line. Families with 1 or 2 children have the highest poverty rate of 8.7%, comprising of 6 families. On the other hand, families with 3 or 4 children have the lowest poverty rate of 0.0%, which includes 0 families.
| Children | Above Poverty | Below Poverty |
| No Children | 79 (98.8%) | 1 (1.3%) |
| 1 or 2 Children | 63 (91.3%) | 6 (8.7%) |
| 3 or 4 Children | 26 (100.0%) | 0 (0.0%) |
| 5 or more Children | 0 (0.0%) | 0 (0.0%) |
| Total | 168 (96.0%) | 7 (4.0%) |
Income Below Poverty Among Single-Parent Households in McClellanville
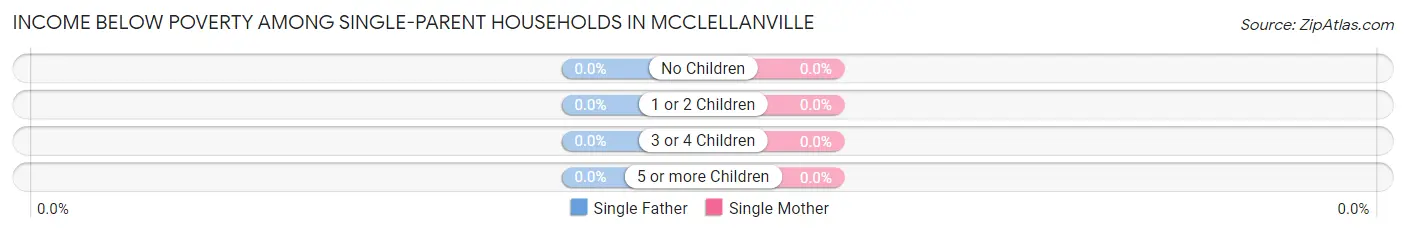
| Children | Single Father | Single Mother |
| No Children | 0 (0.0%) | 0 (0.0%) |
| 1 or 2 Children | 0 (0.0%) | 0 (0.0%) |
| 3 or 4 Children | 0 (0.0%) | 0 (0.0%) |
| 5 or more Children | 0 (0.0%) | 0 (0.0%) |
| Total | 0 (0.0%) | 0 (0.0%) |
Income Below Poverty Among Married-Couple vs Single-Parent Households in McClellanville
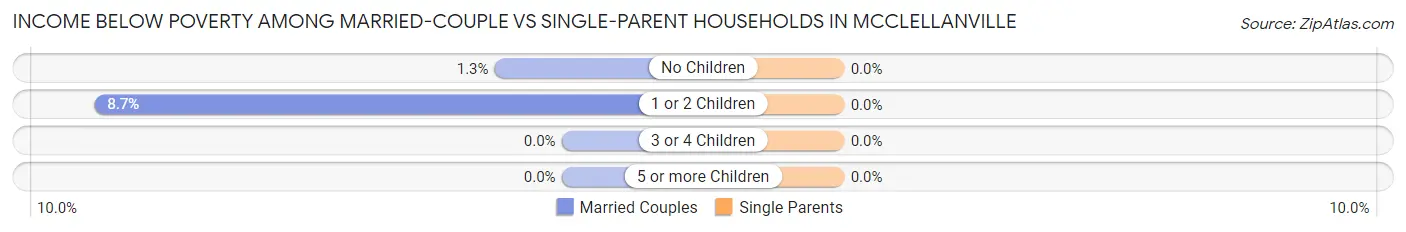
| Children | Married-Couple Families | Single-Parent Households |
| No Children | 1 (1.3%) | 0 (0.0%) |
| 1 or 2 Children | 6 (8.7%) | 0 (0.0%) |
| 3 or 4 Children | 0 (0.0%) | 0 (0.0%) |
| 5 or more Children | 0 (0.0%) | 0 (0.0%) |
| Total | 7 (4.0%) | 0 (0.0%) |
Employment Characteristics in McClellanville
Employment by Class of Employer in McClellanville
Among the 284 employed individuals in McClellanville, private company employees (125 | 44.0%), self-employed (not incorporated) (42 | 14.8%), and local government employees (34 | 12.0%) make up the most common classes of employment.
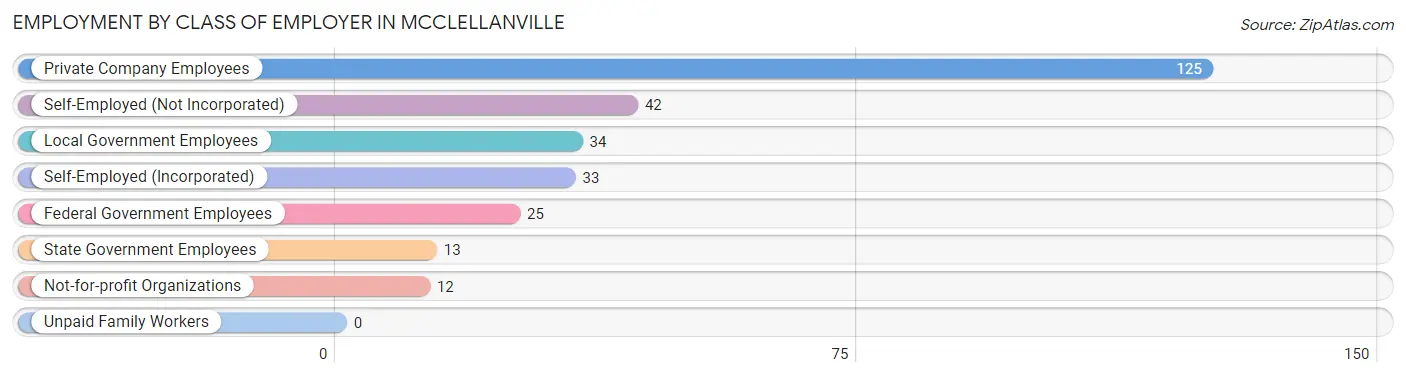
| Employer Class | # Employees | % Employees |
| Private Company Employees | 125 | 44.0% |
| Self-Employed (Incorporated) | 33 | 11.6% |
| Self-Employed (Not Incorporated) | 42 | 14.8% |
| Not-for-profit Organizations | 12 | 4.2% |
| Local Government Employees | 34 | 12.0% |
| State Government Employees | 13 | 4.6% |
| Federal Government Employees | 25 | 8.8% |
| Unpaid Family Workers | 0 | 0.0% |
| Total | 284 | 100.0% |
Employment Status by Age in McClellanville
According to the labor force statistics for McClellanville, out of the total population over 16 years of age (556), 52.2% or 290 individuals are in the labor force, with 1.0% or 3 of them unemployed. The age group with the highest labor force participation rate is 20 to 24 years, with 100.0% or 10 individuals in the labor force. Within the labor force, the 60 to 64 years age range has the highest percentage of unemployed individuals, with 8.6% or 3 of them being unemployed.
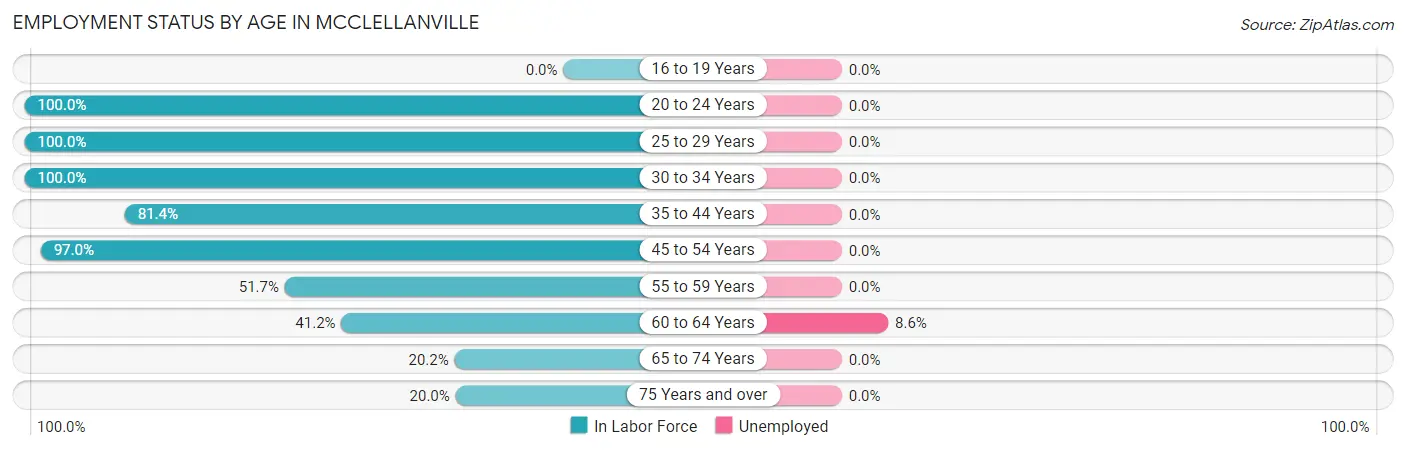
| Age Bracket | In Labor Force | Unemployed |
| 16 to 19 Years | 0 (0.0%) | 0 (0.0%) |
| 20 to 24 Years | 10 (100.0%) | 0 (0.0%) |
| 25 to 29 Years | 17 (100.0%) | 0 (0.0%) |
| 30 to 34 Years | 15 (100.0%) | 0 (0.0%) |
| 35 to 44 Years | 96 (81.4%) | 0 (0.0%) |
| 45 to 54 Years | 65 (97.0%) | 0 (0.0%) |
| 55 to 59 Years | 15 (51.7%) | 0 (0.0%) |
| 60 to 64 Years | 35 (41.2%) | 3 (8.6%) |
| 65 to 74 Years | 20 (20.2%) | 0 (0.0%) |
| 75 Years and over | 17 (20.0%) | 0 (0.0%) |
| Total | 290 (52.2%) | 3 (1.0%) |
Employment Status by Educational Attainment in McClellanville
According to labor force statistics for McClellanville, 73.4% of individuals (243) out of the total population between 25 and 64 years of age (331) are in the labor force, with 1.2% or 3 of them being unemployed. The group with the highest labor force participation rate are those with the educational attainment of less than high school, with 100.0% or 4 individuals in the labor force. Within the labor force, individuals with high school diploma education have the highest percentage of unemployment, with 27.3% or 3 of them being unemployed.
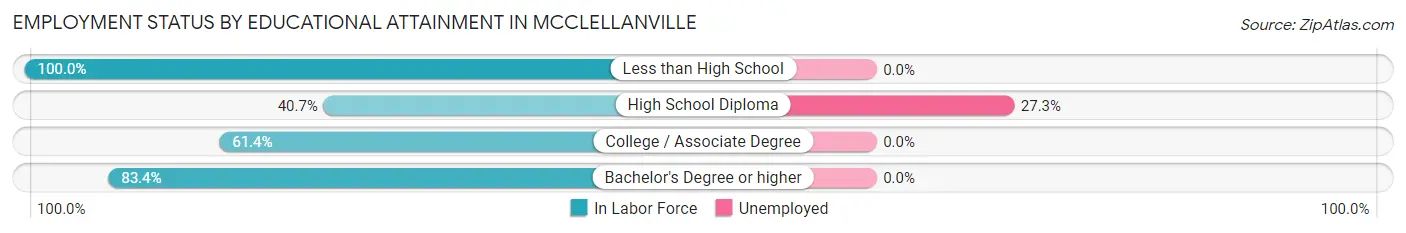
| Educational Attainment | In Labor Force | Unemployed |
| Less than High School | 4 (100.0%) | 0 (0.0%) |
| High School Diploma | 11 (40.7%) | 7 (27.3%) |
| College / Associate Degree | 62 (61.4%) | 0 (0.0%) |
| Bachelor's Degree or higher | 166 (83.4%) | 0 (0.0%) |
| Total | 243 (73.4%) | 4 (1.2%) |
Employment Occupations by Sex in McClellanville
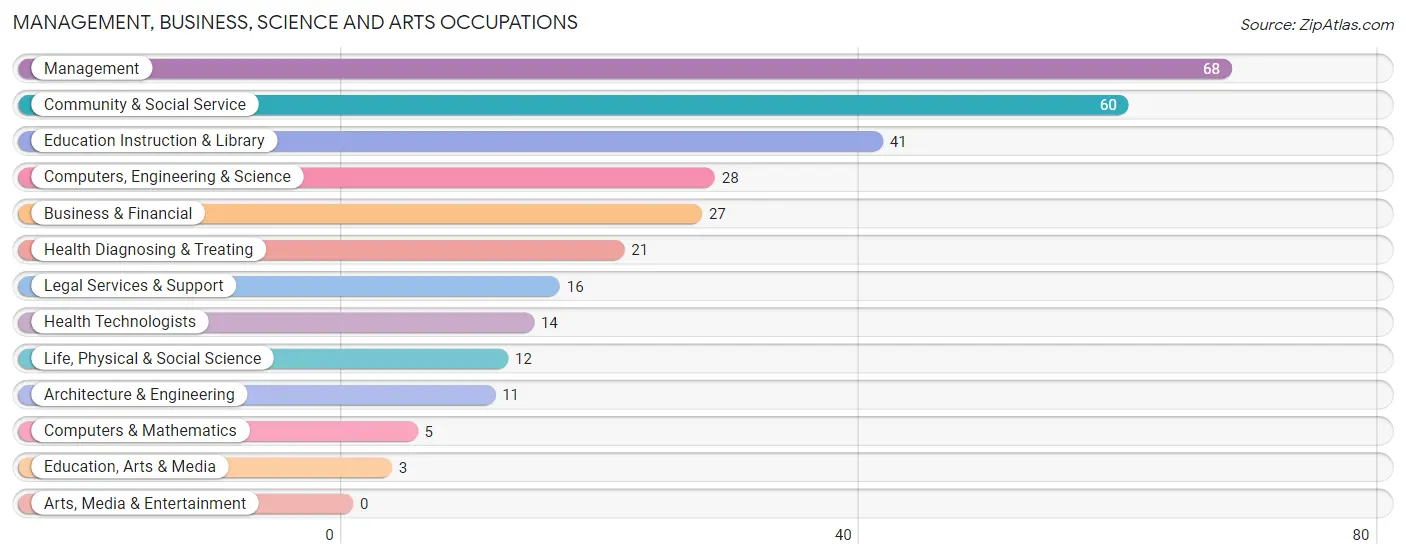
Management, Business, Science and Arts Occupations
The most common Management, Business, Science and Arts occupations in McClellanville are Management (68 | 23.7%), Community & Social Service (60 | 20.9%), Education Instruction & Library (41 | 14.3%), Computers, Engineering & Science (28 | 9.8%), and Business & Financial (27 | 9.4%).
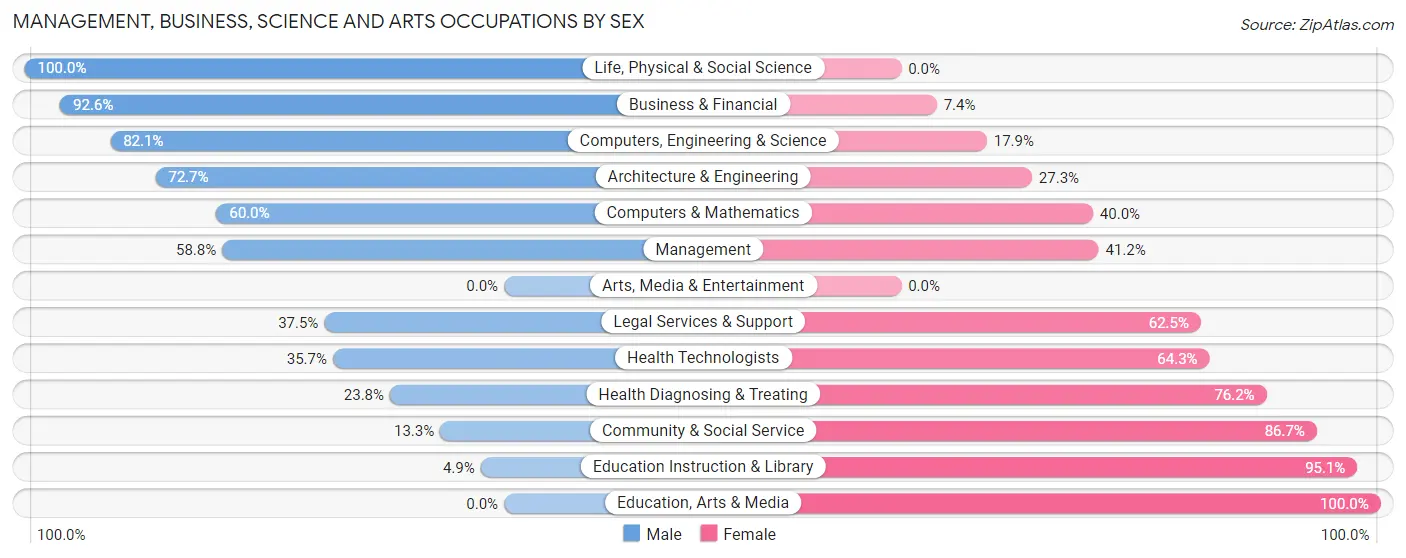
Management, Business, Science and Arts Occupations by Sex
Within the Management, Business, Science and Arts occupations in McClellanville, the most male-oriented occupations are Life, Physical & Social Science (100.0%), Business & Financial (92.6%), and Computers, Engineering & Science (82.1%), while the most female-oriented occupations are Education, Arts & Media (100.0%), Education Instruction & Library (95.1%), and Community & Social Service (86.7%).
| Occupation | Male | Female |
| Management | 40 (58.8%) | 28 (41.2%) |
| Business & Financial | 25 (92.6%) | 2 (7.4%) |
| Computers, Engineering & Science | 23 (82.1%) | 5 (17.9%) |
| Computers & Mathematics | 3 (60.0%) | 2 (40.0%) |
| Architecture & Engineering | 8 (72.7%) | 3 (27.3%) |
| Life, Physical & Social Science | 12 (100.0%) | 0 (0.0%) |
| Community & Social Service | 8 (13.3%) | 52 (86.7%) |
| Education, Arts & Media | 0 (0.0%) | 3 (100.0%) |
| Legal Services & Support | 6 (37.5%) | 10 (62.5%) |
| Education Instruction & Library | 2 (4.9%) | 39 (95.1%) |
| Arts, Media & Entertainment | 0 (0.0%) | 0 (0.0%) |
| Health Diagnosing & Treating | 5 (23.8%) | 16 (76.2%) |
| Health Technologists | 5 (35.7%) | 9 (64.3%) |
| Total (Category) | 101 (49.5%) | 103 (50.5%) |
| Total (Overall) | 154 (53.7%) | 133 (46.3%) |
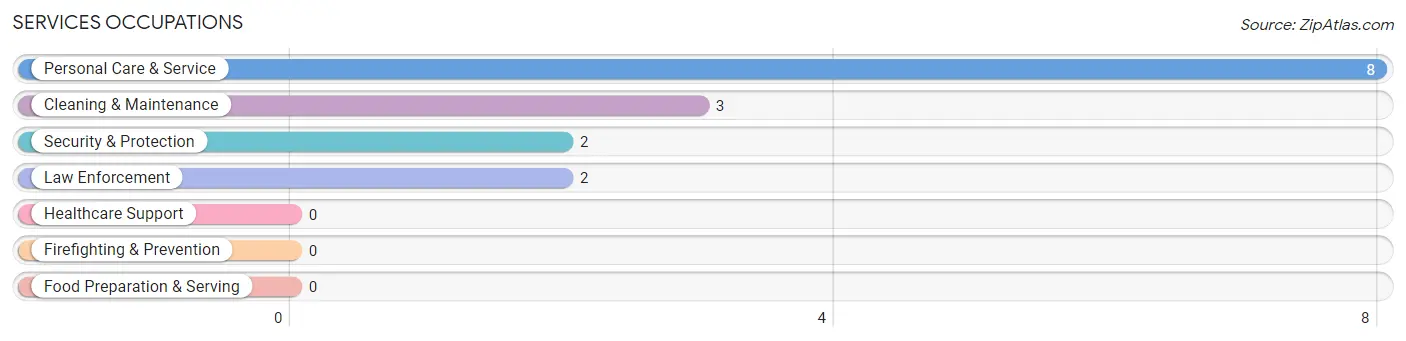
Services Occupations
The most common Services occupations in McClellanville are Personal Care & Service (8 | 2.8%), Cleaning & Maintenance (3 | 1.1%), Security & Protection (2 | 0.7%), and Law Enforcement (2 | 0.7%).
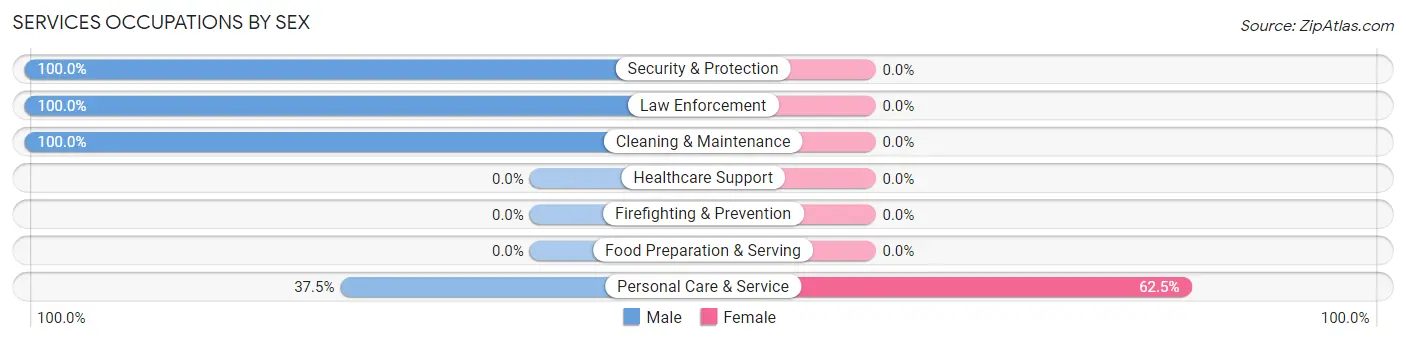
Services Occupations by Sex
| Occupation | Male | Female |
| Healthcare Support | 0 (0.0%) | 0 (0.0%) |
| Security & Protection | 2 (100.0%) | 0 (0.0%) |
| Firefighting & Prevention | 0 (0.0%) | 0 (0.0%) |
| Law Enforcement | 2 (100.0%) | 0 (0.0%) |
| Food Preparation & Serving | 0 (0.0%) | 0 (0.0%) |
| Cleaning & Maintenance | 3 (100.0%) | 0 (0.0%) |
| Personal Care & Service | 3 (37.5%) | 5 (62.5%) |
| Total (Category) | 8 (61.5%) | 5 (38.5%) |
| Total (Overall) | 154 (53.7%) | 133 (46.3%) |
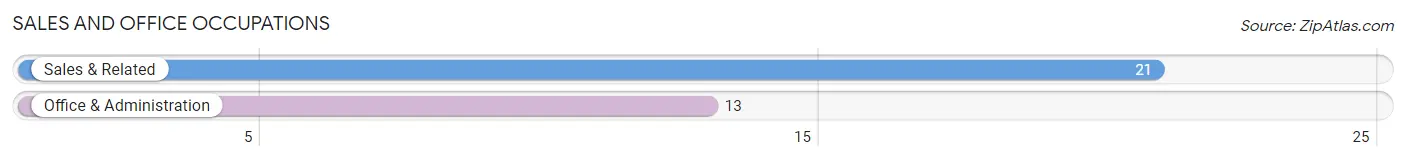
Sales and Office Occupations
The most common Sales and Office occupations in McClellanville are Sales & Related (21 | 7.3%), and Office & Administration (13 | 4.5%).
Sales and Office Occupations by Sex
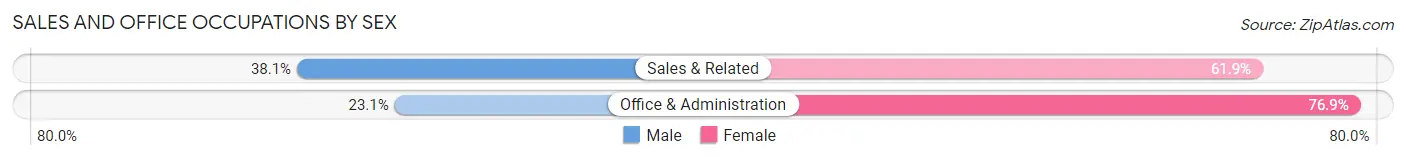
| Occupation | Male | Female |
| Sales & Related | 8 (38.1%) | 13 (61.9%) |
| Office & Administration | 3 (23.1%) | 10 (76.9%) |
| Total (Category) | 11 (32.4%) | 23 (67.6%) |
| Total (Overall) | 154 (53.7%) | 133 (46.3%) |
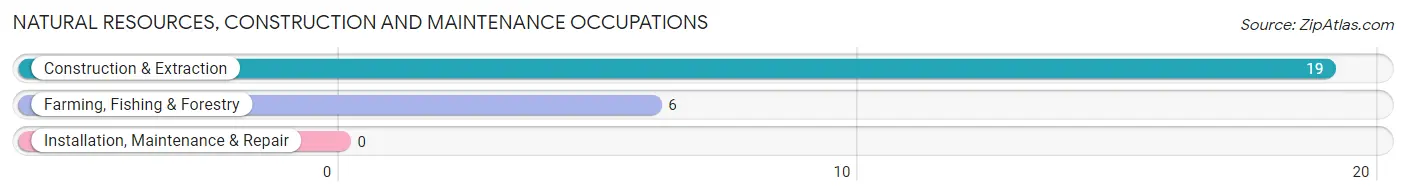
Natural Resources, Construction and Maintenance Occupations
The most common Natural Resources, Construction and Maintenance occupations in McClellanville are Construction & Extraction (19 | 6.6%), and Farming, Fishing & Forestry (6 | 2.1%).
Natural Resources, Construction and Maintenance Occupations by Sex
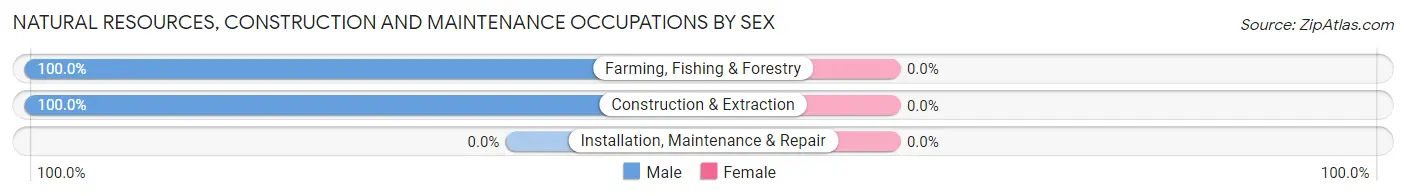
| Occupation | Male | Female |
| Farming, Fishing & Forestry | 6 (100.0%) | 0 (0.0%) |
| Construction & Extraction | 19 (100.0%) | 0 (0.0%) |
| Installation, Maintenance & Repair | 0 (0.0%) | 0 (0.0%) |
| Total (Category) | 25 (100.0%) | 0 (0.0%) |
| Total (Overall) | 154 (53.7%) | 133 (46.3%) |
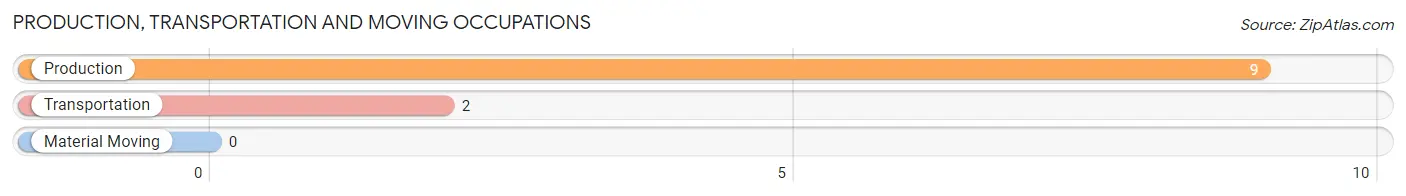
Production, Transportation and Moving Occupations
The most common Production, Transportation and Moving occupations in McClellanville are Production (9 | 3.1%), and Transportation (2 | 0.7%).
Production, Transportation and Moving Occupations by Sex
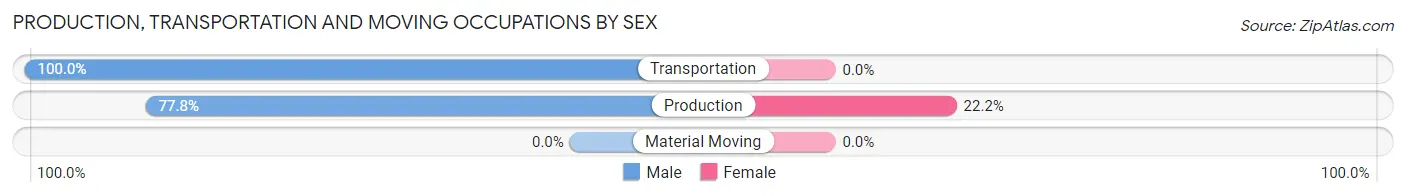
| Occupation | Male | Female |
| Production | 7 (77.8%) | 2 (22.2%) |
| Transportation | 2 (100.0%) | 0 (0.0%) |
| Material Moving | 0 (0.0%) | 0 (0.0%) |
| Total (Category) | 9 (81.8%) | 2 (18.2%) |
| Total (Overall) | 154 (53.7%) | 133 (46.3%) |
Employment Industries by Sex in McClellanville
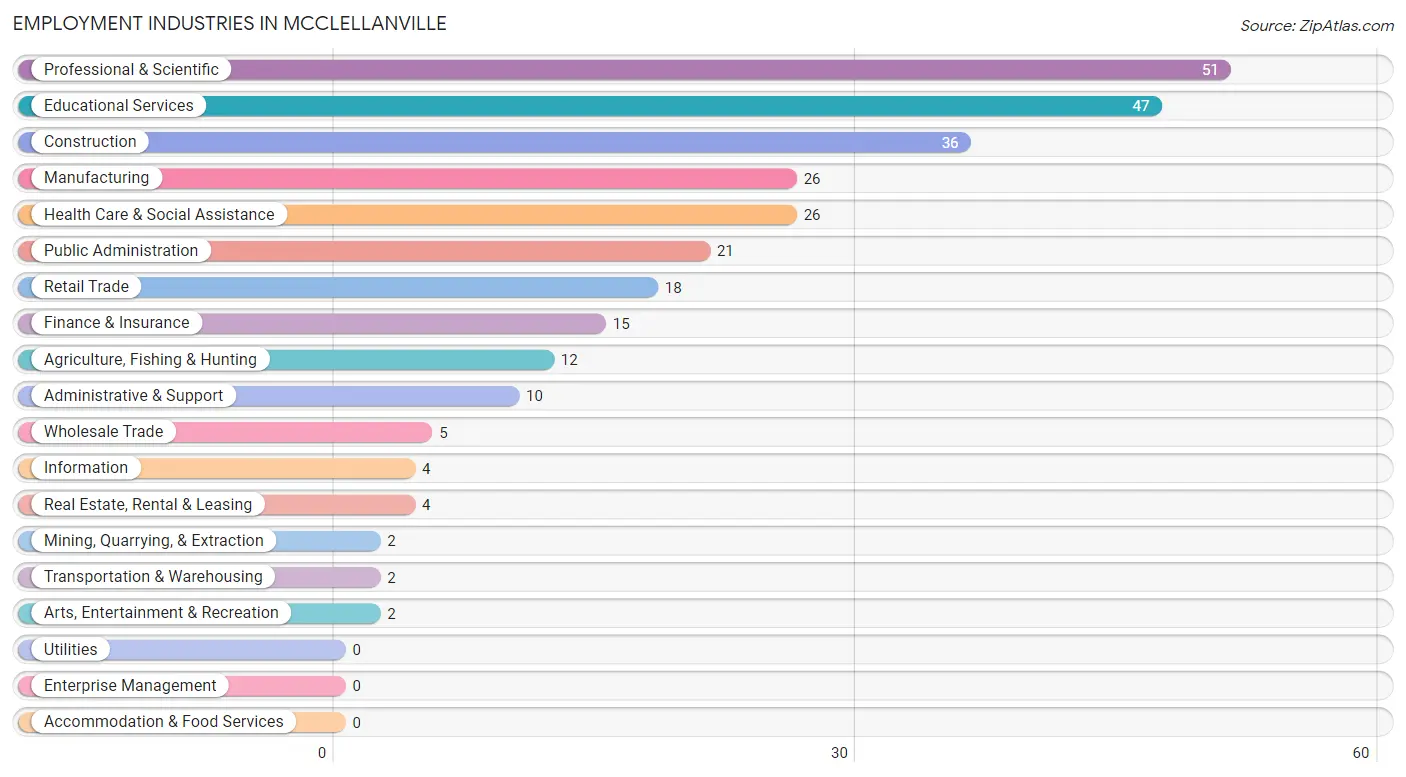
Employment Industries in McClellanville
The major employment industries in McClellanville include Professional & Scientific (51 | 17.8%), Educational Services (47 | 16.4%), Construction (36 | 12.5%), Manufacturing (26 | 9.1%), and Health Care & Social Assistance (26 | 9.1%).
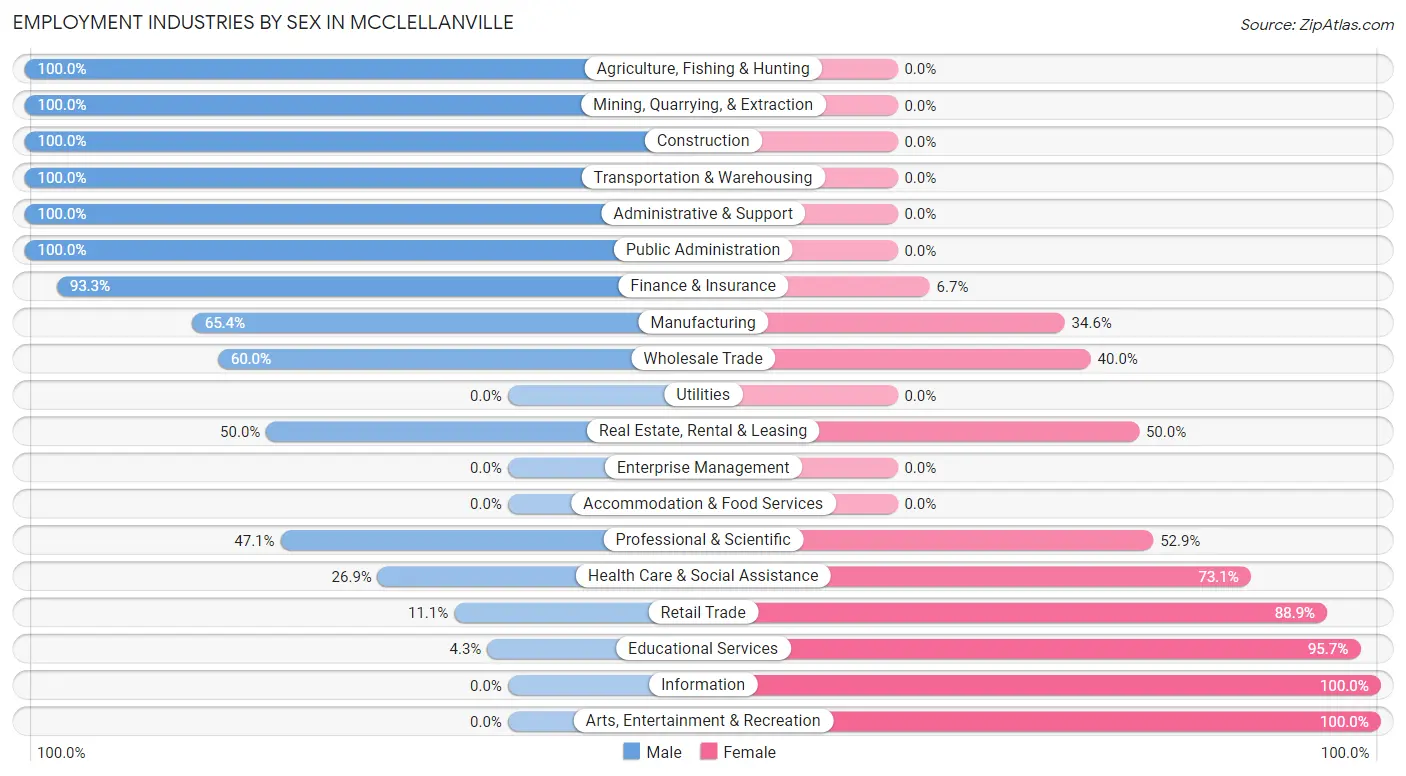
Employment Industries by Sex in McClellanville
The McClellanville industries that see more men than women are Agriculture, Fishing & Hunting (100.0%), Mining, Quarrying, & Extraction (100.0%), and Construction (100.0%), whereas the industries that tend to have a higher number of women are Information (100.0%), Arts, Entertainment & Recreation (100.0%), and Educational Services (95.7%).
| Industry | Male | Female |
| Agriculture, Fishing & Hunting | 12 (100.0%) | 0 (0.0%) |
| Mining, Quarrying, & Extraction | 2 (100.0%) | 0 (0.0%) |
| Construction | 36 (100.0%) | 0 (0.0%) |
| Manufacturing | 17 (65.4%) | 9 (34.6%) |
| Wholesale Trade | 3 (60.0%) | 2 (40.0%) |
| Retail Trade | 2 (11.1%) | 16 (88.9%) |
| Transportation & Warehousing | 2 (100.0%) | 0 (0.0%) |
| Utilities | 0 (0.0%) | 0 (0.0%) |
| Information | 0 (0.0%) | 4 (100.0%) |
| Finance & Insurance | 14 (93.3%) | 1 (6.7%) |
| Real Estate, Rental & Leasing | 2 (50.0%) | 2 (50.0%) |
| Professional & Scientific | 24 (47.1%) | 27 (52.9%) |
| Enterprise Management | 0 (0.0%) | 0 (0.0%) |
| Administrative & Support | 10 (100.0%) | 0 (0.0%) |
| Educational Services | 2 (4.3%) | 45 (95.7%) |
| Health Care & Social Assistance | 7 (26.9%) | 19 (73.1%) |
| Arts, Entertainment & Recreation | 0 (0.0%) | 2 (100.0%) |
| Accommodation & Food Services | 0 (0.0%) | 0 (0.0%) |
| Public Administration | 21 (100.0%) | 0 (0.0%) |
| Total | 154 (53.7%) | 133 (46.3%) |
Education in McClellanville
School Enrollment in McClellanville
The most common levels of schooling among the 244 students in McClellanville are elementary school (67 | 27.5%), middle school (66 | 27.1%), and high school (62 | 25.4%).
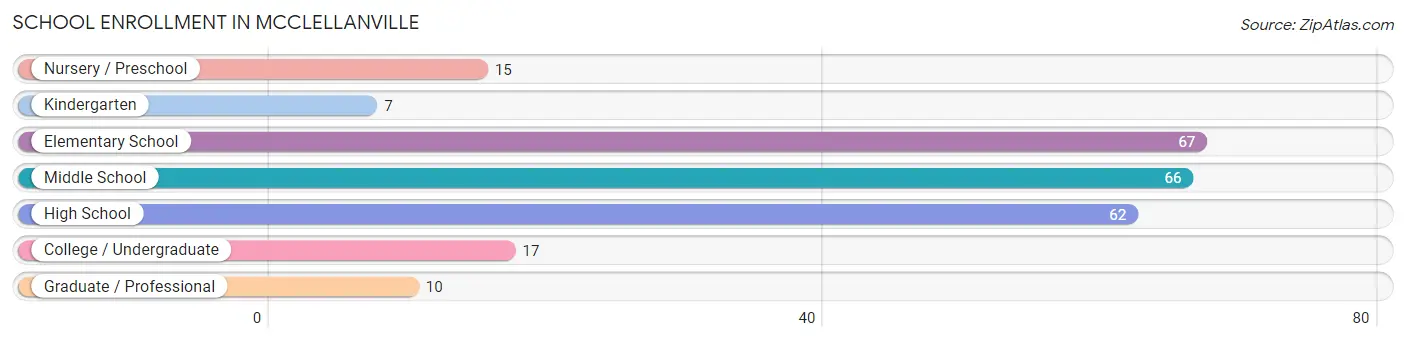
| School Level | # Students | % Students |
| Nursery / Preschool | 15 | 6.1% |
| Kindergarten | 7 | 2.9% |
| Elementary School | 67 | 27.5% |
| Middle School | 66 | 27.1% |
| High School | 62 | 25.4% |
| College / Undergraduate | 17 | 7.0% |
| Graduate / Professional | 10 | 4.1% |
| Total | 244 | 100.0% |
School Enrollment by Age by Funding Source in McClellanville
Out of a total of 244 students who are enrolled in schools in McClellanville, 34 (13.9%) attend a private institution, while the remaining 210 (86.1%) are enrolled in public schools. The age group of 20 to 24 year olds has the highest likelihood of being enrolled in private schools, with 6 (100.0% in the age bracket) enrolled. Conversely, the age group of 18 to 19 year olds has the lowest likelihood of being enrolled in a private school, with 11 (100.0% in the age bracket) attending a public institution.
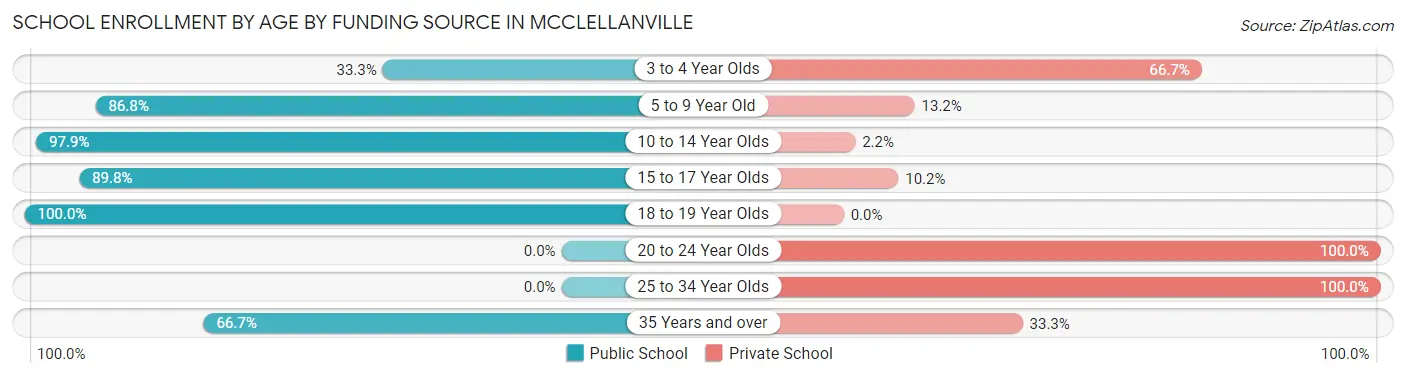
| Age Bracket | Public School | Private School |
| 3 to 4 Year Olds | 3 (33.3%) | 6 (66.7%) |
| 5 to 9 Year Old | 46 (86.8%) | 7 (13.2%) |
| 10 to 14 Year Olds | 91 (97.9%) | 2 (2.1%) |
| 15 to 17 Year Olds | 53 (89.8%) | 6 (10.2%) |
| 18 to 19 Year Olds | 11 (100.0%) | 0 (0.0%) |
| 20 to 24 Year Olds | 0 (0.0%) | 6 (100.0%) |
| 25 to 34 Year Olds | 0 (0.0%) | 4 (100.0%) |
| 35 Years and over | 6 (66.7%) | 3 (33.3%) |
| Total | 210 (86.1%) | 34 (13.9%) |
Educational Attainment by Field of Study in McClellanville
Business (85 | 26.2%), science & technology (37 | 11.4%), bio, nature & agricultural (34 | 10.5%), education (33 | 10.2%), and literature & languages (28 | 8.6%) are the most common fields of study among 325 individuals in McClellanville who have obtained a bachelor's degree or higher.
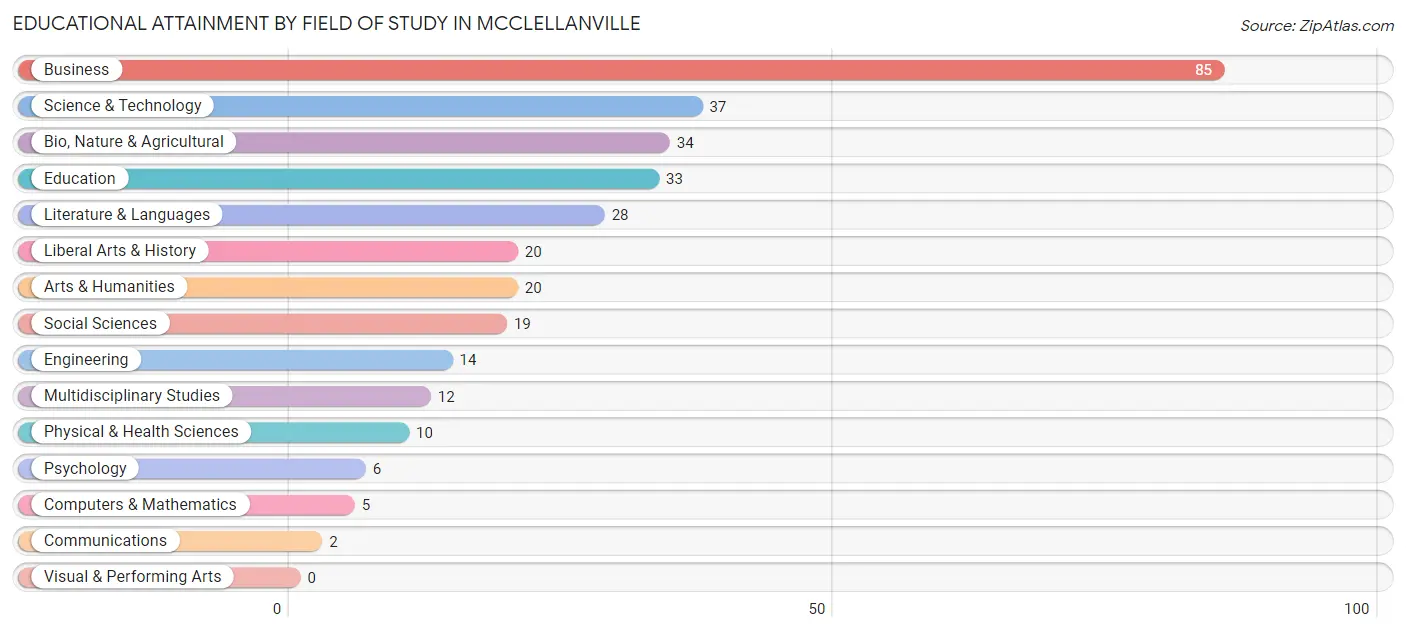
| Field of Study | # Graduates | % Graduates |
| Computers & Mathematics | 5 | 1.5% |
| Bio, Nature & Agricultural | 34 | 10.5% |
| Physical & Health Sciences | 10 | 3.1% |
| Psychology | 6 | 1.8% |
| Social Sciences | 19 | 5.9% |
| Engineering | 14 | 4.3% |
| Multidisciplinary Studies | 12 | 3.7% |
| Science & Technology | 37 | 11.4% |
| Business | 85 | 26.2% |
| Education | 33 | 10.2% |
| Literature & Languages | 28 | 8.6% |
| Liberal Arts & History | 20 | 6.1% |
| Visual & Performing Arts | 0 | 0.0% |
| Communications | 2 | 0.6% |
| Arts & Humanities | 20 | 6.1% |
| Total | 325 | 100.0% |
Transportation & Commute in McClellanville
Vehicle Availability by Sex in McClellanville
The most prevalent vehicle ownership categories in McClellanville are males with 2 vehicles (88, accounting for 57.1%) and females with 2 vehicles (81, making up 67.7%).
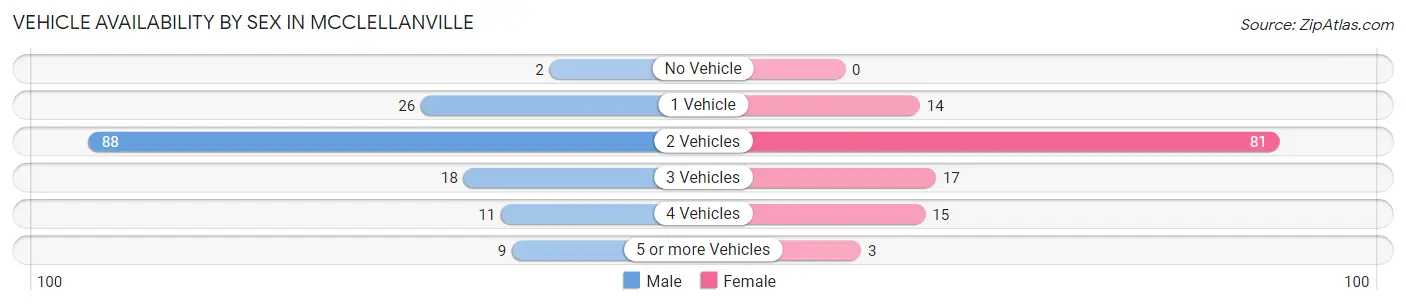
| Vehicles Available | Male | Female |
| No Vehicle | 2 (1.3%) | 0 (0.0%) |
| 1 Vehicle | 26 (16.9%) | 14 (10.8%) |
| 2 Vehicles | 88 (57.1%) | 81 (62.3%) |
| 3 Vehicles | 18 (11.7%) | 17 (13.1%) |
| 4 Vehicles | 11 (7.1%) | 15 (11.5%) |
| 5 or more Vehicles | 9 (5.8%) | 3 (2.3%) |
| Total | 154 (100.0%) | 130 (100.0%) |
Commute Time in McClellanville
The most frequently occuring commute durations in McClellanville are 45 to 59 minutes (82 commuters, 32.9%), 30 to 34 minutes (34 commuters, 13.7%), and 25 to 29 minutes (27 commuters, 10.8%).
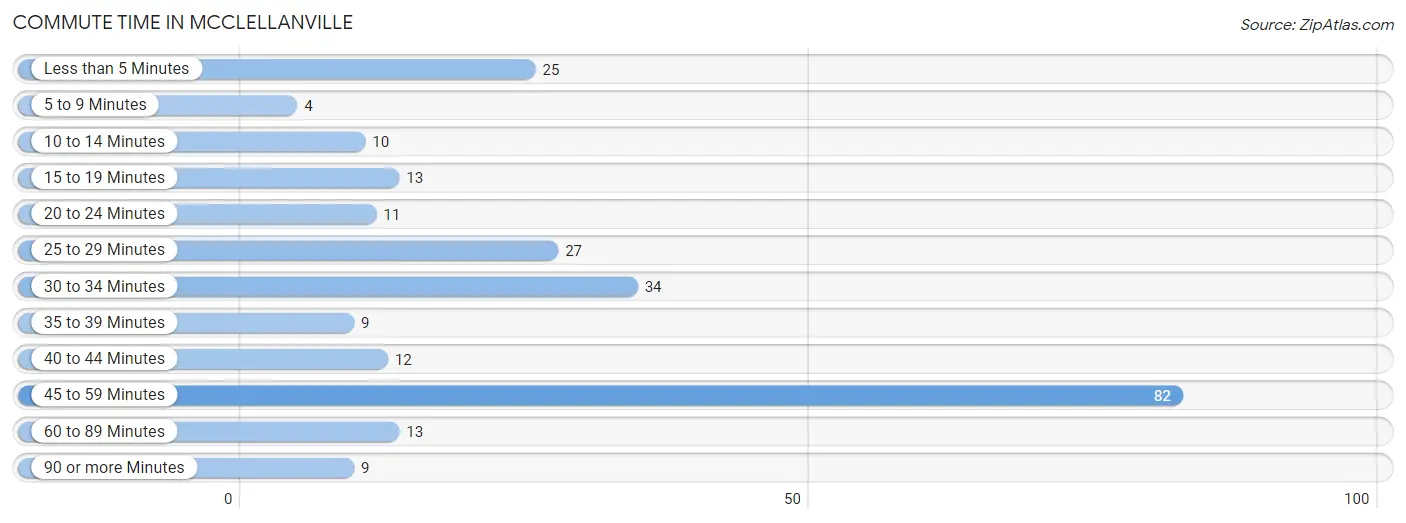
| Commute Time | # Commuters | % Commuters |
| Less than 5 Minutes | 25 | 10.0% |
| 5 to 9 Minutes | 4 | 1.6% |
| 10 to 14 Minutes | 10 | 4.0% |
| 15 to 19 Minutes | 13 | 5.2% |
| 20 to 24 Minutes | 11 | 4.4% |
| 25 to 29 Minutes | 27 | 10.8% |
| 30 to 34 Minutes | 34 | 13.7% |
| 35 to 39 Minutes | 9 | 3.6% |
| 40 to 44 Minutes | 12 | 4.8% |
| 45 to 59 Minutes | 82 | 32.9% |
| 60 to 89 Minutes | 13 | 5.2% |
| 90 or more Minutes | 9 | 3.6% |
Commute Time by Sex in McClellanville
The most common commute times in McClellanville are 45 to 59 minutes (38 commuters, 26.6%) for males and 45 to 59 minutes (44 commuters, 41.5%) for females.
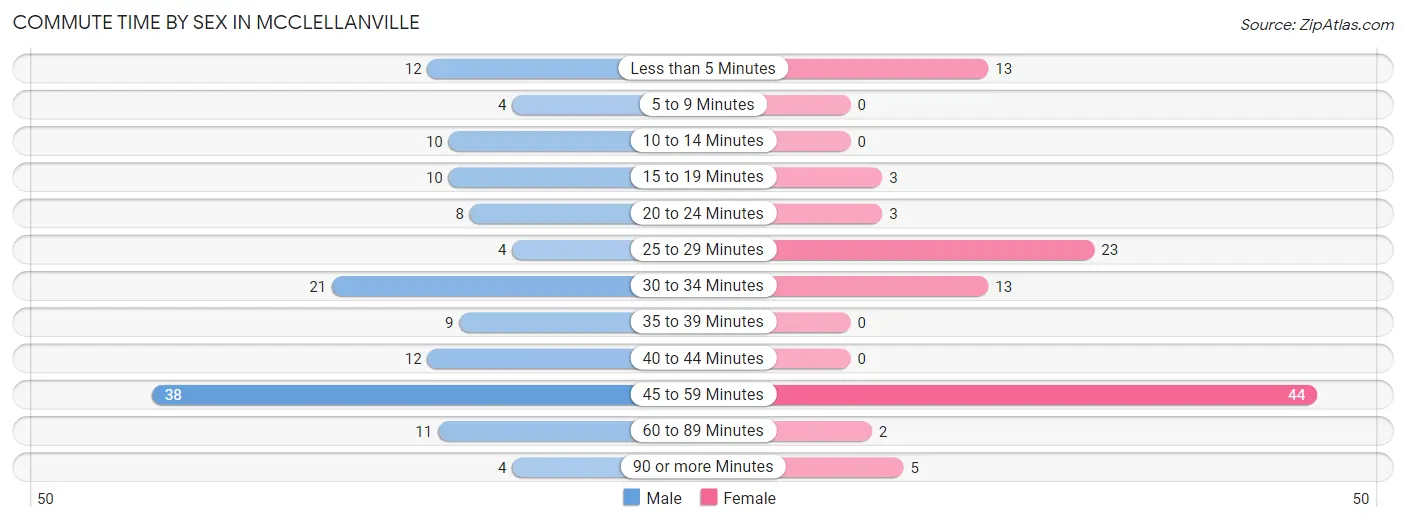
| Commute Time | Male | Female |
| Less than 5 Minutes | 12 (8.4%) | 13 (12.3%) |
| 5 to 9 Minutes | 4 (2.8%) | 0 (0.0%) |
| 10 to 14 Minutes | 10 (7.0%) | 0 (0.0%) |
| 15 to 19 Minutes | 10 (7.0%) | 3 (2.8%) |
| 20 to 24 Minutes | 8 (5.6%) | 3 (2.8%) |
| 25 to 29 Minutes | 4 (2.8%) | 23 (21.7%) |
| 30 to 34 Minutes | 21 (14.7%) | 13 (12.3%) |
| 35 to 39 Minutes | 9 (6.3%) | 0 (0.0%) |
| 40 to 44 Minutes | 12 (8.4%) | 0 (0.0%) |
| 45 to 59 Minutes | 38 (26.6%) | 44 (41.5%) |
| 60 to 89 Minutes | 11 (7.7%) | 2 (1.9%) |
| 90 or more Minutes | 4 (2.8%) | 5 (4.7%) |
Time of Departure to Work by Sex in McClellanville
The most frequent times of departure to work in McClellanville are 8:00 AM to 8:29 AM (27, 18.9%) for males and 6:30 AM to 6:59 AM (33, 31.1%) for females.
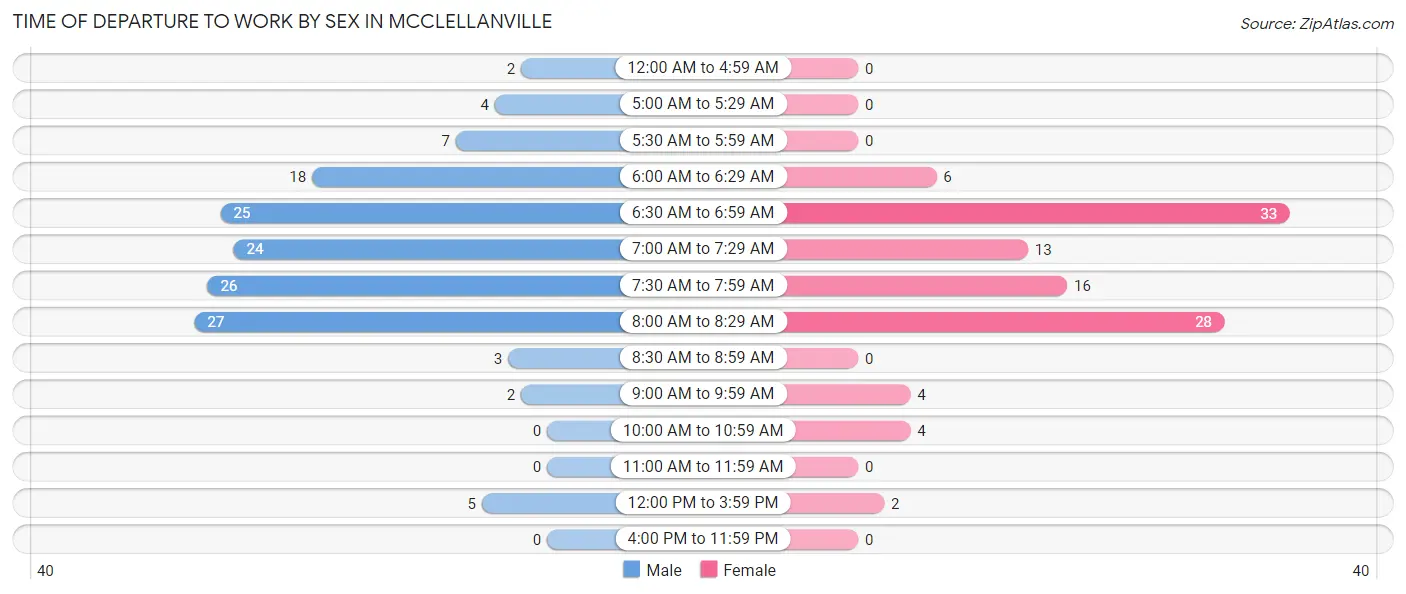
| Time of Departure | Male | Female |
| 12:00 AM to 4:59 AM | 2 (1.4%) | 0 (0.0%) |
| 5:00 AM to 5:29 AM | 4 (2.8%) | 0 (0.0%) |
| 5:30 AM to 5:59 AM | 7 (4.9%) | 0 (0.0%) |
| 6:00 AM to 6:29 AM | 18 (12.6%) | 6 (5.7%) |
| 6:30 AM to 6:59 AM | 25 (17.5%) | 33 (31.1%) |
| 7:00 AM to 7:29 AM | 24 (16.8%) | 13 (12.3%) |
| 7:30 AM to 7:59 AM | 26 (18.2%) | 16 (15.1%) |
| 8:00 AM to 8:29 AM | 27 (18.9%) | 28 (26.4%) |
| 8:30 AM to 8:59 AM | 3 (2.1%) | 0 (0.0%) |
| 9:00 AM to 9:59 AM | 2 (1.4%) | 4 (3.8%) |
| 10:00 AM to 10:59 AM | 0 (0.0%) | 4 (3.8%) |
| 11:00 AM to 11:59 AM | 0 (0.0%) | 0 (0.0%) |
| 12:00 PM to 3:59 PM | 5 (3.5%) | 2 (1.9%) |
| 4:00 PM to 11:59 PM | 0 (0.0%) | 0 (0.0%) |
| Total | 143 (100.0%) | 106 (100.0%) |
Housing Occupancy in McClellanville
Occupancy by Ownership in McClellanville
Of the total 294 dwellings in McClellanville, owner-occupied units account for 274 (93.2%), while renter-occupied units make up 20 (6.8%).
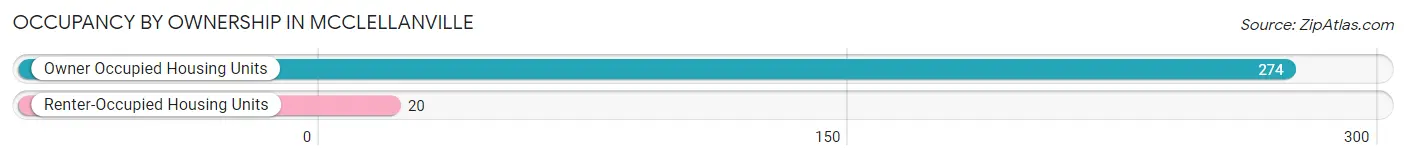
| Occupancy | # Housing Units | % Housing Units |
| Owner Occupied Housing Units | 274 | 93.2% |
| Renter-Occupied Housing Units | 20 | 6.8% |
| Total Occupied Housing Units | 294 | 100.0% |
Occupancy by Household Size in McClellanville
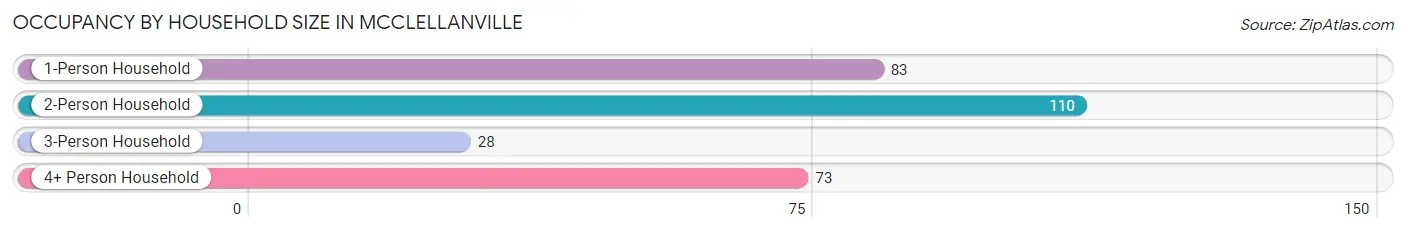
| Household Size | # Housing Units | % Housing Units |
| 1-Person Household | 83 | 28.2% |
| 2-Person Household | 110 | 37.4% |
| 3-Person Household | 28 | 9.5% |
| 4+ Person Household | 73 | 24.8% |
| Total Housing Units | 294 | 100.0% |
Occupancy by Ownership by Household Size in McClellanville
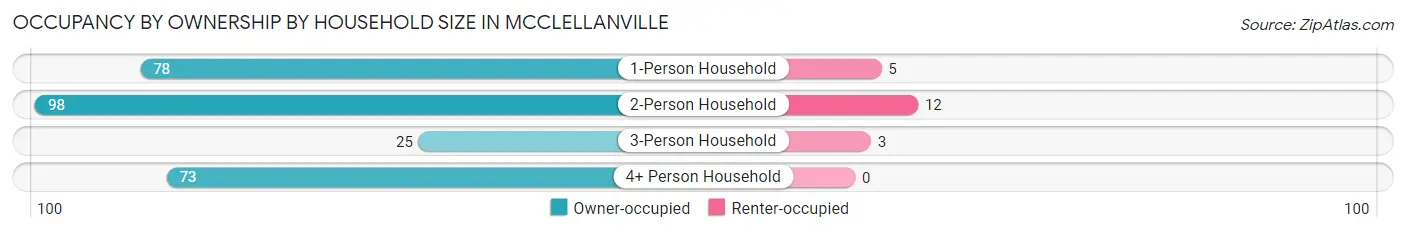
| Household Size | Owner-occupied | Renter-occupied |
| 1-Person Household | 78 (94.0%) | 5 (6.0%) |
| 2-Person Household | 98 (89.1%) | 12 (10.9%) |
| 3-Person Household | 25 (89.3%) | 3 (10.7%) |
| 4+ Person Household | 73 (100.0%) | 0 (0.0%) |
| Total Housing Units | 274 (93.2%) | 20 (6.8%) |
Occupancy by Educational Attainment in McClellanville
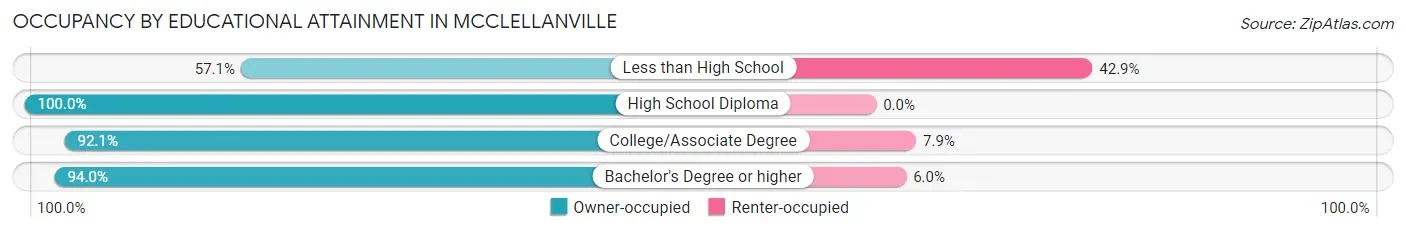
| Household Size | Owner-occupied | Renter-occupied |
| Less than High School | 4 (57.1%) | 3 (42.9%) |
| High School Diploma | 35 (100.0%) | 0 (0.0%) |
| College/Associate Degree | 93 (92.1%) | 8 (7.9%) |
| Bachelor's Degree or higher | 142 (94.0%) | 9 (6.0%) |
Occupancy by Age of Householder in McClellanville
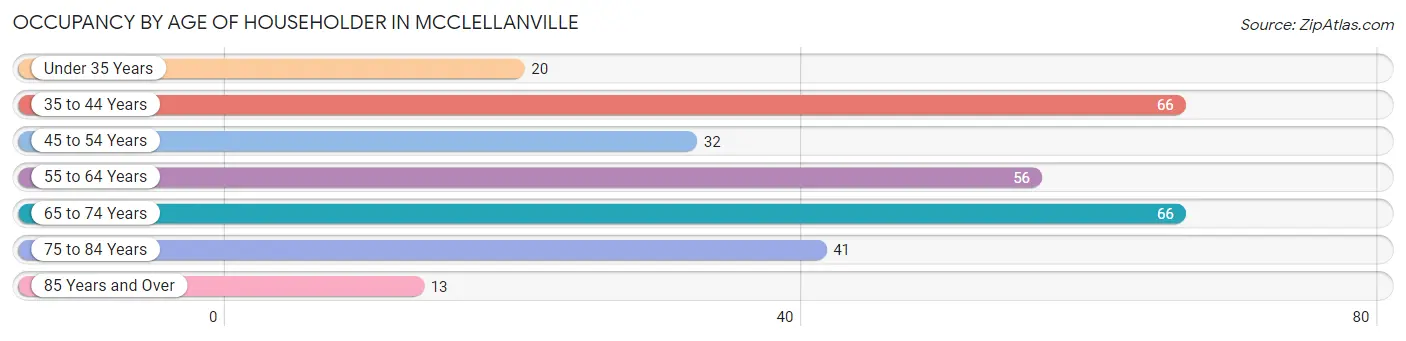
| Age Bracket | # Households | % Households |
| Under 35 Years | 20 | 6.8% |
| 35 to 44 Years | 66 | 22.5% |
| 45 to 54 Years | 32 | 10.9% |
| 55 to 64 Years | 56 | 19.1% |
| 65 to 74 Years | 66 | 22.5% |
| 75 to 84 Years | 41 | 14.0% |
| 85 Years and Over | 13 | 4.4% |
| Total | 294 | 100.0% |
Housing Finances in McClellanville
Median Income by Occupancy in McClellanville
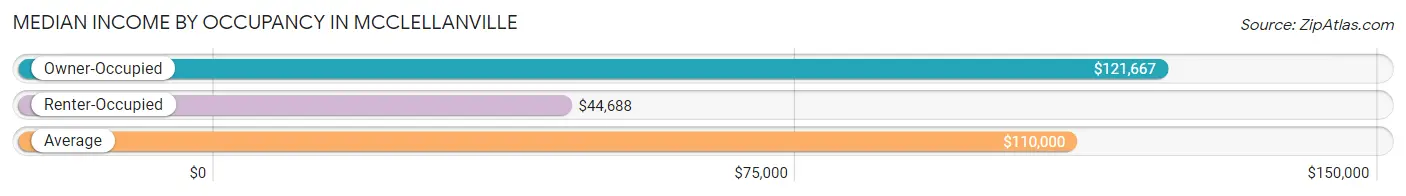
| Occupancy Type | # Households | Median Income |
| Owner-Occupied | 274 (93.2%) | $121,667 |
| Renter-Occupied | 20 (6.8%) | $44,688 |
| Average | 294 (100.0%) | $110,000 |
Occupancy by Householder Income Bracket in McClellanville
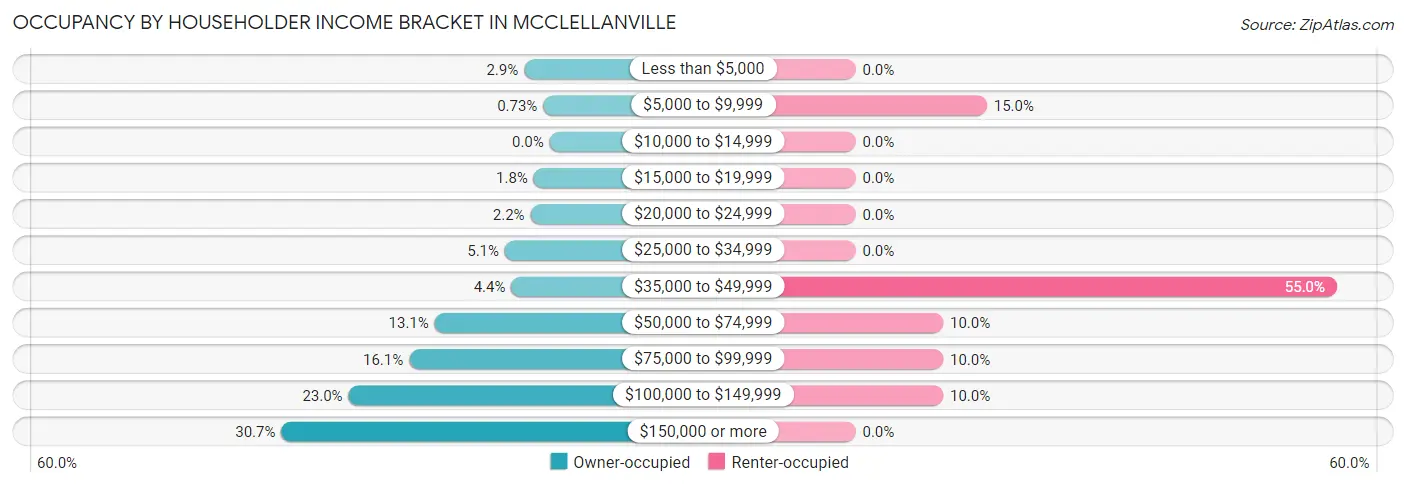
| Income Bracket | Owner-occupied | Renter-occupied |
| Less than $5,000 | 8 (2.9%) | 0 (0.0%) |
| $5,000 to $9,999 | 2 (0.7%) | 3 (15.0%) |
| $10,000 to $14,999 | 0 (0.0%) | 0 (0.0%) |
| $15,000 to $19,999 | 5 (1.8%) | 0 (0.0%) |
| $20,000 to $24,999 | 6 (2.2%) | 0 (0.0%) |
| $25,000 to $34,999 | 14 (5.1%) | 0 (0.0%) |
| $35,000 to $49,999 | 12 (4.4%) | 11 (55.0%) |
| $50,000 to $74,999 | 36 (13.1%) | 2 (10.0%) |
| $75,000 to $99,999 | 44 (16.1%) | 2 (10.0%) |
| $100,000 to $149,999 | 63 (23.0%) | 2 (10.0%) |
| $150,000 or more | 84 (30.7%) | 0 (0.0%) |
| Total | 274 (100.0%) | 20 (100.0%) |
Monthly Housing Cost Tiers in McClellanville
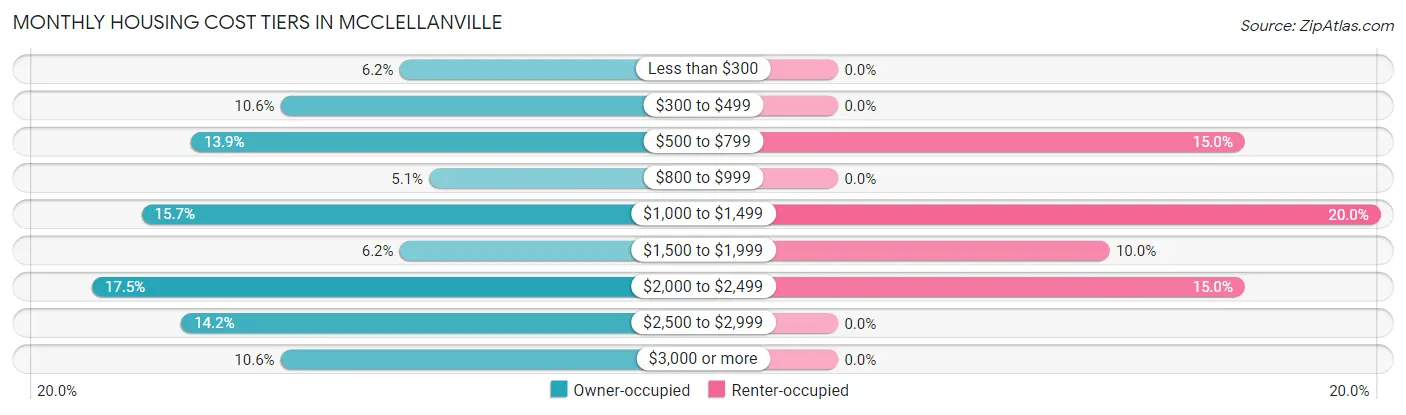
| Monthly Cost | Owner-occupied | Renter-occupied |
| Less than $300 | 17 (6.2%) | 0 (0.0%) |
| $300 to $499 | 29 (10.6%) | 0 (0.0%) |
| $500 to $799 | 38 (13.9%) | 3 (15.0%) |
| $800 to $999 | 14 (5.1%) | 0 (0.0%) |
| $1,000 to $1,499 | 43 (15.7%) | 4 (20.0%) |
| $1,500 to $1,999 | 17 (6.2%) | 2 (10.0%) |
| $2,000 to $2,499 | 48 (17.5%) | 3 (15.0%) |
| $2,500 to $2,999 | 39 (14.2%) | 0 (0.0%) |
| $3,000 or more | 29 (10.6%) | 0 (0.0%) |
| Total | 274 (100.0%) | 20 (100.0%) |
Physical Housing Characteristics in McClellanville
Housing Structures in McClellanville
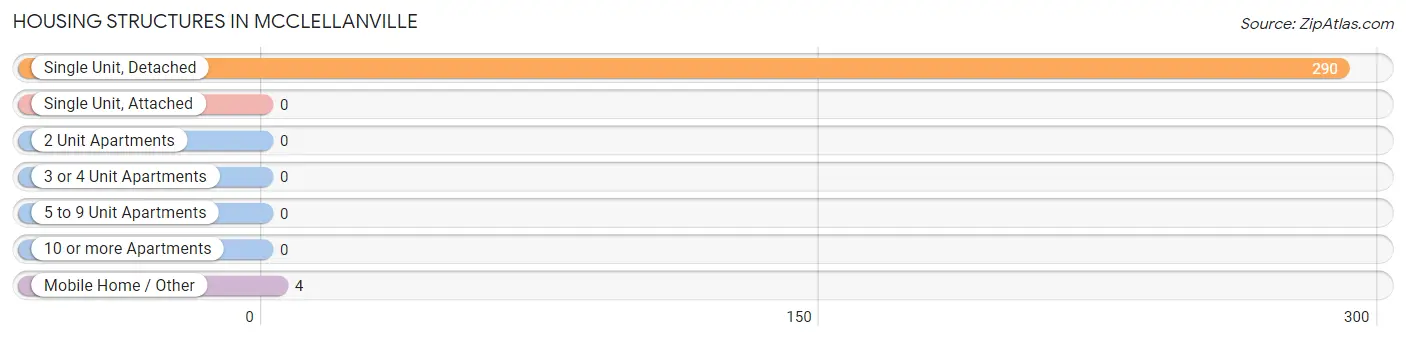
| Structure Type | # Housing Units | % Housing Units |
| Single Unit, Detached | 290 | 98.6% |
| Single Unit, Attached | 0 | 0.0% |
| 2 Unit Apartments | 0 | 0.0% |
| 3 or 4 Unit Apartments | 0 | 0.0% |
| 5 to 9 Unit Apartments | 0 | 0.0% |
| 10 or more Apartments | 0 | 0.0% |
| Mobile Home / Other | 4 | 1.4% |
| Total | 294 | 100.0% |
Housing Structures by Occupancy in McClellanville
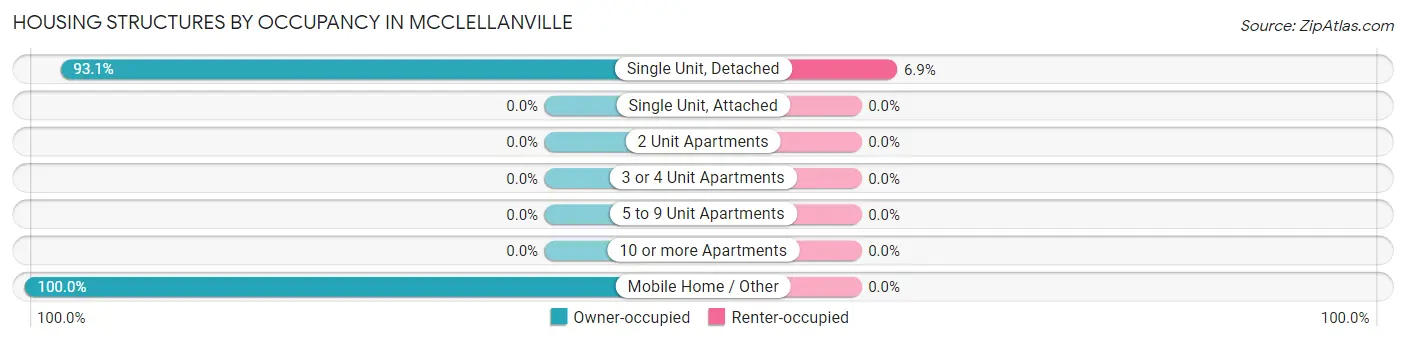
| Structure Type | Owner-occupied | Renter-occupied |
| Single Unit, Detached | 270 (93.1%) | 20 (6.9%) |
| Single Unit, Attached | 0 (0.0%) | 0 (0.0%) |
| 2 Unit Apartments | 0 (0.0%) | 0 (0.0%) |
| 3 or 4 Unit Apartments | 0 (0.0%) | 0 (0.0%) |
| 5 to 9 Unit Apartments | 0 (0.0%) | 0 (0.0%) |
| 10 or more Apartments | 0 (0.0%) | 0 (0.0%) |
| Mobile Home / Other | 4 (100.0%) | 0 (0.0%) |
| Total | 274 (93.2%) | 20 (6.8%) |
Housing Structures by Number of Rooms in McClellanville
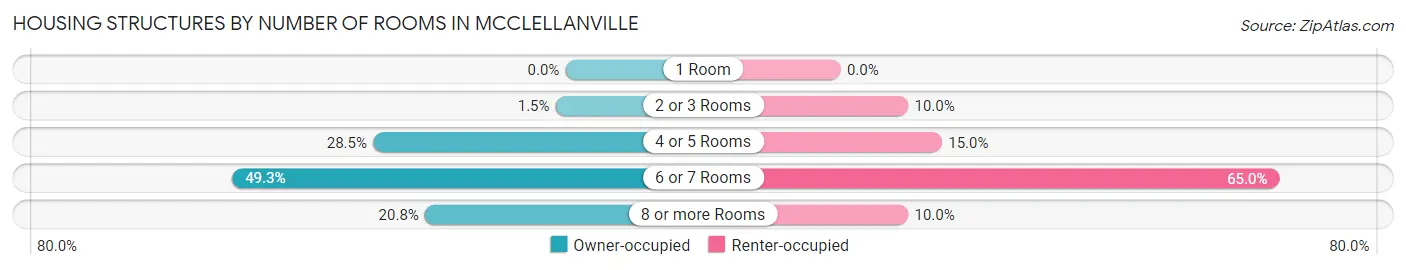
| Number of Rooms | Owner-occupied | Renter-occupied |
| 1 Room | 0 (0.0%) | 0 (0.0%) |
| 2 or 3 Rooms | 4 (1.5%) | 2 (10.0%) |
| 4 or 5 Rooms | 78 (28.5%) | 3 (15.0%) |
| 6 or 7 Rooms | 135 (49.3%) | 13 (65.0%) |
| 8 or more Rooms | 57 (20.8%) | 2 (10.0%) |
| Total | 274 (100.0%) | 20 (100.0%) |
Housing Structure by Heating Type in McClellanville
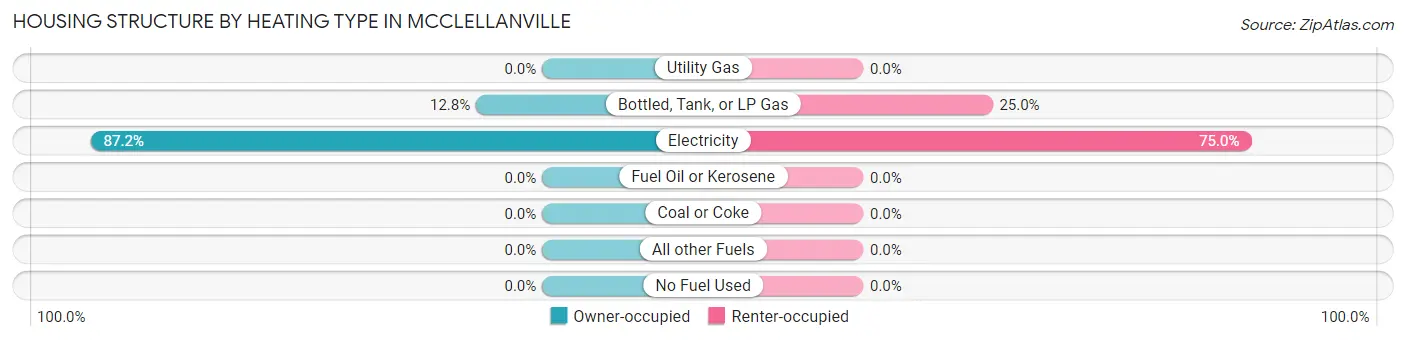
| Heating Type | Owner-occupied | Renter-occupied |
| Utility Gas | 0 (0.0%) | 0 (0.0%) |
| Bottled, Tank, or LP Gas | 35 (12.8%) | 5 (25.0%) |
| Electricity | 239 (87.2%) | 15 (75.0%) |
| Fuel Oil or Kerosene | 0 (0.0%) | 0 (0.0%) |
| Coal or Coke | 0 (0.0%) | 0 (0.0%) |
| All other Fuels | 0 (0.0%) | 0 (0.0%) |
| No Fuel Used | 0 (0.0%) | 0 (0.0%) |
| Total | 274 (100.0%) | 20 (100.0%) |
Household Vehicle Usage in McClellanville
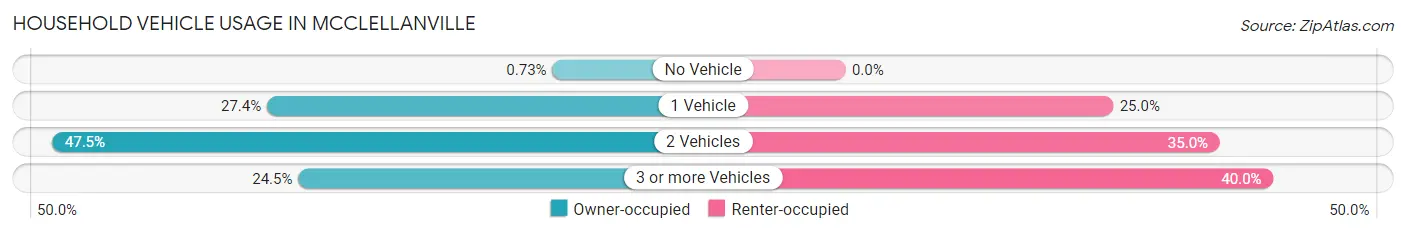
| Vehicles per Household | Owner-occupied | Renter-occupied |
| No Vehicle | 2 (0.7%) | 0 (0.0%) |
| 1 Vehicle | 75 (27.4%) | 5 (25.0%) |
| 2 Vehicles | 130 (47.4%) | 7 (35.0%) |
| 3 or more Vehicles | 67 (24.4%) | 8 (40.0%) |
| Total | 274 (100.0%) | 20 (100.0%) |
Real Estate & Mortgages in McClellanville
Real Estate and Mortgage Overview in McClellanville
| Characteristic | Without Mortgage | With Mortgage |
| Housing Units | 112 | 162 |
| Median Property Value | $368,400 | $497,000 |
| Median Household Income | $66,250 | $65 |
| Monthly Housing Costs | $577 | $29 |
| Real Estate Taxes | $1,532 | $3 |
Property Value by Mortgage Status in McClellanville
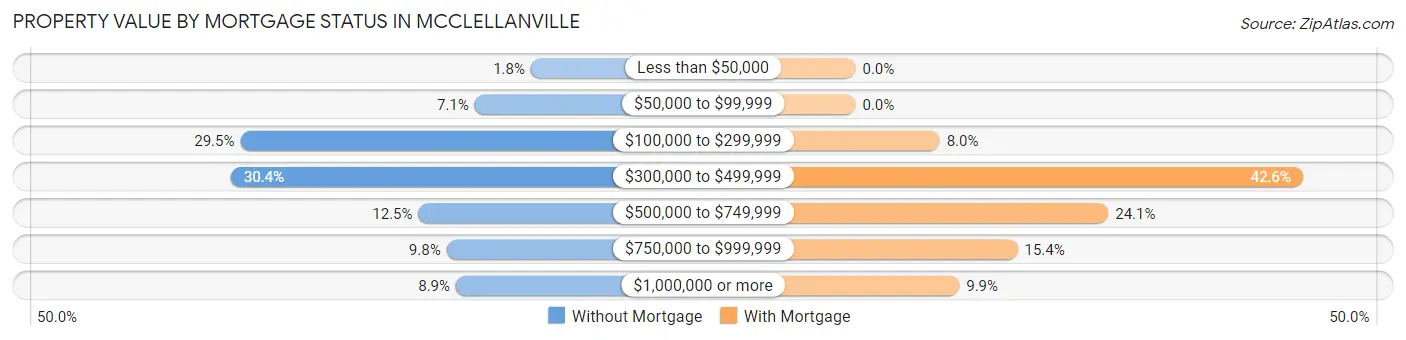
| Property Value | Without Mortgage | With Mortgage |
| Less than $50,000 | 2 (1.8%) | 0 (0.0%) |
| $50,000 to $99,999 | 8 (7.1%) | 0 (0.0%) |
| $100,000 to $299,999 | 33 (29.5%) | 13 (8.0%) |
| $300,000 to $499,999 | 34 (30.4%) | 69 (42.6%) |
| $500,000 to $749,999 | 14 (12.5%) | 39 (24.1%) |
| $750,000 to $999,999 | 11 (9.8%) | 25 (15.4%) |
| $1,000,000 or more | 10 (8.9%) | 16 (9.9%) |
| Total | 112 (100.0%) | 162 (100.0%) |
Household Income by Mortgage Status in McClellanville
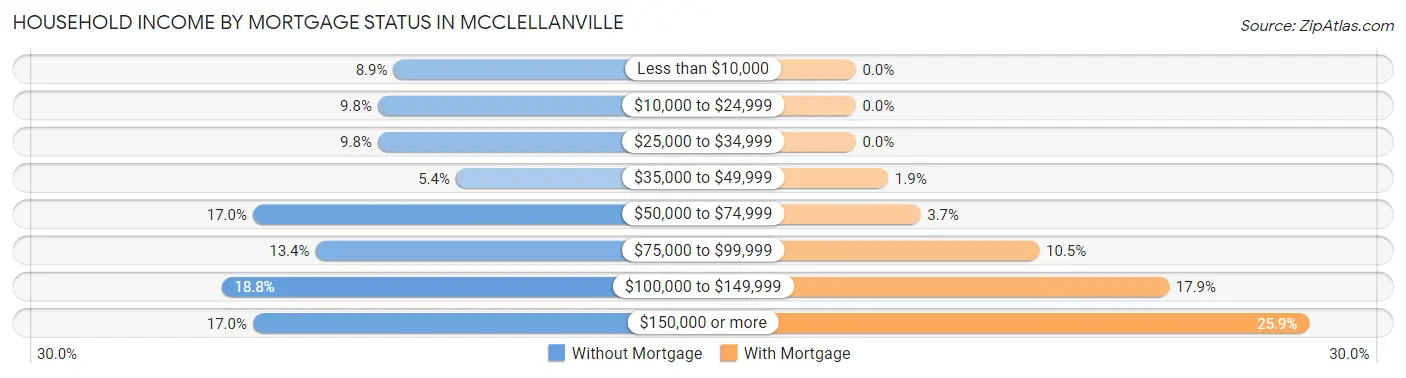
| Household Income | Without Mortgage | With Mortgage |
| Less than $10,000 | 10 (8.9%) | 0 (0.0%) |
| $10,000 to $24,999 | 11 (9.8%) | 0 (0.0%) |
| $25,000 to $34,999 | 11 (9.8%) | 0 (0.0%) |
| $35,000 to $49,999 | 6 (5.4%) | 3 (1.8%) |
| $50,000 to $74,999 | 19 (17.0%) | 6 (3.7%) |
| $75,000 to $99,999 | 15 (13.4%) | 17 (10.5%) |
| $100,000 to $149,999 | 21 (18.8%) | 29 (17.9%) |
| $150,000 or more | 19 (17.0%) | 42 (25.9%) |
| Total | 112 (100.0%) | 162 (100.0%) |
Property Value to Household Income Ratio in McClellanville
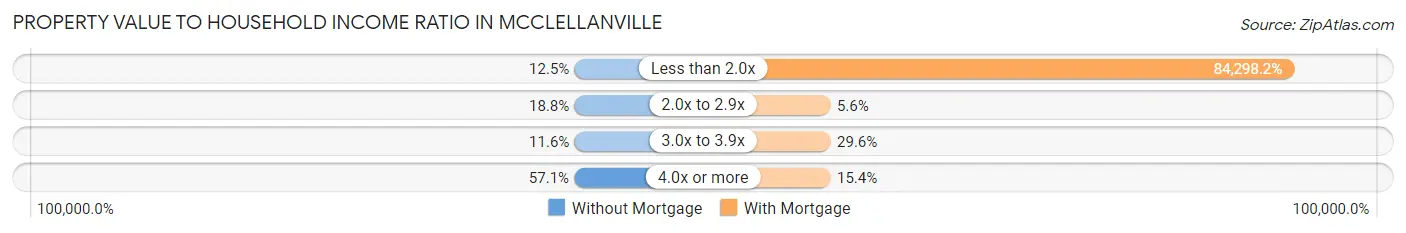
| Value-to-Income Ratio | Without Mortgage | With Mortgage |
| Less than 2.0x | 14 (12.5%) | 136,563 (84,298.1%) |
| 2.0x to 2.9x | 21 (18.8%) | 9 (5.6%) |
| 3.0x to 3.9x | 13 (11.6%) | 48 (29.6%) |
| 4.0x or more | 64 (57.1%) | 25 (15.4%) |
| Total | 112 (100.0%) | 162 (100.0%) |
Real Estate Taxes by Mortgage Status in McClellanville
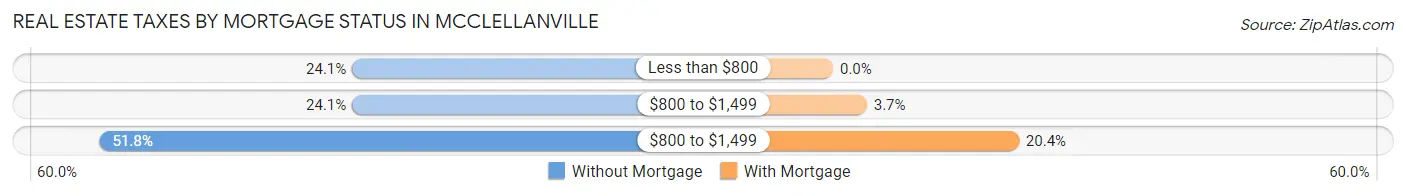
| Property Taxes | Without Mortgage | With Mortgage |
| Less than $800 | 27 (24.1%) | 0 (0.0%) |
| $800 to $1,499 | 27 (24.1%) | 6 (3.7%) |
| $800 to $1,499 | 58 (51.8%) | 33 (20.4%) |
| Total | 112 (100.0%) | 162 (100.0%) |
Health & Disability in McClellanville
Health Insurance Coverage by Age in McClellanville
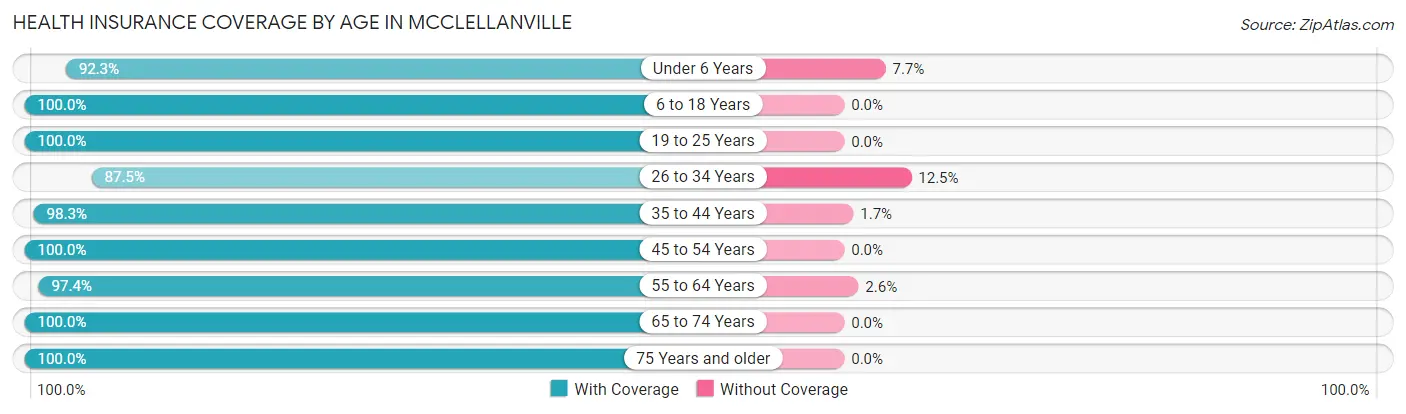
| Age Bracket | With Coverage | Without Coverage |
| Under 6 Years | 36 (92.3%) | 3 (7.7%) |
| 6 to 18 Years | 206 (100.0%) | 0 (0.0%) |
| 19 to 25 Years | 10 (100.0%) | 0 (0.0%) |
| 26 to 34 Years | 28 (87.5%) | 4 (12.5%) |
| 35 to 44 Years | 116 (98.3%) | 2 (1.7%) |
| 45 to 54 Years | 67 (100.0%) | 0 (0.0%) |
| 55 to 64 Years | 111 (97.4%) | 3 (2.6%) |
| 65 to 74 Years | 99 (100.0%) | 0 (0.0%) |
| 75 Years and older | 85 (100.0%) | 0 (0.0%) |
| Total | 758 (98.4%) | 12 (1.6%) |
Health Insurance Coverage by Citizenship Status in McClellanville
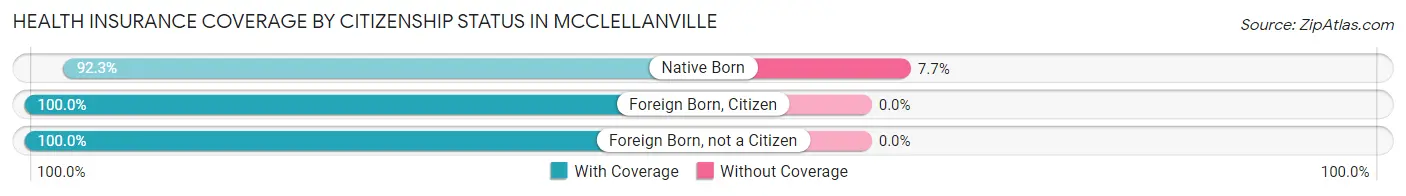
| Citizenship Status | With Coverage | Without Coverage |
| Native Born | 36 (92.3%) | 3 (7.7%) |
| Foreign Born, Citizen | 206 (100.0%) | 0 (0.0%) |
| Foreign Born, not a Citizen | 10 (100.0%) | 0 (0.0%) |
Health Insurance Coverage by Household Income in McClellanville
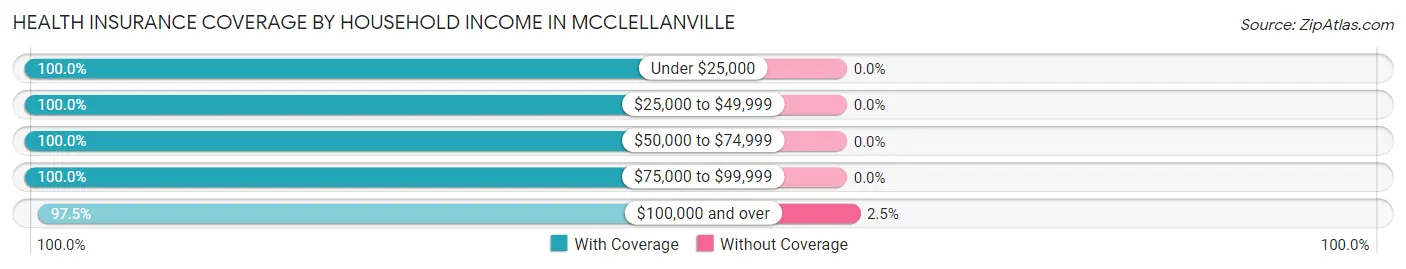
| Household Income | With Coverage | Without Coverage |
| Under $25,000 | 61 (100.0%) | 0 (0.0%) |
| $25,000 to $49,999 | 59 (100.0%) | 0 (0.0%) |
| $50,000 to $74,999 | 46 (100.0%) | 0 (0.0%) |
| $75,000 to $99,999 | 120 (100.0%) | 0 (0.0%) |
| $100,000 and over | 472 (97.5%) | 12 (2.5%) |
Public vs Private Health Insurance Coverage by Age in McClellanville
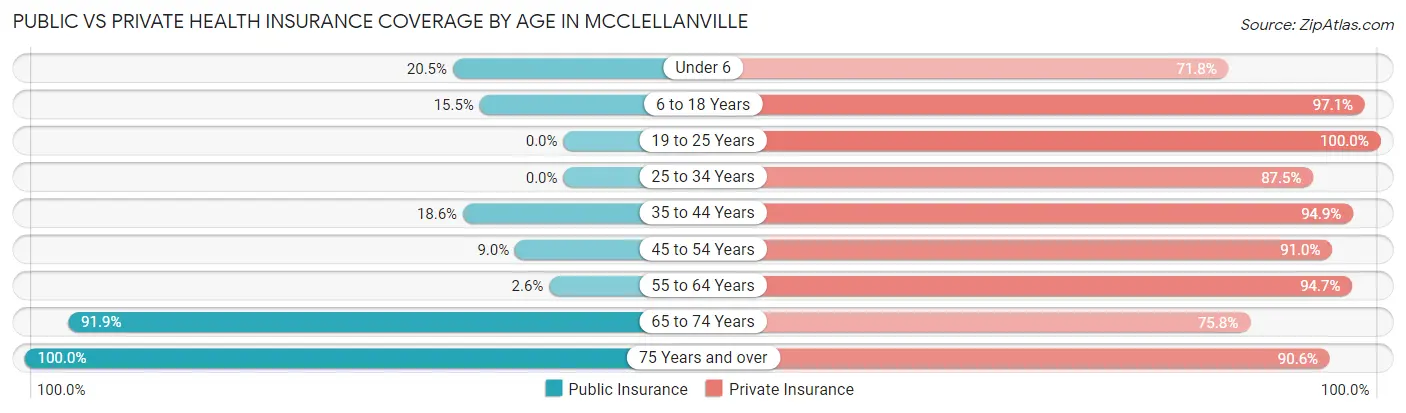
| Age Bracket | Public Insurance | Private Insurance |
| Under 6 | 8 (20.5%) | 28 (71.8%) |
| 6 to 18 Years | 32 (15.5%) | 200 (97.1%) |
| 19 to 25 Years | 0 (0.0%) | 10 (100.0%) |
| 25 to 34 Years | 0 (0.0%) | 28 (87.5%) |
| 35 to 44 Years | 22 (18.6%) | 112 (94.9%) |
| 45 to 54 Years | 6 (9.0%) | 61 (91.0%) |
| 55 to 64 Years | 3 (2.6%) | 108 (94.7%) |
| 65 to 74 Years | 91 (91.9%) | 75 (75.8%) |
| 75 Years and over | 85 (100.0%) | 77 (90.6%) |
| Total | 247 (32.1%) | 699 (90.8%) |
Disability Status by Sex by Age in McClellanville
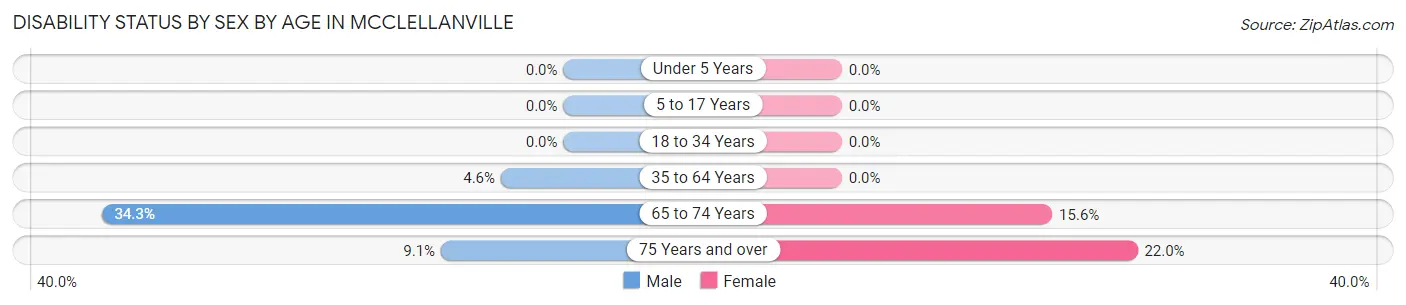
| Age Bracket | Male | Female |
| Under 5 Years | 0 (0.0%) | 0 (0.0%) |
| 5 to 17 Years | 0 (0.0%) | 0 (0.0%) |
| 18 to 34 Years | 0 (0.0%) | 0 (0.0%) |
| 35 to 64 Years | 7 (4.6%) | 0 (0.0%) |
| 65 to 74 Years | 12 (34.3%) | 10 (15.6%) |
| 75 Years and over | 4 (9.1%) | 9 (22.0%) |
Disability Class by Sex by Age in McClellanville
Disability Class: Hearing Difficulty
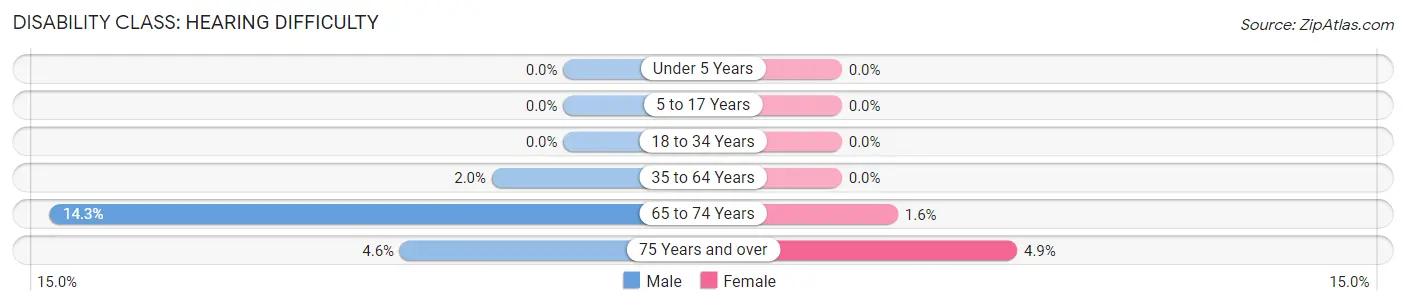
| Age Bracket | Male | Female |
| Under 5 Years | 0 (0.0%) | 0 (0.0%) |
| 5 to 17 Years | 0 (0.0%) | 0 (0.0%) |
| 18 to 34 Years | 0 (0.0%) | 0 (0.0%) |
| 35 to 64 Years | 3 (2.0%) | 0 (0.0%) |
| 65 to 74 Years | 5 (14.3%) | 1 (1.6%) |
| 75 Years and over | 2 (4.5%) | 2 (4.9%) |
Disability Class: Vision Difficulty
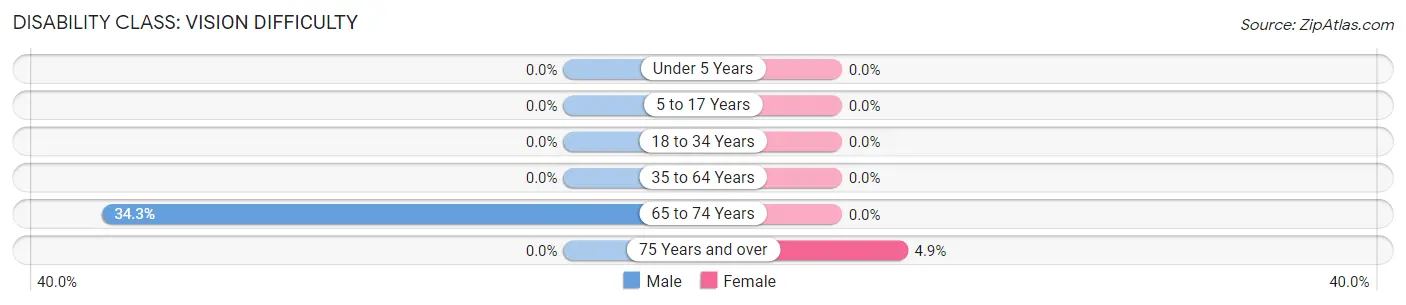
| Age Bracket | Male | Female |
| Under 5 Years | 0 (0.0%) | 0 (0.0%) |
| 5 to 17 Years | 0 (0.0%) | 0 (0.0%) |
| 18 to 34 Years | 0 (0.0%) | 0 (0.0%) |
| 35 to 64 Years | 0 (0.0%) | 0 (0.0%) |
| 65 to 74 Years | 12 (34.3%) | 0 (0.0%) |
| 75 Years and over | 0 (0.0%) | 2 (4.9%) |
Disability Class: Cognitive Difficulty
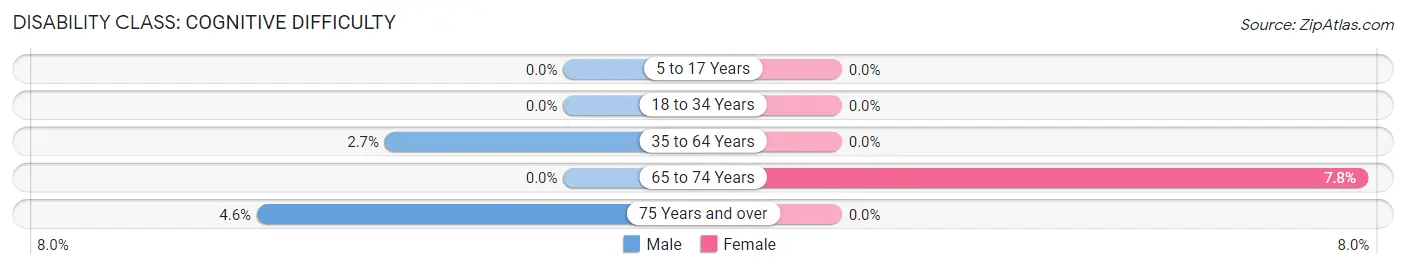
| Age Bracket | Male | Female |
| 5 to 17 Years | 0 (0.0%) | 0 (0.0%) |
| 18 to 34 Years | 0 (0.0%) | 0 (0.0%) |
| 35 to 64 Years | 4 (2.6%) | 0 (0.0%) |
| 65 to 74 Years | 0 (0.0%) | 5 (7.8%) |
| 75 Years and over | 2 (4.5%) | 0 (0.0%) |
Disability Class: Ambulatory Difficulty
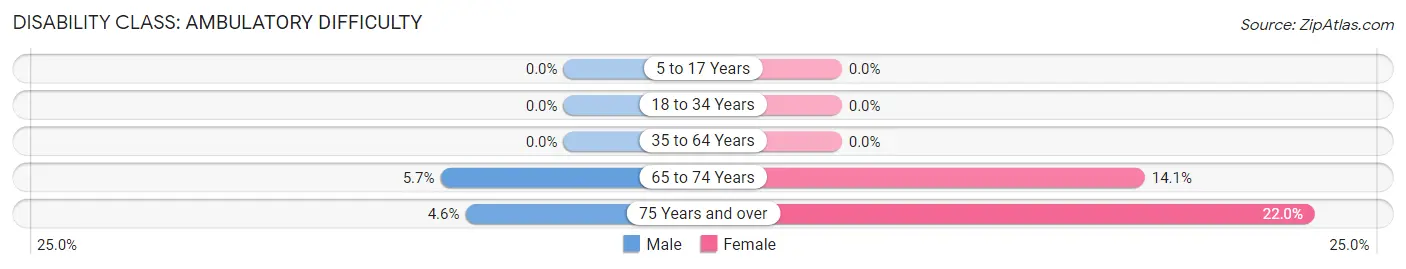
| Age Bracket | Male | Female |
| 5 to 17 Years | 0 (0.0%) | 0 (0.0%) |
| 18 to 34 Years | 0 (0.0%) | 0 (0.0%) |
| 35 to 64 Years | 0 (0.0%) | 0 (0.0%) |
| 65 to 74 Years | 2 (5.7%) | 9 (14.1%) |
| 75 Years and over | 2 (4.5%) | 9 (22.0%) |
Disability Class: Self-Care Difficulty
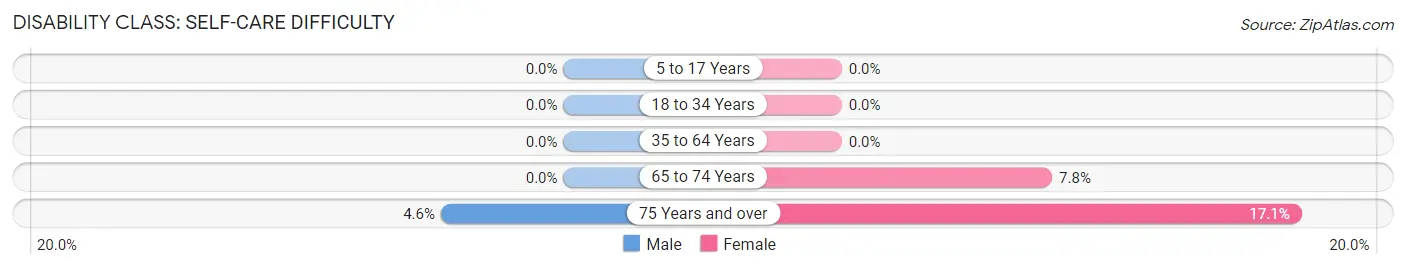
| Age Bracket | Male | Female |
| 5 to 17 Years | 0 (0.0%) | 0 (0.0%) |
| 18 to 34 Years | 0 (0.0%) | 0 (0.0%) |
| 35 to 64 Years | 0 (0.0%) | 0 (0.0%) |
| 65 to 74 Years | 0 (0.0%) | 5 (7.8%) |
| 75 Years and over | 2 (4.5%) | 7 (17.1%) |
Technology Access in McClellanville
Computing Device Access in McClellanville
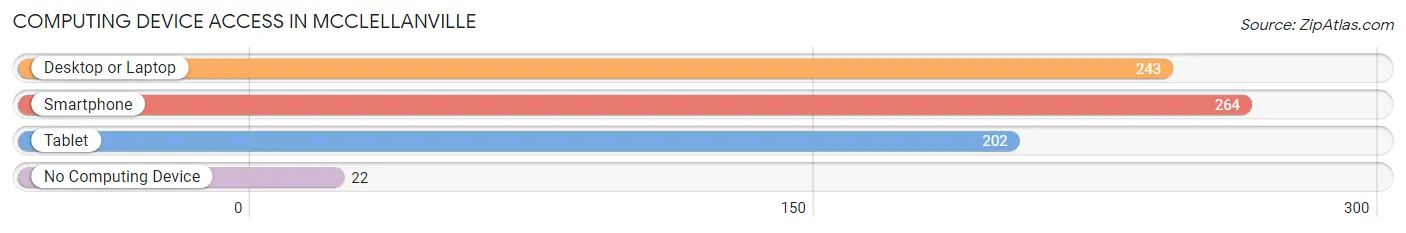
| Device Type | # Households | % Households |
| Desktop or Laptop | 243 | 82.7% |
| Smartphone | 264 | 89.8% |
| Tablet | 202 | 68.7% |
| No Computing Device | 22 | 7.5% |
| Total | 294 | 100.0% |
Internet Access in McClellanville
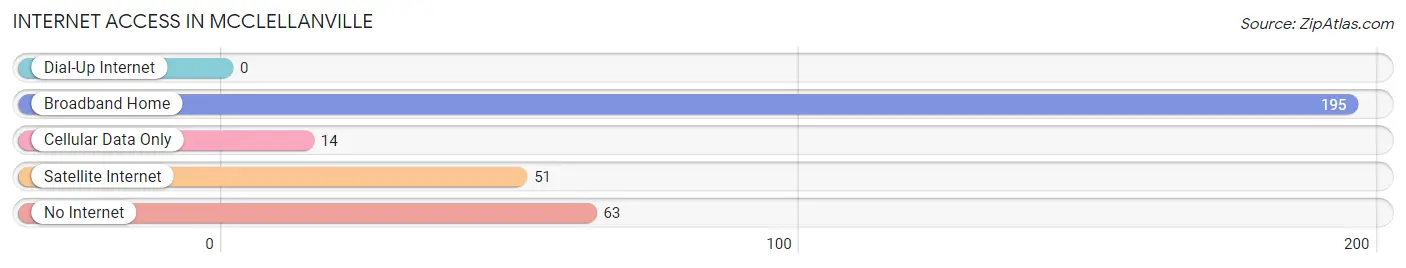
| Internet Type | # Households | % Households |
| Dial-Up Internet | 0 | 0.0% |
| Broadband Home | 195 | 66.3% |
| Cellular Data Only | 14 | 4.8% |
| Satellite Internet | 51 | 17.3% |
| No Internet | 63 | 21.4% |
| Total | 294 | 100.0% |
McClellanville Summary
Mcclellanville is a small town located in Charleston County, South Carolina. It is situated on the banks of the Intracoastal Waterway, approximately 40 miles north of Charleston. The town was founded in 1883 by Captain John Mcclellan, a former Confederate soldier, and is named after him. The town has a population of approximately 500 people and is known for its historic architecture, fishing, and seafood.
History
Mcclellanville was founded in 1883 by Captain John Mcclellan, a former Confederate soldier. He purchased the land from the local Native Americans and named the town after himself. The town was originally a fishing village and was home to many shrimpers and oystermen. In the late 19th century, the town became a popular destination for wealthy Charlestonians who wanted to escape the summer heat. The town was also home to a number of wealthy plantation owners who built large homes in the area.
In the early 20th century, the town experienced a period of decline as the fishing industry declined and the wealthy residents moved away. However, in the late 20th century, the town experienced a resurgence as it became a popular tourist destination. The town is now home to a number of restaurants, shops, and galleries.
Geography
Mcclellanville is located in Charleston County, South Carolina. It is situated on the banks of the Intracoastal Waterway, approximately 40 miles north of Charleston. The town is surrounded by marshlands and is home to a number of creeks and rivers. The town is also home to a number of historic buildings, including the Mcclellanville Presbyterian Church, which was built in 1883.
Economy
Mcclellanville’s economy is largely based on tourism and fishing. The town is home to a number of restaurants, shops, and galleries that cater to tourists. The town is also home to a number of seafood restaurants that serve fresh seafood caught in the local waters. The town is also home to a number of charter fishing companies that offer deep sea fishing trips.
Demographics
Mcclellanville has a population of approximately 500 people. The town is predominantly white, with a small African American population. The median household income is $45,000 and the median home value is $150,000. The town is home to a number of churches, including the Mcclellanville Presbyterian Church, which was built in 1883.
Mcclellanville is a small town with a rich history and a unique culture. The town is home to a number of historic buildings, restaurants, shops, and galleries. The town is also home to a number of charter fishing companies that offer deep sea fishing trips. The town is predominantly white, with a small African American population. The median household income is $45,000 and the median home value is $150,000. Mcclellanville is a great place to visit and explore the history and culture of the Lowcountry.
Common Questions
What is the Total Population of McClellanville?
Total Population of McClellanville is 770.
What is the Total Male Population of McClellanville?
Total Male Population of McClellanville is 399.
What is the Total Female Population of McClellanville?
Total Female Population of McClellanville is 371.
What is the Ratio of Males per 100 Females in McClellanville?
There are 107.55 Males per 100 Females in McClellanville.
What is the Ratio of Females per 100 Males in McClellanville?
There are 92.98 Females per 100 Males in McClellanville.
What is the Median Population Age in McClellanville?
Median Population Age in McClellanville is 44.4 Years.
What is the Average Family Size in McClellanville
Average Family Size in McClellanville is 3.4 People.
What is the Average Household Size in McClellanville
Average Household Size in McClellanville is 2.6 People.
What is Per Capita Income in McClellanville?
Per Capita income in McClellanville is $50,888.
What is the Median Family Income in McClellanville?
Median Family Income in McClellanville is $137,422.
What is the Median Household income in McClellanville?
Median Household Income in McClellanville is $110,000.
What is Income or Wage Gap in McClellanville?
Income or Wage Gap in McClellanville is 47.3%.
Women in McClellanville earn 52.7 cents for every dollar earned by a man.
What is Inequality or Gini Index in McClellanville?
Inequality or Gini Index in McClellanville is 0.41.
How Large is the Labor Force in McClellanville?
There are 290 People in the Labor Forcein in McClellanville.
What is the Percentage of People in the Labor Force in McClellanville?
52.2% of People are in the Labor Force in McClellanville.
What is the Unemployment Rate in McClellanville?
Unemployment Rate in McClellanville is 1.0%.