Newport, SC
Newport Map
Newport Overview
4,226
TOTAL POPULATION
1,980
MALE POPULATION
2,246
FEMALE POPULATION
88.16
MALES / 100 FEMALES
113.43
FEMALES / 100 MALES
43.4
MEDIAN AGE
3.0
AVG FAMILY SIZE
2.5
AVG HOUSEHOLD SIZE
$44,694
PER CAPITA INCOME
$119,451
AVG FAMILY INCOME
$92,083
AVG HOUSEHOLD INCOME
36.6%
WAGE / INCOME GAP [ % ]
63.4¢/ $1
WAGE / INCOME GAP [ $ ]
0.40
INEQUALITY / GINI INDEX
2,399
LABOR FORCE [ PEOPLE ]
66.1%
PERCENT IN LABOR FORCE
0.4%
UNEMPLOYMENT RATE
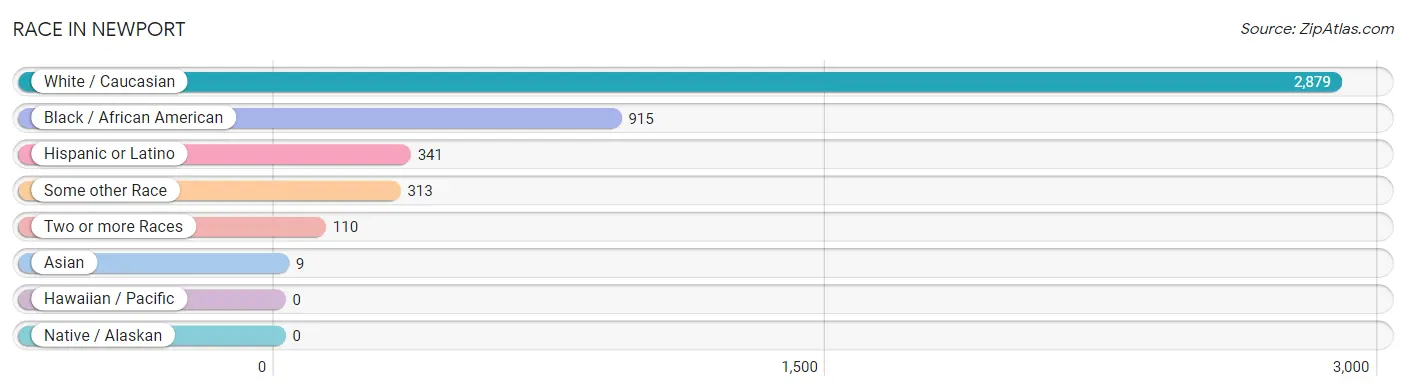
Race in Newport
The most populous races in Newport are White / Caucasian (2,879 | 68.1%), Black / African American (915 | 21.6%), and Hispanic or Latino (341 | 8.1%).
| Race | # Population | % Population |
| Asian | 9 | 0.2% |
| Black / African American | 915 | 21.6% |
| Hawaiian / Pacific | 0 | 0.0% |
| Hispanic or Latino | 341 | 8.1% |
| Native / Alaskan | 0 | 0.0% |
| White / Caucasian | 2,879 | 68.1% |
| Two or more Races | 110 | 2.6% |
| Some other Race | 313 | 7.4% |
| Total | 4,226 | 100.0% |
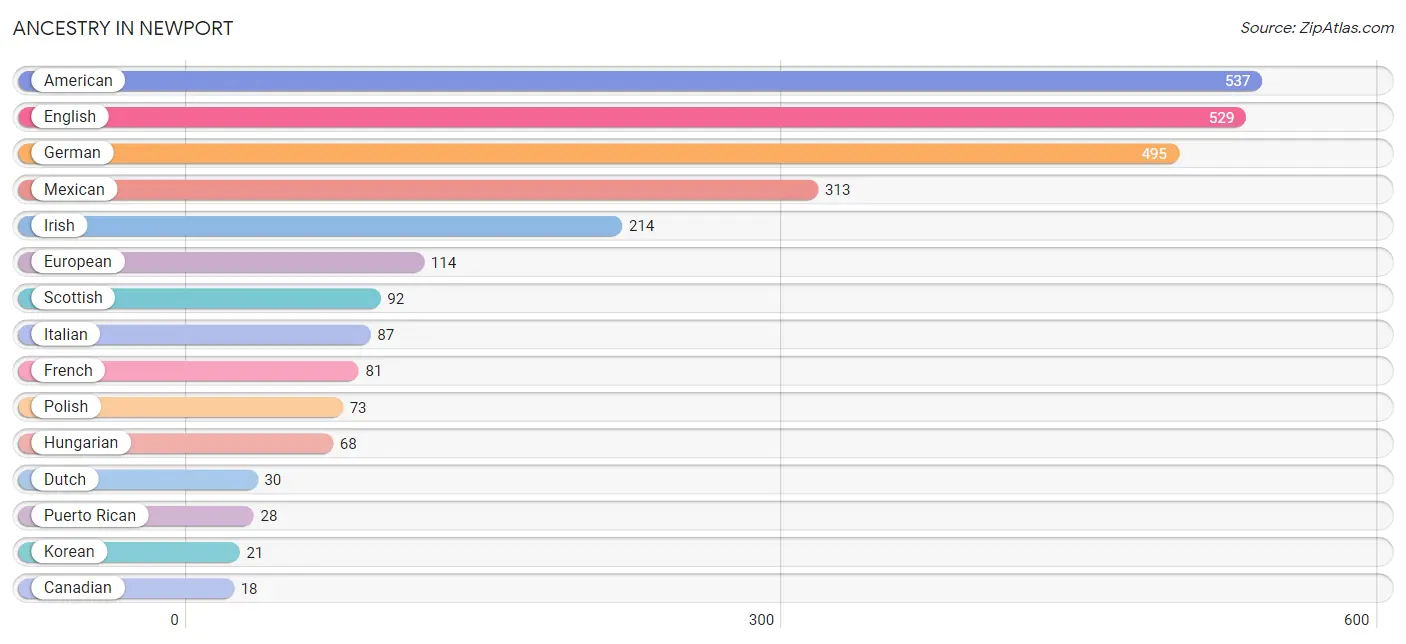
Ancestry in Newport
The most populous ancestries reported in Newport are American (537 | 12.7%), English (529 | 12.5%), German (495 | 11.7%), Mexican (313 | 7.4%), and Irish (214 | 5.1%), together accounting for 49.4% of all Newport residents.
| Ancestry | # Population | % Population |
| American | 537 | 12.7% |
| Blackfeet | 14 | 0.3% |
| Canadian | 18 | 0.4% |
| Dutch | 30 | 0.7% |
| English | 529 | 12.5% |
| European | 114 | 2.7% |
| French | 81 | 1.9% |
| French Canadian | 8 | 0.2% |
| German | 495 | 11.7% |
| Hungarian | 68 | 1.6% |
| Irish | 214 | 5.1% |
| Italian | 87 | 2.1% |
| Korean | 21 | 0.5% |
| Mexican | 313 | 7.4% |
| Norwegian | 15 | 0.4% |
| Polish | 73 | 1.7% |
| Puerto Rican | 28 | 0.7% |
| Russian | 14 | 0.3% |
| Scandinavian | 18 | 0.4% |
| Scotch-Irish | 9 | 0.2% |
| Scottish | 92 | 2.2% |
| Swedish | 17 | 0.4% |
| Swiss | 13 | 0.3% | View All 23 Rows |
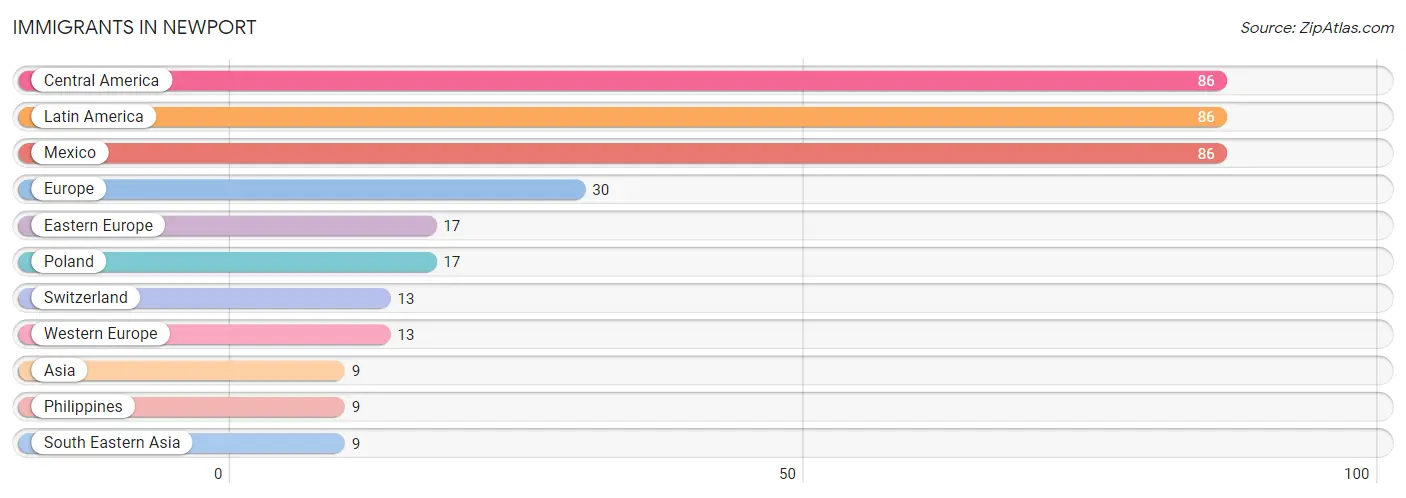
Immigrants in Newport
The most numerous immigrant groups reported in Newport came from Central America (86 | 2.0%), Latin America (86 | 2.0%), Mexico (86 | 2.0%), Europe (30 | 0.7%), and Eastern Europe (17 | 0.4%), together accounting for 7.2% of all Newport residents.
| Immigration Origin | # Population | % Population |
| Asia | 9 | 0.2% |
| Central America | 86 | 2.0% |
| Eastern Europe | 17 | 0.4% |
| Europe | 30 | 0.7% |
| Latin America | 86 | 2.0% |
| Mexico | 86 | 2.0% |
| Philippines | 9 | 0.2% |
| Poland | 17 | 0.4% |
| South Eastern Asia | 9 | 0.2% |
| Switzerland | 13 | 0.3% |
| Western Europe | 13 | 0.3% | View All 11 Rows |
Sex and Age in Newport
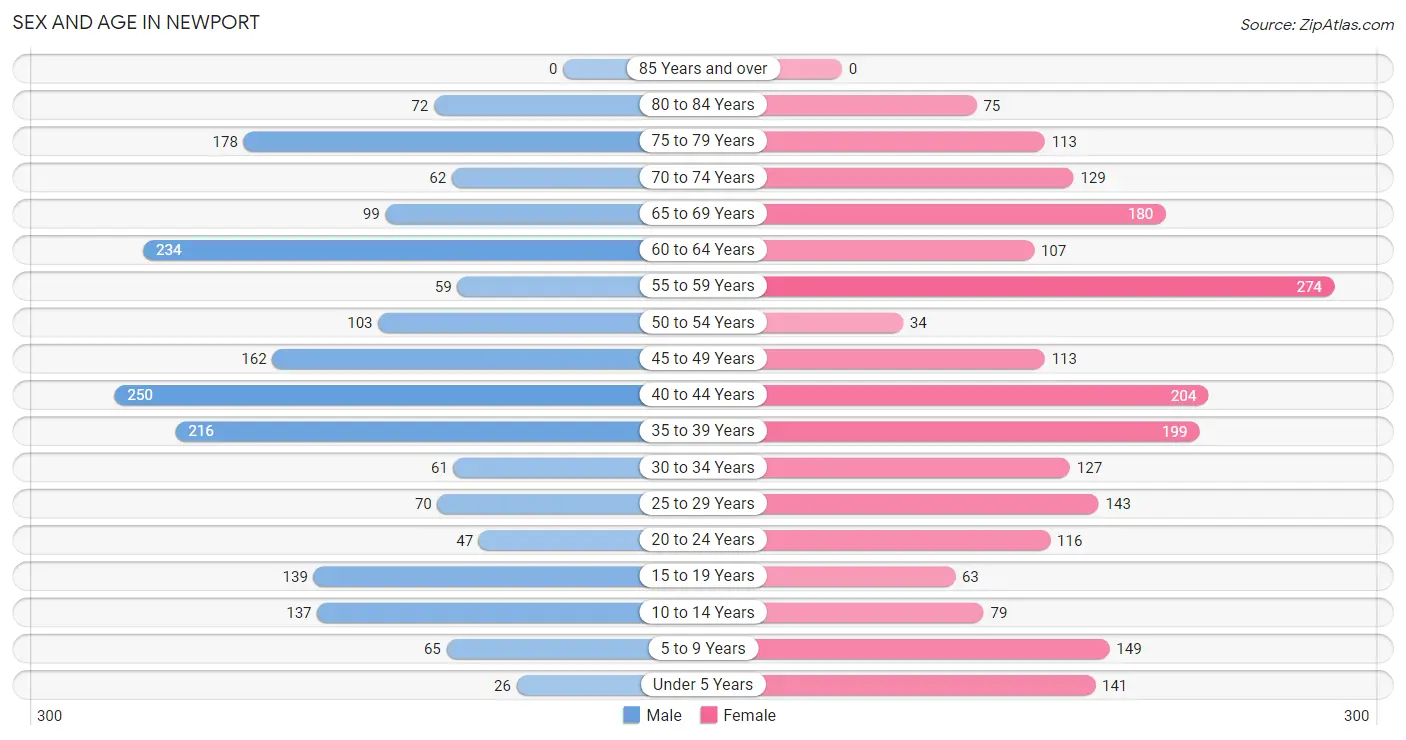
Sex and Age in Newport
The most populous age groups in Newport are 40 to 44 Years (250 | 12.6%) for men and 55 to 59 Years (274 | 12.2%) for women.
| Age Bracket | Male | Female |
| Under 5 Years | 26 (1.3%) | 141 (6.3%) |
| 5 to 9 Years | 65 (3.3%) | 149 (6.6%) |
| 10 to 14 Years | 137 (6.9%) | 79 (3.5%) |
| 15 to 19 Years | 139 (7.0%) | 63 (2.8%) |
| 20 to 24 Years | 47 (2.4%) | 116 (5.2%) |
| 25 to 29 Years | 70 (3.5%) | 143 (6.4%) |
| 30 to 34 Years | 61 (3.1%) | 127 (5.7%) |
| 35 to 39 Years | 216 (10.9%) | 199 (8.9%) |
| 40 to 44 Years | 250 (12.6%) | 204 (9.1%) |
| 45 to 49 Years | 162 (8.2%) | 113 (5.0%) |
| 50 to 54 Years | 103 (5.2%) | 34 (1.5%) |
| 55 to 59 Years | 59 (3.0%) | 274 (12.2%) |
| 60 to 64 Years | 234 (11.8%) | 107 (4.8%) |
| 65 to 69 Years | 99 (5.0%) | 180 (8.0%) |
| 70 to 74 Years | 62 (3.1%) | 129 (5.7%) |
| 75 to 79 Years | 178 (9.0%) | 113 (5.0%) |
| 80 to 84 Years | 72 (3.6%) | 75 (3.3%) |
| 85 Years and over | 0 (0.0%) | 0 (0.0%) |
| Total | 1,980 (100.0%) | 2,246 (100.0%) |
Families and Households in Newport
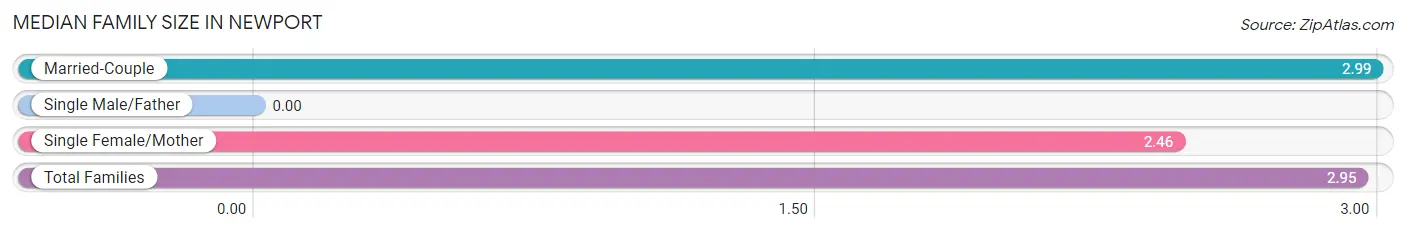
Median Family Size in Newport
| Family Type | # Families | Family Size |
| Married-Couple | 1,135 (92.1%) | 2.99 |
| Single Male/Father | 0 (0.0%) | - |
| Single Female/Mother | 97 (7.9%) | 2.46 |
| Total Families | 1,232 (100.0%) | 2.95 |
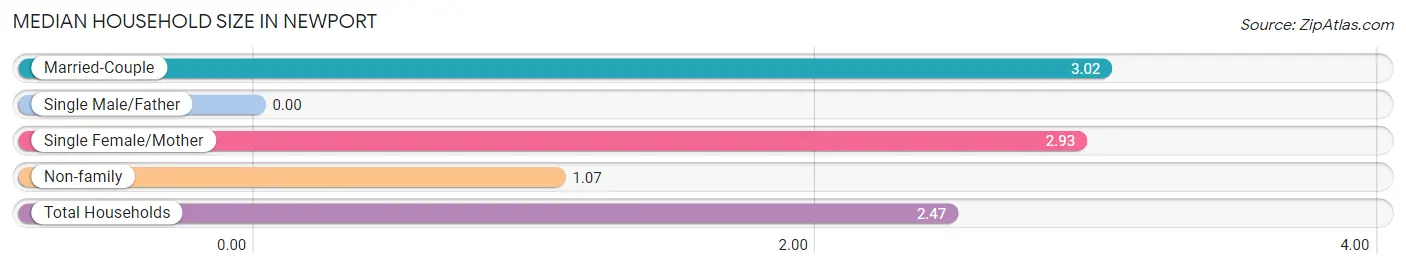
Median Household Size in Newport
| Household Type | # Households | Household Size |
| Married-Couple | 1,135 (66.5%) | 3.02 |
| Single Male/Father | 0 (0.0%) | - |
| Single Female/Mother | 97 (5.7%) | 2.93 |
| Non-family | 475 (27.8%) | 1.07 |
| Total Households | 1,707 (100.0%) | 2.47 |
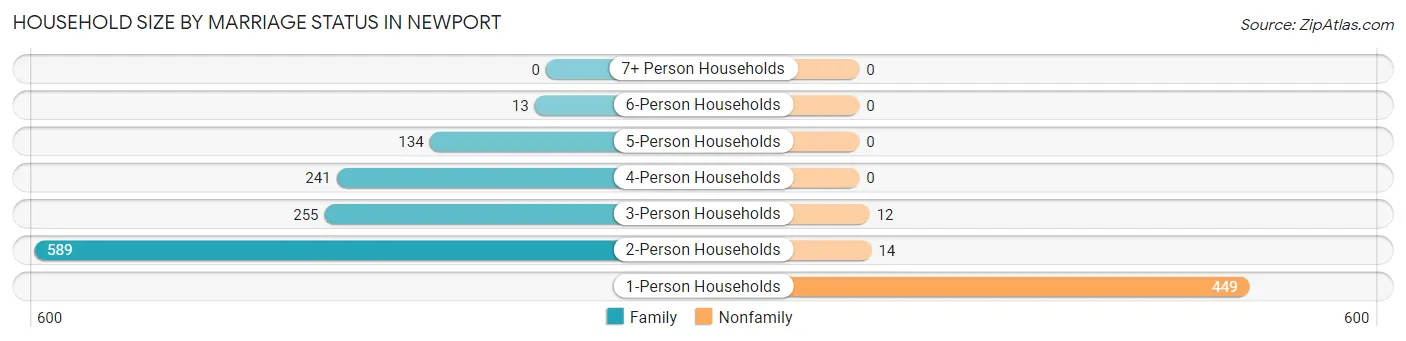
Household Size by Marriage Status in Newport
Out of a total of 1,707 households in Newport, 1,232 (72.2%) are family households, while 475 (27.8%) are nonfamily households. The most numerous type of family households are 2-person households, comprising 589, and the most common type of nonfamily households are 1-person households, comprising 449.
| Household Size | Family Households | Nonfamily Households |
| 1-Person Households | - | 449 (26.3%) |
| 2-Person Households | 589 (34.5%) | 14 (0.8%) |
| 3-Person Households | 255 (14.9%) | 12 (0.7%) |
| 4-Person Households | 241 (14.1%) | 0 (0.0%) |
| 5-Person Households | 134 (7.9%) | 0 (0.0%) |
| 6-Person Households | 13 (0.8%) | 0 (0.0%) |
| 7+ Person Households | 0 (0.0%) | 0 (0.0%) |
| Total | 1,232 (72.2%) | 475 (27.8%) |
Female Fertility in Newport
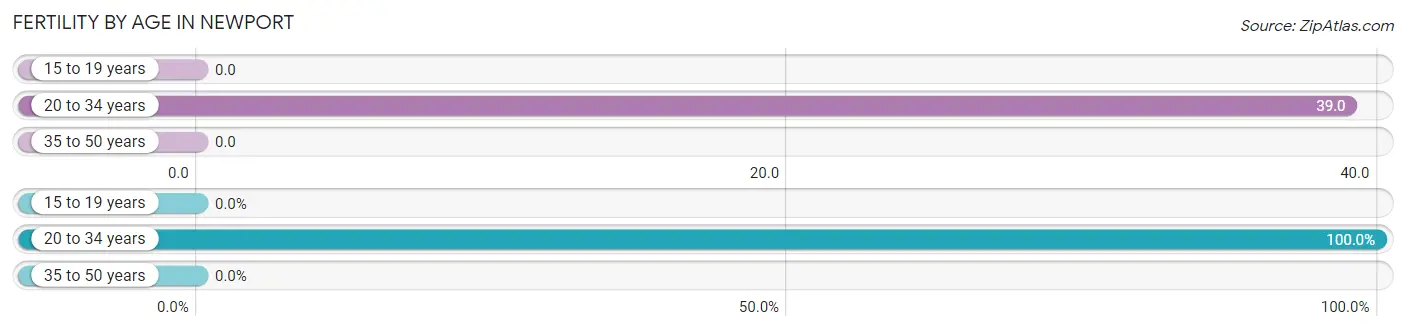
Fertility by Age in Newport
Average fertility rate in Newport is 15.0 births per 1,000 women. Women in the age bracket of 20 to 34 years have the highest fertility rate with 39.0 births per 1,000 women. Women in the age bracket of 20 to 34 years acount for 100.0% of all women with births.
| Age Bracket | Women with Births | Births / 1,000 Women |
| 15 to 19 years | 0 (0.0%) | 0.0 |
| 20 to 34 years | 15 (100.0%) | 39.0 |
| 35 to 50 years | 0 (0.0%) | 0.0 |
| Total | 15 (100.0%) | 15.0 |
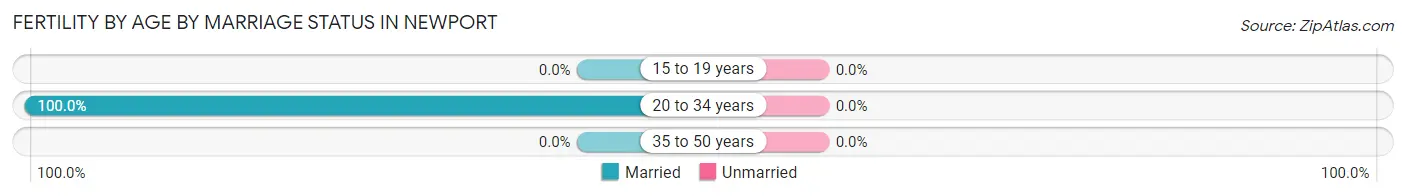
Fertility by Age by Marriage Status in Newport
| Age Bracket | Married | Unmarried |
| 15 to 19 years | 0 (0.0%) | 0 (0.0%) |
| 20 to 34 years | 15 (100.0%) | 0 (0.0%) |
| 35 to 50 years | 0 (0.0%) | 0 (0.0%) |
| Total | 15 (100.0%) | 0 (0.0%) |
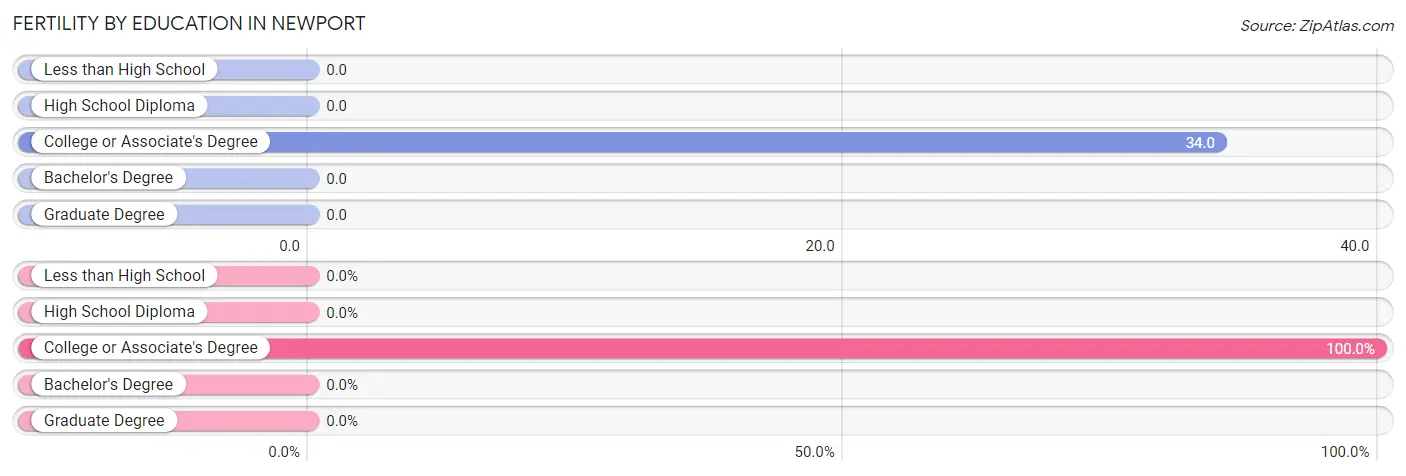
Fertility by Education in Newport
| Educational Attainment | Women with Births | Births / 1,000 Women |
| Less than High School | 0 (0.0%) | 0.0 |
| High School Diploma | 0 (0.0%) | 0.0 |
| College or Associate's Degree | 15 (100.0%) | 34.0 |
| Bachelor's Degree | 0 (0.0%) | 0.0 |
| Graduate Degree | 0 (0.0%) | 0.0 |
| Total | 15 (100.0%) | 15.0 |
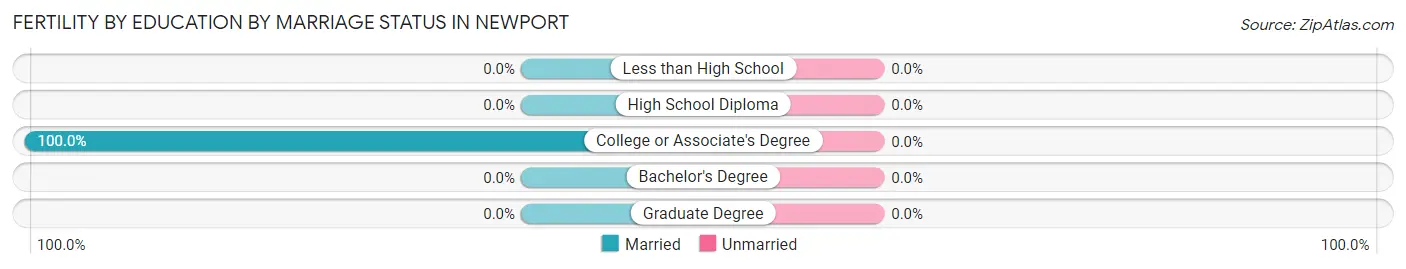
Fertility by Education by Marriage Status in Newport
| Educational Attainment | Married | Unmarried |
| Less than High School | 0 (0.0%) | 0 (0.0%) |
| High School Diploma | 0 (0.0%) | 0 (0.0%) |
| College or Associate's Degree | 15 (100.0%) | 0 (0.0%) |
| Bachelor's Degree | 0 (0.0%) | 0 (0.0%) |
| Graduate Degree | 0 (0.0%) | 0 (0.0%) |
| Total | 15 (100.0%) | 0 (0.0%) |
Income in Newport
Income Overview in Newport
Per Capita Income in Newport is $44,694, while median incomes of families and households are $119,451 and $92,083 respectively.
| Characteristic | Number | Measure |
| Per Capita Income | 4,226 | $44,694 |
| Median Family Income | 1,232 | $119,451 |
| Mean Family Income | 1,232 | $135,537 |
| Median Household Income | 1,707 | $92,083 |
| Mean Household Income | 1,707 | $110,882 |
| Income Deficit | 1,232 | $0 |
| Wage / Income Gap (%) | 4,226 | 36.56% |
| Wage / Income Gap ($) | 4,226 | 63.44¢ per $1 |
| Gini / Inequality Index | 4,226 | 0.40 |
Earnings by Sex in Newport
Average Earnings in Newport are $45,472, $60,184 for men and $38,182 for women, a difference of 36.6%.
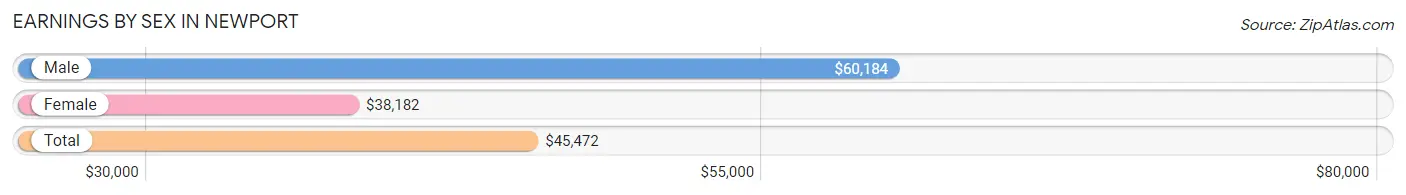
| Sex | Number | Average Earnings |
| Male | 1,299 (50.8%) | $60,184 |
| Female | 1,258 (49.2%) | $38,182 |
| Total | 2,557 (100.0%) | $45,472 |
Earnings by Sex by Income Bracket in Newport
The most common earnings brackets in Newport are $100,000+ for men (229 | 17.6%) and $65,000 to $74,999 for women (162 | 12.9%).
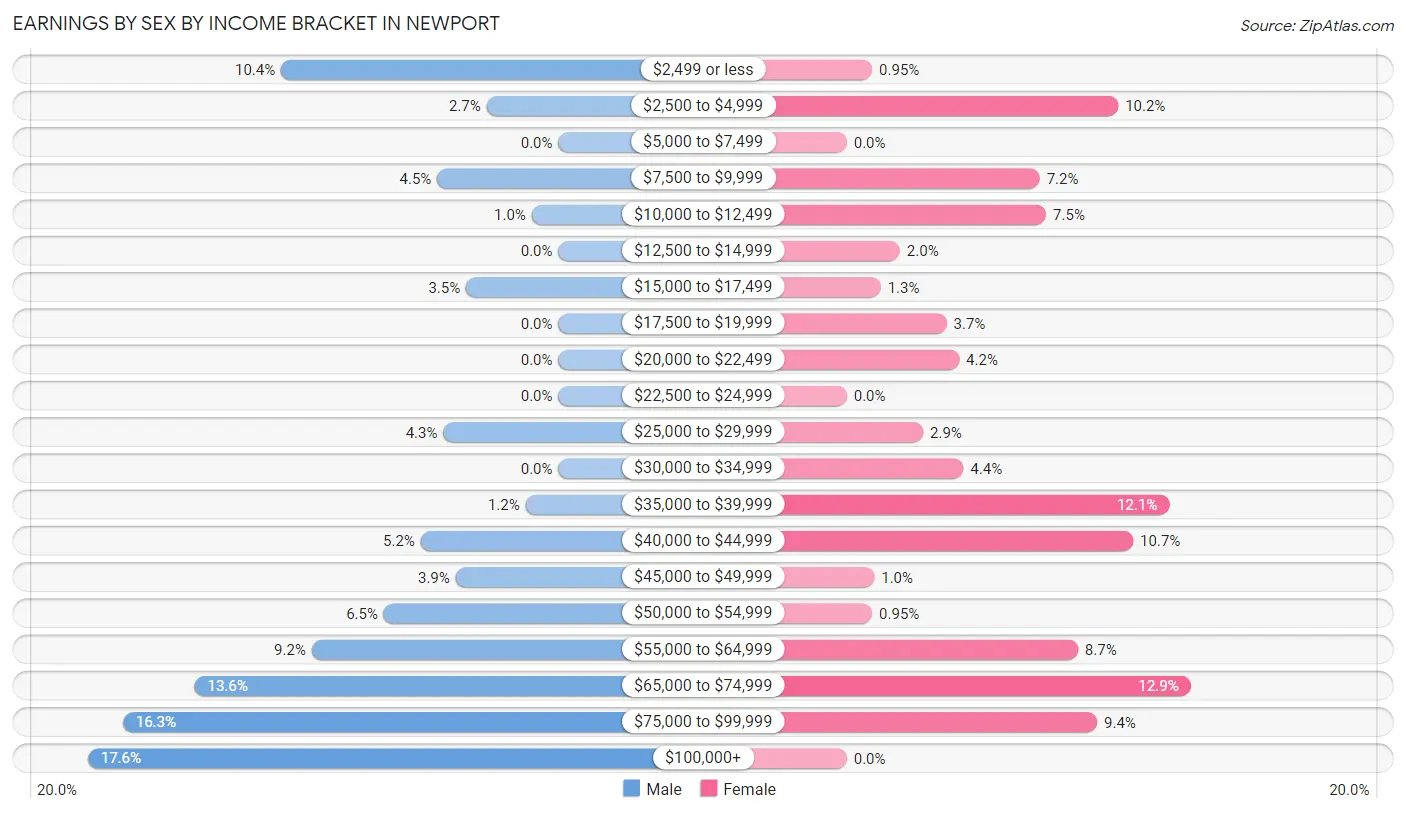
| Income | Male | Female |
| $2,499 or less | 135 (10.4%) | 12 (0.9%) |
| $2,500 to $4,999 | 35 (2.7%) | 128 (10.2%) |
| $5,000 to $7,499 | 0 (0.0%) | 0 (0.0%) |
| $7,500 to $9,999 | 59 (4.5%) | 91 (7.2%) |
| $10,000 to $12,499 | 13 (1.0%) | 94 (7.5%) |
| $12,500 to $14,999 | 0 (0.0%) | 25 (2.0%) |
| $15,000 to $17,499 | 45 (3.5%) | 16 (1.3%) |
| $17,500 to $19,999 | 0 (0.0%) | 47 (3.7%) |
| $20,000 to $22,499 | 0 (0.0%) | 53 (4.2%) |
| $22,500 to $24,999 | 0 (0.0%) | 0 (0.0%) |
| $25,000 to $29,999 | 56 (4.3%) | 36 (2.9%) |
| $30,000 to $34,999 | 0 (0.0%) | 55 (4.4%) |
| $35,000 to $39,999 | 16 (1.2%) | 152 (12.1%) |
| $40,000 to $44,999 | 67 (5.2%) | 135 (10.7%) |
| $45,000 to $49,999 | 50 (3.8%) | 13 (1.0%) |
| $50,000 to $54,999 | 85 (6.5%) | 12 (0.9%) |
| $55,000 to $64,999 | 120 (9.2%) | 109 (8.7%) |
| $65,000 to $74,999 | 177 (13.6%) | 162 (12.9%) |
| $75,000 to $99,999 | 212 (16.3%) | 118 (9.4%) |
| $100,000+ | 229 (17.6%) | 0 (0.0%) |
| Total | 1,299 (100.0%) | 1,258 (100.0%) |
Earnings by Sex by Educational Attainment in Newport
Average earnings in Newport are $70,917 for men and $40,074 for women, a difference of 43.5%. Men with an educational attainment of graduate degree enjoy the highest average annual earnings of $83,077, while those with high school diploma education earn the least with $41,406. Women with an educational attainment of bachelor's degree earn the most with the average annual earnings of $61,354, while those with college or associate's degree education have the smallest earnings of $34,509.
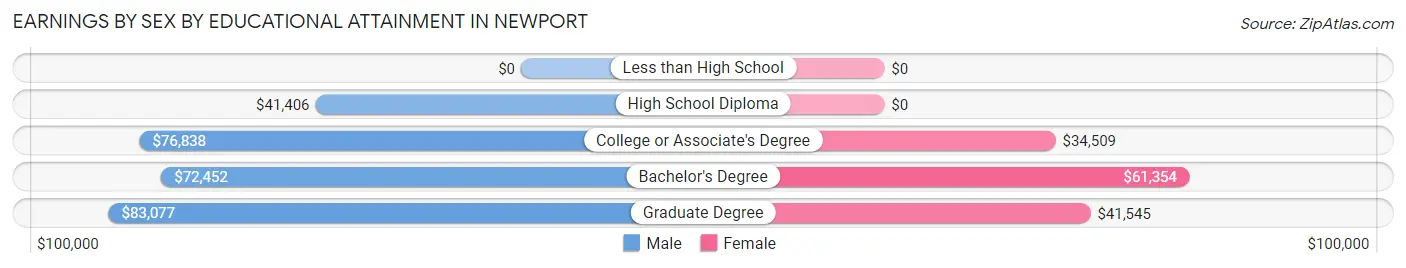
| Educational Attainment | Male Income | Female Income |
| Less than High School | - | - |
| High School Diploma | $41,406 | $0 |
| College or Associate's Degree | $76,838 | $34,509 |
| Bachelor's Degree | $72,452 | $61,354 |
| Graduate Degree | $83,077 | $41,545 |
| Total | $70,917 | $40,074 |
Family Income in Newport
Family Income Brackets in Newport
According to the Newport family income data, there are 394 families falling into the $100,000 to $149,999 income range, which is the most common income bracket and makes up 32.0% of all families.
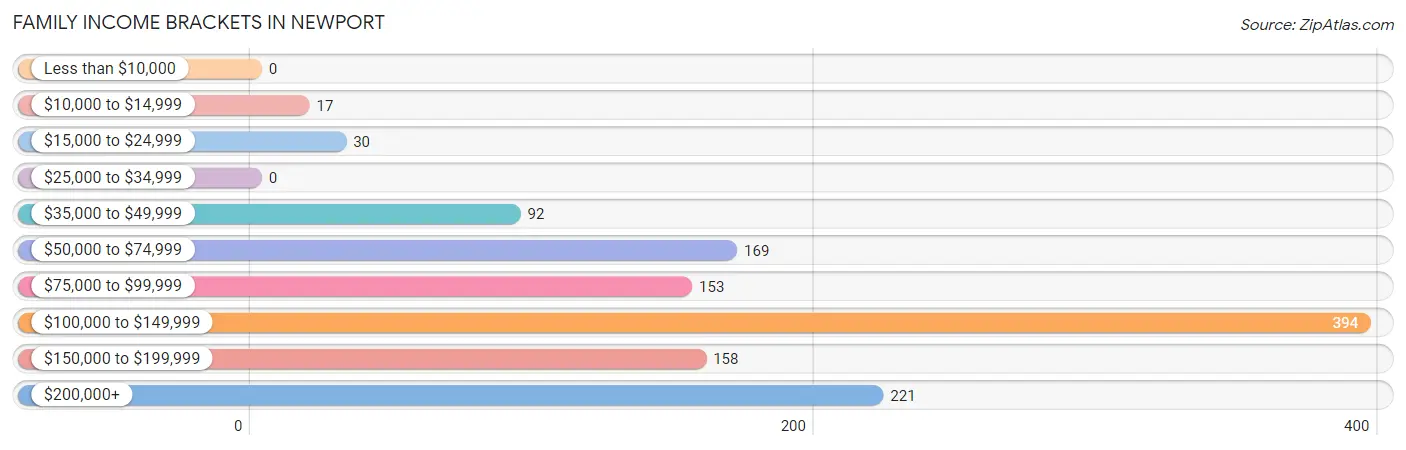
| Income Bracket | # Families | % Families |
| Less than $10,000 | 0 | 0.0% |
| $10,000 to $14,999 | 17 | 1.4% |
| $15,000 to $24,999 | 30 | 2.4% |
| $25,000 to $34,999 | 0 | 0.0% |
| $35,000 to $49,999 | 92 | 7.5% |
| $50,000 to $74,999 | 169 | 13.7% |
| $75,000 to $99,999 | 153 | 12.4% |
| $100,000 to $149,999 | 394 | 32.0% |
| $150,000 to $199,999 | 158 | 12.8% |
| $200,000+ | 221 | 17.9% |
Family Income by Famaliy Size in Newport
3-person families (296 | 24.0%) account for the highest median family income in Newport with $134,127 per family, while 2-person families (604 | 49.0%) have the highest median income of $57,443 per family member.
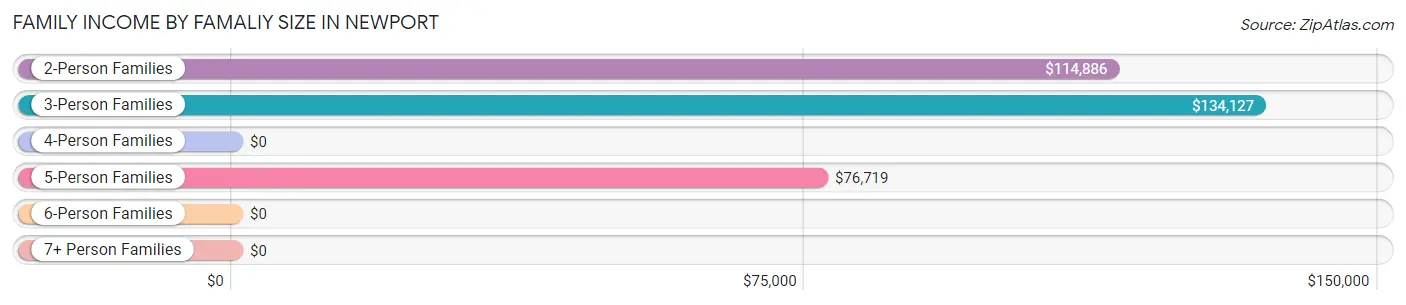
| Income Bracket | # Families | Median Income |
| 2-Person Families | 604 (49.0%) | $114,886 |
| 3-Person Families | 296 (24.0%) | $134,127 |
| 4-Person Families | 185 (15.0%) | $0 |
| 5-Person Families | 134 (10.9%) | $76,719 |
| 6-Person Families | 13 (1.1%) | $0 |
| 7+ Person Families | 0 (0.0%) | $0 |
| Total | 1,232 (100.0%) | $119,451 |
Family Income by Number of Earners in Newport
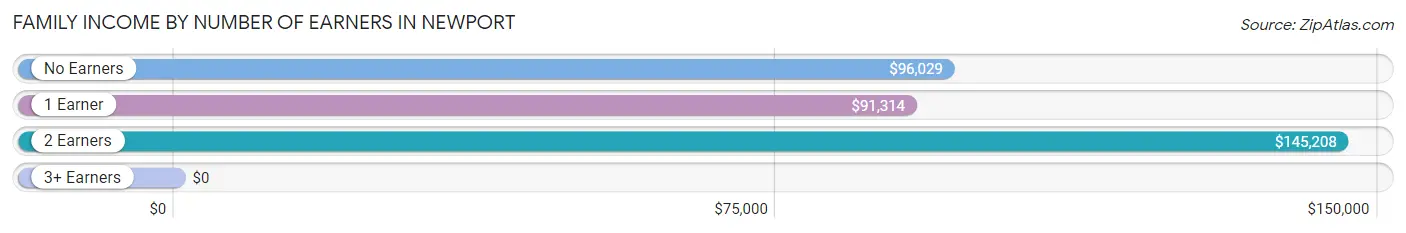
| Number of Earners | # Families | Median Income |
| No Earners | 186 (15.1%) | $96,029 |
| 1 Earner | 201 (16.3%) | $91,314 |
| 2 Earners | 679 (55.1%) | $145,208 |
| 3+ Earners | 166 (13.5%) | $0 |
| Total | 1,232 (100.0%) | $119,451 |
Household Income in Newport
Household Income Brackets in Newport
With 410 households falling in the category, the $100,000 to $149,999 income range is the most frequent in Newport, accounting for 24.0% of all households. In contrast, only 20 households (1.2%) fall into the $25,000 to $34,999 income bracket, making it the least populous group.
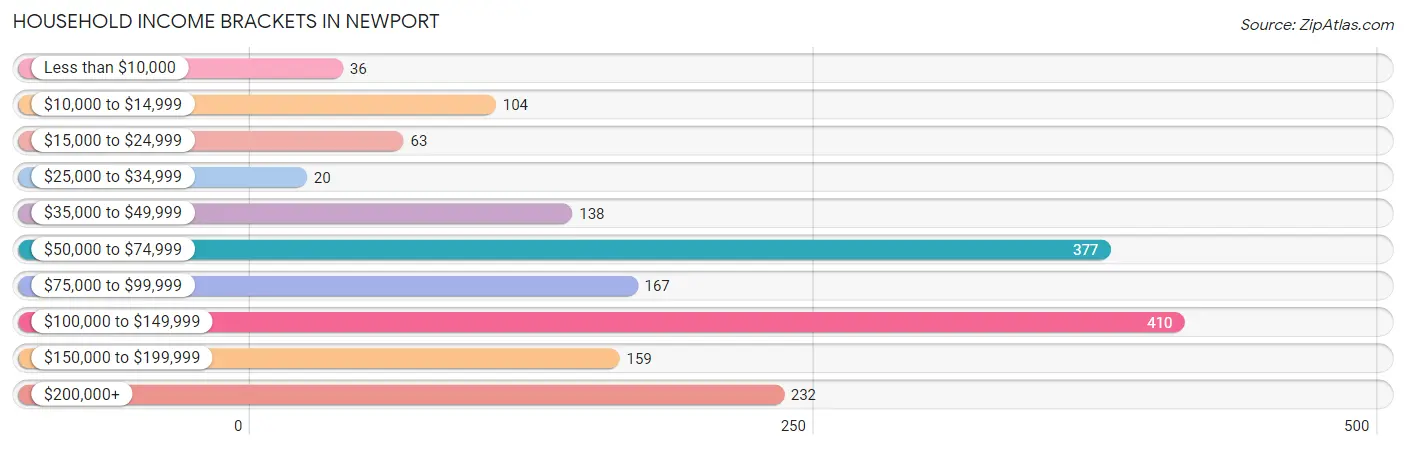
| Income Bracket | # Households | % Households |
| Less than $10,000 | 36 | 2.1% |
| $10,000 to $14,999 | 104 | 6.1% |
| $15,000 to $24,999 | 63 | 3.7% |
| $25,000 to $34,999 | 20 | 1.2% |
| $35,000 to $49,999 | 138 | 8.1% |
| $50,000 to $74,999 | 377 | 22.1% |
| $75,000 to $99,999 | 167 | 9.8% |
| $100,000 to $149,999 | 410 | 24.0% |
| $150,000 to $199,999 | 159 | 9.3% |
| $200,000+ | 232 | 13.6% |
Household Income by Householder Age in Newport
The median household income in Newport is $92,083, with the highest median household income of $104,412 found in the 45 to 64 years age bracket for the primary householder. A total of 570 households (33.4%) fall into this category. Meanwhile, the 15 to 24 years age bracket for the primary householder has the lowest median household income of $0, with 14 households (0.8%) in this group.
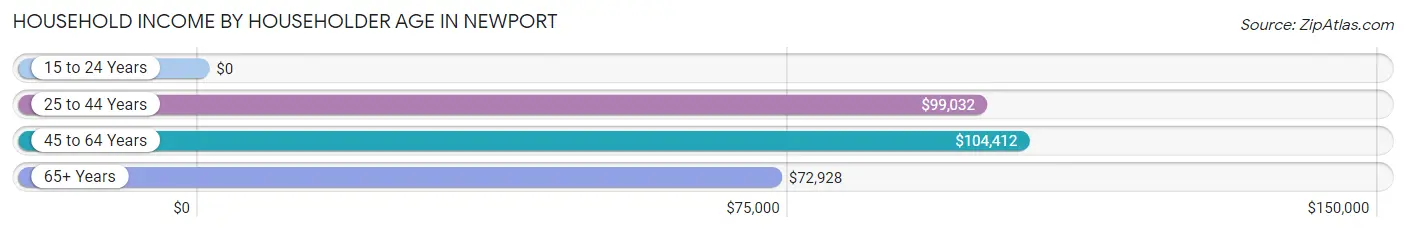
| Income Bracket | # Households | Median Income |
| 15 to 24 Years | 14 (0.8%) | $0 |
| 25 to 44 Years | 544 (31.9%) | $99,032 |
| 45 to 64 Years | 570 (33.4%) | $104,412 |
| 65+ Years | 579 (33.9%) | $72,928 |
| Total | 1,707 (100.0%) | $92,083 |
Poverty in Newport
Income Below Poverty by Sex and Age in Newport
With 2.3% poverty level for males and 8.0% for females among the residents of Newport, 45 to 54 year old males and 16 and 17 year old females are the most vulnerable to poverty, with 30 males (11.3%) and 12 females (50.0%) in their respective age groups living below the poverty level.
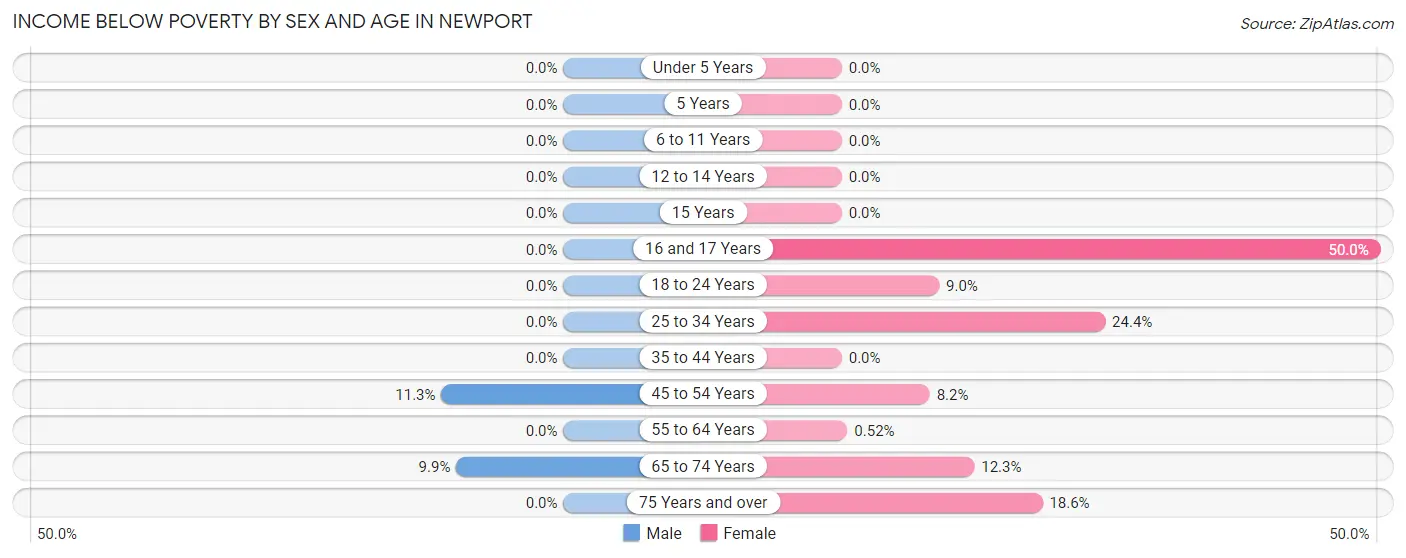
| Age Bracket | Male | Female |
| Under 5 Years | 0 (0.0%) | 0 (0.0%) |
| 5 Years | 0 (0.0%) | 0 (0.0%) |
| 6 to 11 Years | 0 (0.0%) | 0 (0.0%) |
| 12 to 14 Years | 0 (0.0%) | 0 (0.0%) |
| 15 Years | 0 (0.0%) | 0 (0.0%) |
| 16 and 17 Years | 0 (0.0%) | 12 (50.0%) |
| 18 to 24 Years | 0 (0.0%) | 14 (9.0%) |
| 25 to 34 Years | 0 (0.0%) | 66 (24.4%) |
| 35 to 44 Years | 0 (0.0%) | 0 (0.0%) |
| 45 to 54 Years | 30 (11.3%) | 12 (8.2%) |
| 55 to 64 Years | 0 (0.0%) | 2 (0.5%) |
| 65 to 74 Years | 16 (9.9%) | 38 (12.3%) |
| 75 Years and over | 0 (0.0%) | 35 (18.6%) |
| Total | 46 (2.3%) | 179 (8.0%) |
Income Above Poverty by Sex and Age in Newport
According to the poverty statistics in Newport, males aged under 5 years and females aged under 5 years are the age groups that are most secure financially, with 100.0% of males and 100.0% of females in these age groups living above the poverty line.
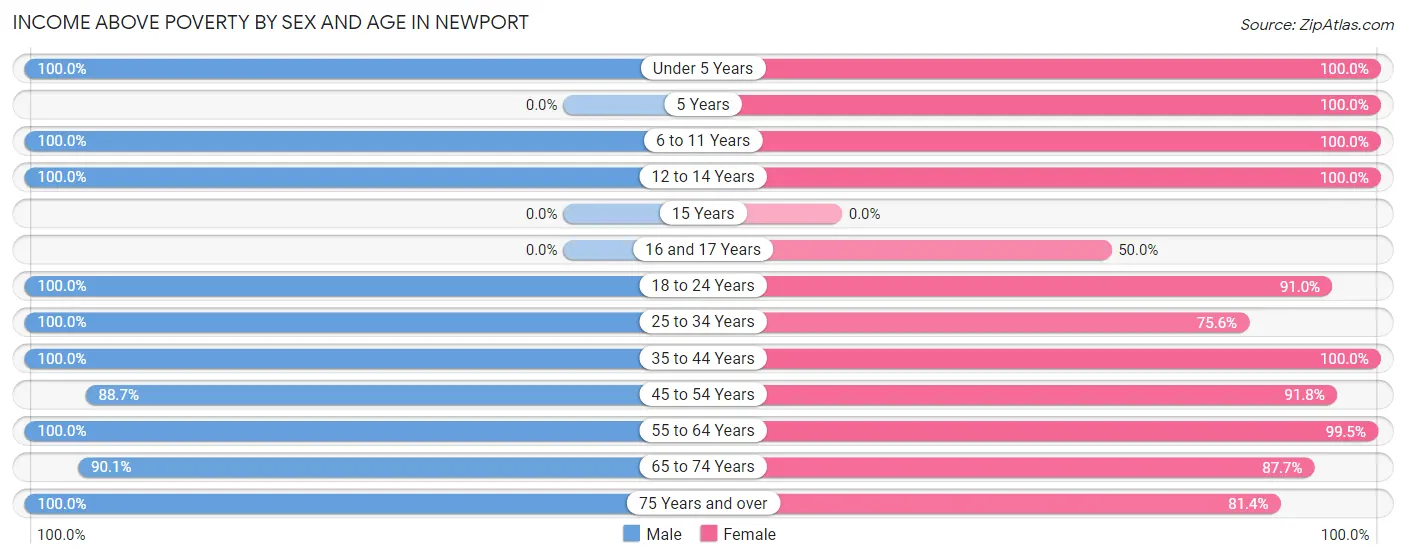
| Age Bracket | Male | Female |
| Under 5 Years | 26 (100.0%) | 141 (100.0%) |
| 5 Years | 0 (0.0%) | 101 (100.0%) |
| 6 to 11 Years | 77 (100.0%) | 97 (100.0%) |
| 12 to 14 Years | 125 (100.0%) | 30 (100.0%) |
| 15 Years | 0 (0.0%) | 0 (0.0%) |
| 16 and 17 Years | 0 (0.0%) | 12 (50.0%) |
| 18 to 24 Years | 186 (100.0%) | 141 (91.0%) |
| 25 to 34 Years | 131 (100.0%) | 204 (75.6%) |
| 35 to 44 Years | 466 (100.0%) | 403 (100.0%) |
| 45 to 54 Years | 235 (88.7%) | 135 (91.8%) |
| 55 to 64 Years | 293 (100.0%) | 379 (99.5%) |
| 65 to 74 Years | 145 (90.1%) | 271 (87.7%) |
| 75 Years and over | 250 (100.0%) | 153 (81.4%) |
| Total | 1,934 (97.7%) | 2,067 (92.0%) |
Income Below Poverty Among Married-Couple Families in Newport
The poverty statistics for married-couple families in Newport show that 2.5% or 28 of the total 1,135 families live below the poverty line. Families with 1 or 2 children have the highest poverty rate of 3.5%, comprising of 11 families. On the other hand, families with 3 or 4 children have the lowest poverty rate of 0.0%, which includes 0 families.
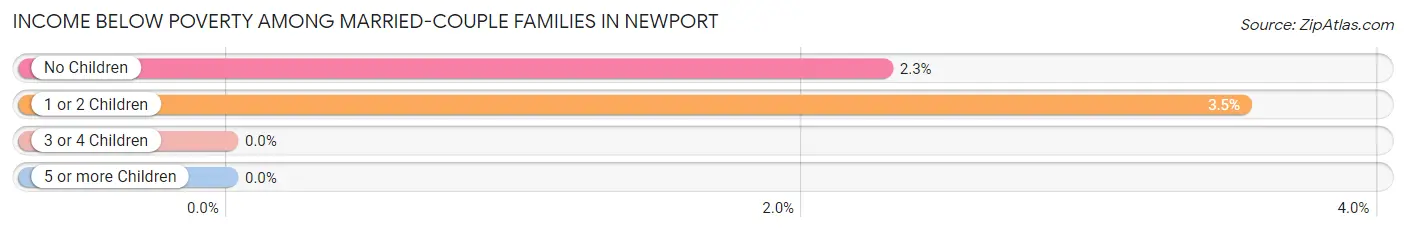
| Children | Above Poverty | Below Poverty |
| No Children | 728 (97.7%) | 17 (2.3%) |
| 1 or 2 Children | 301 (96.5%) | 11 (3.5%) |
| 3 or 4 Children | 78 (100.0%) | 0 (0.0%) |
| 5 or more Children | 0 (0.0%) | 0 (0.0%) |
| Total | 1,107 (97.5%) | 28 (2.5%) |
Income Below Poverty Among Single-Parent Households in Newport
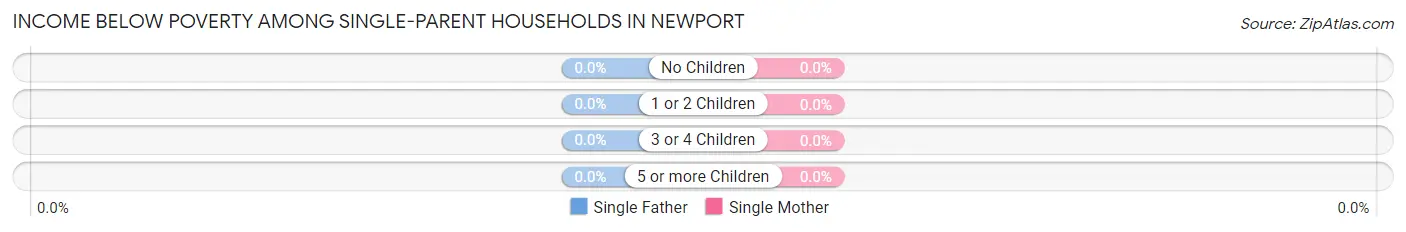
| Children | Single Father | Single Mother |
| No Children | 0 (0.0%) | 0 (0.0%) |
| 1 or 2 Children | 0 (0.0%) | 0 (0.0%) |
| 3 or 4 Children | 0 (0.0%) | 0 (0.0%) |
| 5 or more Children | 0 (0.0%) | 0 (0.0%) |
| Total | 0 (0.0%) | 0 (0.0%) |
Income Below Poverty Among Married-Couple vs Single-Parent Households in Newport
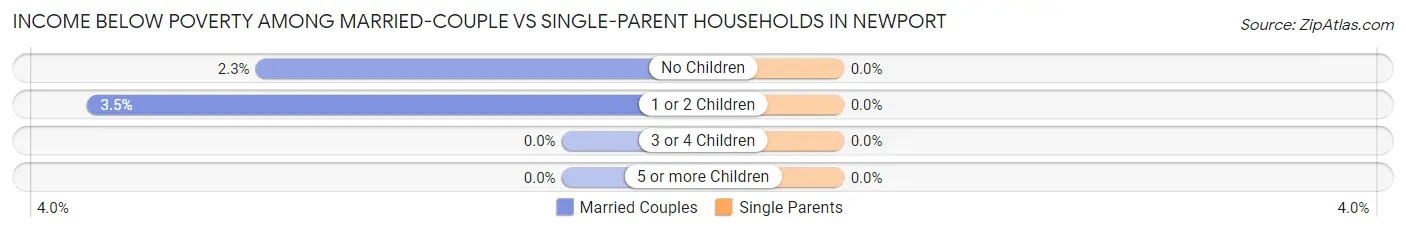
| Children | Married-Couple Families | Single-Parent Households |
| No Children | 17 (2.3%) | 0 (0.0%) |
| 1 or 2 Children | 11 (3.5%) | 0 (0.0%) |
| 3 or 4 Children | 0 (0.0%) | 0 (0.0%) |
| 5 or more Children | 0 (0.0%) | 0 (0.0%) |
| Total | 28 (2.5%) | 0 (0.0%) |
Employment Characteristics in Newport
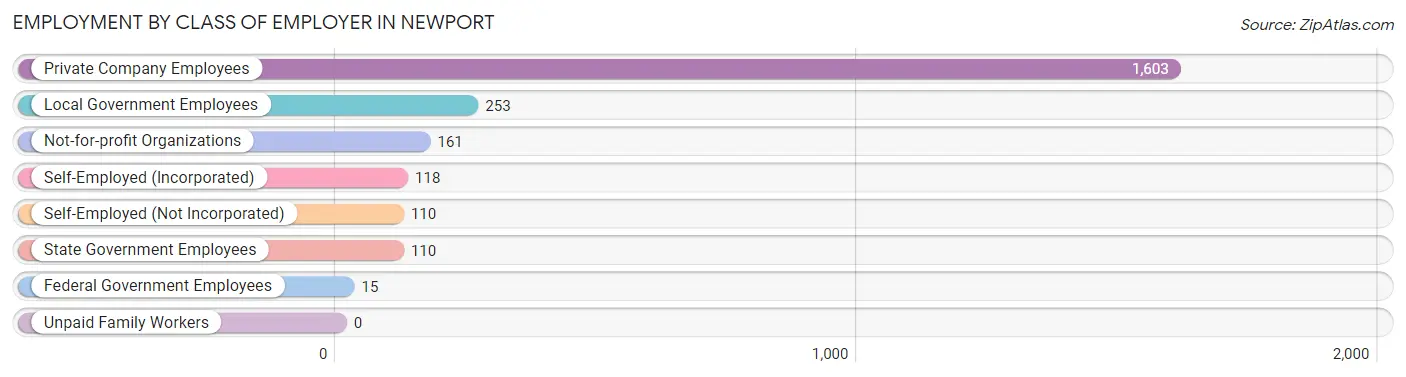
Employment by Class of Employer in Newport
Among the 2,370 employed individuals in Newport, private company employees (1,603 | 67.6%), local government employees (253 | 10.7%), and not-for-profit organizations (161 | 6.8%) make up the most common classes of employment.
| Employer Class | # Employees | % Employees |
| Private Company Employees | 1,603 | 67.6% |
| Self-Employed (Incorporated) | 118 | 5.0% |
| Self-Employed (Not Incorporated) | 110 | 4.6% |
| Not-for-profit Organizations | 161 | 6.8% |
| Local Government Employees | 253 | 10.7% |
| State Government Employees | 110 | 4.6% |
| Federal Government Employees | 15 | 0.6% |
| Unpaid Family Workers | 0 | 0.0% |
| Total | 2,370 | 100.0% |
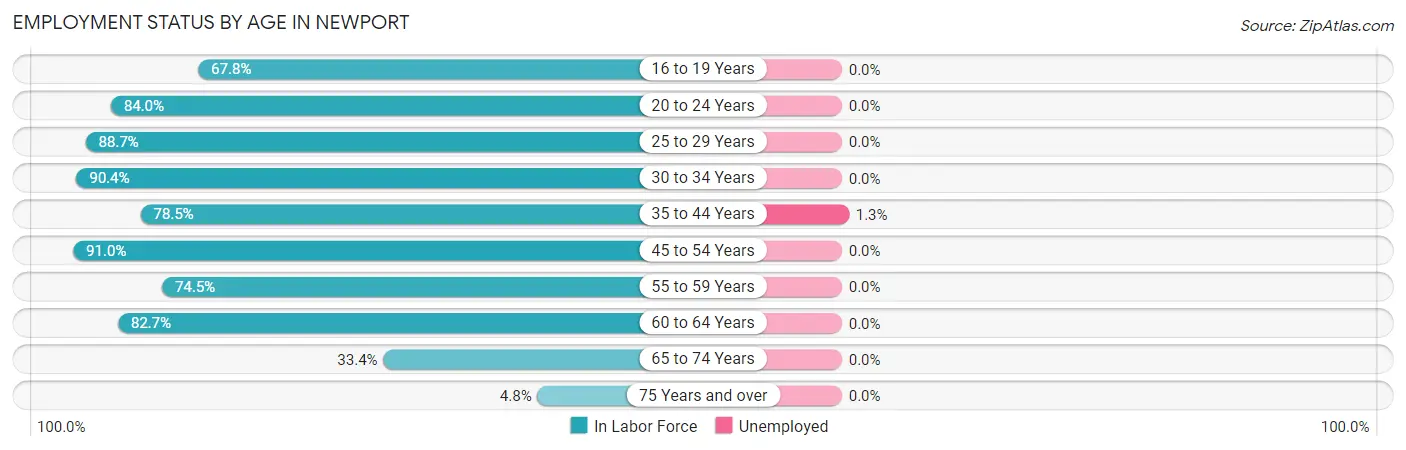
Employment Status by Age in Newport
According to the labor force statistics for Newport, out of the total population over 16 years of age (3,629), 66.1% or 2,399 individuals are in the labor force, with 0.4% or 10 of them unemployed. The age group with the highest labor force participation rate is 45 to 54 years, with 91.0% or 375 individuals in the labor force. Within the labor force, the 35 to 44 years age range has the highest percentage of unemployed individuals, with 1.3% or 9 of them being unemployed.
| Age Bracket | In Labor Force | Unemployed |
| 16 to 19 Years | 137 (67.8%) | 0 (0.0%) |
| 20 to 24 Years | 137 (84.0%) | 0 (0.0%) |
| 25 to 29 Years | 189 (88.7%) | 0 (0.0%) |
| 30 to 34 Years | 170 (90.4%) | 0 (0.0%) |
| 35 to 44 Years | 682 (78.5%) | 9 (1.3%) |
| 45 to 54 Years | 375 (91.0%) | 0 (0.0%) |
| 55 to 59 Years | 248 (74.5%) | 0 (0.0%) |
| 60 to 64 Years | 282 (82.7%) | 0 (0.0%) |
| 65 to 74 Years | 157 (33.4%) | 0 (0.0%) |
| 75 Years and over | 21 (4.8%) | 0 (0.0%) |
| Total | 2,399 (66.1%) | 10 (0.4%) |
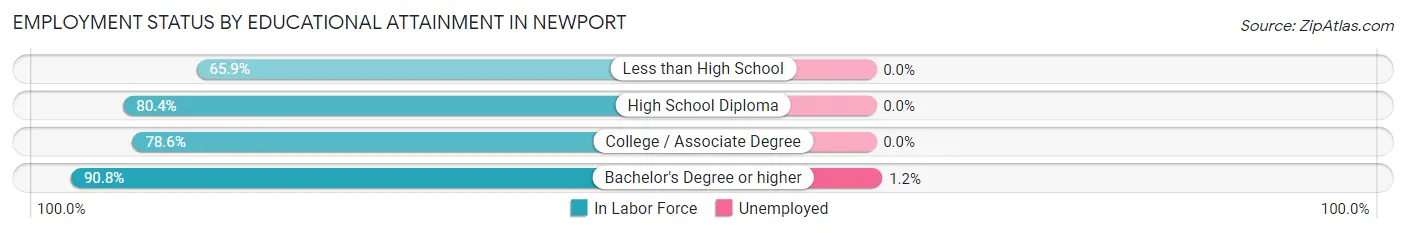
Employment Status by Educational Attainment in Newport
According to labor force statistics for Newport, 82.6% of individuals (1,946) out of the total population between 25 and 64 years of age (2,356) are in the labor force, with 0.5% or 10 of them being unemployed. The group with the highest labor force participation rate are those with the educational attainment of bachelor's degree or higher, with 90.8% or 749 individuals in the labor force. Within the labor force, individuals with bachelor's degree or higher education have the highest percentage of unemployment, with 1.2% or 9 of them being unemployed.
| Educational Attainment | In Labor Force | Unemployed |
| Less than High School | 60 (65.9%) | 0 (0.0%) |
| High School Diploma | 258 (80.4%) | 0 (0.0%) |
| College / Associate Degree | 880 (78.6%) | 0 (0.0%) |
| Bachelor's Degree or higher | 749 (90.8%) | 10 (1.2%) |
| Total | 1,946 (82.6%) | 12 (0.5%) |
Employment Occupations by Sex in Newport
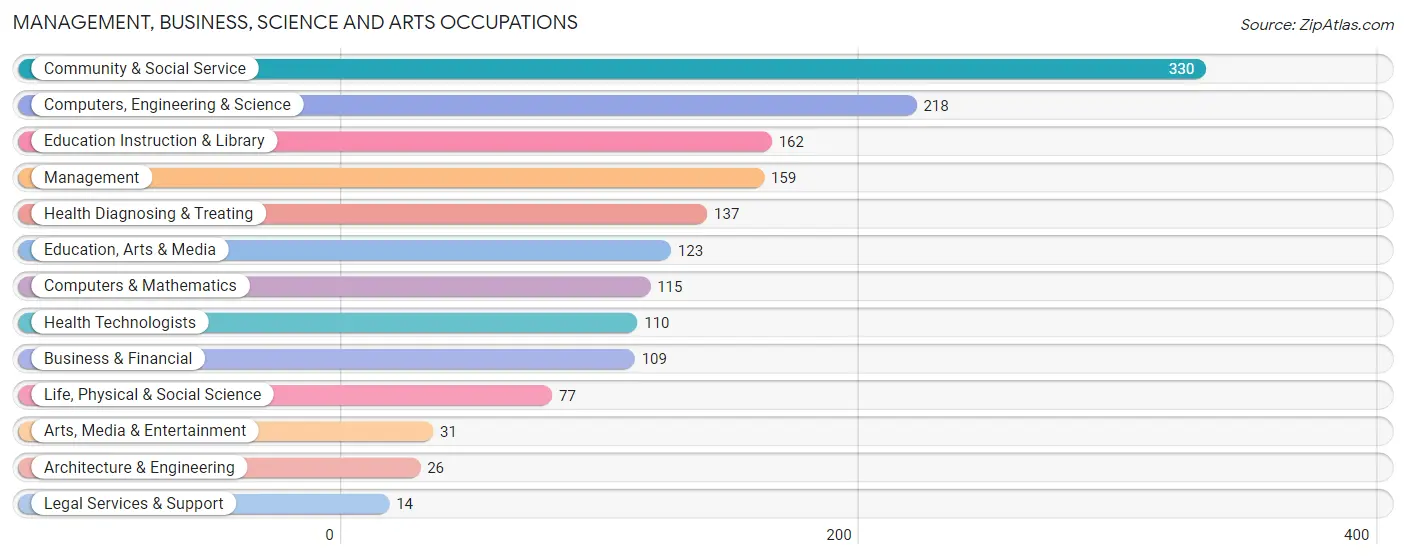
Management, Business, Science and Arts Occupations
The most common Management, Business, Science and Arts occupations in Newport are Community & Social Service (330 | 13.8%), Computers, Engineering & Science (218 | 9.1%), Education Instruction & Library (162 | 6.8%), Management (159 | 6.7%), and Health Diagnosing & Treating (137 | 5.7%).
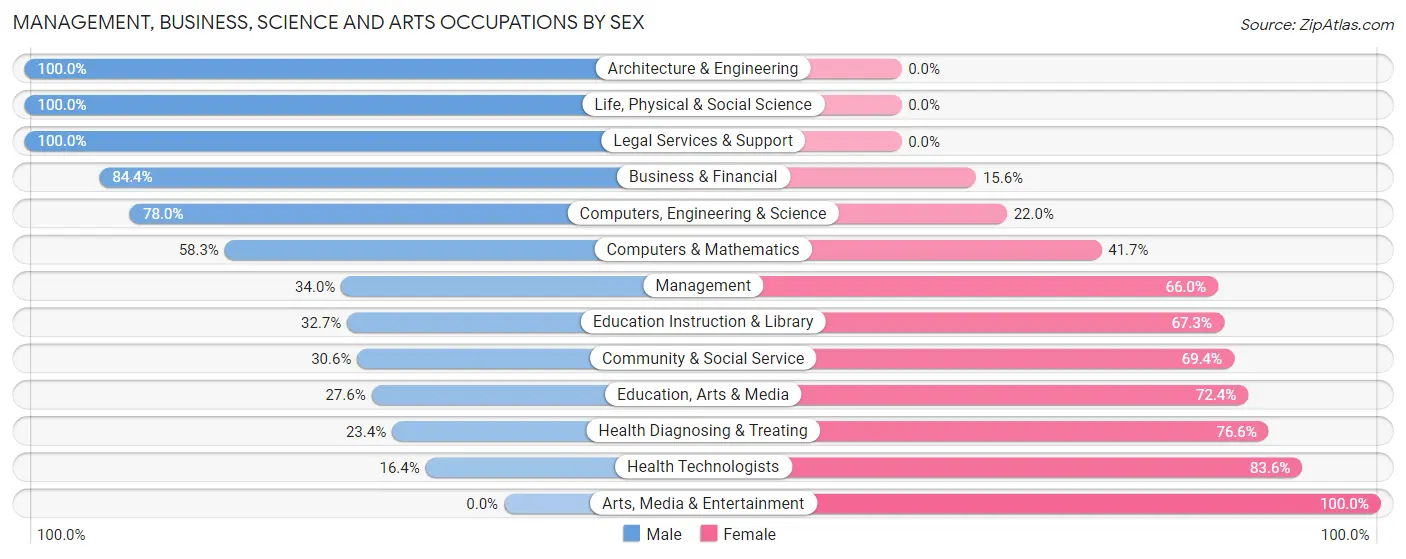
Management, Business, Science and Arts Occupations by Sex
Within the Management, Business, Science and Arts occupations in Newport, the most male-oriented occupations are Architecture & Engineering (100.0%), Life, Physical & Social Science (100.0%), and Legal Services & Support (100.0%), while the most female-oriented occupations are Arts, Media & Entertainment (100.0%), Health Technologists (83.6%), and Health Diagnosing & Treating (76.6%).
| Occupation | Male | Female |
| Management | 54 (34.0%) | 105 (66.0%) |
| Business & Financial | 92 (84.4%) | 17 (15.6%) |
| Computers, Engineering & Science | 170 (78.0%) | 48 (22.0%) |
| Computers & Mathematics | 67 (58.3%) | 48 (41.7%) |
| Architecture & Engineering | 26 (100.0%) | 0 (0.0%) |
| Life, Physical & Social Science | 77 (100.0%) | 0 (0.0%) |
| Community & Social Service | 101 (30.6%) | 229 (69.4%) |
| Education, Arts & Media | 34 (27.6%) | 89 (72.4%) |
| Legal Services & Support | 14 (100.0%) | 0 (0.0%) |
| Education Instruction & Library | 53 (32.7%) | 109 (67.3%) |
| Arts, Media & Entertainment | 0 (0.0%) | 31 (100.0%) |
| Health Diagnosing & Treating | 32 (23.4%) | 105 (76.6%) |
| Health Technologists | 18 (16.4%) | 92 (83.6%) |
| Total (Category) | 449 (47.1%) | 504 (52.9%) |
| Total (Overall) | 1,201 (50.3%) | 1,188 (49.7%) |
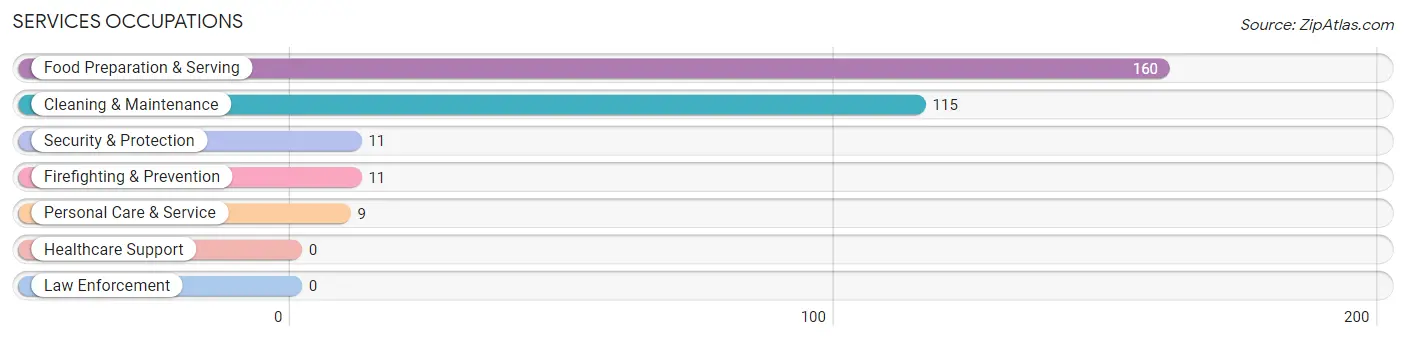
Services Occupations
The most common Services occupations in Newport are Food Preparation & Serving (160 | 6.7%), Cleaning & Maintenance (115 | 4.8%), Security & Protection (11 | 0.5%), Firefighting & Prevention (11 | 0.5%), and Personal Care & Service (9 | 0.4%).
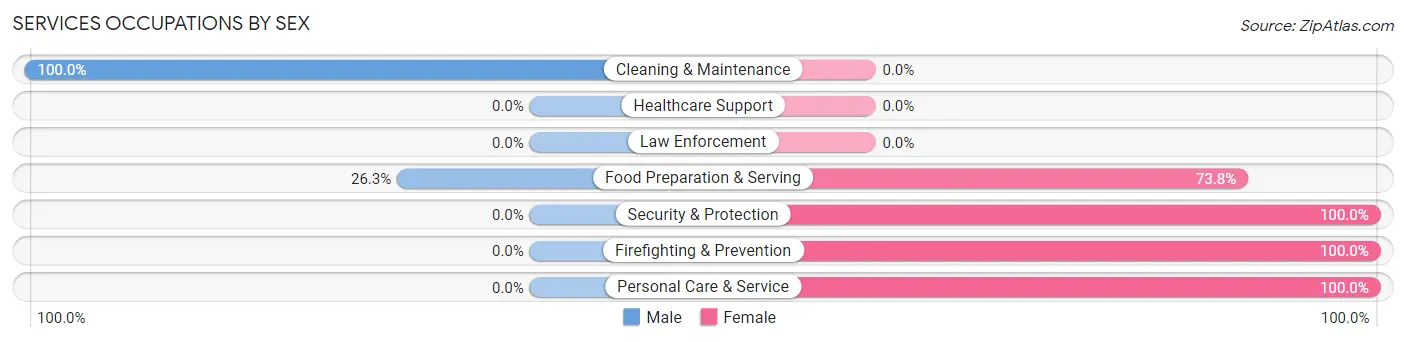
Services Occupations by Sex
Within the Services occupations in Newport, the most male-oriented occupations are Cleaning & Maintenance (100.0%), and Food Preparation & Serving (26.3%), while the most female-oriented occupations are Security & Protection (100.0%), Firefighting & Prevention (100.0%), and Personal Care & Service (100.0%).
| Occupation | Male | Female |
| Healthcare Support | 0 (0.0%) | 0 (0.0%) |
| Security & Protection | 0 (0.0%) | 11 (100.0%) |
| Firefighting & Prevention | 0 (0.0%) | 11 (100.0%) |
| Law Enforcement | 0 (0.0%) | 0 (0.0%) |
| Food Preparation & Serving | 42 (26.3%) | 118 (73.8%) |
| Cleaning & Maintenance | 115 (100.0%) | 0 (0.0%) |
| Personal Care & Service | 0 (0.0%) | 9 (100.0%) |
| Total (Category) | 157 (53.2%) | 138 (46.8%) |
| Total (Overall) | 1,201 (50.3%) | 1,188 (49.7%) |
Sales and Office Occupations
The most common Sales and Office occupations in Newport are Office & Administration (399 | 16.7%), and Sales & Related (197 | 8.3%).
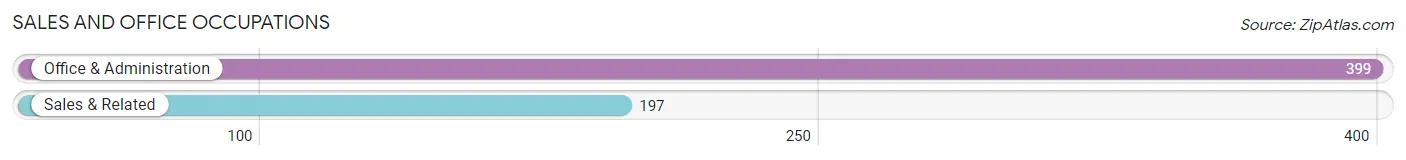
Sales and Office Occupations by Sex

| Occupation | Male | Female |
| Sales & Related | 81 (41.1%) | 116 (58.9%) |
| Office & Administration | 39 (9.8%) | 360 (90.2%) |
| Total (Category) | 120 (20.1%) | 476 (79.9%) |
| Total (Overall) | 1,201 (50.3%) | 1,188 (49.7%) |
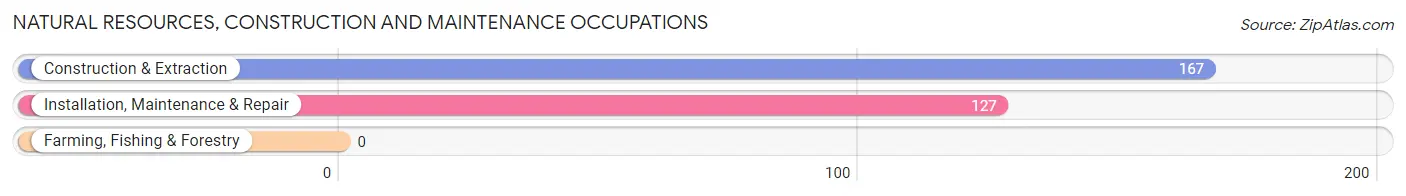
Natural Resources, Construction and Maintenance Occupations
The most common Natural Resources, Construction and Maintenance occupations in Newport are Construction & Extraction (167 | 7.0%), and Installation, Maintenance & Repair (127 | 5.3%).
Natural Resources, Construction and Maintenance Occupations by Sex
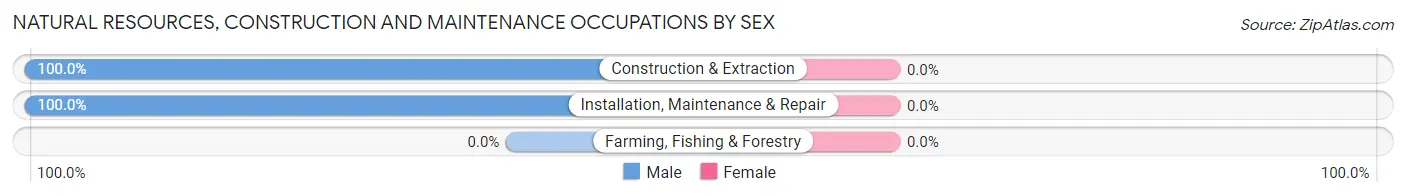
| Occupation | Male | Female |
| Farming, Fishing & Forestry | 0 (0.0%) | 0 (0.0%) |
| Construction & Extraction | 167 (100.0%) | 0 (0.0%) |
| Installation, Maintenance & Repair | 127 (100.0%) | 0 (0.0%) |
| Total (Category) | 294 (100.0%) | 0 (0.0%) |
| Total (Overall) | 1,201 (50.3%) | 1,188 (49.7%) |
Production, Transportation and Moving Occupations
The most common Production, Transportation and Moving occupations in Newport are Production (152 | 6.4%), Material Moving (61 | 2.5%), and Transportation (38 | 1.6%).
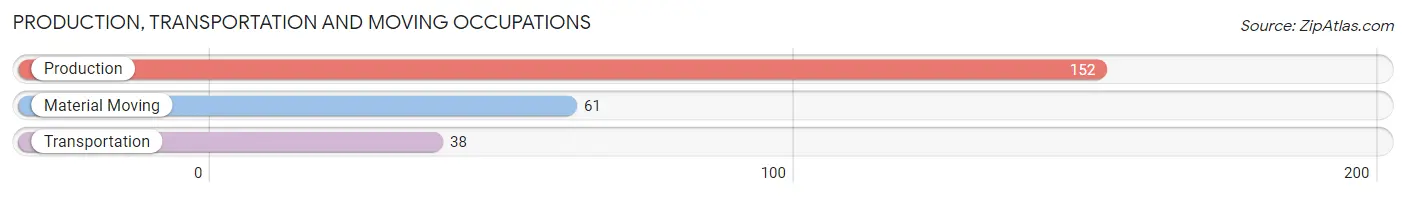
Production, Transportation and Moving Occupations by Sex
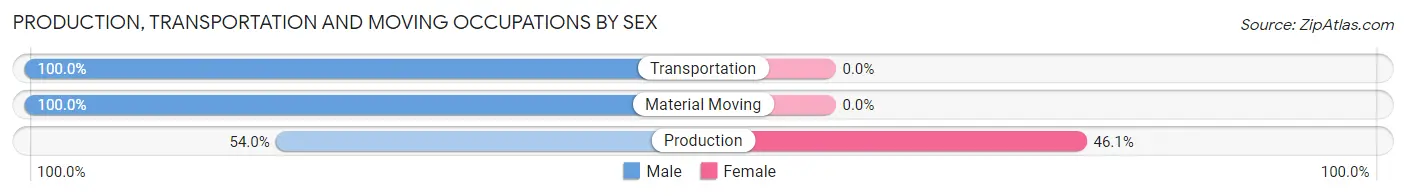
| Occupation | Male | Female |
| Production | 82 (53.9%) | 70 (46.1%) |
| Transportation | 38 (100.0%) | 0 (0.0%) |
| Material Moving | 61 (100.0%) | 0 (0.0%) |
| Total (Category) | 181 (72.1%) | 70 (27.9%) |
| Total (Overall) | 1,201 (50.3%) | 1,188 (49.7%) |
Employment Industries by Sex in Newport
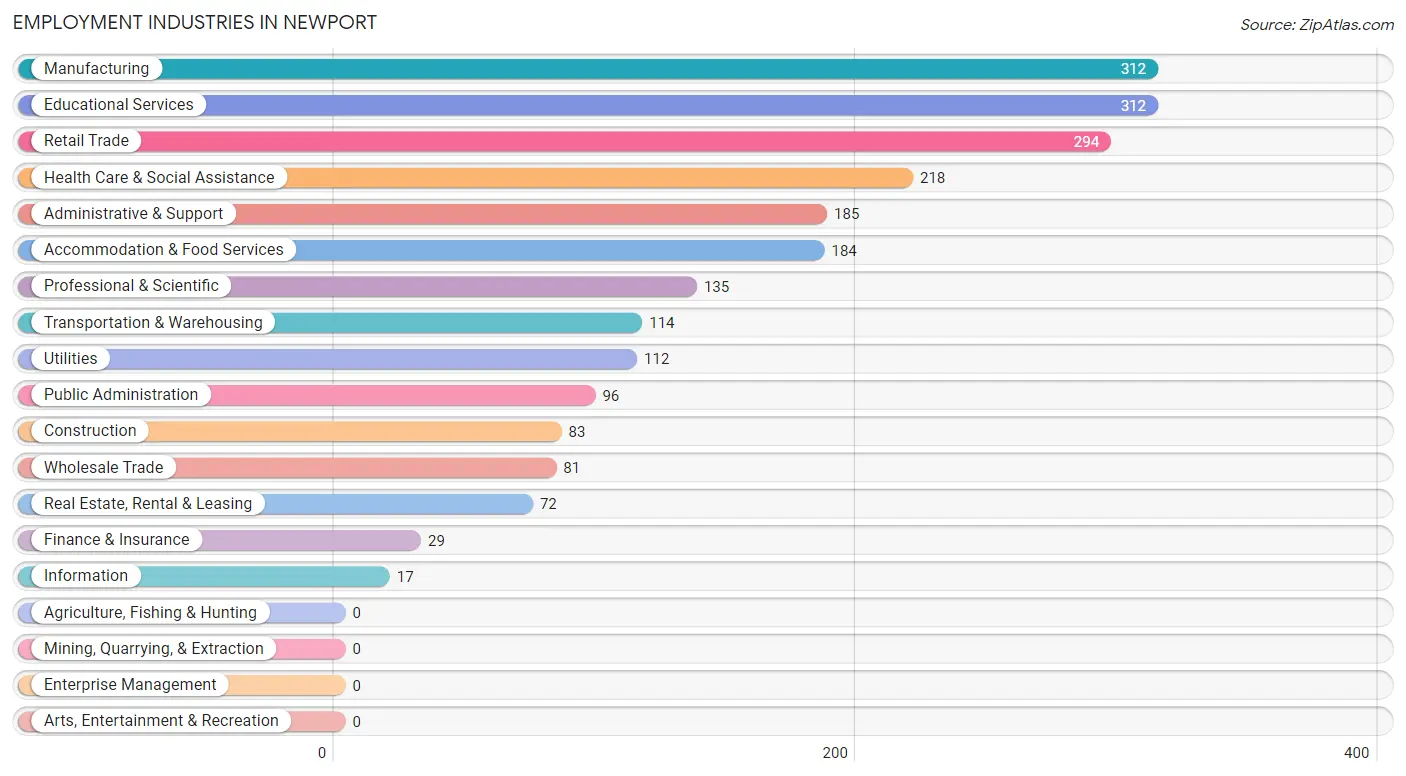
Employment Industries in Newport
The major employment industries in Newport include Manufacturing (312 | 13.1%), Educational Services (312 | 13.1%), Retail Trade (294 | 12.3%), Health Care & Social Assistance (218 | 9.1%), and Administrative & Support (185 | 7.7%).
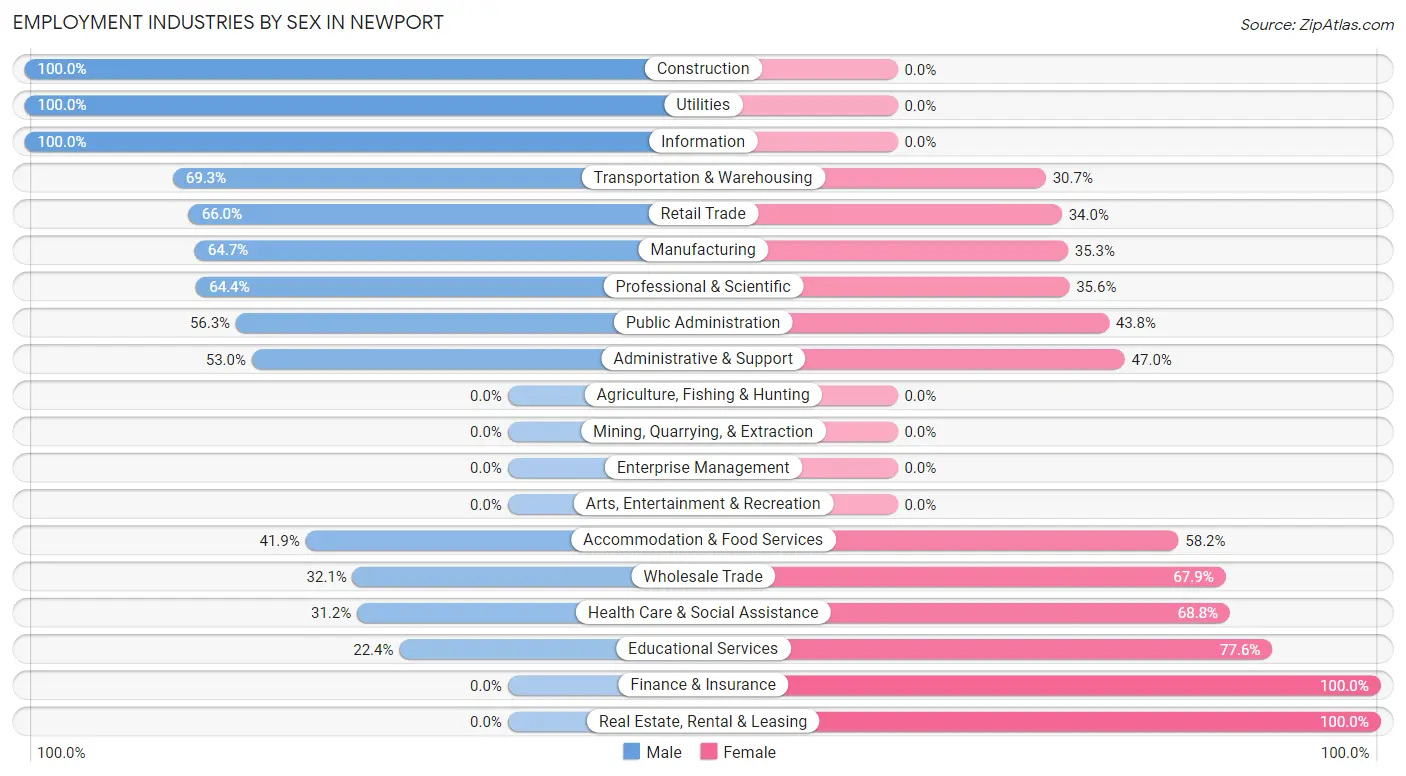
Employment Industries by Sex in Newport
The Newport industries that see more men than women are Construction (100.0%), Utilities (100.0%), and Information (100.0%), whereas the industries that tend to have a higher number of women are Finance & Insurance (100.0%), Real Estate, Rental & Leasing (100.0%), and Educational Services (77.6%).
| Industry | Male | Female |
| Agriculture, Fishing & Hunting | 0 (0.0%) | 0 (0.0%) |
| Mining, Quarrying, & Extraction | 0 (0.0%) | 0 (0.0%) |
| Construction | 83 (100.0%) | 0 (0.0%) |
| Manufacturing | 202 (64.7%) | 110 (35.3%) |
| Wholesale Trade | 26 (32.1%) | 55 (67.9%) |
| Retail Trade | 194 (66.0%) | 100 (34.0%) |
| Transportation & Warehousing | 79 (69.3%) | 35 (30.7%) |
| Utilities | 112 (100.0%) | 0 (0.0%) |
| Information | 17 (100.0%) | 0 (0.0%) |
| Finance & Insurance | 0 (0.0%) | 29 (100.0%) |
| Real Estate, Rental & Leasing | 0 (0.0%) | 72 (100.0%) |
| Professional & Scientific | 87 (64.4%) | 48 (35.6%) |
| Enterprise Management | 0 (0.0%) | 0 (0.0%) |
| Administrative & Support | 98 (53.0%) | 87 (47.0%) |
| Educational Services | 70 (22.4%) | 242 (77.6%) |
| Health Care & Social Assistance | 68 (31.2%) | 150 (68.8%) |
| Arts, Entertainment & Recreation | 0 (0.0%) | 0 (0.0%) |
| Accommodation & Food Services | 77 (41.8%) | 107 (58.2%) |
| Public Administration | 54 (56.2%) | 42 (43.8%) |
| Total | 1,201 (50.3%) | 1,188 (49.7%) |
Education in Newport
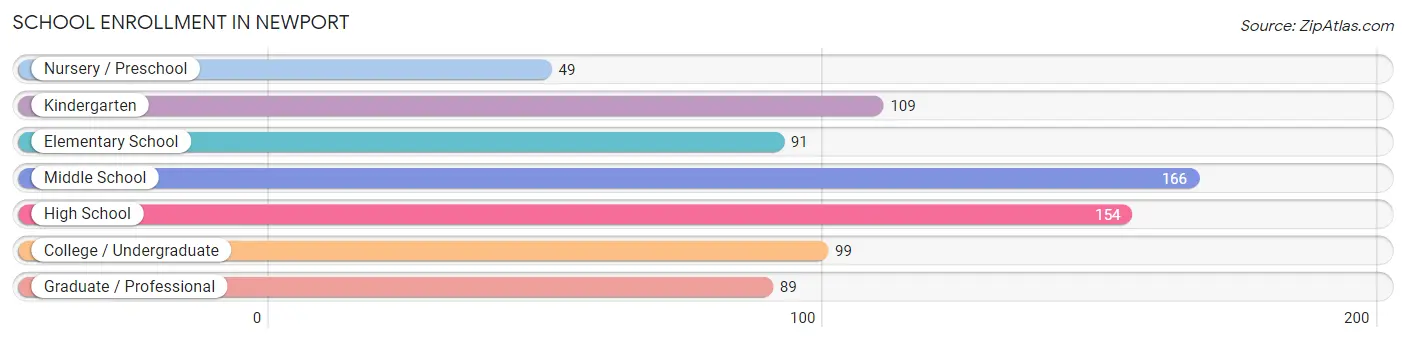
School Enrollment in Newport
The most common levels of schooling among the 757 students in Newport are middle school (166 | 21.9%), high school (154 | 20.3%), and kindergarten (109 | 14.4%).
| School Level | # Students | % Students |
| Nursery / Preschool | 49 | 6.5% |
| Kindergarten | 109 | 14.4% |
| Elementary School | 91 | 12.0% |
| Middle School | 166 | 21.9% |
| High School | 154 | 20.3% |
| College / Undergraduate | 99 | 13.1% |
| Graduate / Professional | 89 | 11.8% |
| Total | 757 | 100.0% |
School Enrollment by Age by Funding Source in Newport
Out of a total of 757 students who are enrolled in schools in Newport, 112 (14.8%) attend a private institution, while the remaining 645 (85.2%) are enrolled in public schools. The age group of 3 to 4 year olds has the highest likelihood of being enrolled in private schools, with 35 (100.0% in the age bracket) enrolled. Conversely, the age group of 10 to 14 year olds has the lowest likelihood of being enrolled in a private school, with 216 (100.0% in the age bracket) attending a public institution.
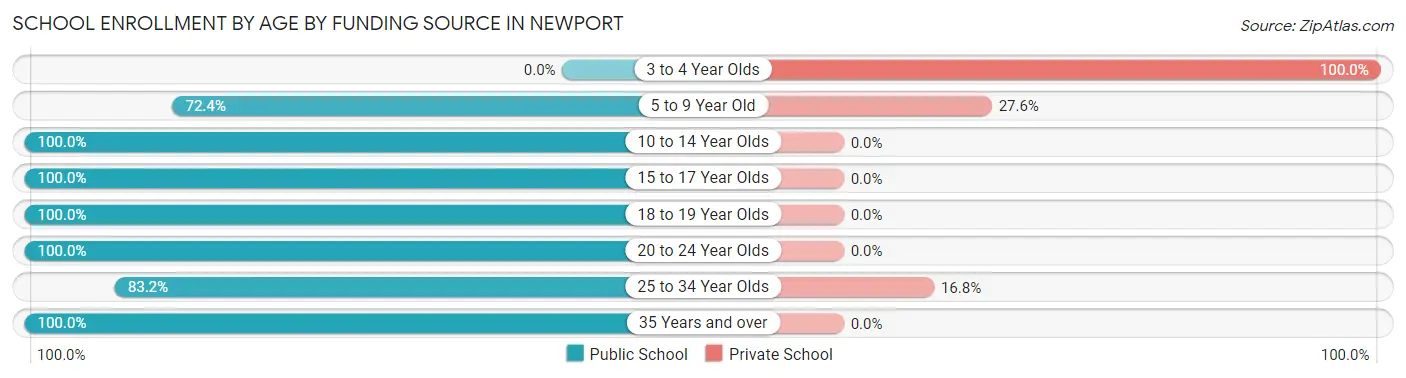
| Age Bracket | Public School | Private School |
| 3 to 4 Year Olds | 0 (0.0%) | 35 (100.0%) |
| 5 to 9 Year Old | 155 (72.4%) | 59 (27.6%) |
| 10 to 14 Year Olds | 216 (100.0%) | 0 (0.0%) |
| 15 to 17 Year Olds | 24 (100.0%) | 0 (0.0%) |
| 18 to 19 Year Olds | 122 (100.0%) | 0 (0.0%) |
| 20 to 24 Year Olds | 26 (100.0%) | 0 (0.0%) |
| 25 to 34 Year Olds | 89 (83.2%) | 18 (16.8%) |
| 35 Years and over | 13 (100.0%) | 0 (0.0%) |
| Total | 645 (85.2%) | 112 (14.8%) |
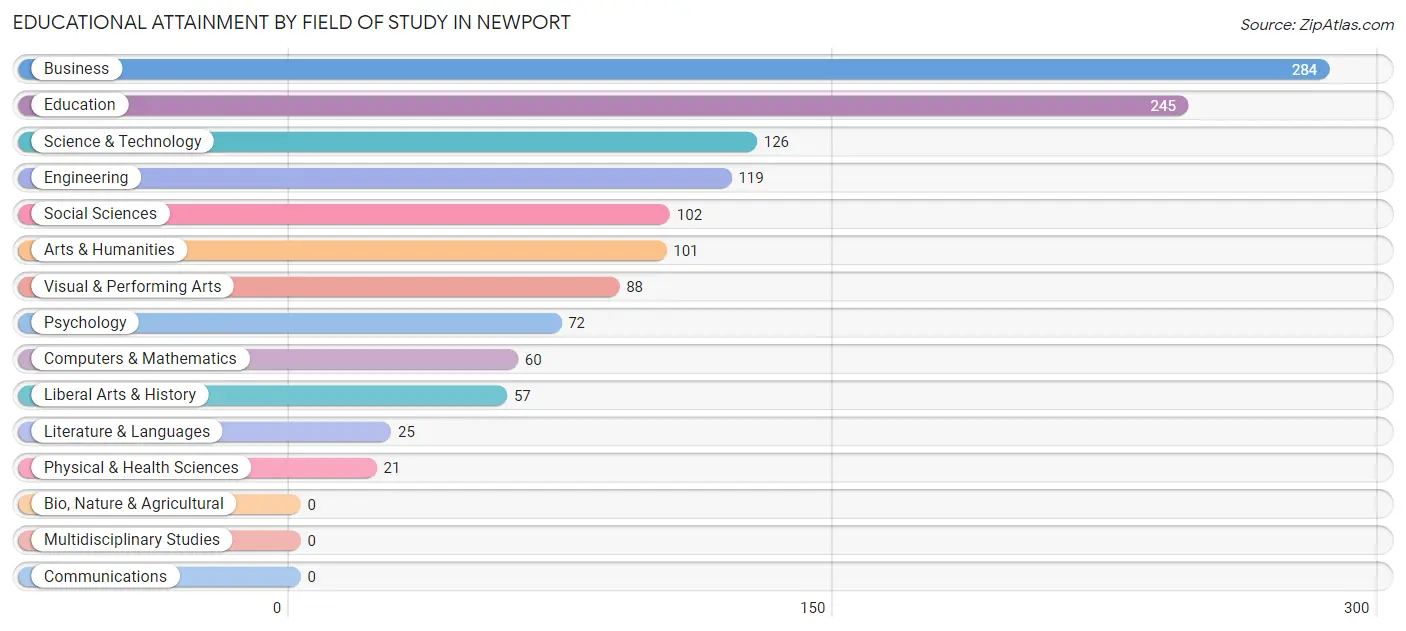
Educational Attainment by Field of Study in Newport
Business (284 | 21.8%), education (245 | 18.9%), science & technology (126 | 9.7%), engineering (119 | 9.1%), and social sciences (102 | 7.9%) are the most common fields of study among 1,300 individuals in Newport who have obtained a bachelor's degree or higher.
| Field of Study | # Graduates | % Graduates |
| Computers & Mathematics | 60 | 4.6% |
| Bio, Nature & Agricultural | 0 | 0.0% |
| Physical & Health Sciences | 21 | 1.6% |
| Psychology | 72 | 5.5% |
| Social Sciences | 102 | 7.9% |
| Engineering | 119 | 9.1% |
| Multidisciplinary Studies | 0 | 0.0% |
| Science & Technology | 126 | 9.7% |
| Business | 284 | 21.8% |
| Education | 245 | 18.9% |
| Literature & Languages | 25 | 1.9% |
| Liberal Arts & History | 57 | 4.4% |
| Visual & Performing Arts | 88 | 6.8% |
| Communications | 0 | 0.0% |
| Arts & Humanities | 101 | 7.8% |
| Total | 1,300 | 100.0% |
Transportation & Commute in Newport
Vehicle Availability by Sex in Newport
The most prevalent vehicle ownership categories in Newport are males with 2 vehicles (477, accounting for 40.4%) and females with 2 vehicles (569, making up 40.2%).
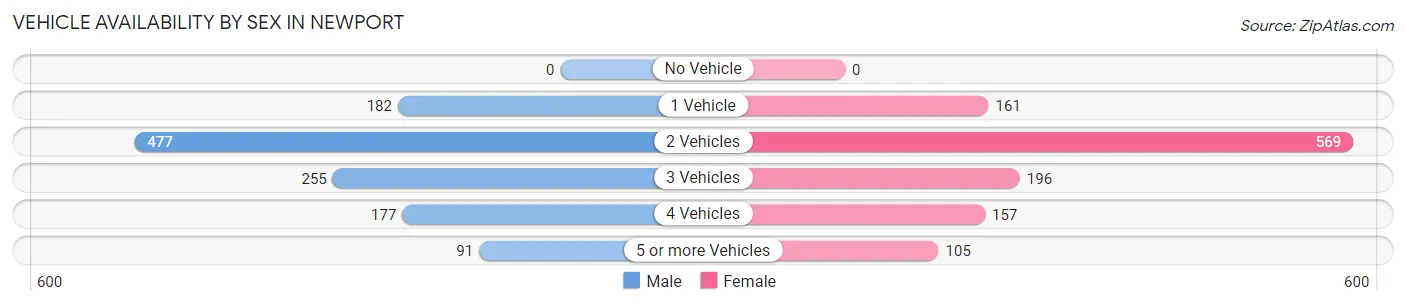
| Vehicles Available | Male | Female |
| No Vehicle | 0 (0.0%) | 0 (0.0%) |
| 1 Vehicle | 182 (15.4%) | 161 (13.6%) |
| 2 Vehicles | 477 (40.4%) | 569 (47.9%) |
| 3 Vehicles | 255 (21.6%) | 196 (16.5%) |
| 4 Vehicles | 177 (15.0%) | 157 (13.2%) |
| 5 or more Vehicles | 91 (7.7%) | 105 (8.8%) |
| Total | 1,182 (100.0%) | 1,188 (100.0%) |
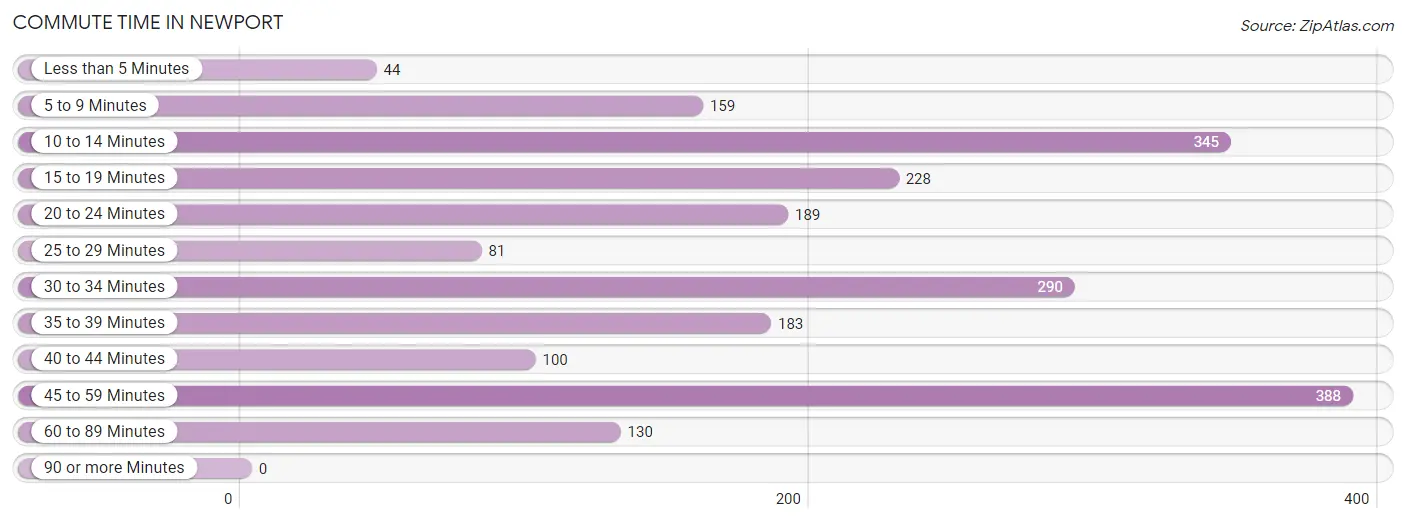
Commute Time in Newport
The most frequently occuring commute durations in Newport are 45 to 59 minutes (388 commuters, 18.2%), 10 to 14 minutes (345 commuters, 16.1%), and 30 to 34 minutes (290 commuters, 13.6%).
| Commute Time | # Commuters | % Commuters |
| Less than 5 Minutes | 44 | 2.1% |
| 5 to 9 Minutes | 159 | 7.4% |
| 10 to 14 Minutes | 345 | 16.1% |
| 15 to 19 Minutes | 228 | 10.7% |
| 20 to 24 Minutes | 189 | 8.8% |
| 25 to 29 Minutes | 81 | 3.8% |
| 30 to 34 Minutes | 290 | 13.6% |
| 35 to 39 Minutes | 183 | 8.6% |
| 40 to 44 Minutes | 100 | 4.7% |
| 45 to 59 Minutes | 388 | 18.2% |
| 60 to 89 Minutes | 130 | 6.1% |
| 90 or more Minutes | 0 | 0.0% |
Commute Time by Sex in Newport
The most common commute times in Newport are 45 to 59 minutes (274 commuters, 24.5%) for males and 30 to 34 minutes (218 commuters, 21.4%) for females.
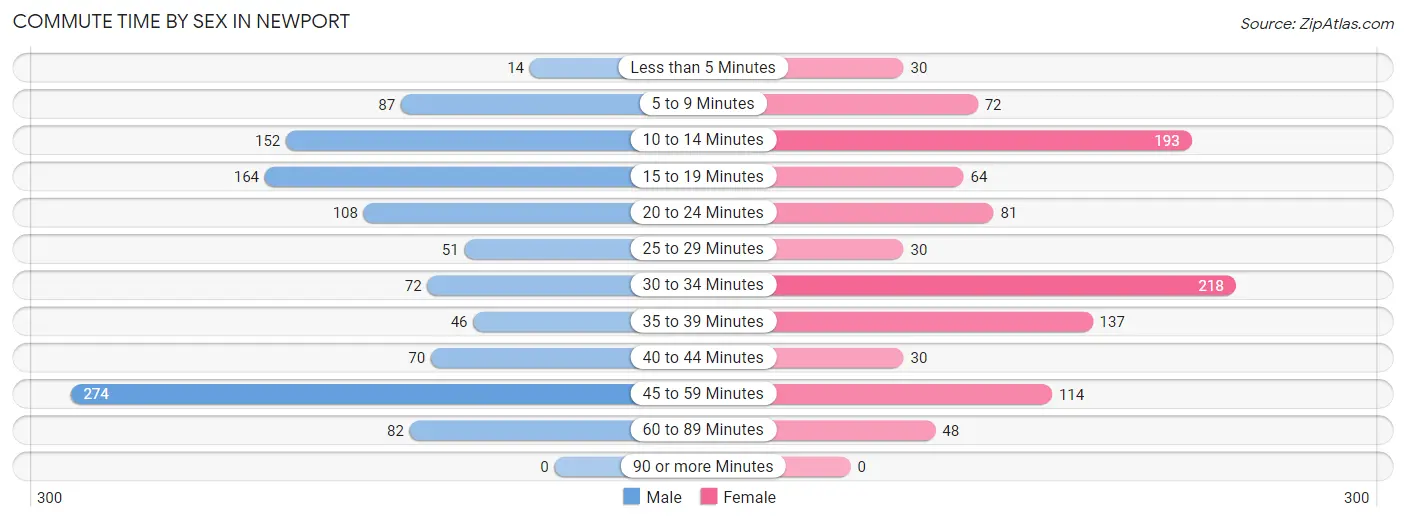
| Commute Time | Male | Female |
| Less than 5 Minutes | 14 (1.3%) | 30 (2.9%) |
| 5 to 9 Minutes | 87 (7.8%) | 72 (7.1%) |
| 10 to 14 Minutes | 152 (13.6%) | 193 (19.0%) |
| 15 to 19 Minutes | 164 (14.6%) | 64 (6.3%) |
| 20 to 24 Minutes | 108 (9.6%) | 81 (8.0%) |
| 25 to 29 Minutes | 51 (4.5%) | 30 (2.9%) |
| 30 to 34 Minutes | 72 (6.4%) | 218 (21.4%) |
| 35 to 39 Minutes | 46 (4.1%) | 137 (13.5%) |
| 40 to 44 Minutes | 70 (6.2%) | 30 (2.9%) |
| 45 to 59 Minutes | 274 (24.5%) | 114 (11.2%) |
| 60 to 89 Minutes | 82 (7.3%) | 48 (4.7%) |
| 90 or more Minutes | 0 (0.0%) | 0 (0.0%) |
Time of Departure to Work by Sex in Newport
The most frequent times of departure to work in Newport are 6:30 AM to 6:59 AM (199, 17.8%) for males and 7:30 AM to 7:59 AM (208, 20.4%) for females.
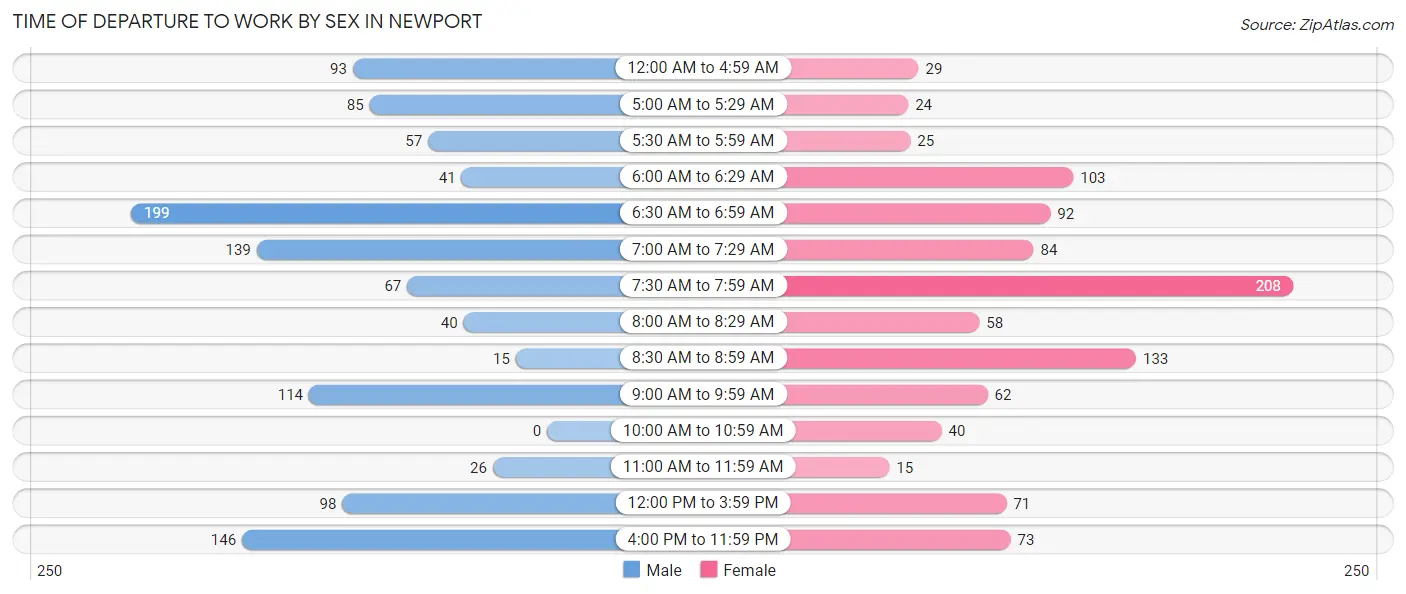
| Time of Departure | Male | Female |
| 12:00 AM to 4:59 AM | 93 (8.3%) | 29 (2.9%) |
| 5:00 AM to 5:29 AM | 85 (7.6%) | 24 (2.4%) |
| 5:30 AM to 5:59 AM | 57 (5.1%) | 25 (2.5%) |
| 6:00 AM to 6:29 AM | 41 (3.7%) | 103 (10.1%) |
| 6:30 AM to 6:59 AM | 199 (17.8%) | 92 (9.0%) |
| 7:00 AM to 7:29 AM | 139 (12.4%) | 84 (8.3%) |
| 7:30 AM to 7:59 AM | 67 (6.0%) | 208 (20.4%) |
| 8:00 AM to 8:29 AM | 40 (3.6%) | 58 (5.7%) |
| 8:30 AM to 8:59 AM | 15 (1.3%) | 133 (13.1%) |
| 9:00 AM to 9:59 AM | 114 (10.2%) | 62 (6.1%) |
| 10:00 AM to 10:59 AM | 0 (0.0%) | 40 (3.9%) |
| 11:00 AM to 11:59 AM | 26 (2.3%) | 15 (1.5%) |
| 12:00 PM to 3:59 PM | 98 (8.7%) | 71 (7.0%) |
| 4:00 PM to 11:59 PM | 146 (13.0%) | 73 (7.2%) |
| Total | 1,120 (100.0%) | 1,017 (100.0%) |
Housing Occupancy in Newport
Occupancy by Ownership in Newport
Of the total 1,707 dwellings in Newport, owner-occupied units account for 1,604 (94.0%), while renter-occupied units make up 103 (6.0%).
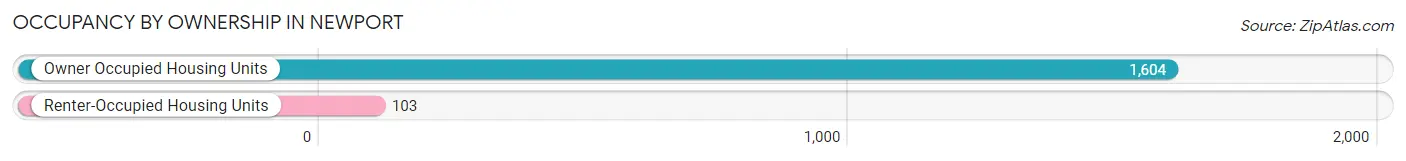
| Occupancy | # Housing Units | % Housing Units |
| Owner Occupied Housing Units | 1,604 | 94.0% |
| Renter-Occupied Housing Units | 103 | 6.0% |
| Total Occupied Housing Units | 1,707 | 100.0% |
Occupancy by Household Size in Newport
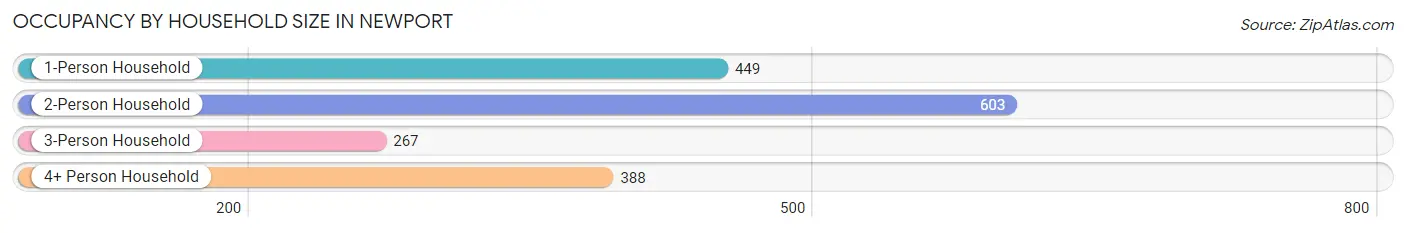
| Household Size | # Housing Units | % Housing Units |
| 1-Person Household | 449 | 26.3% |
| 2-Person Household | 603 | 35.3% |
| 3-Person Household | 267 | 15.6% |
| 4+ Person Household | 388 | 22.7% |
| Total Housing Units | 1,707 | 100.0% |
Occupancy by Ownership by Household Size in Newport
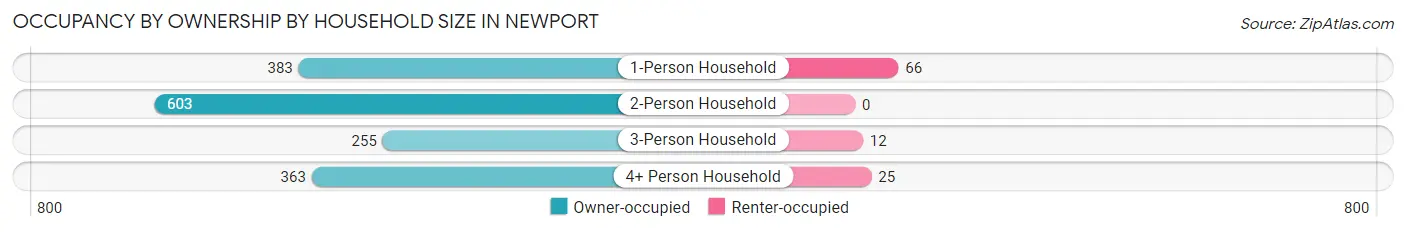
| Household Size | Owner-occupied | Renter-occupied |
| 1-Person Household | 383 (85.3%) | 66 (14.7%) |
| 2-Person Household | 603 (100.0%) | 0 (0.0%) |
| 3-Person Household | 255 (95.5%) | 12 (4.5%) |
| 4+ Person Household | 363 (93.6%) | 25 (6.4%) |
| Total Housing Units | 1,604 (94.0%) | 103 (6.0%) |
Occupancy by Educational Attainment in Newport
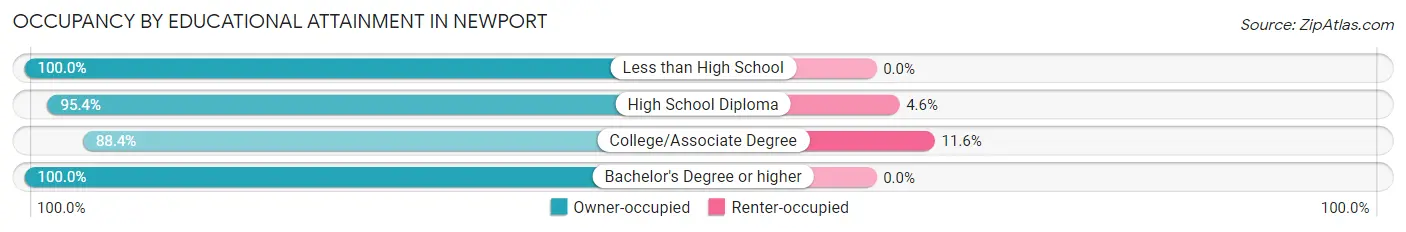
| Household Size | Owner-occupied | Renter-occupied |
| Less than High School | 58 (100.0%) | 0 (0.0%) |
| High School Diploma | 209 (95.4%) | 10 (4.6%) |
| College/Associate Degree | 711 (88.4%) | 93 (11.6%) |
| Bachelor's Degree or higher | 626 (100.0%) | 0 (0.0%) |
Occupancy by Age of Householder in Newport
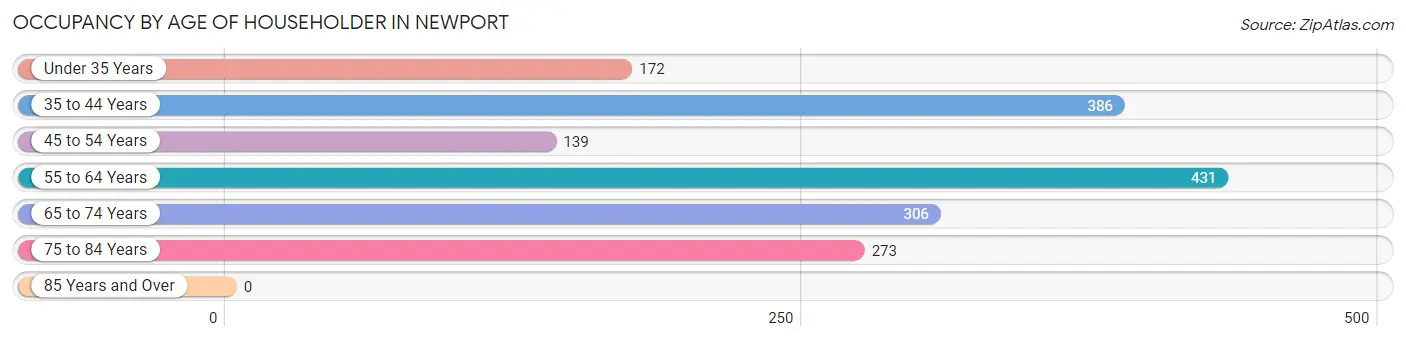
| Age Bracket | # Households | % Households |
| Under 35 Years | 172 | 10.1% |
| 35 to 44 Years | 386 | 22.6% |
| 45 to 54 Years | 139 | 8.1% |
| 55 to 64 Years | 431 | 25.3% |
| 65 to 74 Years | 306 | 17.9% |
| 75 to 84 Years | 273 | 16.0% |
| 85 Years and Over | 0 | 0.0% |
| Total | 1,707 | 100.0% |
Housing Finances in Newport
Median Income by Occupancy in Newport

| Occupancy Type | # Households | Median Income |
| Owner-Occupied | 1,604 (94.0%) | $97,656 |
| Renter-Occupied | 103 (6.0%) | $0 |
| Average | 1,707 (100.0%) | $92,083 |
Occupancy by Householder Income Bracket in Newport
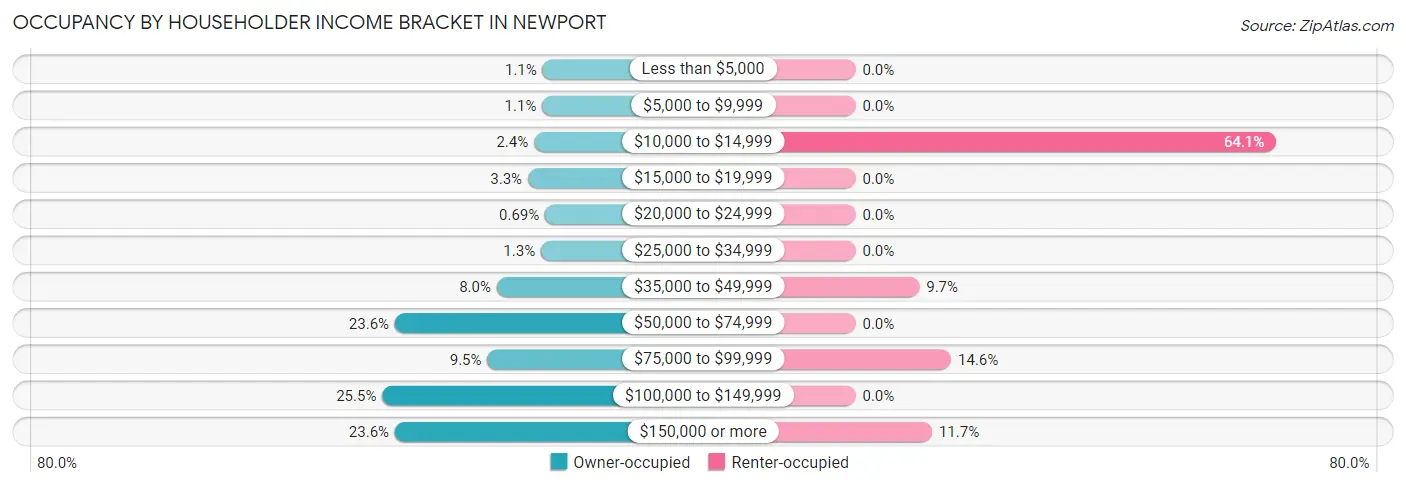
| Income Bracket | Owner-occupied | Renter-occupied |
| Less than $5,000 | 17 (1.1%) | 0 (0.0%) |
| $5,000 to $9,999 | 18 (1.1%) | 0 (0.0%) |
| $10,000 to $14,999 | 38 (2.4%) | 66 (64.1%) |
| $15,000 to $19,999 | 53 (3.3%) | 0 (0.0%) |
| $20,000 to $24,999 | 11 (0.7%) | 0 (0.0%) |
| $25,000 to $34,999 | 21 (1.3%) | 0 (0.0%) |
| $35,000 to $49,999 | 129 (8.0%) | 10 (9.7%) |
| $50,000 to $74,999 | 378 (23.6%) | 0 (0.0%) |
| $75,000 to $99,999 | 152 (9.5%) | 15 (14.6%) |
| $100,000 to $149,999 | 409 (25.5%) | 0 (0.0%) |
| $150,000 or more | 378 (23.6%) | 12 (11.7%) |
| Total | 1,604 (100.0%) | 103 (100.0%) |
Monthly Housing Cost Tiers in Newport
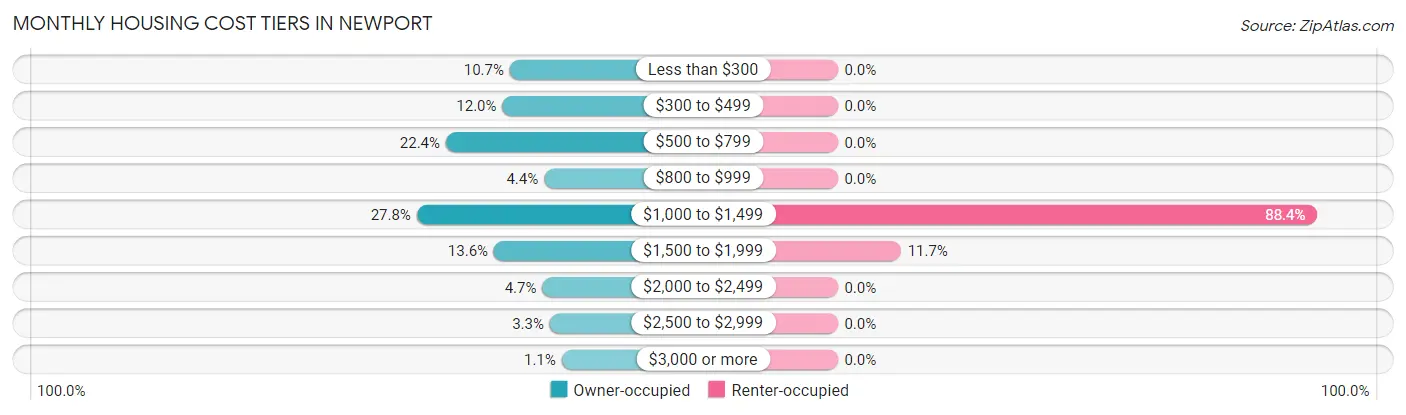
| Monthly Cost | Owner-occupied | Renter-occupied |
| Less than $300 | 171 (10.7%) | 0 (0.0%) |
| $300 to $499 | 193 (12.0%) | 0 (0.0%) |
| $500 to $799 | 360 (22.4%) | 0 (0.0%) |
| $800 to $999 | 70 (4.4%) | 0 (0.0%) |
| $1,000 to $1,499 | 446 (27.8%) | 91 (88.3%) |
| $1,500 to $1,999 | 218 (13.6%) | 12 (11.7%) |
| $2,000 to $2,499 | 75 (4.7%) | 0 (0.0%) |
| $2,500 to $2,999 | 53 (3.3%) | 0 (0.0%) |
| $3,000 or more | 18 (1.1%) | 0 (0.0%) |
| Total | 1,604 (100.0%) | 103 (100.0%) |
Physical Housing Characteristics in Newport
Housing Structures in Newport

| Structure Type | # Housing Units | % Housing Units |
| Single Unit, Detached | 1,519 | 89.0% |
| Single Unit, Attached | 0 | 0.0% |
| 2 Unit Apartments | 0 | 0.0% |
| 3 or 4 Unit Apartments | 0 | 0.0% |
| 5 to 9 Unit Apartments | 0 | 0.0% |
| 10 or more Apartments | 0 | 0.0% |
| Mobile Home / Other | 188 | 11.0% |
| Total | 1,707 | 100.0% |
Housing Structures by Occupancy in Newport
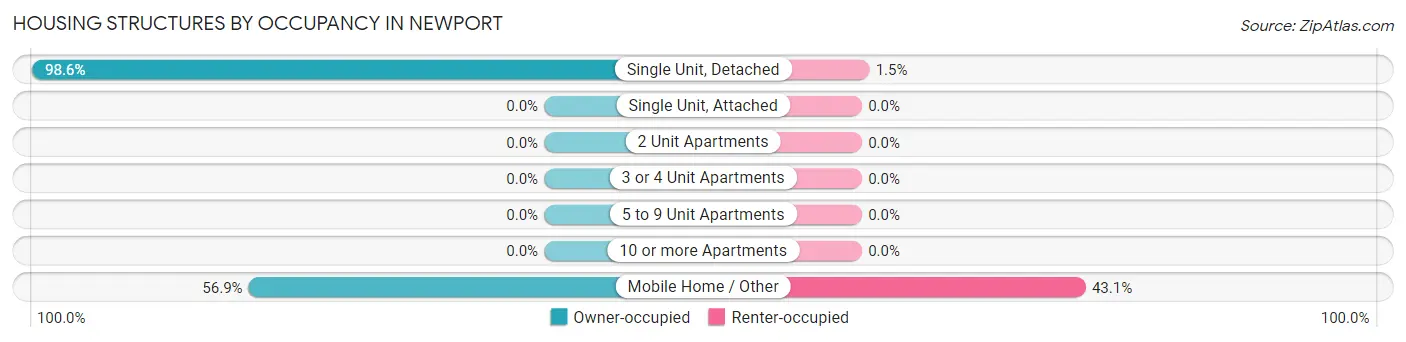
| Structure Type | Owner-occupied | Renter-occupied |
| Single Unit, Detached | 1,497 (98.6%) | 22 (1.5%) |
| Single Unit, Attached | 0 (0.0%) | 0 (0.0%) |
| 2 Unit Apartments | 0 (0.0%) | 0 (0.0%) |
| 3 or 4 Unit Apartments | 0 (0.0%) | 0 (0.0%) |
| 5 to 9 Unit Apartments | 0 (0.0%) | 0 (0.0%) |
| 10 or more Apartments | 0 (0.0%) | 0 (0.0%) |
| Mobile Home / Other | 107 (56.9%) | 81 (43.1%) |
| Total | 1,604 (94.0%) | 103 (6.0%) |
Housing Structures by Number of Rooms in Newport
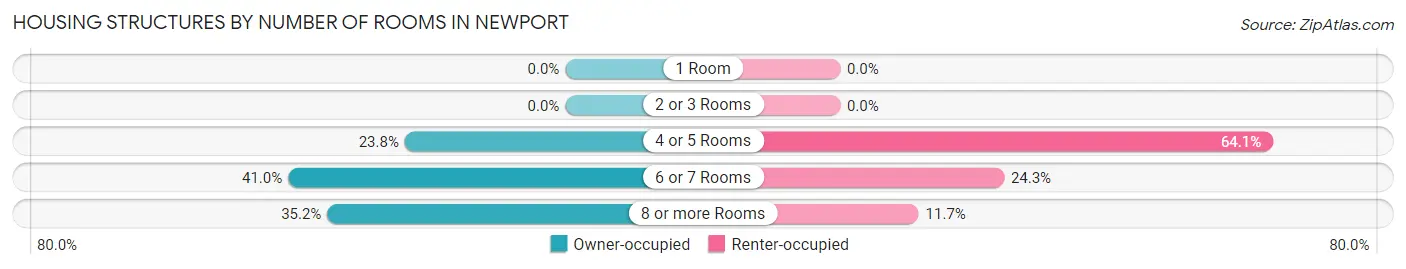
| Number of Rooms | Owner-occupied | Renter-occupied |
| 1 Room | 0 (0.0%) | 0 (0.0%) |
| 2 or 3 Rooms | 0 (0.0%) | 0 (0.0%) |
| 4 or 5 Rooms | 381 (23.7%) | 66 (64.1%) |
| 6 or 7 Rooms | 658 (41.0%) | 25 (24.3%) |
| 8 or more Rooms | 565 (35.2%) | 12 (11.7%) |
| Total | 1,604 (100.0%) | 103 (100.0%) |
Housing Structure by Heating Type in Newport
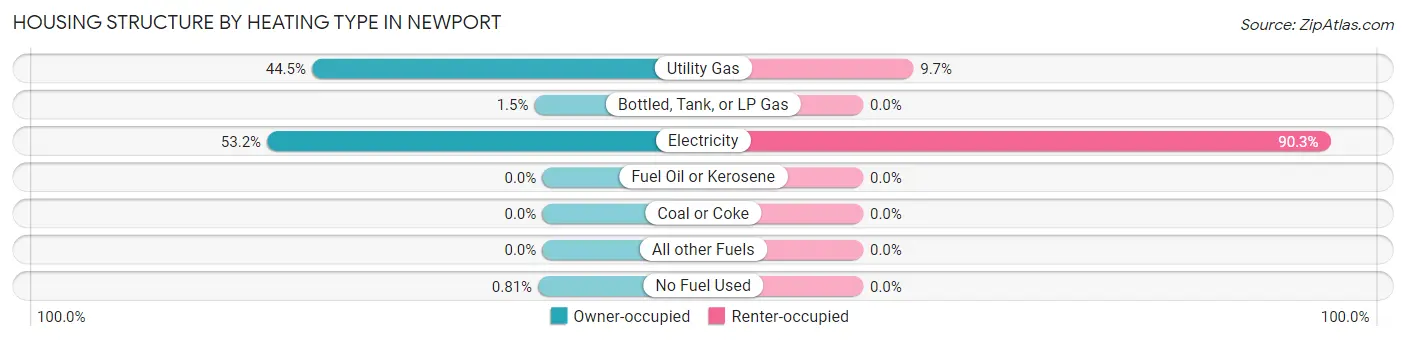
| Heating Type | Owner-occupied | Renter-occupied |
| Utility Gas | 714 (44.5%) | 10 (9.7%) |
| Bottled, Tank, or LP Gas | 24 (1.5%) | 0 (0.0%) |
| Electricity | 853 (53.2%) | 93 (90.3%) |
| Fuel Oil or Kerosene | 0 (0.0%) | 0 (0.0%) |
| Coal or Coke | 0 (0.0%) | 0 (0.0%) |
| All other Fuels | 0 (0.0%) | 0 (0.0%) |
| No Fuel Used | 13 (0.8%) | 0 (0.0%) |
| Total | 1,604 (100.0%) | 103 (100.0%) |
Household Vehicle Usage in Newport
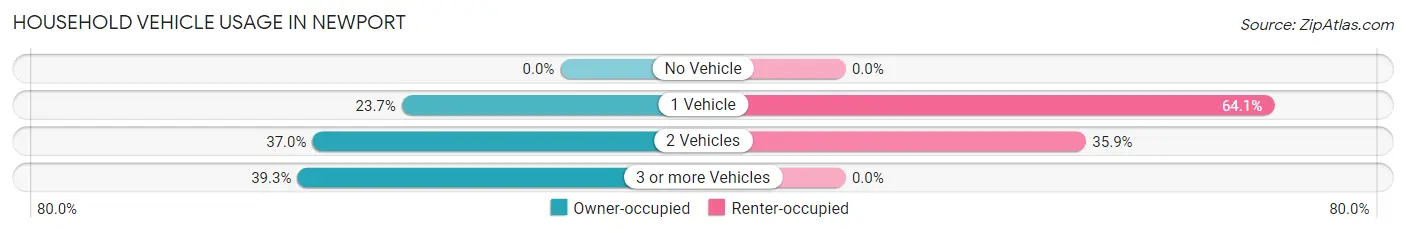
| Vehicles per Household | Owner-occupied | Renter-occupied |
| No Vehicle | 0 (0.0%) | 0 (0.0%) |
| 1 Vehicle | 380 (23.7%) | 66 (64.1%) |
| 2 Vehicles | 594 (37.0%) | 37 (35.9%) |
| 3 or more Vehicles | 630 (39.3%) | 0 (0.0%) |
| Total | 1,604 (100.0%) | 103 (100.0%) |
Real Estate & Mortgages in Newport
Real Estate and Mortgage Overview in Newport
| Characteristic | Without Mortgage | With Mortgage |
| Housing Units | 631 | 973 |
| Median Property Value | $230,100 | $290,700 |
| Median Household Income | $65,625 | $226 |
| Monthly Housing Costs | $460 | $18 |
| Real Estate Taxes | $1,209 | $0 |
Property Value by Mortgage Status in Newport
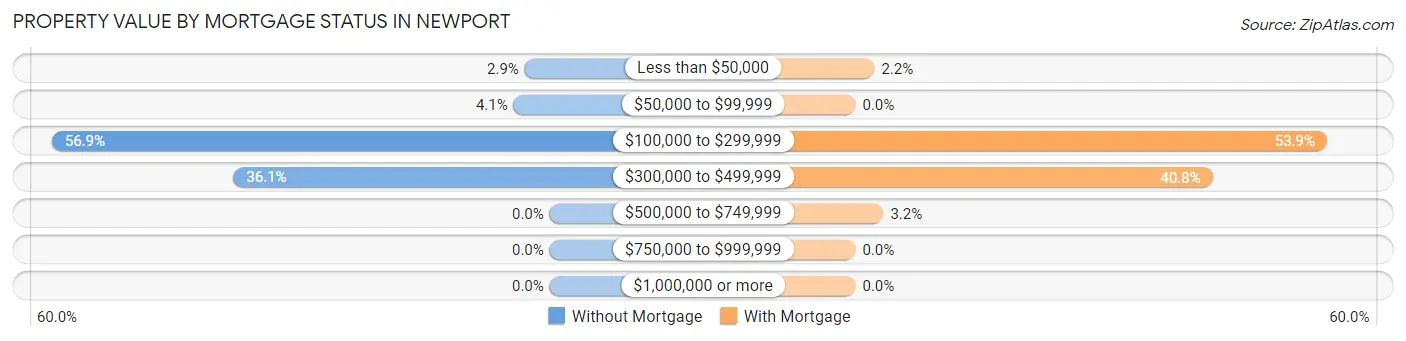
| Property Value | Without Mortgage | With Mortgage |
| Less than $50,000 | 18 (2.9%) | 21 (2.2%) |
| $50,000 to $99,999 | 26 (4.1%) | 0 (0.0%) |
| $100,000 to $299,999 | 359 (56.9%) | 524 (53.8%) |
| $300,000 to $499,999 | 228 (36.1%) | 397 (40.8%) |
| $500,000 to $749,999 | 0 (0.0%) | 31 (3.2%) |
| $750,000 to $999,999 | 0 (0.0%) | 0 (0.0%) |
| $1,000,000 or more | 0 (0.0%) | 0 (0.0%) |
| Total | 631 (100.0%) | 973 (100.0%) |
Household Income by Mortgage Status in Newport
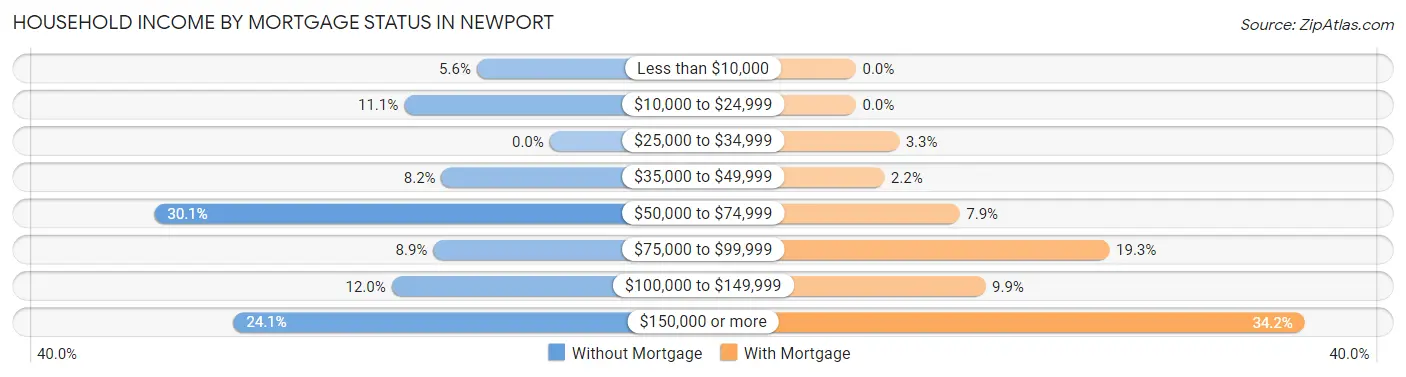
| Household Income | Without Mortgage | With Mortgage |
| Less than $10,000 | 35 (5.6%) | 0 (0.0%) |
| $10,000 to $24,999 | 70 (11.1%) | 0 (0.0%) |
| $25,000 to $34,999 | 0 (0.0%) | 32 (3.3%) |
| $35,000 to $49,999 | 52 (8.2%) | 21 (2.2%) |
| $50,000 to $74,999 | 190 (30.1%) | 77 (7.9%) |
| $75,000 to $99,999 | 56 (8.9%) | 188 (19.3%) |
| $100,000 to $149,999 | 76 (12.0%) | 96 (9.9%) |
| $150,000 or more | 152 (24.1%) | 333 (34.2%) |
| Total | 631 (100.0%) | 973 (100.0%) |
Property Value to Household Income Ratio in Newport

| Value-to-Income Ratio | Without Mortgage | With Mortgage |
| Less than 2.0x | 165 (26.2%) | 114,063 (11,722.8%) |
| 2.0x to 2.9x | 161 (25.5%) | 284 (29.2%) |
| 3.0x to 3.9x | 102 (16.2%) | 272 (28.0%) |
| 4.0x or more | 186 (29.5%) | 194 (19.9%) |
| Total | 631 (100.0%) | 973 (100.0%) |
Real Estate Taxes by Mortgage Status in Newport
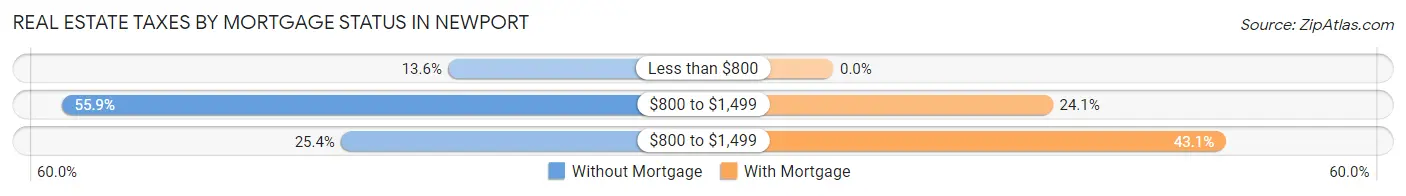
| Property Taxes | Without Mortgage | With Mortgage |
| Less than $800 | 86 (13.6%) | 0 (0.0%) |
| $800 to $1,499 | 353 (55.9%) | 234 (24.0%) |
| $800 to $1,499 | 160 (25.4%) | 419 (43.1%) |
| Total | 631 (100.0%) | 973 (100.0%) |
Health & Disability in Newport
Health Insurance Coverage by Age in Newport
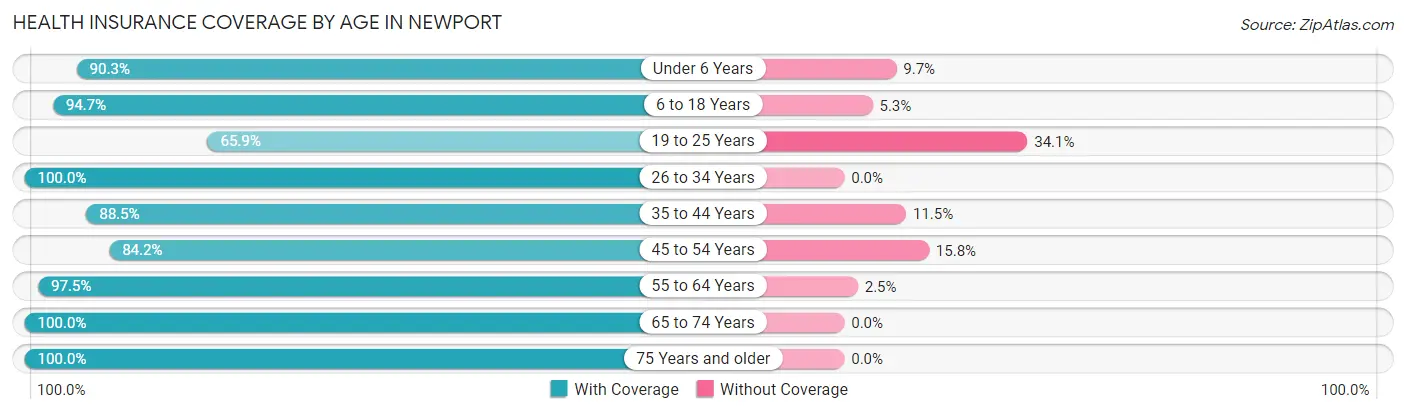
| Age Bracket | With Coverage | Without Coverage |
| Under 6 Years | 242 (90.3%) | 26 (9.7%) |
| 6 to 18 Years | 450 (94.7%) | 25 (5.3%) |
| 19 to 25 Years | 166 (65.9%) | 86 (34.1%) |
| 26 to 34 Years | 368 (100.0%) | 0 (0.0%) |
| 35 to 44 Years | 769 (88.5%) | 100 (11.5%) |
| 45 to 54 Years | 347 (84.2%) | 65 (15.8%) |
| 55 to 64 Years | 657 (97.5%) | 17 (2.5%) |
| 65 to 74 Years | 470 (100.0%) | 0 (0.0%) |
| 75 Years and older | 438 (100.0%) | 0 (0.0%) |
| Total | 3,907 (92.4%) | 319 (7.5%) |
Health Insurance Coverage by Citizenship Status in Newport
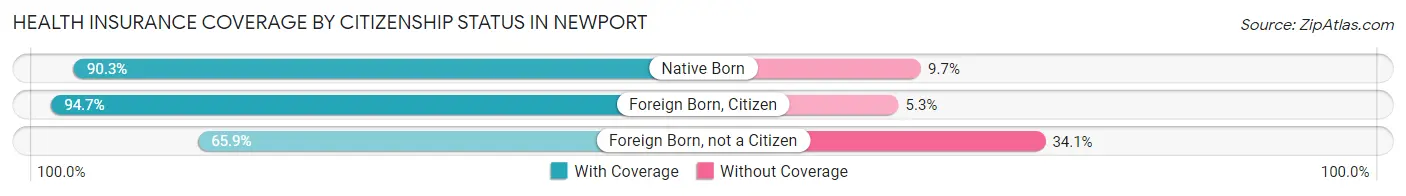
| Citizenship Status | With Coverage | Without Coverage |
| Native Born | 242 (90.3%) | 26 (9.7%) |
| Foreign Born, Citizen | 450 (94.7%) | 25 (5.3%) |
| Foreign Born, not a Citizen | 166 (65.9%) | 86 (34.1%) |
Health Insurance Coverage by Household Income in Newport
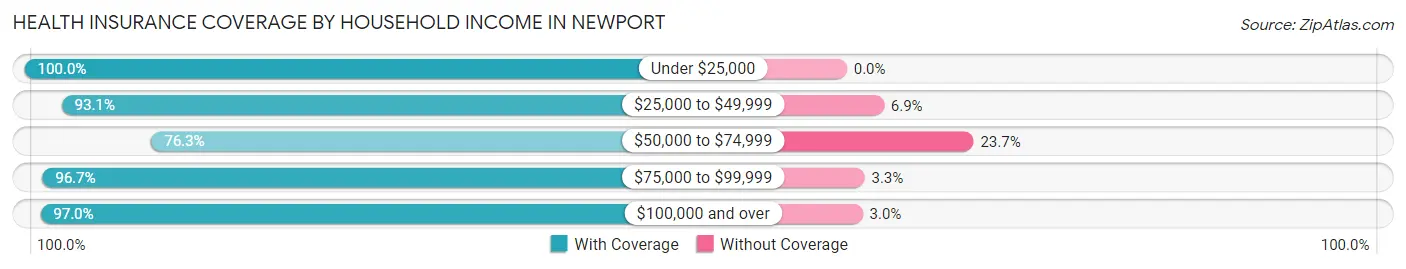
| Household Income | With Coverage | Without Coverage |
| Under $25,000 | 263 (100.0%) | 0 (0.0%) |
| $25,000 to $49,999 | 228 (93.1%) | 17 (6.9%) |
| $50,000 to $74,999 | 697 (76.3%) | 217 (23.7%) |
| $75,000 to $99,999 | 554 (96.7%) | 19 (3.3%) |
| $100,000 and over | 2,163 (97.0%) | 66 (3.0%) |
Public vs Private Health Insurance Coverage by Age in Newport
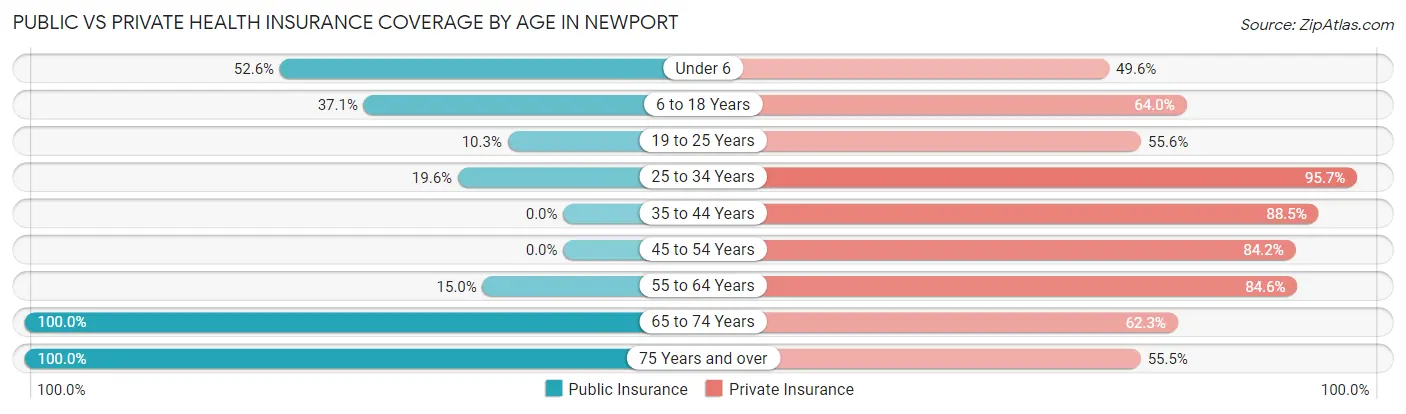
| Age Bracket | Public Insurance | Private Insurance |
| Under 6 | 141 (52.6%) | 133 (49.6%) |
| 6 to 18 Years | 176 (37.0%) | 304 (64.0%) |
| 19 to 25 Years | 26 (10.3%) | 140 (55.6%) |
| 25 to 34 Years | 72 (19.6%) | 352 (95.7%) |
| 35 to 44 Years | 0 (0.0%) | 769 (88.5%) |
| 45 to 54 Years | 0 (0.0%) | 347 (84.2%) |
| 55 to 64 Years | 101 (15.0%) | 570 (84.6%) |
| 65 to 74 Years | 470 (100.0%) | 293 (62.3%) |
| 75 Years and over | 438 (100.0%) | 243 (55.5%) |
| Total | 1,424 (33.7%) | 3,151 (74.6%) |
Disability Status by Sex by Age in Newport
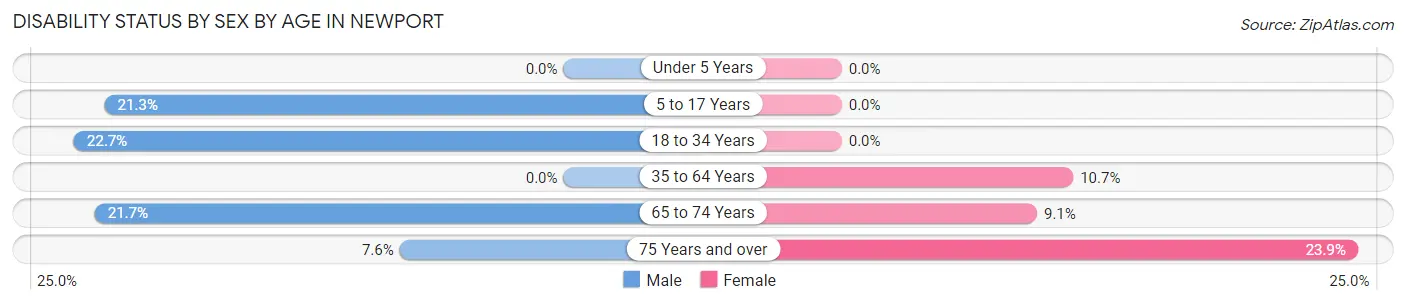
| Age Bracket | Male | Female |
| Under 5 Years | 0 (0.0%) | 0 (0.0%) |
| 5 to 17 Years | 43 (21.3%) | 0 (0.0%) |
| 18 to 34 Years | 72 (22.7%) | 0 (0.0%) |
| 35 to 64 Years | 0 (0.0%) | 100 (10.7%) |
| 65 to 74 Years | 35 (21.7%) | 28 (9.1%) |
| 75 Years and over | 19 (7.6%) | 45 (23.9%) |
Disability Class by Sex by Age in Newport
Disability Class: Hearing Difficulty
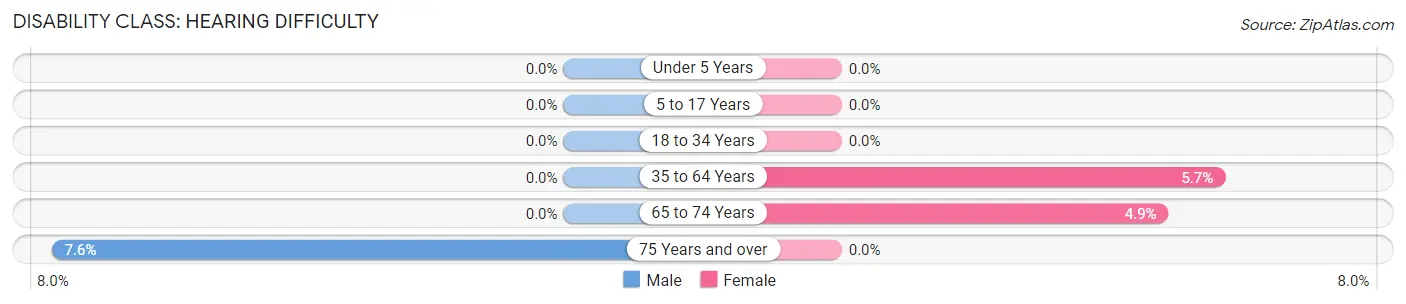
| Age Bracket | Male | Female |
| Under 5 Years | 0 (0.0%) | 0 (0.0%) |
| 5 to 17 Years | 0 (0.0%) | 0 (0.0%) |
| 18 to 34 Years | 0 (0.0%) | 0 (0.0%) |
| 35 to 64 Years | 0 (0.0%) | 53 (5.7%) |
| 65 to 74 Years | 0 (0.0%) | 15 (4.9%) |
| 75 Years and over | 19 (7.6%) | 0 (0.0%) |
Disability Class: Vision Difficulty
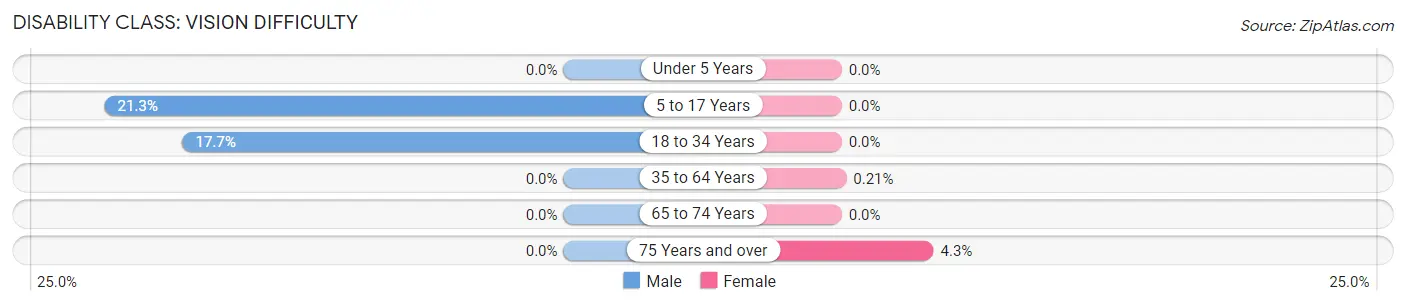
| Age Bracket | Male | Female |
| Under 5 Years | 0 (0.0%) | 0 (0.0%) |
| 5 to 17 Years | 43 (21.3%) | 0 (0.0%) |
| 18 to 34 Years | 56 (17.7%) | 0 (0.0%) |
| 35 to 64 Years | 0 (0.0%) | 2 (0.2%) |
| 65 to 74 Years | 0 (0.0%) | 0 (0.0%) |
| 75 Years and over | 0 (0.0%) | 8 (4.3%) |
Disability Class: Cognitive Difficulty
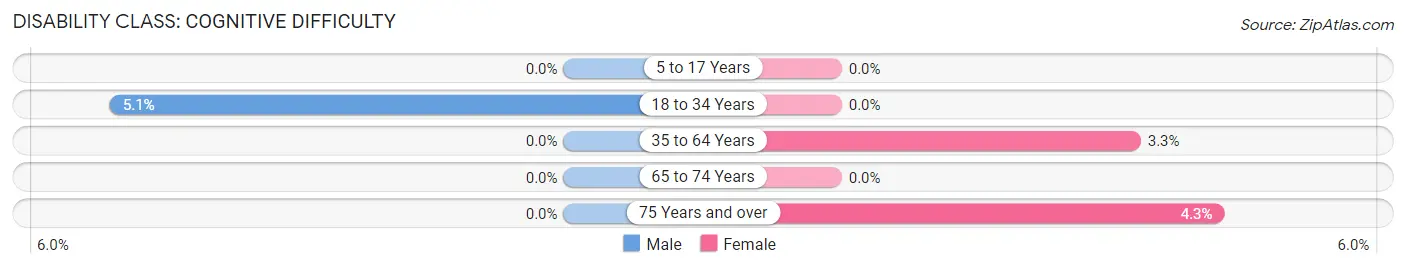
| Age Bracket | Male | Female |
| 5 to 17 Years | 0 (0.0%) | 0 (0.0%) |
| 18 to 34 Years | 16 (5.1%) | 0 (0.0%) |
| 35 to 64 Years | 0 (0.0%) | 31 (3.3%) |
| 65 to 74 Years | 0 (0.0%) | 0 (0.0%) |
| 75 Years and over | 0 (0.0%) | 8 (4.3%) |
Disability Class: Ambulatory Difficulty

| Age Bracket | Male | Female |
| 5 to 17 Years | 0 (0.0%) | 0 (0.0%) |
| 18 to 34 Years | 0 (0.0%) | 0 (0.0%) |
| 35 to 64 Years | 0 (0.0%) | 87 (9.3%) |
| 65 to 74 Years | 35 (21.7%) | 13 (4.2%) |
| 75 Years and over | 0 (0.0%) | 45 (23.9%) |
Disability Class: Self-Care Difficulty
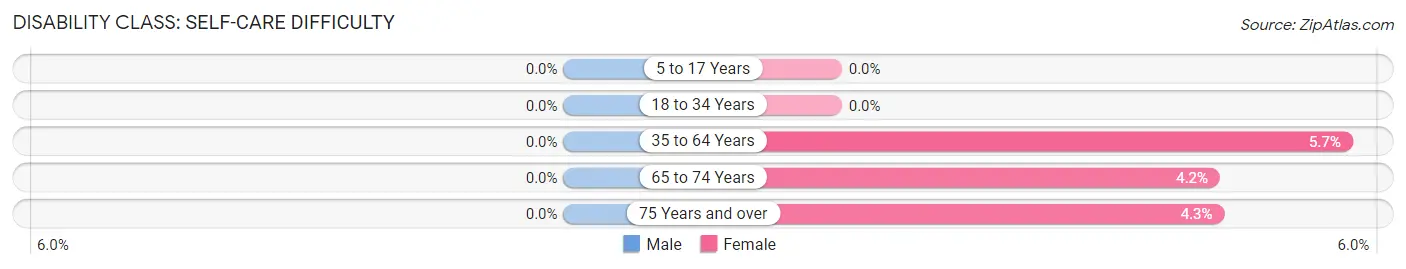
| Age Bracket | Male | Female |
| 5 to 17 Years | 0 (0.0%) | 0 (0.0%) |
| 18 to 34 Years | 0 (0.0%) | 0 (0.0%) |
| 35 to 64 Years | 0 (0.0%) | 53 (5.7%) |
| 65 to 74 Years | 0 (0.0%) | 13 (4.2%) |
| 75 Years and over | 0 (0.0%) | 8 (4.3%) |
Technology Access in Newport
Computing Device Access in Newport
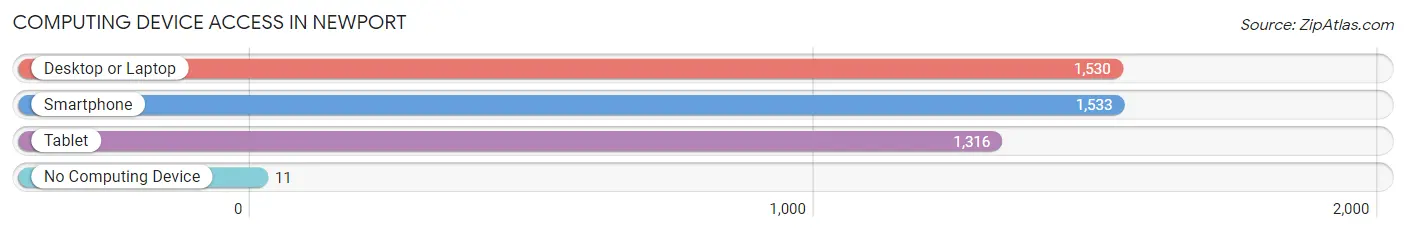
| Device Type | # Households | % Households |
| Desktop or Laptop | 1,530 | 89.6% |
| Smartphone | 1,533 | 89.8% |
| Tablet | 1,316 | 77.1% |
| No Computing Device | 11 | 0.6% |
| Total | 1,707 | 100.0% |
Internet Access in Newport
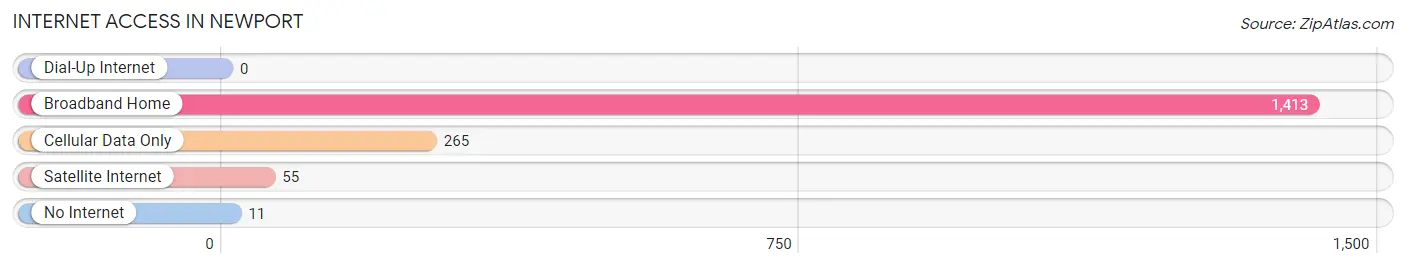
| Internet Type | # Households | % Households |
| Dial-Up Internet | 0 | 0.0% |
| Broadband Home | 1,413 | 82.8% |
| Cellular Data Only | 265 | 15.5% |
| Satellite Internet | 55 | 3.2% |
| No Internet | 11 | 0.6% |
| Total | 1,707 | 100.0% |
Newport Summary
Newport is a small town located in the state of South Carolina, United States. It is situated in the northeastern corner of the state, near the border with North Carolina. The town has a population of approximately 1,000 people and is part of the larger Horry County.
History
Newport was first settled in the late 1700s by a group of settlers from North Carolina. The town was originally known as “Newport Landing” and was a popular stop for travelers heading to and from the nearby port of Georgetown. In 1820, the town was officially incorporated and renamed Newport.
During the Civil War, Newport was a major Confederate stronghold and was the site of several battles. After the war, the town experienced a period of growth and prosperity, with the establishment of several businesses and industries.
Geography
Newport is located in the northeastern corner of South Carolina, near the border with North Carolina. The town is situated on the banks of the Waccamaw River, which flows through the area. The town is surrounded by a number of small towns and villages, including Loris, Conway, and Aynor.
The town is located in a humid subtropical climate zone, with hot, humid summers and mild winters. The average annual temperature is around 70 degrees Fahrenheit (21 degrees Celsius).
Economy
The economy of Newport is largely based on agriculture and tourism. The town is home to several farms, which produce a variety of crops, including corn, soybeans, and cotton. The town is also home to several tourist attractions, including the Waccamaw River, the Waccamaw National Wildlife Refuge, and the Waccamaw State Park.
In addition, Newport is home to several small businesses, including restaurants, retail stores, and service providers. The town is also home to a number of manufacturing companies, which produce a variety of products, including furniture, clothing, and electronics.
Demographics
As of the 2010 census, the population of Newport was 1,000 people. The racial makeup of the town was 94.2% White, 3.2% African American, 0.7% Native American, 0.3% Asian, and 1.6% from other races. The median household income was $35,000, and the median family income was $41,000.
Conclusion
Newport is a small town located in the northeastern corner of South Carolina, near the border with North Carolina. The town has a population of approximately 1,000 people and is part of the larger Horry County. The economy of Newport is largely based on agriculture and tourism, and the town is home to several small businesses, farms, and tourist attractions. The racial makeup of the town is 94.2% White, 3.2% African American, 0.7% Native American, 0.3% Asian, and 1.6% from other races. The median household income was $35,000, and the median family income was $41,000.
Common Questions
What is the Total Population of Newport?
Total Population of Newport is 4,226.
What is the Total Male Population of Newport?
Total Male Population of Newport is 1,980.
What is the Total Female Population of Newport?
Total Female Population of Newport is 2,246.
What is the Ratio of Males per 100 Females in Newport?
There are 88.16 Males per 100 Females in Newport.
What is the Ratio of Females per 100 Males in Newport?
There are 113.43 Females per 100 Males in Newport.
What is the Median Population Age in Newport?
Median Population Age in Newport is 43.4 Years.
What is the Average Family Size in Newport
Average Family Size in Newport is 3.0 People.
What is the Average Household Size in Newport
Average Household Size in Newport is 2.5 People.
What is Per Capita Income in Newport?
Per Capita income in Newport is $44,694.
What is the Median Family Income in Newport?
Median Family Income in Newport is $119,451.
What is the Median Household income in Newport?
Median Household Income in Newport is $92,083.
What is Income or Wage Gap in Newport?
Income or Wage Gap in Newport is 36.6%.
Women in Newport earn 63.4 cents for every dollar earned by a man.
What is Inequality or Gini Index in Newport?
Inequality or Gini Index in Newport is 0.40.
How Large is the Labor Force in Newport?
There are 2,399 People in the Labor Forcein in Newport.
What is the Percentage of People in the Labor Force in Newport?
66.1% of People are in the Labor Force in Newport.
What is the Unemployment Rate in Newport?
Unemployment Rate in Newport is 0.4%.