Shell Point, SC
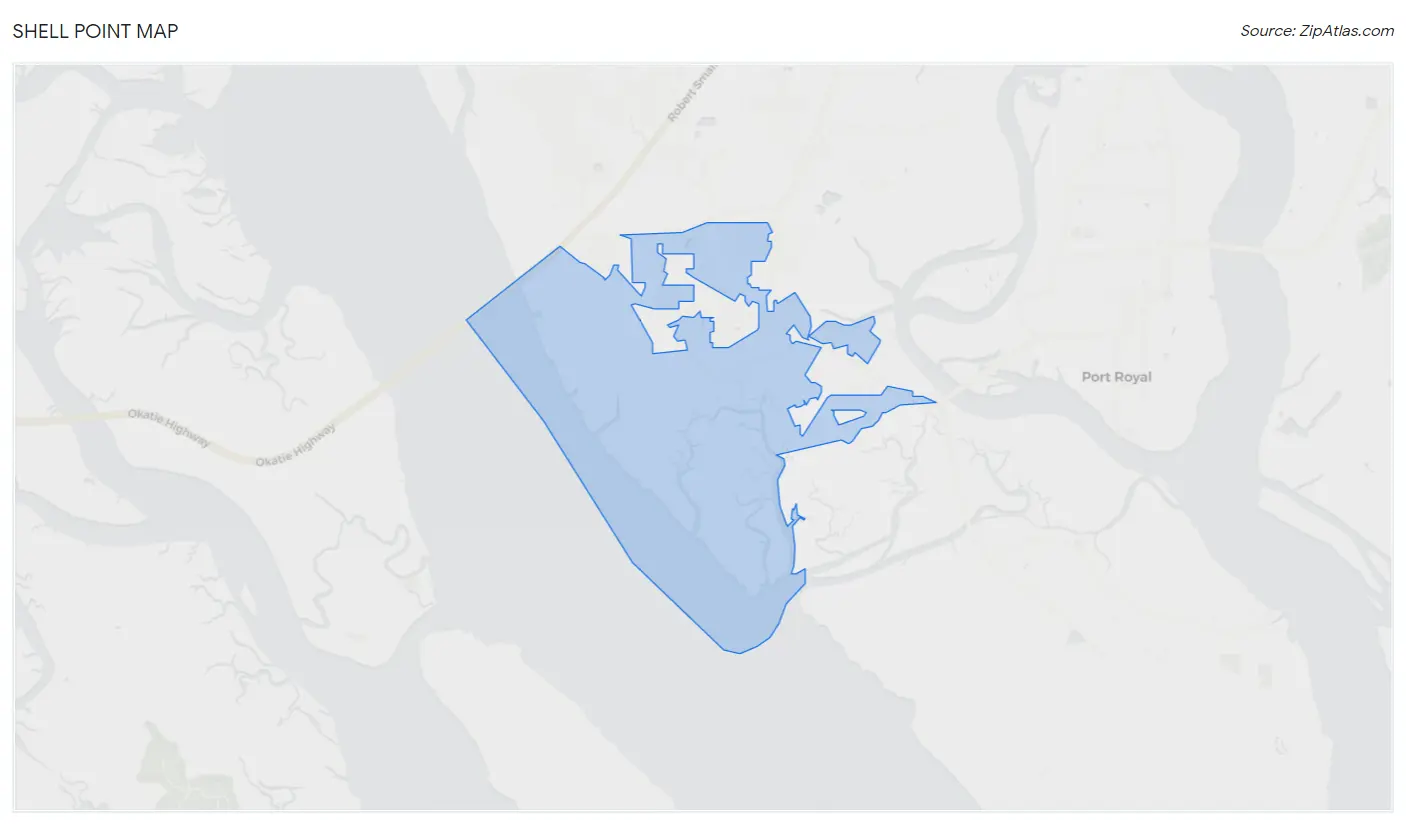
Shell Point Map
Shell Point Overview
2,026
TOTAL POPULATION
957
MALE POPULATION
1,069
FEMALE POPULATION
89.52
MALES / 100 FEMALES
111.70
FEMALES / 100 MALES
30.1
MEDIAN AGE
3.2
AVG FAMILY SIZE
2.5
AVG HOUSEHOLD SIZE
$28,411
PER CAPITA INCOME
$63,305
AVG FAMILY INCOME
$60,676
AVG HOUSEHOLD INCOME
26.4%
WAGE / INCOME GAP [ % ]
73.6¢/ $1
WAGE / INCOME GAP [ $ ]
0.41
INEQUALITY / GINI INDEX
961
LABOR FORCE [ PEOPLE ]
62.5%
PERCENT IN LABOR FORCE
8.8%
UNEMPLOYMENT RATE
Race in Shell Point
The most populous races in Shell Point are White / Caucasian (1,372 | 67.7%), Black / African American (524 | 25.9%), and Hispanic or Latino (182 | 9.0%).
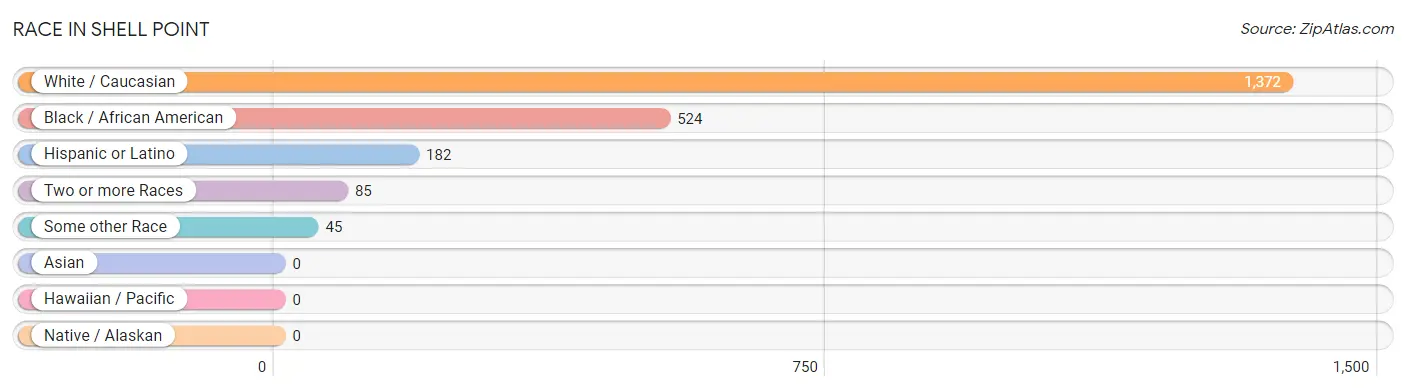
| Race | # Population | % Population |
| Asian | 0 | 0.0% |
| Black / African American | 524 | 25.9% |
| Hawaiian / Pacific | 0 | 0.0% |
| Hispanic or Latino | 182 | 9.0% |
| Native / Alaskan | 0 | 0.0% |
| White / Caucasian | 1,372 | 67.7% |
| Two or more Races | 85 | 4.2% |
| Some other Race | 45 | 2.2% |
| Total | 2,026 | 100.0% |
Ancestry in Shell Point
The most populous ancestries reported in Shell Point are German (168 | 8.3%), Irish (155 | 7.6%), Scottish (144 | 7.1%), American (126 | 6.2%), and English (115 | 5.7%), together accounting for 34.9% of all Shell Point residents.
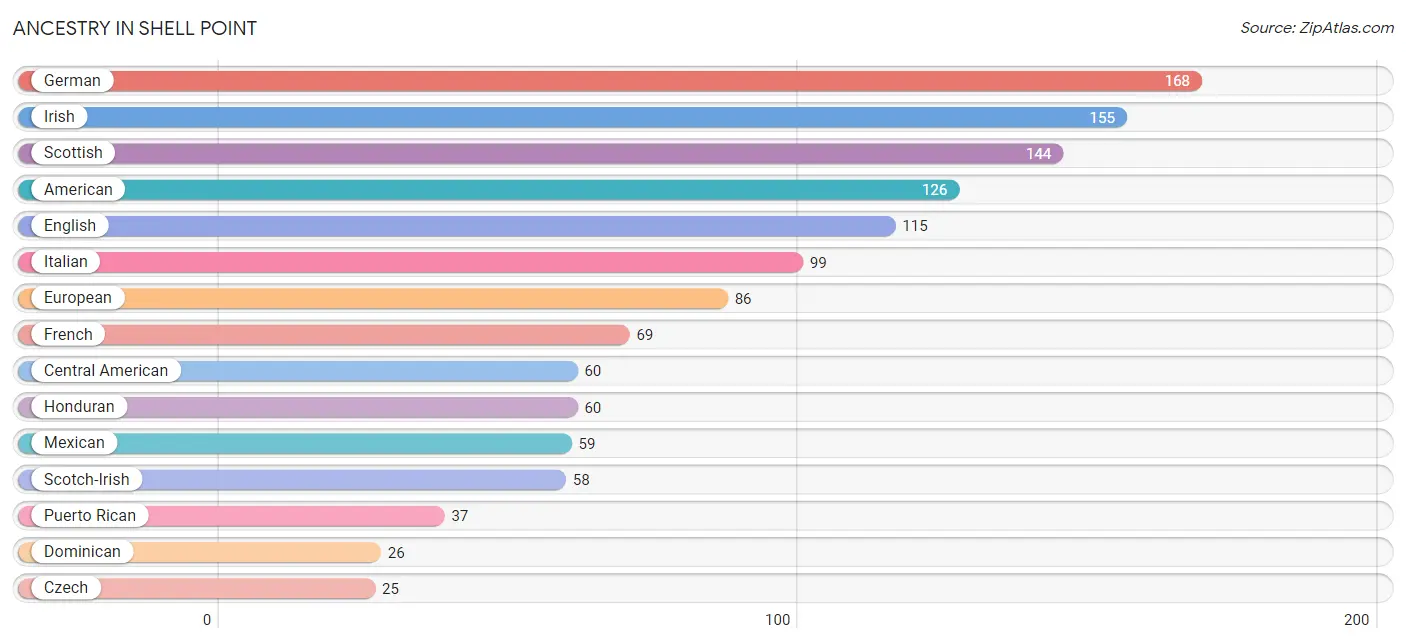
| Ancestry | # Population | % Population |
| American | 126 | 6.2% |
| Central American | 60 | 3.0% |
| Cherokee | 5 | 0.3% |
| Czech | 25 | 1.2% |
| Dominican | 26 | 1.3% |
| English | 115 | 5.7% |
| European | 86 | 4.2% |
| French | 69 | 3.4% |
| German | 168 | 8.3% |
| Honduran | 60 | 3.0% |
| Irish | 155 | 7.6% |
| Italian | 99 | 4.9% |
| Mexican | 59 | 2.9% |
| Norwegian | 19 | 0.9% |
| Polish | 17 | 0.8% |
| Puerto Rican | 37 | 1.8% |
| Russian | 12 | 0.6% |
| Scotch-Irish | 58 | 2.9% |
| Scottish | 144 | 7.1% |
| Slovak | 16 | 0.8% | View All 20 Rows |
Immigrants in Shell Point
The most numerous immigrant groups reported in Shell Point came from Europe (38 | 1.9%), Italy (22 | 1.1%), Southern Europe (22 | 1.1%), Central America (19 | 0.9%), and Honduras (19 | 0.9%), together accounting for 5.9% of all Shell Point residents.
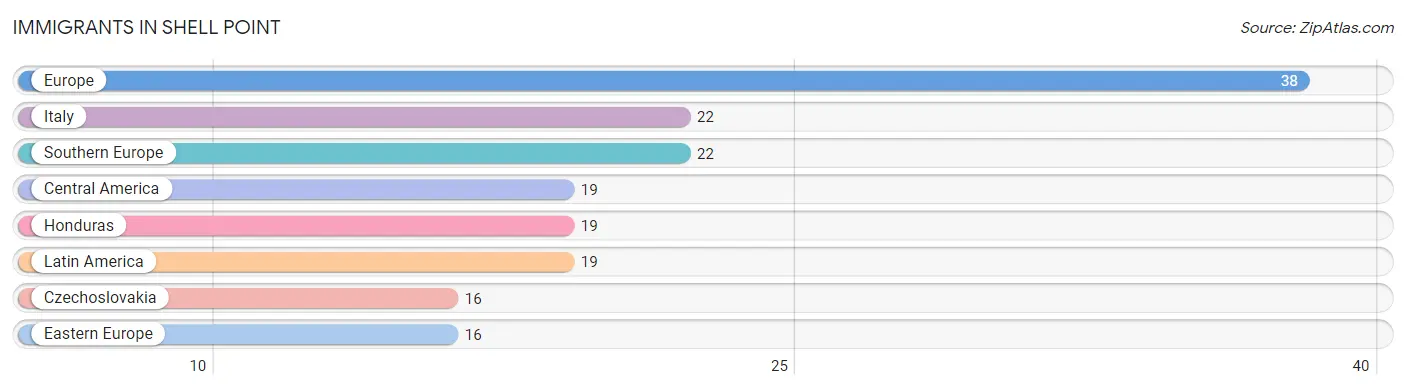
| Immigration Origin | # Population | % Population |
| Central America | 19 | 0.9% |
| Czechoslovakia | 16 | 0.8% |
| Eastern Europe | 16 | 0.8% |
| Europe | 38 | 1.9% |
| Honduras | 19 | 0.9% |
| Italy | 22 | 1.1% |
| Latin America | 19 | 0.9% |
| Southern Europe | 22 | 1.1% | View All 8 Rows |
Sex and Age in Shell Point
Sex and Age in Shell Point
The most populous age groups in Shell Point are 5 to 9 Years (130 | 13.6%) for men and 25 to 29 Years (178 | 16.7%) for women.
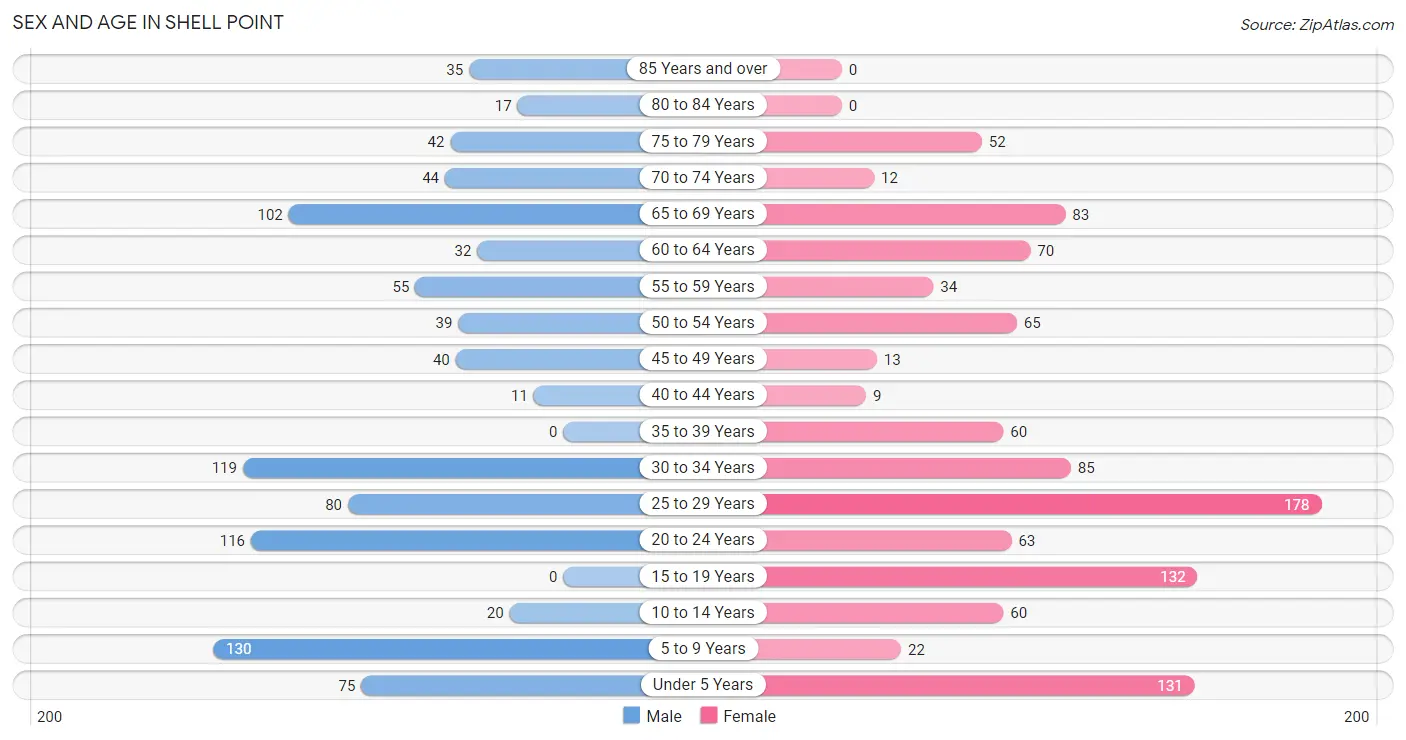
| Age Bracket | Male | Female |
| Under 5 Years | 75 (7.8%) | 131 (12.2%) |
| 5 to 9 Years | 130 (13.6%) | 22 (2.1%) |
| 10 to 14 Years | 20 (2.1%) | 60 (5.6%) |
| 15 to 19 Years | 0 (0.0%) | 132 (12.3%) |
| 20 to 24 Years | 116 (12.1%) | 63 (5.9%) |
| 25 to 29 Years | 80 (8.4%) | 178 (16.7%) |
| 30 to 34 Years | 119 (12.4%) | 85 (8.0%) |
| 35 to 39 Years | 0 (0.0%) | 60 (5.6%) |
| 40 to 44 Years | 11 (1.1%) | 9 (0.8%) |
| 45 to 49 Years | 40 (4.2%) | 13 (1.2%) |
| 50 to 54 Years | 39 (4.1%) | 65 (6.1%) |
| 55 to 59 Years | 55 (5.8%) | 34 (3.2%) |
| 60 to 64 Years | 32 (3.3%) | 70 (6.6%) |
| 65 to 69 Years | 102 (10.7%) | 83 (7.8%) |
| 70 to 74 Years | 44 (4.6%) | 12 (1.1%) |
| 75 to 79 Years | 42 (4.4%) | 52 (4.9%) |
| 80 to 84 Years | 17 (1.8%) | 0 (0.0%) |
| 85 Years and over | 35 (3.7%) | 0 (0.0%) |
| Total | 957 (100.0%) | 1,069 (100.0%) |
Families and Households in Shell Point
Median Family Size in Shell Point
The median family size in Shell Point is 3.25 persons per family, with married-couple families (300 | 60.2%) accounting for the largest median family size of 3.57 persons per family. On the other hand, single female/mother families (180 | 36.1%) represent the smallest median family size with 2.73 persons per family.
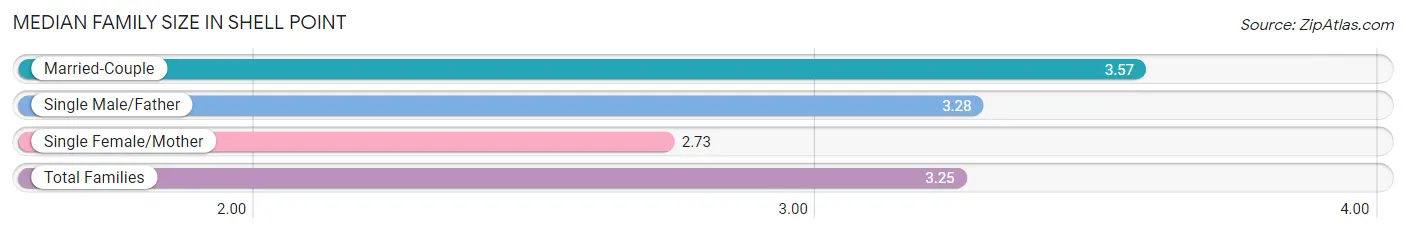
| Family Type | # Families | Family Size |
| Married-Couple | 300 (60.2%) | 3.57 |
| Single Male/Father | 18 (3.6%) | 3.28 |
| Single Female/Mother | 180 (36.1%) | 2.73 |
| Total Families | 498 (100.0%) | 3.25 |
Median Household Size in Shell Point
The median household size in Shell Point is 2.51 persons per household, with single male/father households (18 | 2.2%) accounting for the largest median household size of 4.33 persons per household. non-family households (309 | 38.3%) represent the smallest median household size with 1.20 persons per household.
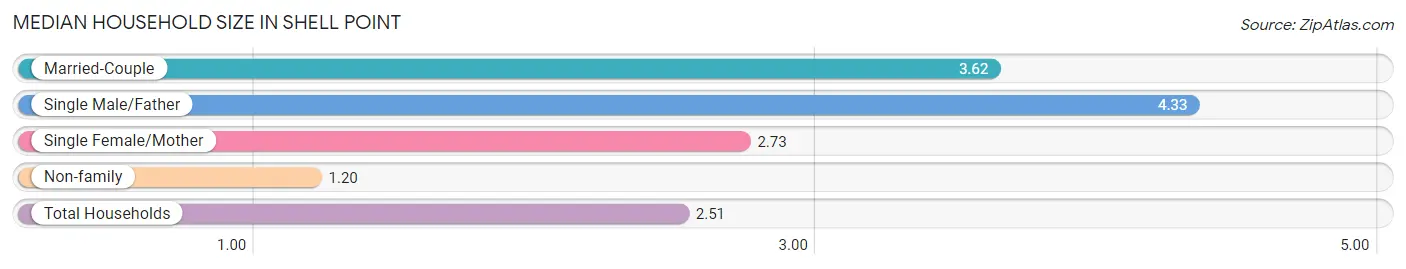
| Household Type | # Households | Household Size |
| Married-Couple | 300 (37.2%) | 3.62 |
| Single Male/Father | 18 (2.2%) | 4.33 |
| Single Female/Mother | 180 (22.3%) | 2.73 |
| Non-family | 309 (38.3%) | 1.20 |
| Total Households | 807 (100.0%) | 2.51 |
Household Size by Marriage Status in Shell Point
Out of a total of 807 households in Shell Point, 498 (61.7%) are family households, while 309 (38.3%) are nonfamily households. The most numerous type of family households are 3-person households, comprising 198, and the most common type of nonfamily households are 1-person households, comprising 252.
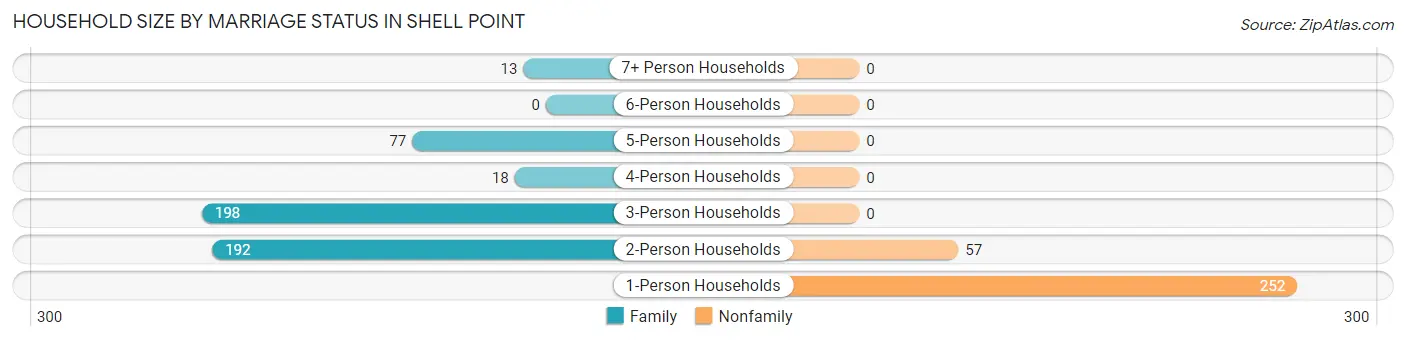
| Household Size | Family Households | Nonfamily Households |
| 1-Person Households | - | 252 (31.2%) |
| 2-Person Households | 192 (23.8%) | 57 (7.1%) |
| 3-Person Households | 198 (24.5%) | 0 (0.0%) |
| 4-Person Households | 18 (2.2%) | 0 (0.0%) |
| 5-Person Households | 77 (9.5%) | 0 (0.0%) |
| 6-Person Households | 0 (0.0%) | 0 (0.0%) |
| 7+ Person Households | 13 (1.6%) | 0 (0.0%) |
| Total | 498 (61.7%) | 309 (38.3%) |
Female Fertility in Shell Point
Fertility by Age in Shell Point
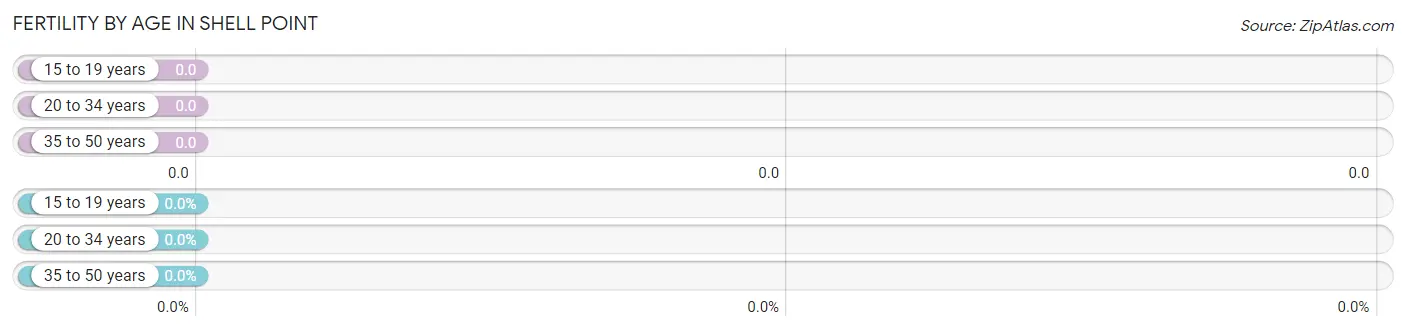
| Age Bracket | Women with Births | Births / 1,000 Women |
| 15 to 19 years | 0 (0.0%) | 0.0 |
| 20 to 34 years | 0 (0.0%) | 0.0 |
| 35 to 50 years | 0 (0.0%) | 0.0 |
| Total | 0 (0.0%) | 0.0 |
Fertility by Age by Marriage Status in Shell Point
| Age Bracket | Married | Unmarried |
| 15 to 19 years | 0 (0.0%) | 0 (0.0%) |
| 20 to 34 years | 0 (0.0%) | 0 (0.0%) |
| 35 to 50 years | 0 (0.0%) | 0 (0.0%) |
| Total | 0 (0.0%) | 0 (0.0%) |
Fertility by Education in Shell Point
| Educational Attainment | Women with Births | Births / 1,000 Women |
| Less than High School | 0 (0.0%) | 0.0 |
| High School Diploma | 0 (0.0%) | 0.0 |
| College or Associate's Degree | 0 (0.0%) | 0.0 |
| Bachelor's Degree | 0 (0.0%) | 0.0 |
| Graduate Degree | 0 (0.0%) | 0.0 |
| Total | 0 (0.0%) | 0.0 |
Fertility by Education by Marriage Status in Shell Point
| Educational Attainment | Married | Unmarried |
| Less than High School | 0 (0.0%) | 0 (0.0%) |
| High School Diploma | 0 (0.0%) | 0 (0.0%) |
| College or Associate's Degree | 0 (0.0%) | 0 (0.0%) |
| Bachelor's Degree | 0 (0.0%) | 0 (0.0%) |
| Graduate Degree | 0 (0.0%) | 0 (0.0%) |
| Total | 0 (0.0%) | 0 (0.0%) |
Income in Shell Point
Income Overview in Shell Point
Per Capita Income in Shell Point is $28,411, while median incomes of families and households are $63,305 and $60,676 respectively.
| Characteristic | Number | Measure |
| Per Capita Income | 2,026 | $28,411 |
| Median Family Income | 498 | $63,305 |
| Mean Family Income | 498 | $77,757 |
| Median Household Income | 807 | $60,676 |
| Mean Household Income | 807 | $68,782 |
| Income Deficit | 498 | $0 |
| Wage / Income Gap (%) | 2,026 | 26.42% |
| Wage / Income Gap ($) | 2,026 | 73.58¢ per $1 |
| Gini / Inequality Index | 2,026 | 0.41 |
Earnings by Sex in Shell Point
Average Earnings in Shell Point are $31,143, $40,826 for men and $30,039 for women, a difference of 26.4%.
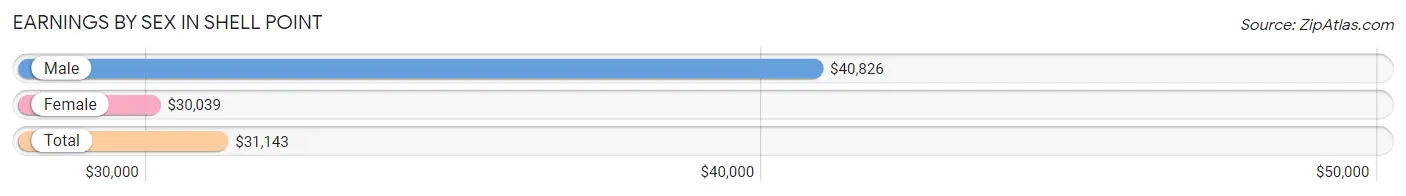
| Sex | Number | Average Earnings |
| Male | 495 (48.5%) | $40,826 |
| Female | 526 (51.5%) | $30,039 |
| Total | 1,021 (100.0%) | $31,143 |
Earnings by Sex by Income Bracket in Shell Point
The most common earnings brackets in Shell Point are $2,499 or less for men (66 | 13.3%) and $30,000 to $34,999 for women (96 | 18.2%).
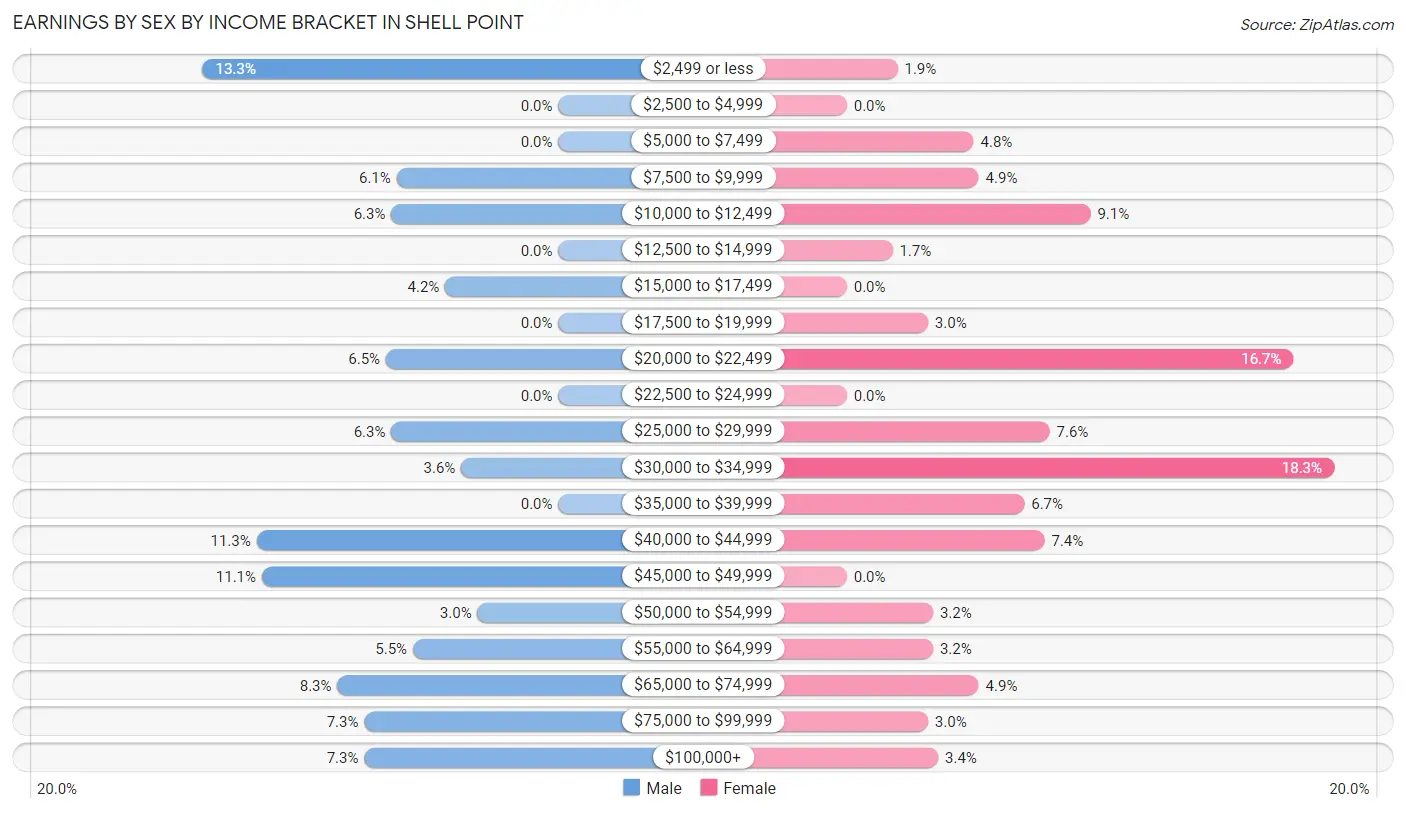
| Income | Male | Female |
| $2,499 or less | 66 (13.3%) | 10 (1.9%) |
| $2,500 to $4,999 | 0 (0.0%) | 0 (0.0%) |
| $5,000 to $7,499 | 0 (0.0%) | 25 (4.8%) |
| $7,500 to $9,999 | 30 (6.1%) | 26 (4.9%) |
| $10,000 to $12,499 | 31 (6.3%) | 48 (9.1%) |
| $12,500 to $14,999 | 0 (0.0%) | 9 (1.7%) |
| $15,000 to $17,499 | 21 (4.2%) | 0 (0.0%) |
| $17,500 to $19,999 | 0 (0.0%) | 16 (3.0%) |
| $20,000 to $22,499 | 32 (6.5%) | 88 (16.7%) |
| $22,500 to $24,999 | 0 (0.0%) | 0 (0.0%) |
| $25,000 to $29,999 | 31 (6.3%) | 40 (7.6%) |
| $30,000 to $34,999 | 18 (3.6%) | 96 (18.2%) |
| $35,000 to $39,999 | 0 (0.0%) | 35 (6.7%) |
| $40,000 to $44,999 | 56 (11.3%) | 39 (7.4%) |
| $45,000 to $49,999 | 55 (11.1%) | 0 (0.0%) |
| $50,000 to $54,999 | 15 (3.0%) | 17 (3.2%) |
| $55,000 to $64,999 | 27 (5.4%) | 17 (3.2%) |
| $65,000 to $74,999 | 41 (8.3%) | 26 (4.9%) |
| $75,000 to $99,999 | 36 (7.3%) | 16 (3.0%) |
| $100,000+ | 36 (7.3%) | 18 (3.4%) |
| Total | 495 (100.0%) | 526 (100.0%) |
Earnings by Sex by Educational Attainment in Shell Point
Average earnings in Shell Point are $48,432 for men and $30,559 for women, a difference of 36.9%. Men with an educational attainment of bachelor's degree enjoy the highest average annual earnings of $66,250, while those with college or associate's degree education earn the least with $47,955. Women with an educational attainment of bachelor's degree earn the most with the average annual earnings of $74,135, while those with college or associate's degree education have the smallest earnings of $22,415.
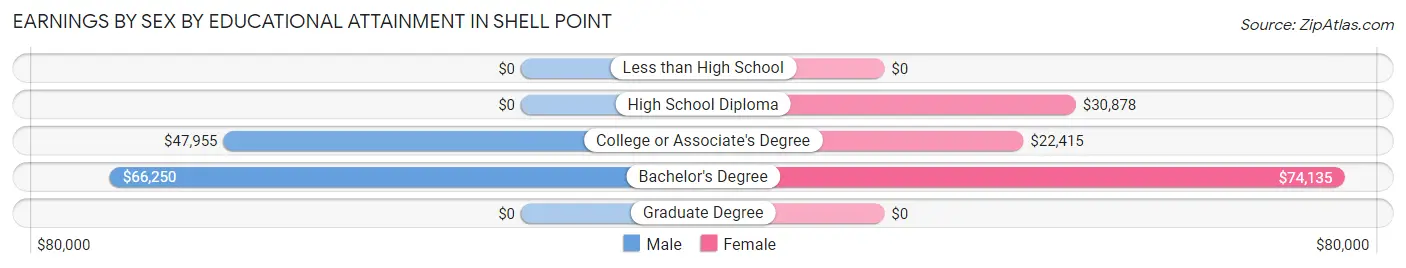
| Educational Attainment | Male Income | Female Income |
| Less than High School | - | - |
| High School Diploma | - | - |
| College or Associate's Degree | $47,955 | $22,415 |
| Bachelor's Degree | $66,250 | $74,135 |
| Graduate Degree | - | - |
| Total | $48,432 | $30,559 |
Family Income in Shell Point
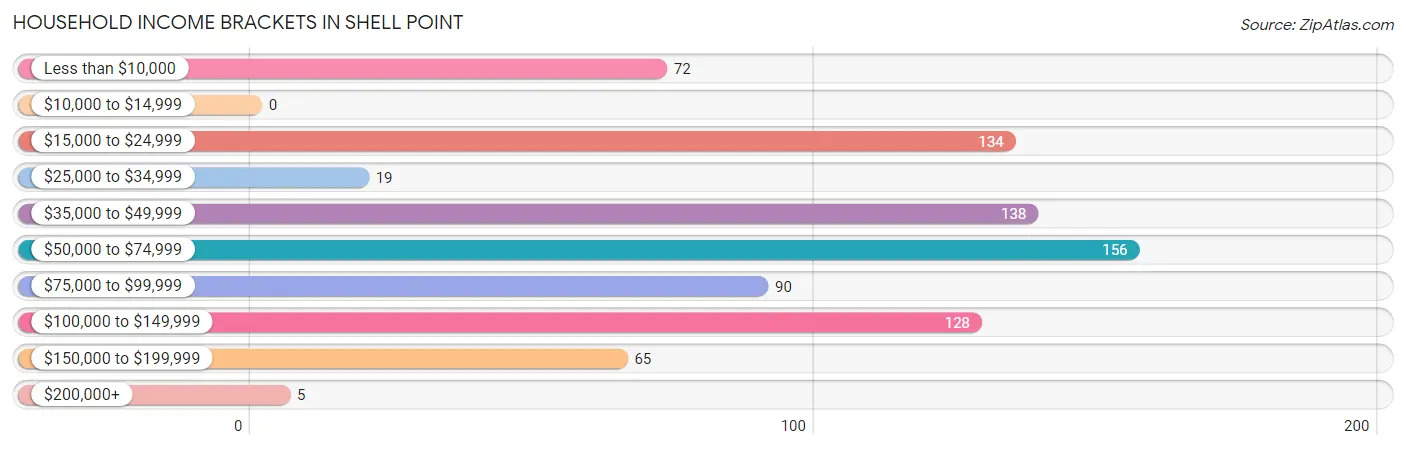
Family Income Brackets in Shell Point
According to the Shell Point family income data, there are 118 families falling into the $35,000 to $49,999 income range, which is the most common income bracket and makes up 23.7% of all families.
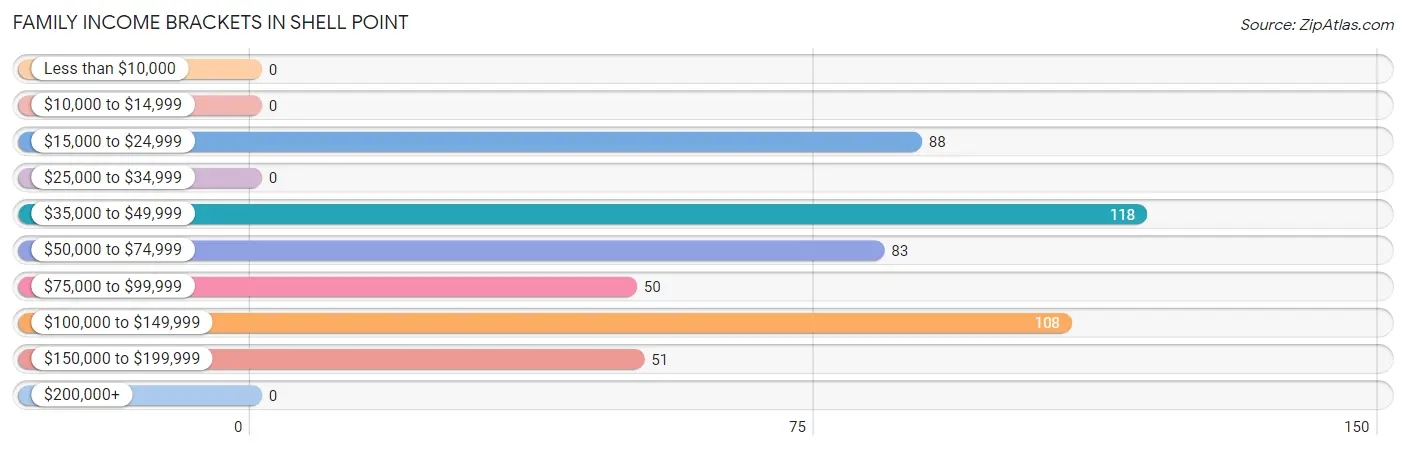
| Income Bracket | # Families | % Families |
| Less than $10,000 | 0 | 0.0% |
| $10,000 to $14,999 | 0 | 0.0% |
| $15,000 to $24,999 | 88 | 17.7% |
| $25,000 to $34,999 | 0 | 0.0% |
| $35,000 to $49,999 | 118 | 23.7% |
| $50,000 to $74,999 | 83 | 16.7% |
| $75,000 to $99,999 | 50 | 10.0% |
| $100,000 to $149,999 | 108 | 21.7% |
| $150,000 to $199,999 | 51 | 10.2% |
| $200,000+ | 0 | 0.0% |
Family Income by Famaliy Size in Shell Point
5-person families (64 | 12.9%) account for the highest median family income in Shell Point with $125,476 per family, while 2-person families (192 | 38.6%) have the highest median income of $32,436 per family member.
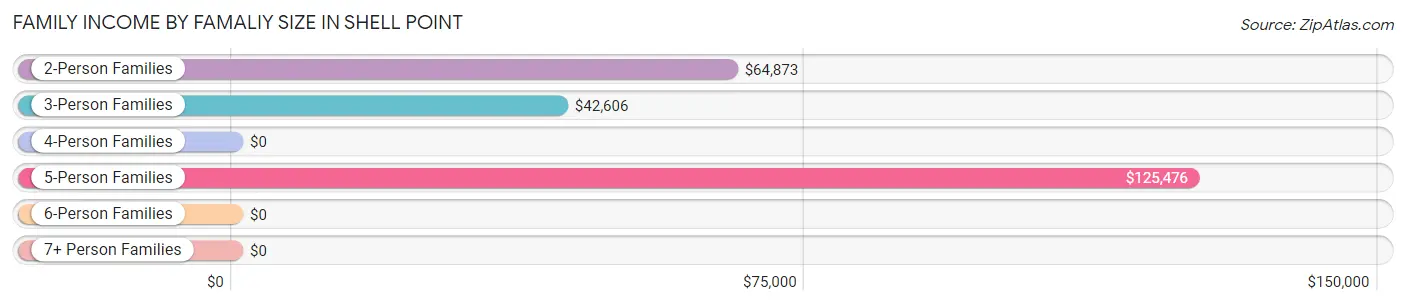
| Income Bracket | # Families | Median Income |
| 2-Person Families | 192 (38.6%) | $64,873 |
| 3-Person Families | 216 (43.4%) | $42,606 |
| 4-Person Families | 13 (2.6%) | $0 |
| 5-Person Families | 64 (12.9%) | $125,476 |
| 6-Person Families | 0 (0.0%) | $0 |
| 7+ Person Families | 13 (2.6%) | $0 |
| Total | 498 (100.0%) | $63,305 |
Family Income by Number of Earners in Shell Point
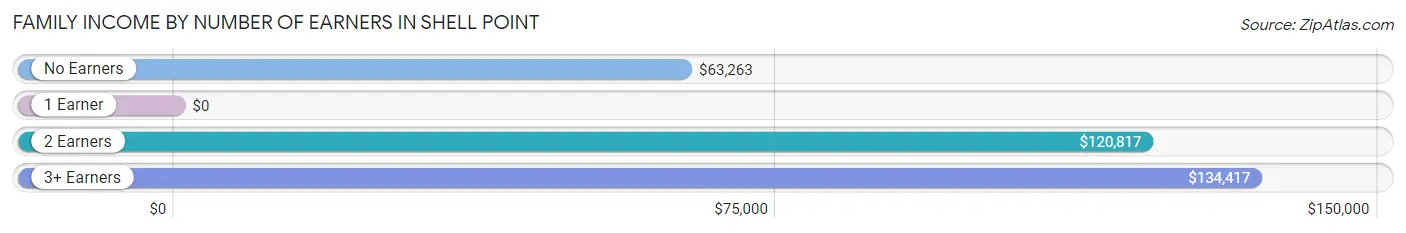
| Number of Earners | # Families | Median Income |
| No Earners | 116 (23.3%) | $63,263 |
| 1 Earner | 138 (27.7%) | $0 |
| 2 Earners | 203 (40.8%) | $120,817 |
| 3+ Earners | 41 (8.2%) | $134,417 |
| Total | 498 (100.0%) | $63,305 |
Household Income in Shell Point
Household Income Brackets in Shell Point
With 156 households falling in the category, the $50,000 to $74,999 income range is the most frequent in Shell Point, accounting for 19.3% of all households.
| Income Bracket | # Households | % Households |
| Less than $10,000 | 72 | 8.9% |
| $10,000 to $14,999 | 0 | 0.0% |
| $15,000 to $24,999 | 134 | 16.6% |
| $25,000 to $34,999 | 19 | 2.4% |
| $35,000 to $49,999 | 138 | 17.1% |
| $50,000 to $74,999 | 156 | 19.3% |
| $75,000 to $99,999 | 90 | 11.2% |
| $100,000 to $149,999 | 128 | 15.9% |
| $150,000 to $199,999 | 65 | 8.1% |
| $200,000+ | 5 | 0.6% |
Household Income by Householder Age in Shell Point
The median household income in Shell Point is $60,676, with the highest median household income of $123,917 found in the 45 to 64 years age bracket for the primary householder. A total of 192 households (23.8%) fall into this category. Meanwhile, the 15 to 24 years age bracket for the primary householder has the lowest median household income of $0, with 37 households (4.6%) in this group.
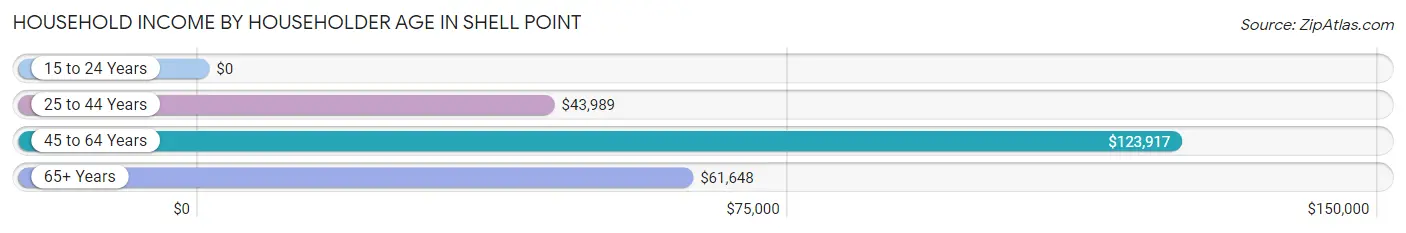
| Income Bracket | # Households | Median Income |
| 15 to 24 Years | 37 (4.6%) | $0 |
| 25 to 44 Years | 306 (37.9%) | $43,989 |
| 45 to 64 Years | 192 (23.8%) | $123,917 |
| 65+ Years | 272 (33.7%) | $61,648 |
| Total | 807 (100.0%) | $60,676 |
Poverty in Shell Point
Income Below Poverty by Sex and Age in Shell Point
With 8.7% poverty level for males and 19.7% for females among the residents of Shell Point, 5 year old males and 25 to 34 year old females are the most vulnerable to poverty, with 53 males (71.6%) and 107 females (40.7%) in their respective age groups living below the poverty level.
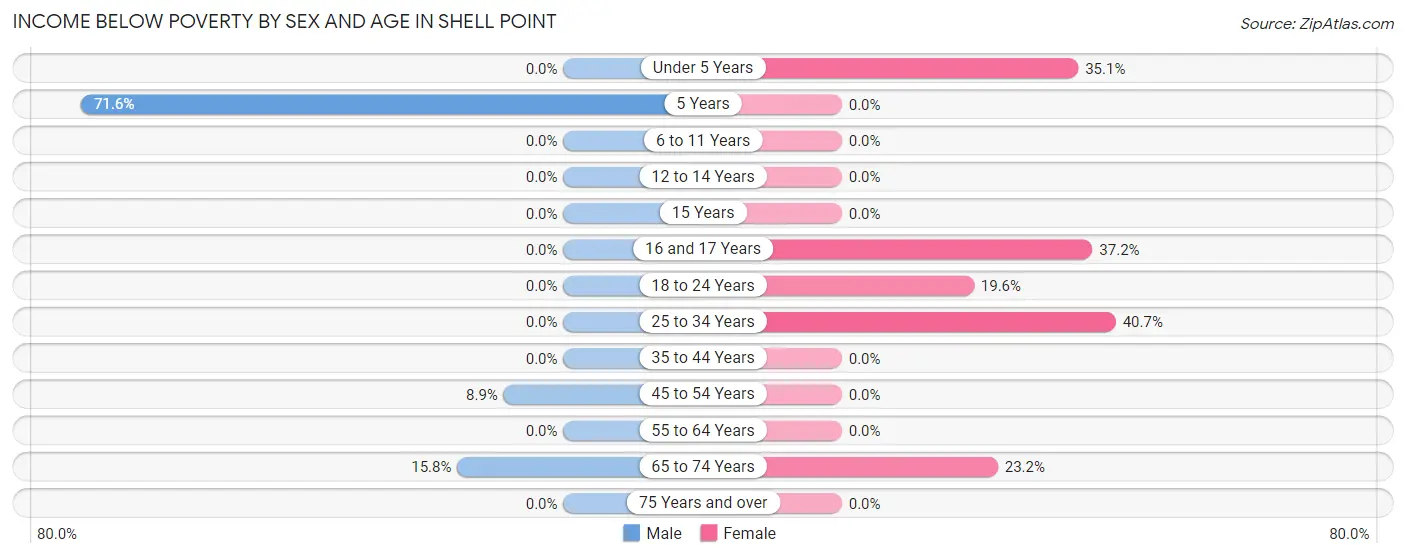
| Age Bracket | Male | Female |
| Under 5 Years | 0 (0.0%) | 46 (35.1%) |
| 5 Years | 53 (71.6%) | 0 (0.0%) |
| 6 to 11 Years | 0 (0.0%) | 0 (0.0%) |
| 12 to 14 Years | 0 (0.0%) | 0 (0.0%) |
| 15 Years | 0 (0.0%) | 0 (0.0%) |
| 16 and 17 Years | 0 (0.0%) | 16 (37.2%) |
| 18 to 24 Years | 0 (0.0%) | 20 (19.6%) |
| 25 to 34 Years | 0 (0.0%) | 107 (40.7%) |
| 35 to 44 Years | 0 (0.0%) | 0 (0.0%) |
| 45 to 54 Years | 7 (8.9%) | 0 (0.0%) |
| 55 to 64 Years | 0 (0.0%) | 0 (0.0%) |
| 65 to 74 Years | 23 (15.8%) | 22 (23.2%) |
| 75 Years and over | 0 (0.0%) | 0 (0.0%) |
| Total | 83 (8.7%) | 211 (19.7%) |
Income Above Poverty by Sex and Age in Shell Point
According to the poverty statistics in Shell Point, males aged under 5 years and females aged 6 to 11 years are the age groups that are most secure financially, with 100.0% of males and 100.0% of females in these age groups living above the poverty line.
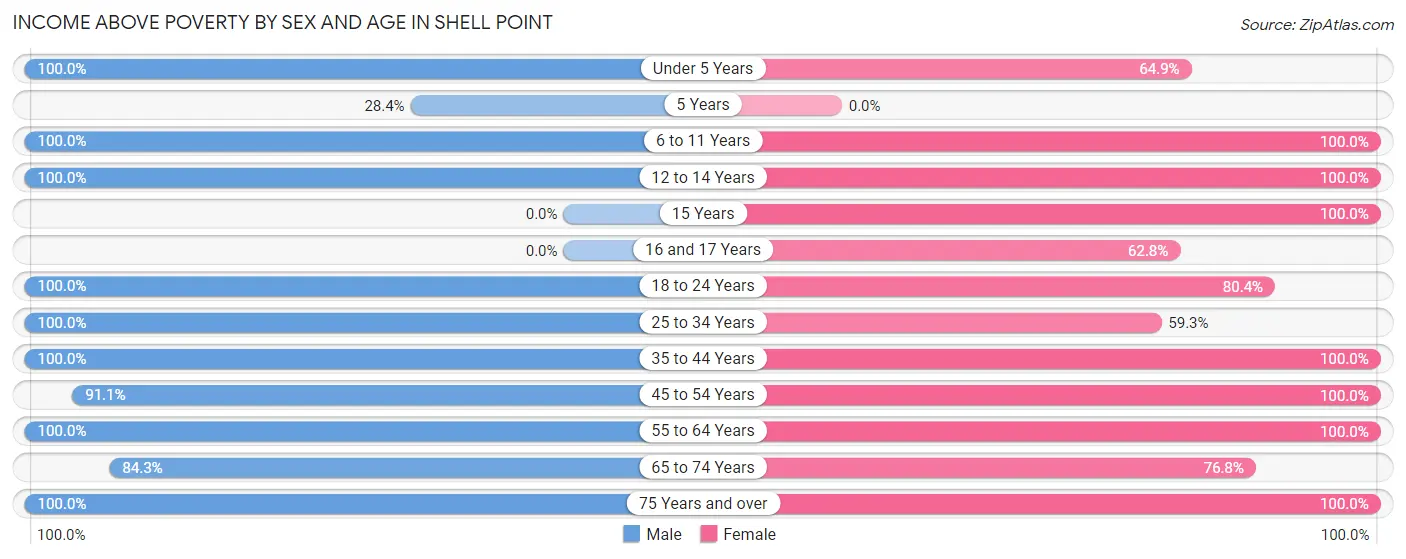
| Age Bracket | Male | Female |
| Under 5 Years | 75 (100.0%) | 85 (64.9%) |
| 5 Years | 21 (28.4%) | 0 (0.0%) |
| 6 to 11 Years | 56 (100.0%) | 33 (100.0%) |
| 12 to 14 Years | 20 (100.0%) | 49 (100.0%) |
| 15 Years | 0 (0.0%) | 50 (100.0%) |
| 16 and 17 Years | 0 (0.0%) | 27 (62.8%) |
| 18 to 24 Years | 116 (100.0%) | 82 (80.4%) |
| 25 to 34 Years | 199 (100.0%) | 156 (59.3%) |
| 35 to 44 Years | 11 (100.0%) | 69 (100.0%) |
| 45 to 54 Years | 72 (91.1%) | 78 (100.0%) |
| 55 to 64 Years | 87 (100.0%) | 104 (100.0%) |
| 65 to 74 Years | 123 (84.3%) | 73 (76.8%) |
| 75 Years and over | 94 (100.0%) | 52 (100.0%) |
| Total | 874 (91.3%) | 858 (80.3%) |
Income Below Poverty Among Married-Couple Families in Shell Point
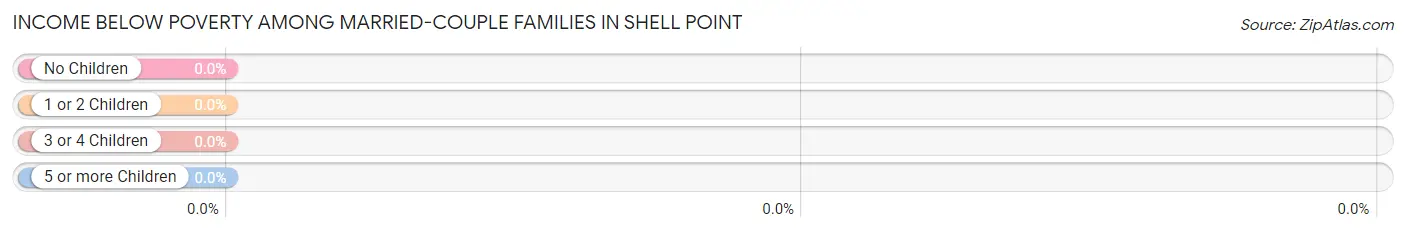
| Children | Above Poverty | Below Poverty |
| No Children | 192 (100.0%) | 0 (0.0%) |
| 1 or 2 Children | 46 (100.0%) | 0 (0.0%) |
| 3 or 4 Children | 49 (100.0%) | 0 (0.0%) |
| 5 or more Children | 13 (100.0%) | 0 (0.0%) |
| Total | 300 (100.0%) | 0 (0.0%) |
Income Below Poverty Among Single-Parent Households in Shell Point
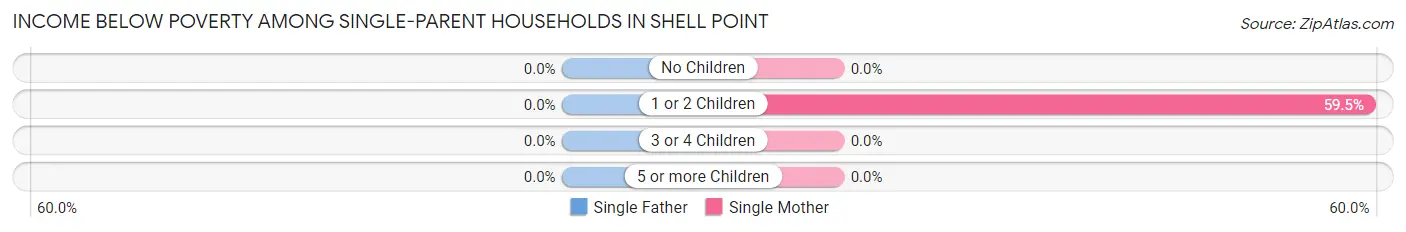
| Children | Single Father | Single Mother |
| No Children | 0 (0.0%) | 0 (0.0%) |
| 1 or 2 Children | 0 (0.0%) | 88 (59.5%) |
| 3 or 4 Children | 0 (0.0%) | 0 (0.0%) |
| 5 or more Children | 0 (0.0%) | 0 (0.0%) |
| Total | 0 (0.0%) | 88 (48.9%) |
Income Below Poverty Among Married-Couple vs Single-Parent Households in Shell Point
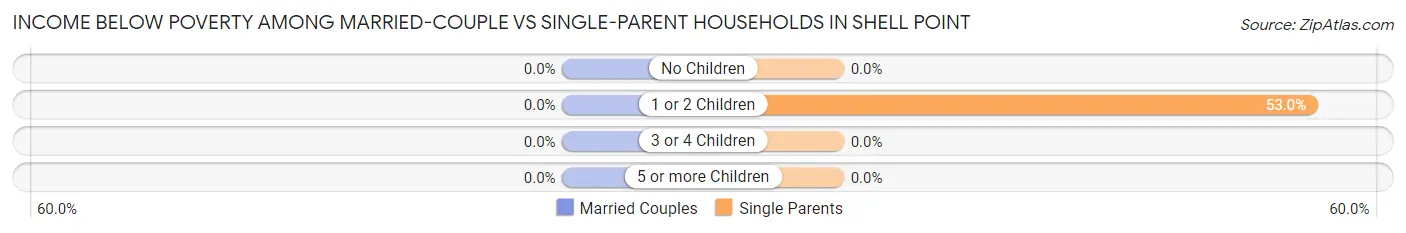
| Children | Married-Couple Families | Single-Parent Households |
| No Children | 0 (0.0%) | 0 (0.0%) |
| 1 or 2 Children | 0 (0.0%) | 88 (53.0%) |
| 3 or 4 Children | 0 (0.0%) | 0 (0.0%) |
| 5 or more Children | 0 (0.0%) | 0 (0.0%) |
| Total | 0 (0.0%) | 88 (44.4%) |
Employment Characteristics in Shell Point
Employment by Class of Employer in Shell Point
Among the 877 employed individuals in Shell Point, private company employees (581 | 66.2%), federal government employees (145 | 16.5%), and local government employees (54 | 6.2%) make up the most common classes of employment.
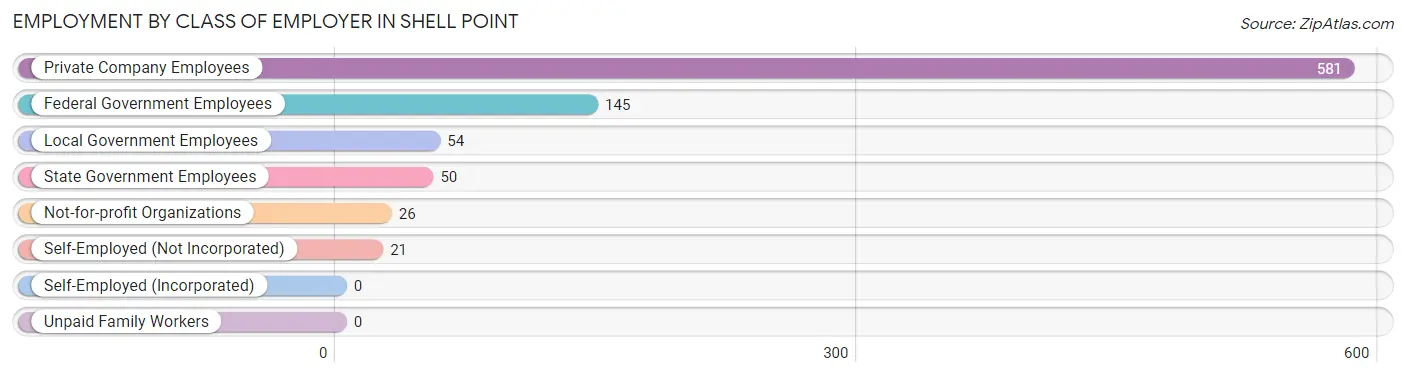
| Employer Class | # Employees | % Employees |
| Private Company Employees | 581 | 66.2% |
| Self-Employed (Incorporated) | 0 | 0.0% |
| Self-Employed (Not Incorporated) | 21 | 2.4% |
| Not-for-profit Organizations | 26 | 3.0% |
| Local Government Employees | 54 | 6.2% |
| State Government Employees | 50 | 5.7% |
| Federal Government Employees | 145 | 16.5% |
| Unpaid Family Workers | 0 | 0.0% |
| Total | 877 | 100.0% |
Employment Status by Age in Shell Point
According to the labor force statistics for Shell Point, out of the total population over 16 years of age (1,538), 62.5% or 961 individuals are in the labor force, with 8.8% or 85 of them unemployed. The age group with the highest labor force participation rate is 20 to 24 years, with 100.0% or 179 individuals in the labor force. Within the labor force, the 30 to 34 years age range has the highest percentage of unemployed individuals, with 29.0% or 31 of them being unemployed.
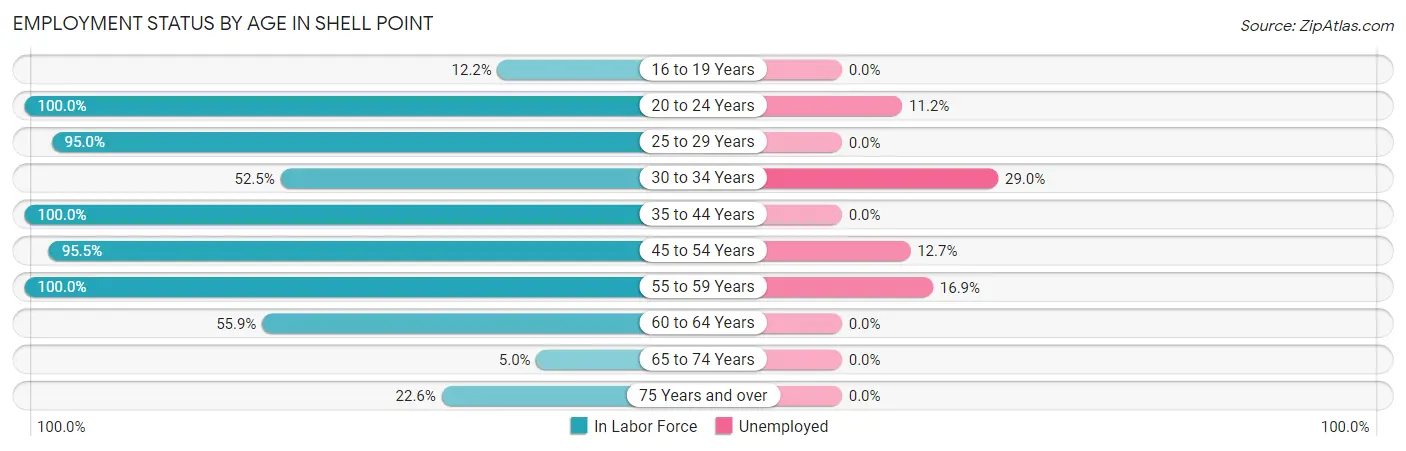
| Age Bracket | In Labor Force | Unemployed |
| 16 to 19 Years | 10 (12.2%) | 0 (0.0%) |
| 20 to 24 Years | 179 (100.0%) | 20 (11.2%) |
| 25 to 29 Years | 245 (95.0%) | 0 (0.0%) |
| 30 to 34 Years | 107 (52.5%) | 31 (29.0%) |
| 35 to 44 Years | 80 (100.0%) | 0 (0.0%) |
| 45 to 54 Years | 150 (95.5%) | 19 (12.7%) |
| 55 to 59 Years | 89 (100.0%) | 15 (16.9%) |
| 60 to 64 Years | 57 (55.9%) | 0 (0.0%) |
| 65 to 74 Years | 12 (5.0%) | 0 (0.0%) |
| 75 Years and over | 33 (22.6%) | 0 (0.0%) |
| Total | 961 (62.5%) | 85 (8.8%) |
Employment Status by Educational Attainment in Shell Point
According to labor force statistics for Shell Point, 81.8% of individuals (728) out of the total population between 25 and 64 years of age (890) are in the labor force, with 8.9% or 65 of them being unemployed. The group with the highest labor force participation rate are those with the educational attainment of bachelor's degree or higher, with 100.0% or 210 individuals in the labor force. Within the labor force, individuals with high school diploma education have the highest percentage of unemployment, with 13.0% or 15 of them being unemployed.
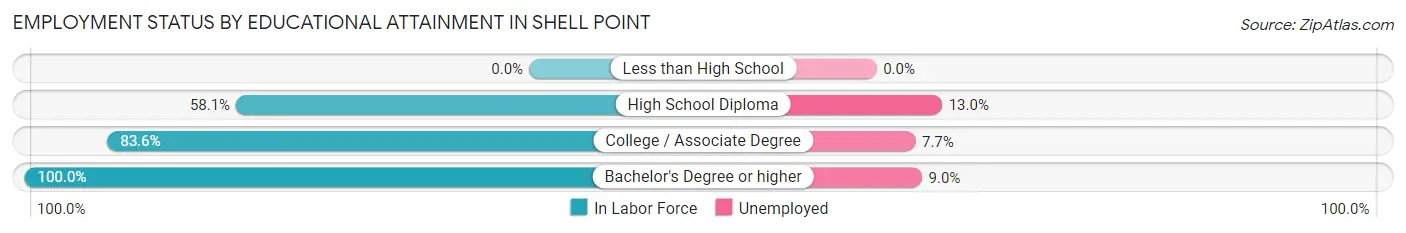
| Educational Attainment | In Labor Force | Unemployed |
| Less than High School | 0 (0.0%) | 0 (0.0%) |
| High School Diploma | 115 (58.1%) | 26 (13.0%) |
| College / Associate Degree | 403 (83.6%) | 37 (7.7%) |
| Bachelor's Degree or higher | 210 (100.0%) | 19 (9.0%) |
| Total | 728 (81.8%) | 79 (8.9%) |
Employment Occupations by Sex in Shell Point
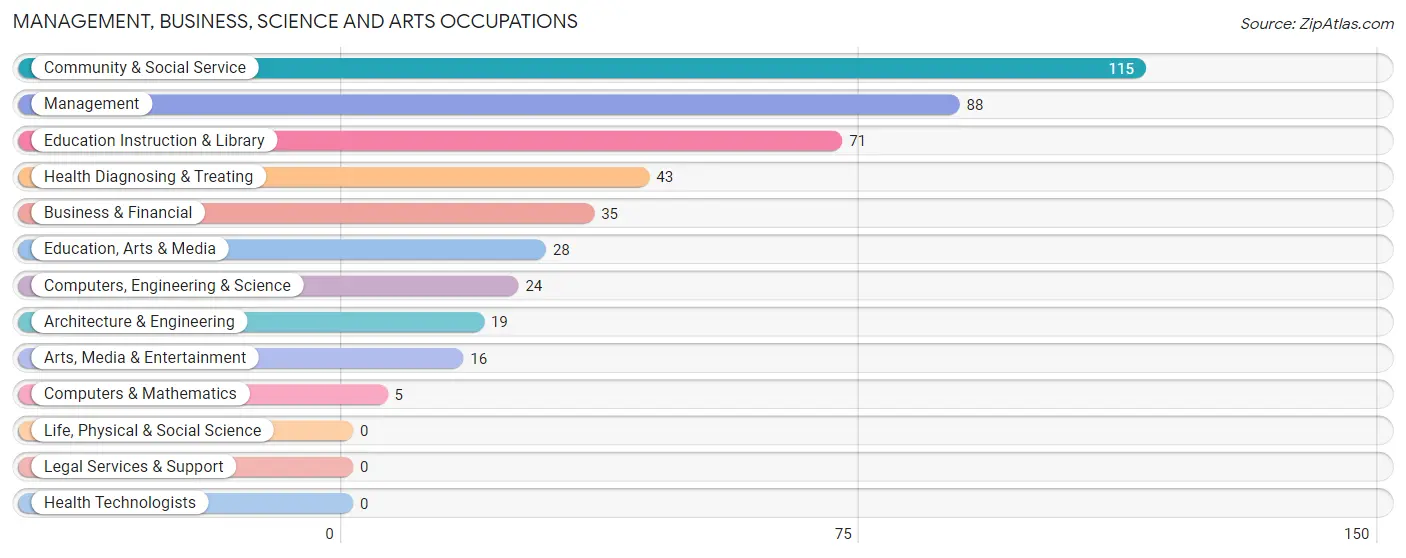
Management, Business, Science and Arts Occupations
The most common Management, Business, Science and Arts occupations in Shell Point are Community & Social Service (115 | 13.1%), Management (88 | 10.0%), Education Instruction & Library (71 | 8.1%), Health Diagnosing & Treating (43 | 4.9%), and Business & Financial (35 | 4.0%).
Management, Business, Science and Arts Occupations by Sex
Within the Management, Business, Science and Arts occupations in Shell Point, the most male-oriented occupations are Computers, Engineering & Science (100.0%), Computers & Mathematics (100.0%), and Architecture & Engineering (100.0%), while the most female-oriented occupations are Health Diagnosing & Treating (100.0%), Education Instruction & Library (66.2%), and Education, Arts & Media (60.7%).
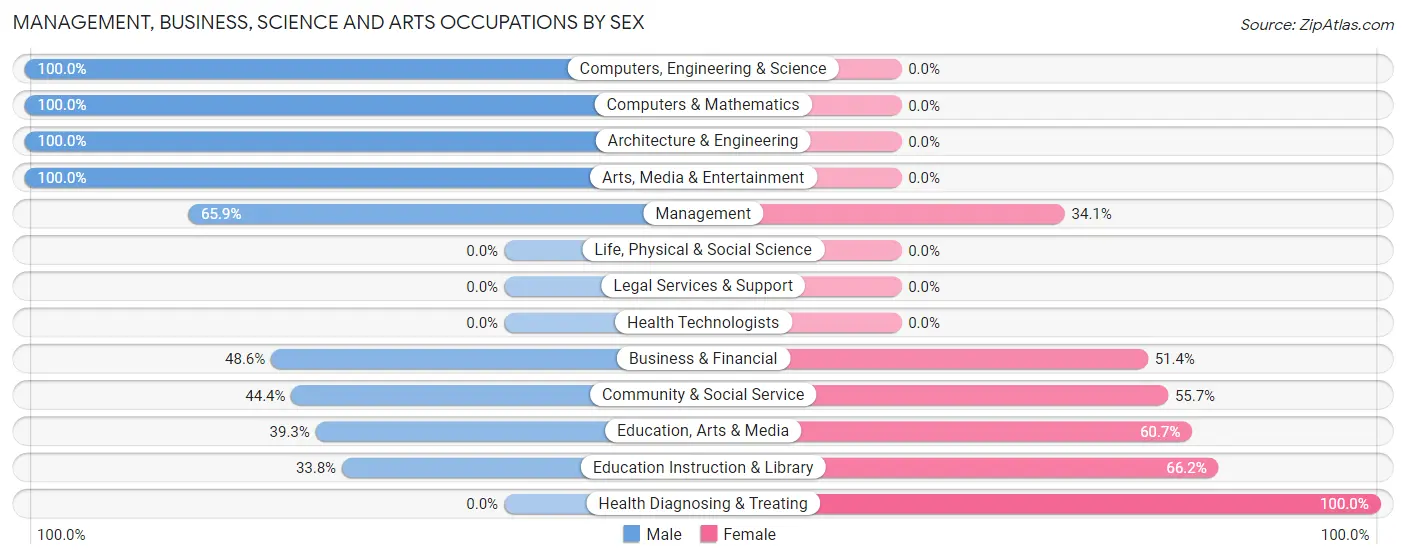
| Occupation | Male | Female |
| Management | 58 (65.9%) | 30 (34.1%) |
| Business & Financial | 17 (48.6%) | 18 (51.4%) |
| Computers, Engineering & Science | 24 (100.0%) | 0 (0.0%) |
| Computers & Mathematics | 5 (100.0%) | 0 (0.0%) |
| Architecture & Engineering | 19 (100.0%) | 0 (0.0%) |
| Life, Physical & Social Science | 0 (0.0%) | 0 (0.0%) |
| Community & Social Service | 51 (44.4%) | 64 (55.6%) |
| Education, Arts & Media | 11 (39.3%) | 17 (60.7%) |
| Legal Services & Support | 0 (0.0%) | 0 (0.0%) |
| Education Instruction & Library | 24 (33.8%) | 47 (66.2%) |
| Arts, Media & Entertainment | 16 (100.0%) | 0 (0.0%) |
| Health Diagnosing & Treating | 0 (0.0%) | 43 (100.0%) |
| Health Technologists | 0 (0.0%) | 0 (0.0%) |
| Total (Category) | 150 (49.2%) | 155 (50.8%) |
| Total (Overall) | 412 (47.0%) | 465 (53.0%) |
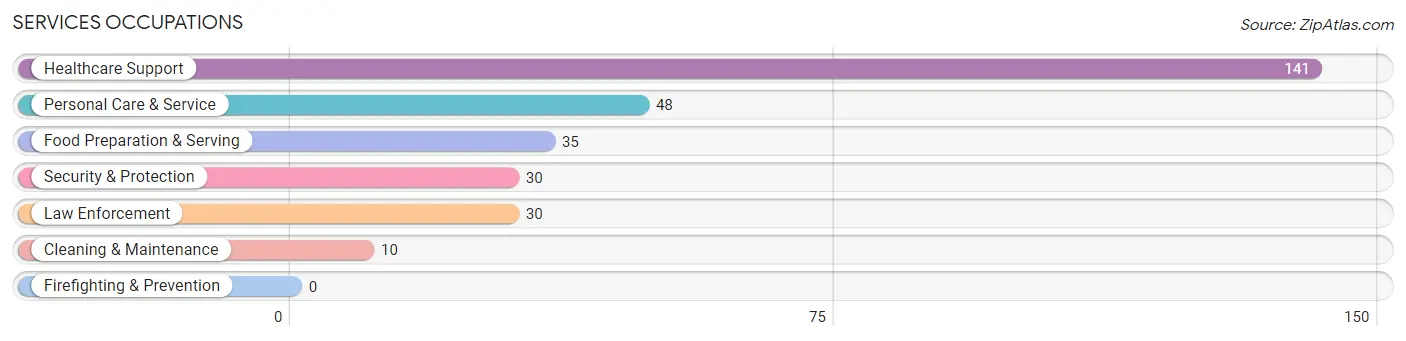
Services Occupations
The most common Services occupations in Shell Point are Healthcare Support (141 | 16.1%), Personal Care & Service (48 | 5.5%), Food Preparation & Serving (35 | 4.0%), Security & Protection (30 | 3.4%), and Law Enforcement (30 | 3.4%).
Services Occupations by Sex
Within the Services occupations in Shell Point, the most male-oriented occupations are Personal Care & Service (66.7%), Food Preparation & Serving (51.4%), and Security & Protection (36.7%), while the most female-oriented occupations are Healthcare Support (100.0%), Cleaning & Maintenance (100.0%), and Security & Protection (63.3%).
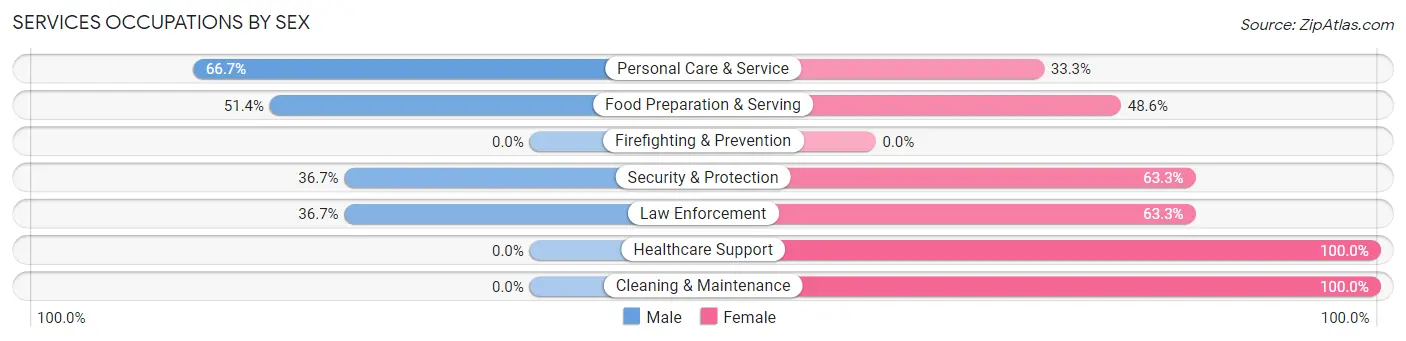
| Occupation | Male | Female |
| Healthcare Support | 0 (0.0%) | 141 (100.0%) |
| Security & Protection | 11 (36.7%) | 19 (63.3%) |
| Firefighting & Prevention | 0 (0.0%) | 0 (0.0%) |
| Law Enforcement | 11 (36.7%) | 19 (63.3%) |
| Food Preparation & Serving | 18 (51.4%) | 17 (48.6%) |
| Cleaning & Maintenance | 0 (0.0%) | 10 (100.0%) |
| Personal Care & Service | 32 (66.7%) | 16 (33.3%) |
| Total (Category) | 61 (23.1%) | 203 (76.9%) |
| Total (Overall) | 412 (47.0%) | 465 (53.0%) |
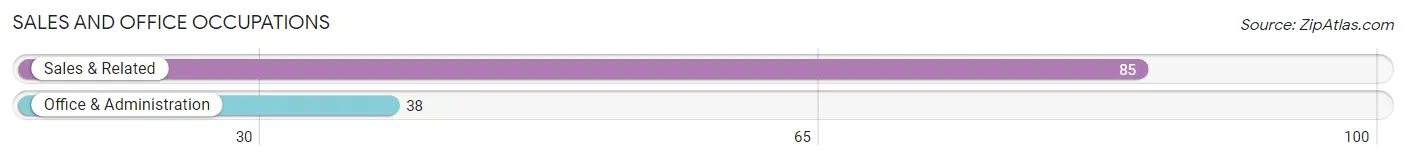
Sales and Office Occupations
The most common Sales and Office occupations in Shell Point are Sales & Related (85 | 9.7%), and Office & Administration (38 | 4.3%).
Sales and Office Occupations by Sex
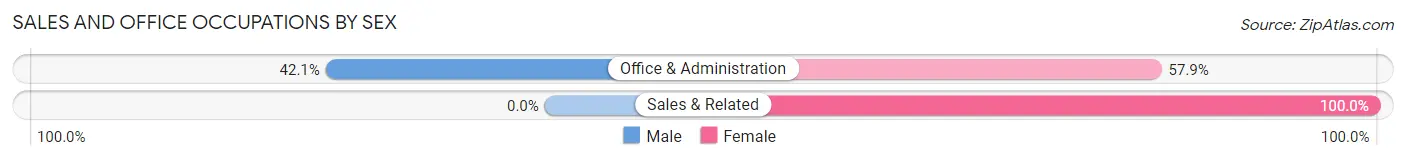
| Occupation | Male | Female |
| Sales & Related | 0 (0.0%) | 85 (100.0%) |
| Office & Administration | 16 (42.1%) | 22 (57.9%) |
| Total (Category) | 16 (13.0%) | 107 (87.0%) |
| Total (Overall) | 412 (47.0%) | 465 (53.0%) |
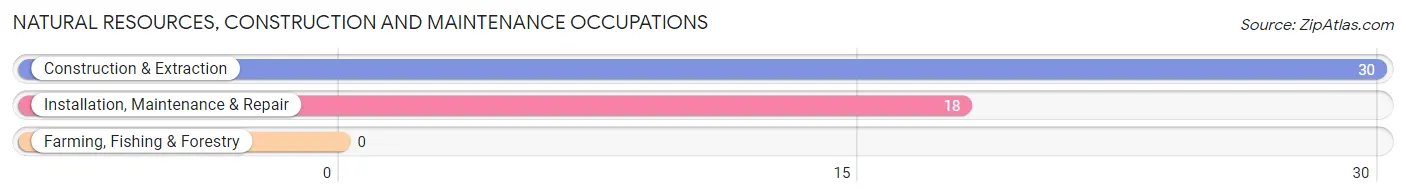
Natural Resources, Construction and Maintenance Occupations
The most common Natural Resources, Construction and Maintenance occupations in Shell Point are Construction & Extraction (30 | 3.4%), and Installation, Maintenance & Repair (18 | 2.1%).
Natural Resources, Construction and Maintenance Occupations by Sex
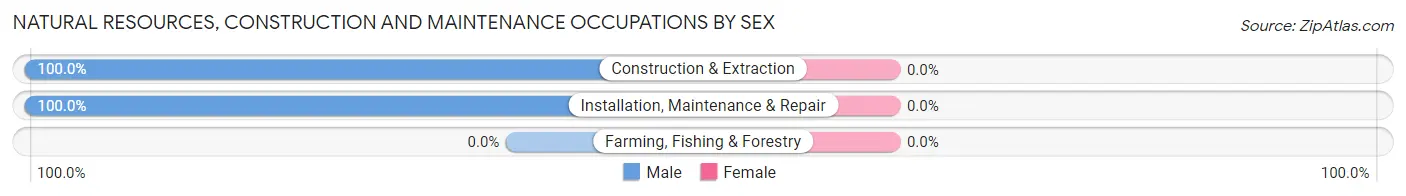
| Occupation | Male | Female |
| Farming, Fishing & Forestry | 0 (0.0%) | 0 (0.0%) |
| Construction & Extraction | 30 (100.0%) | 0 (0.0%) |
| Installation, Maintenance & Repair | 18 (100.0%) | 0 (0.0%) |
| Total (Category) | 48 (100.0%) | 0 (0.0%) |
| Total (Overall) | 412 (47.0%) | 465 (53.0%) |
Production, Transportation and Moving Occupations
The most common Production, Transportation and Moving occupations in Shell Point are Material Moving (66 | 7.5%), Transportation (41 | 4.7%), and Production (30 | 3.4%).
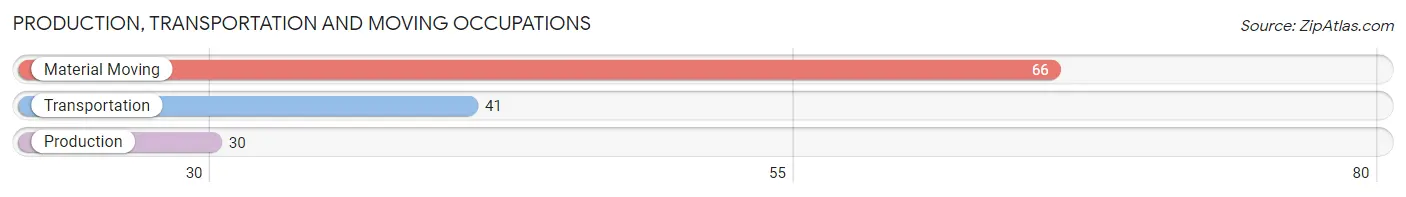
Production, Transportation and Moving Occupations by Sex
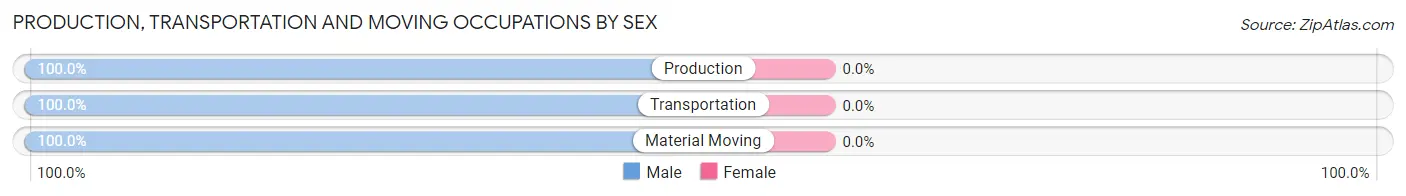
| Occupation | Male | Female |
| Production | 30 (100.0%) | 0 (0.0%) |
| Transportation | 41 (100.0%) | 0 (0.0%) |
| Material Moving | 66 (100.0%) | 0 (0.0%) |
| Total (Category) | 137 (100.0%) | 0 (0.0%) |
| Total (Overall) | 412 (47.0%) | 465 (53.0%) |
Employment Industries by Sex in Shell Point
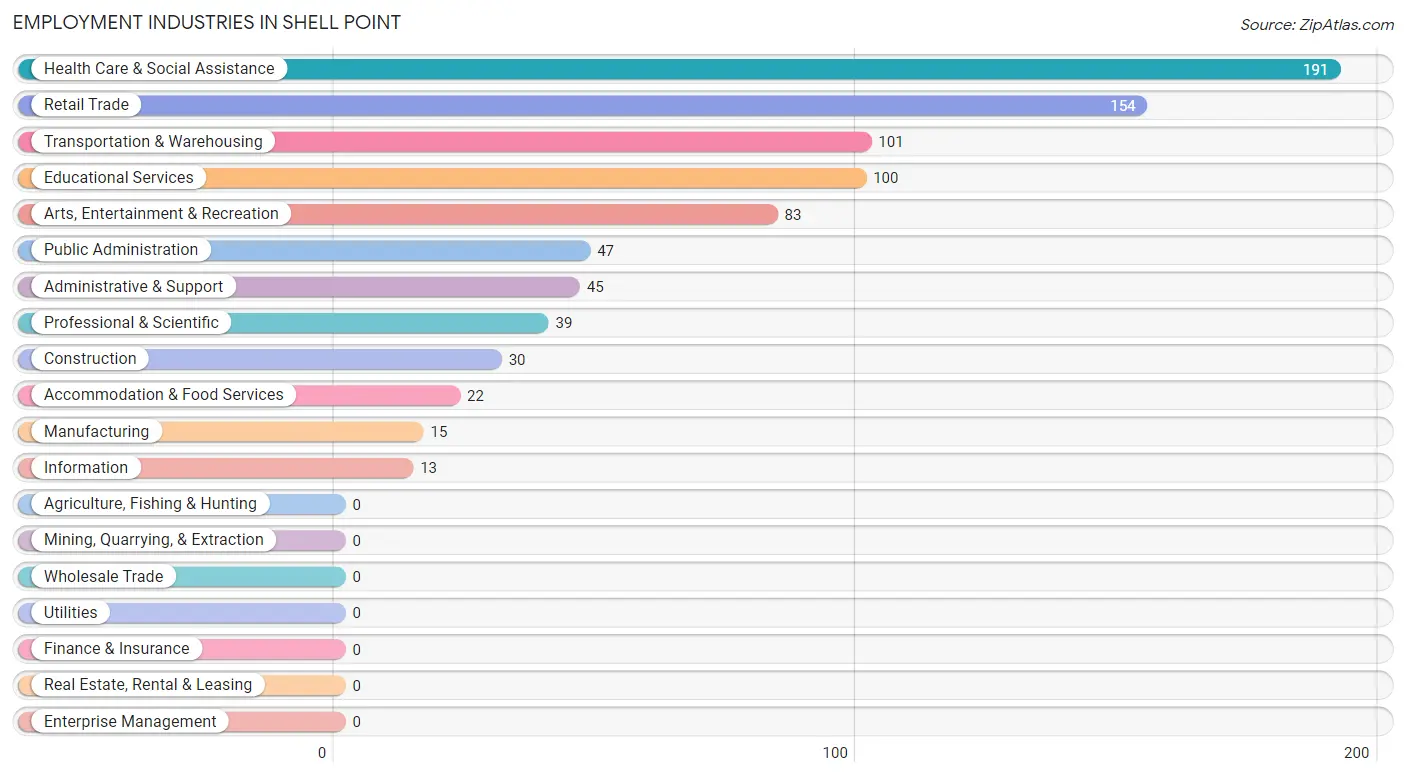
Employment Industries in Shell Point
The major employment industries in Shell Point include Health Care & Social Assistance (191 | 21.8%), Retail Trade (154 | 17.6%), Transportation & Warehousing (101 | 11.5%), Educational Services (100 | 11.4%), and Arts, Entertainment & Recreation (83 | 9.5%).
Employment Industries by Sex in Shell Point
The Shell Point industries that see more men than women are Construction (100.0%), Manufacturing (100.0%), and Transportation & Warehousing (100.0%), whereas the industries that tend to have a higher number of women are Information (100.0%), Accommodation & Food Services (100.0%), and Health Care & Social Assistance (90.0%).
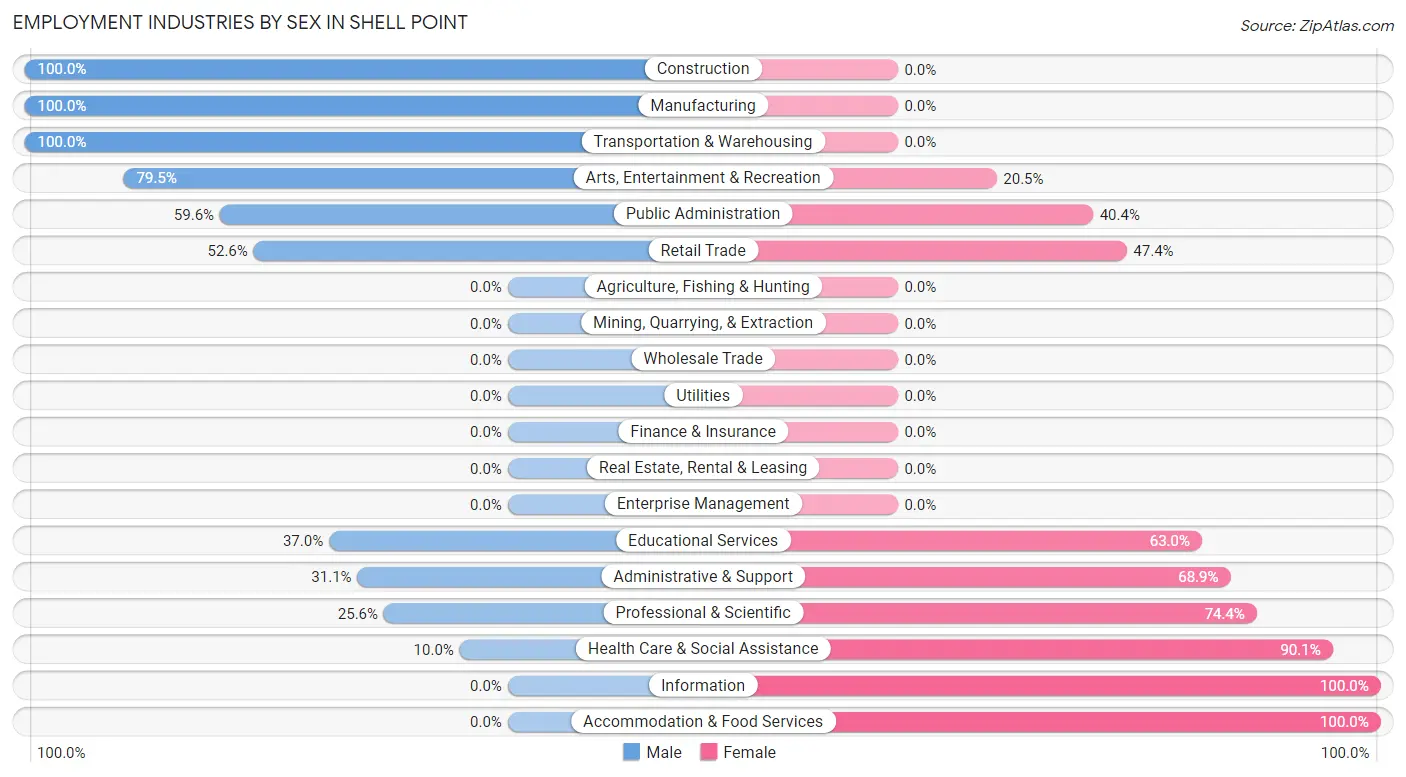
| Industry | Male | Female |
| Agriculture, Fishing & Hunting | 0 (0.0%) | 0 (0.0%) |
| Mining, Quarrying, & Extraction | 0 (0.0%) | 0 (0.0%) |
| Construction | 30 (100.0%) | 0 (0.0%) |
| Manufacturing | 15 (100.0%) | 0 (0.0%) |
| Wholesale Trade | 0 (0.0%) | 0 (0.0%) |
| Retail Trade | 81 (52.6%) | 73 (47.4%) |
| Transportation & Warehousing | 101 (100.0%) | 0 (0.0%) |
| Utilities | 0 (0.0%) | 0 (0.0%) |
| Information | 0 (0.0%) | 13 (100.0%) |
| Finance & Insurance | 0 (0.0%) | 0 (0.0%) |
| Real Estate, Rental & Leasing | 0 (0.0%) | 0 (0.0%) |
| Professional & Scientific | 10 (25.6%) | 29 (74.4%) |
| Enterprise Management | 0 (0.0%) | 0 (0.0%) |
| Administrative & Support | 14 (31.1%) | 31 (68.9%) |
| Educational Services | 37 (37.0%) | 63 (63.0%) |
| Health Care & Social Assistance | 19 (10.0%) | 172 (90.0%) |
| Arts, Entertainment & Recreation | 66 (79.5%) | 17 (20.5%) |
| Accommodation & Food Services | 0 (0.0%) | 22 (100.0%) |
| Public Administration | 28 (59.6%) | 19 (40.4%) |
| Total | 412 (47.0%) | 465 (53.0%) |
Education in Shell Point
School Enrollment in Shell Point
The most common levels of schooling among the 607 students in Shell Point are college / undergraduate (178 | 29.3%), high school (132 | 21.7%), and nursery / preschool (120 | 19.8%).
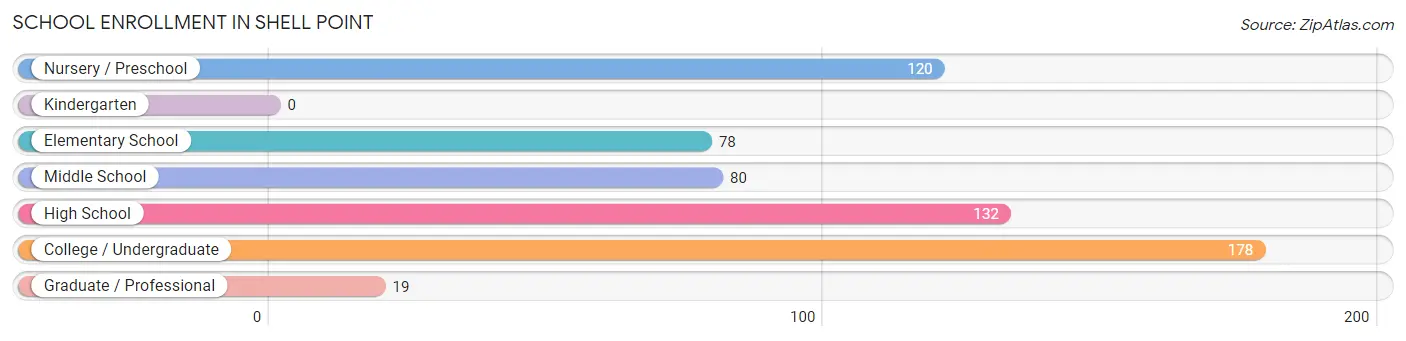
| School Level | # Students | % Students |
| Nursery / Preschool | 120 | 19.8% |
| Kindergarten | 0 | 0.0% |
| Elementary School | 78 | 12.9% |
| Middle School | 80 | 13.2% |
| High School | 132 | 21.7% |
| College / Undergraduate | 178 | 29.3% |
| Graduate / Professional | 19 | 3.1% |
| Total | 607 | 100.0% |
School Enrollment by Age by Funding Source in Shell Point
Out of a total of 607 students who are enrolled in schools in Shell Point, 97 (16.0%) attend a private institution, while the remaining 510 (84.0%) are enrolled in public schools. The age group of 18 to 19 year olds has the highest likelihood of being enrolled in private schools, with 39 (100.0% in the age bracket) enrolled. Conversely, the age group of 3 to 4 year olds has the lowest likelihood of being enrolled in a private school, with 46 (100.0% in the age bracket) attending a public institution.
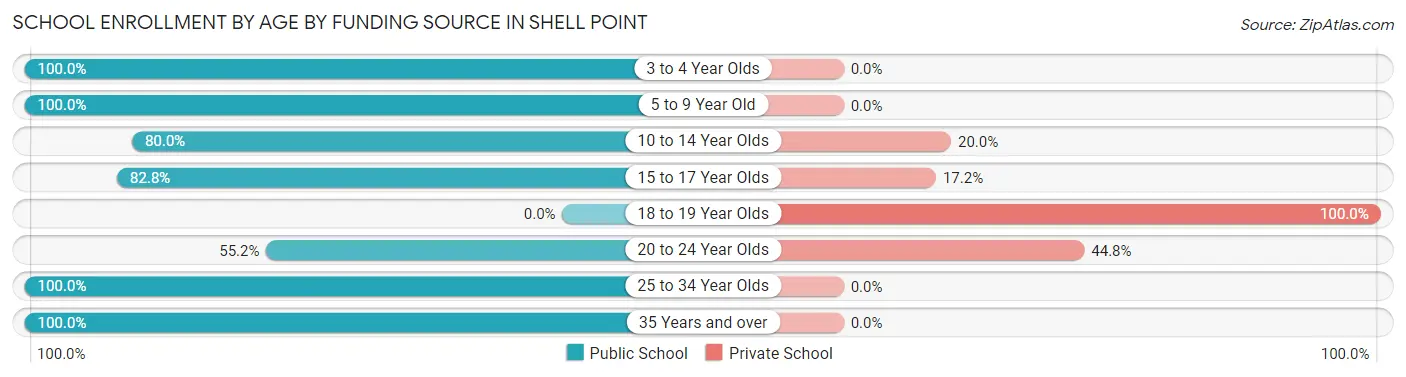
| Age Bracket | Public School | Private School |
| 3 to 4 Year Olds | 46 (100.0%) | 0 (0.0%) |
| 5 to 9 Year Old | 152 (100.0%) | 0 (0.0%) |
| 10 to 14 Year Olds | 64 (80.0%) | 16 (20.0%) |
| 15 to 17 Year Olds | 77 (82.8%) | 16 (17.2%) |
| 18 to 19 Year Olds | 0 (0.0%) | 39 (100.0%) |
| 20 to 24 Year Olds | 32 (55.2%) | 26 (44.8%) |
| 25 to 34 Year Olds | 108 (100.0%) | 0 (0.0%) |
| 35 Years and over | 31 (100.0%) | 0 (0.0%) |
| Total | 510 (84.0%) | 97 (16.0%) |
Educational Attainment by Field of Study in Shell Point
Science & technology (71 | 24.2%), business (57 | 19.5%), psychology (33 | 11.3%), liberal arts & history (33 | 11.3%), and education (29 | 9.9%) are the most common fields of study among 293 individuals in Shell Point who have obtained a bachelor's degree or higher.
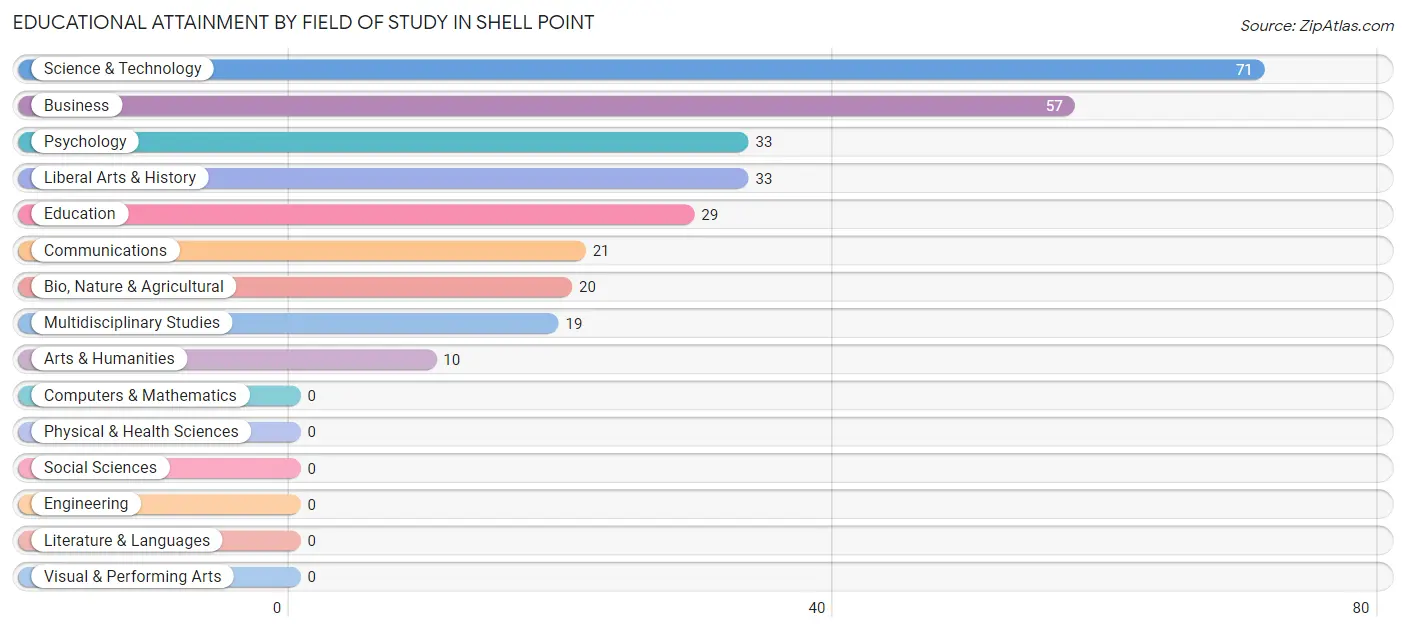
| Field of Study | # Graduates | % Graduates |
| Computers & Mathematics | 0 | 0.0% |
| Bio, Nature & Agricultural | 20 | 6.8% |
| Physical & Health Sciences | 0 | 0.0% |
| Psychology | 33 | 11.3% |
| Social Sciences | 0 | 0.0% |
| Engineering | 0 | 0.0% |
| Multidisciplinary Studies | 19 | 6.5% |
| Science & Technology | 71 | 24.2% |
| Business | 57 | 19.5% |
| Education | 29 | 9.9% |
| Literature & Languages | 0 | 0.0% |
| Liberal Arts & History | 33 | 11.3% |
| Visual & Performing Arts | 0 | 0.0% |
| Communications | 21 | 7.2% |
| Arts & Humanities | 10 | 3.4% |
| Total | 293 | 100.0% |
Transportation & Commute in Shell Point
Vehicle Availability by Sex in Shell Point
The most prevalent vehicle ownership categories in Shell Point are males with 2 vehicles (156, accounting for 37.9%) and females with 2 vehicles (136, making up 33.6%).
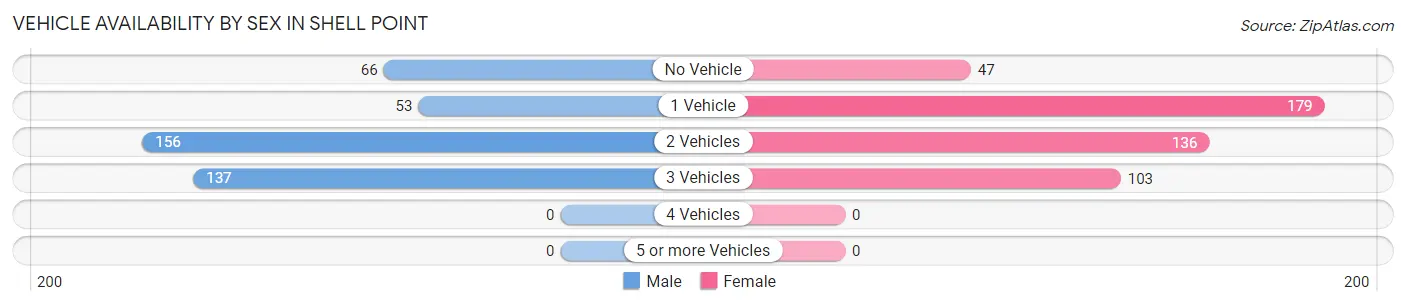
| Vehicles Available | Male | Female |
| No Vehicle | 66 (16.0%) | 47 (10.1%) |
| 1 Vehicle | 53 (12.9%) | 179 (38.5%) |
| 2 Vehicles | 156 (37.9%) | 136 (29.2%) |
| 3 Vehicles | 137 (33.3%) | 103 (22.2%) |
| 4 Vehicles | 0 (0.0%) | 0 (0.0%) |
| 5 or more Vehicles | 0 (0.0%) | 0 (0.0%) |
| Total | 412 (100.0%) | 465 (100.0%) |
Commute Time in Shell Point
The most frequently occuring commute durations in Shell Point are 10 to 14 minutes (197 commuters, 23.2%), 20 to 24 minutes (190 commuters, 22.4%), and 15 to 19 minutes (172 commuters, 20.3%).
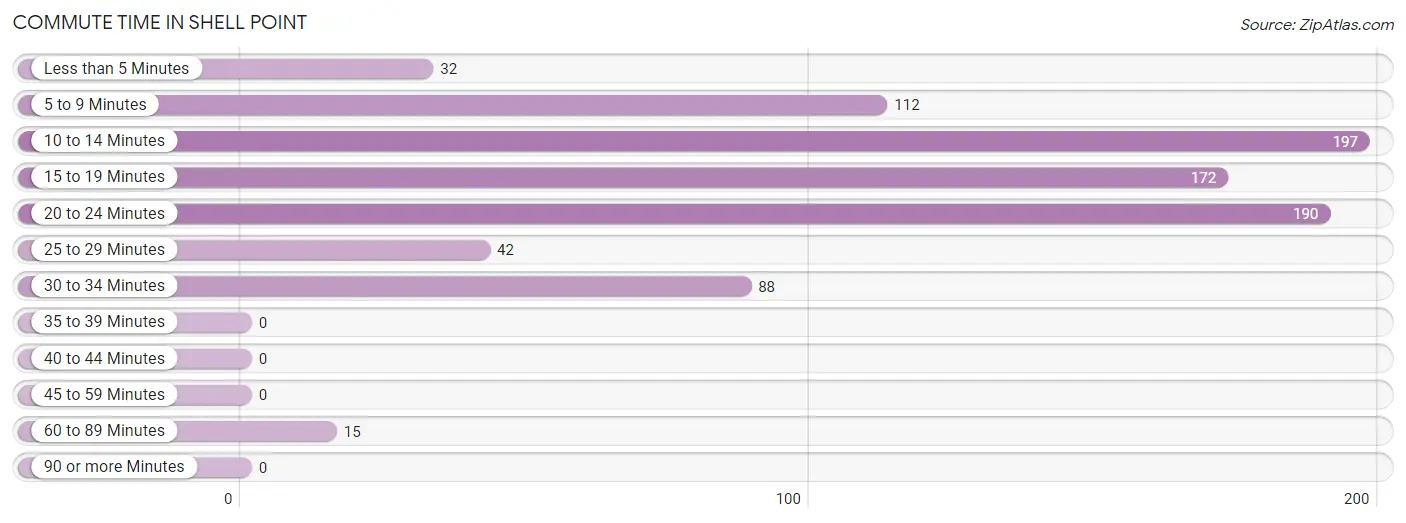
| Commute Time | # Commuters | % Commuters |
| Less than 5 Minutes | 32 | 3.8% |
| 5 to 9 Minutes | 112 | 13.2% |
| 10 to 14 Minutes | 197 | 23.2% |
| 15 to 19 Minutes | 172 | 20.3% |
| 20 to 24 Minutes | 190 | 22.4% |
| 25 to 29 Minutes | 42 | 5.0% |
| 30 to 34 Minutes | 88 | 10.4% |
| 35 to 39 Minutes | 0 | 0.0% |
| 40 to 44 Minutes | 0 | 0.0% |
| 45 to 59 Minutes | 0 | 0.0% |
| 60 to 89 Minutes | 15 | 1.8% |
| 90 or more Minutes | 0 | 0.0% |
Commute Time by Sex in Shell Point
The most common commute times in Shell Point are 10 to 14 minutes (135 commuters, 34.1%) for males and 20 to 24 minutes (174 commuters, 38.5%) for females.
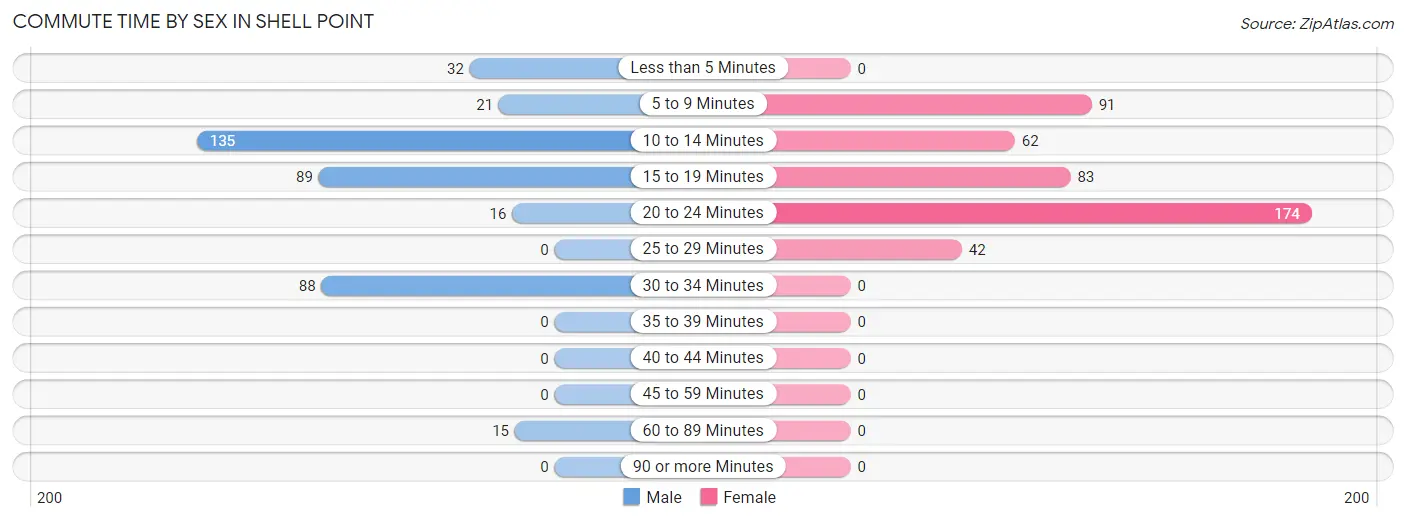
| Commute Time | Male | Female |
| Less than 5 Minutes | 32 (8.1%) | 0 (0.0%) |
| 5 to 9 Minutes | 21 (5.3%) | 91 (20.1%) |
| 10 to 14 Minutes | 135 (34.1%) | 62 (13.7%) |
| 15 to 19 Minutes | 89 (22.5%) | 83 (18.4%) |
| 20 to 24 Minutes | 16 (4.0%) | 174 (38.5%) |
| 25 to 29 Minutes | 0 (0.0%) | 42 (9.3%) |
| 30 to 34 Minutes | 88 (22.2%) | 0 (0.0%) |
| 35 to 39 Minutes | 0 (0.0%) | 0 (0.0%) |
| 40 to 44 Minutes | 0 (0.0%) | 0 (0.0%) |
| 45 to 59 Minutes | 0 (0.0%) | 0 (0.0%) |
| 60 to 89 Minutes | 15 (3.8%) | 0 (0.0%) |
| 90 or more Minutes | 0 (0.0%) | 0 (0.0%) |
Time of Departure to Work by Sex in Shell Point
The most frequent times of departure to work in Shell Point are 12:00 PM to 3:59 PM (150, 37.9%) for males and 7:00 AM to 7:29 AM (187, 41.4%) for females.
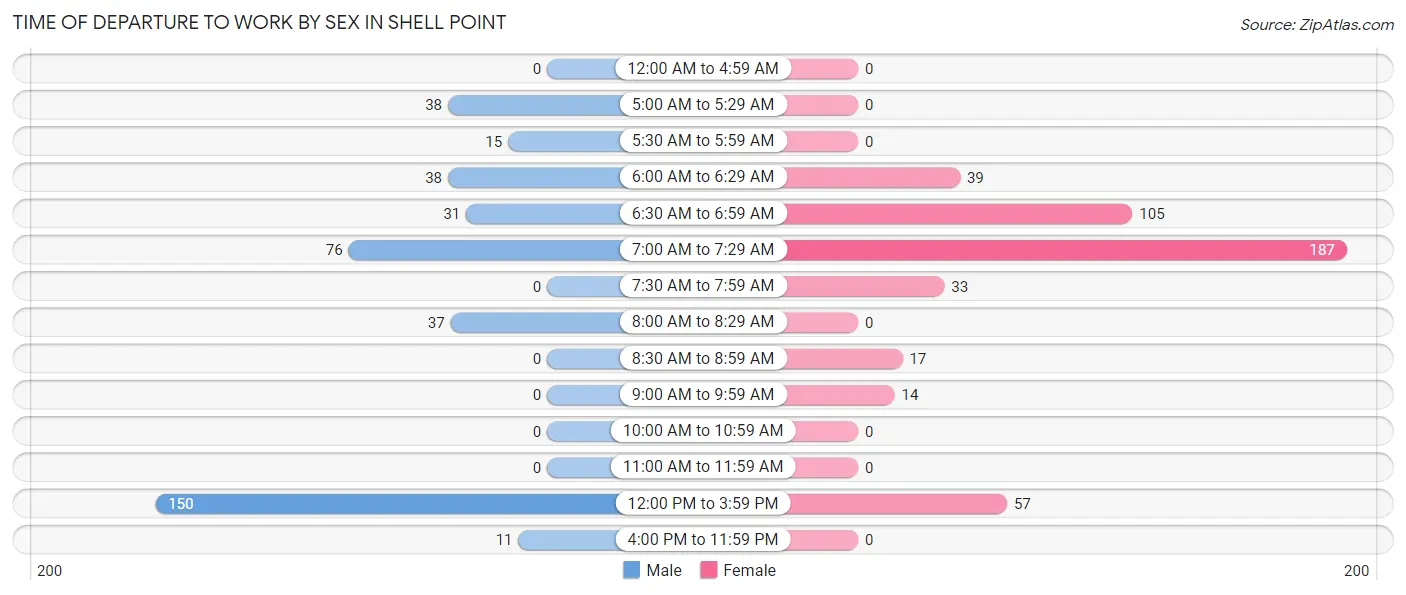
| Time of Departure | Male | Female |
| 12:00 AM to 4:59 AM | 0 (0.0%) | 0 (0.0%) |
| 5:00 AM to 5:29 AM | 38 (9.6%) | 0 (0.0%) |
| 5:30 AM to 5:59 AM | 15 (3.8%) | 0 (0.0%) |
| 6:00 AM to 6:29 AM | 38 (9.6%) | 39 (8.6%) |
| 6:30 AM to 6:59 AM | 31 (7.8%) | 105 (23.2%) |
| 7:00 AM to 7:29 AM | 76 (19.2%) | 187 (41.4%) |
| 7:30 AM to 7:59 AM | 0 (0.0%) | 33 (7.3%) |
| 8:00 AM to 8:29 AM | 37 (9.3%) | 0 (0.0%) |
| 8:30 AM to 8:59 AM | 0 (0.0%) | 17 (3.8%) |
| 9:00 AM to 9:59 AM | 0 (0.0%) | 14 (3.1%) |
| 10:00 AM to 10:59 AM | 0 (0.0%) | 0 (0.0%) |
| 11:00 AM to 11:59 AM | 0 (0.0%) | 0 (0.0%) |
| 12:00 PM to 3:59 PM | 150 (37.9%) | 57 (12.6%) |
| 4:00 PM to 11:59 PM | 11 (2.8%) | 0 (0.0%) |
| Total | 396 (100.0%) | 452 (100.0%) |
Housing Occupancy in Shell Point
Occupancy by Ownership in Shell Point
Of the total 807 dwellings in Shell Point, owner-occupied units account for 522 (64.7%), while renter-occupied units make up 285 (35.3%).
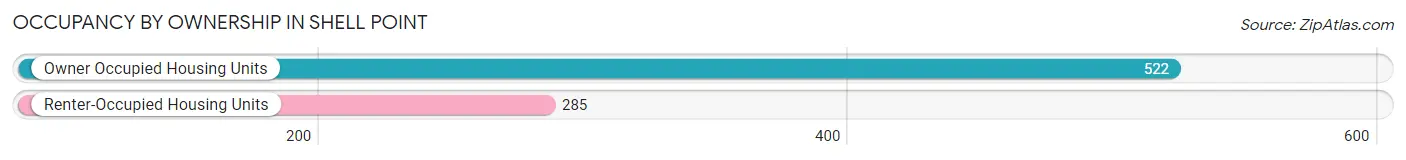
| Occupancy | # Housing Units | % Housing Units |
| Owner Occupied Housing Units | 522 | 64.7% |
| Renter-Occupied Housing Units | 285 | 35.3% |
| Total Occupied Housing Units | 807 | 100.0% |
Occupancy by Household Size in Shell Point
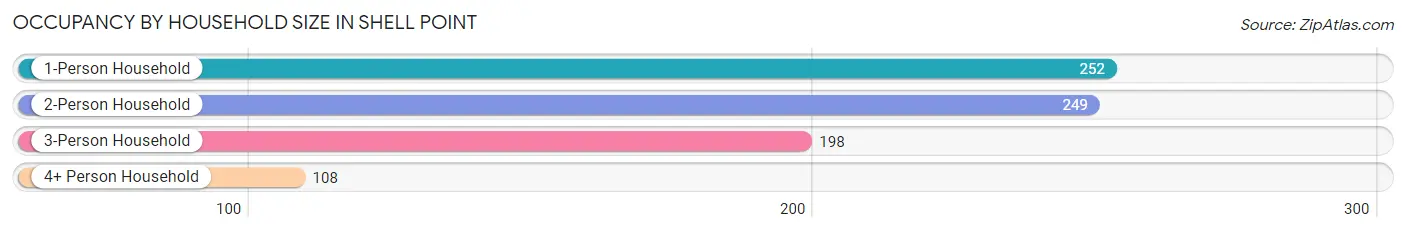
| Household Size | # Housing Units | % Housing Units |
| 1-Person Household | 252 | 31.2% |
| 2-Person Household | 249 | 30.9% |
| 3-Person Household | 198 | 24.5% |
| 4+ Person Household | 108 | 13.4% |
| Total Housing Units | 807 | 100.0% |
Occupancy by Ownership by Household Size in Shell Point
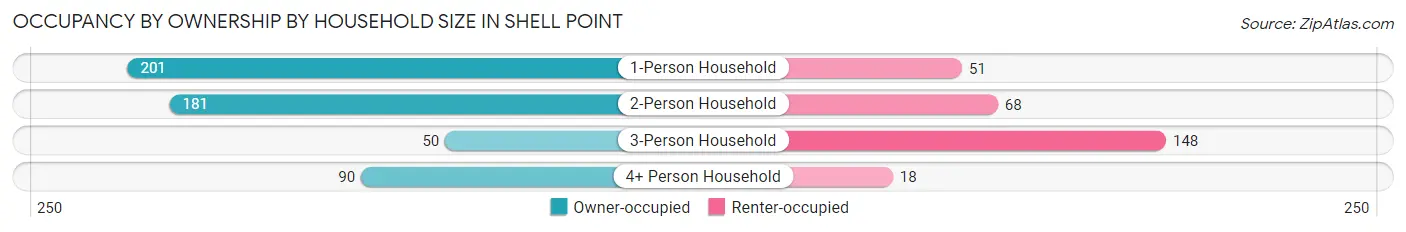
| Household Size | Owner-occupied | Renter-occupied |
| 1-Person Household | 201 (79.8%) | 51 (20.2%) |
| 2-Person Household | 181 (72.7%) | 68 (27.3%) |
| 3-Person Household | 50 (25.3%) | 148 (74.8%) |
| 4+ Person Household | 90 (83.3%) | 18 (16.7%) |
| Total Housing Units | 522 (64.7%) | 285 (35.3%) |
Occupancy by Educational Attainment in Shell Point
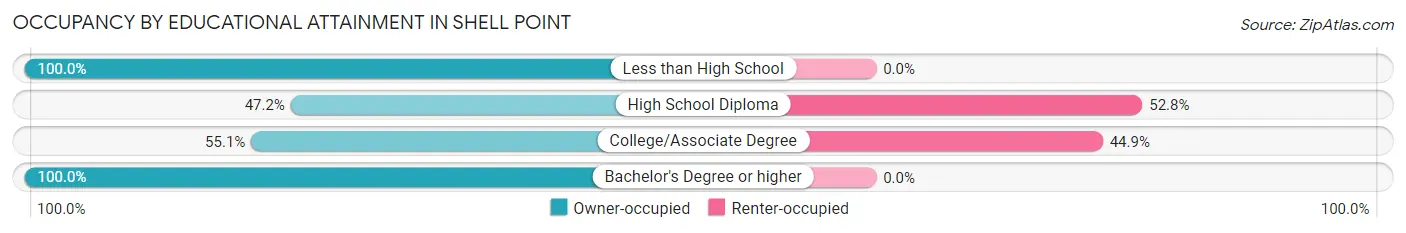
| Household Size | Owner-occupied | Renter-occupied |
| Less than High School | 21 (100.0%) | 0 (0.0%) |
| High School Diploma | 77 (47.2%) | 86 (52.8%) |
| College/Associate Degree | 244 (55.1%) | 199 (44.9%) |
| Bachelor's Degree or higher | 180 (100.0%) | 0 (0.0%) |
Occupancy by Age of Householder in Shell Point
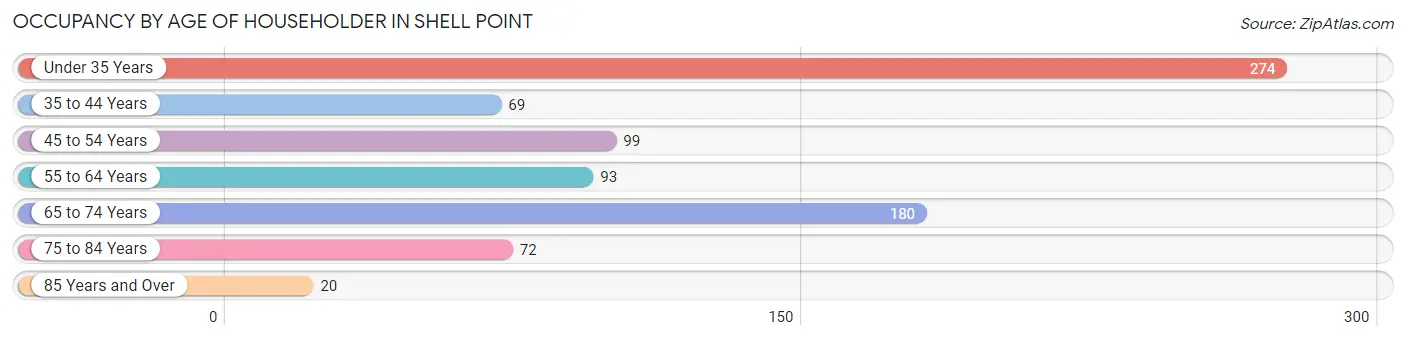
| Age Bracket | # Households | % Households |
| Under 35 Years | 274 | 34.0% |
| 35 to 44 Years | 69 | 8.6% |
| 45 to 54 Years | 99 | 12.3% |
| 55 to 64 Years | 93 | 11.5% |
| 65 to 74 Years | 180 | 22.3% |
| 75 to 84 Years | 72 | 8.9% |
| 85 Years and Over | 20 | 2.5% |
| Total | 807 | 100.0% |
Housing Finances in Shell Point
Median Income by Occupancy in Shell Point
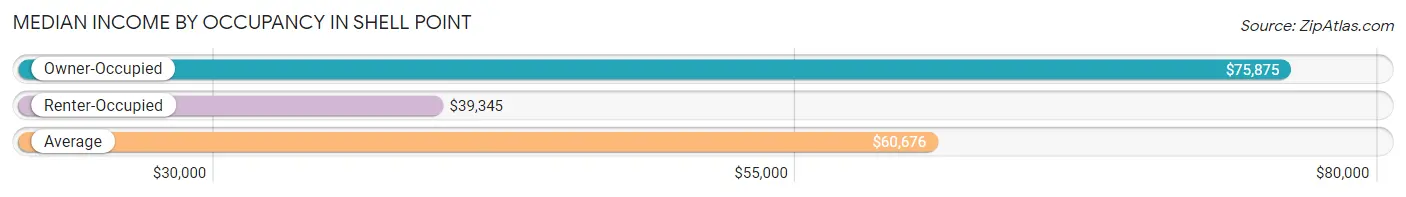
| Occupancy Type | # Households | Median Income |
| Owner-Occupied | 522 (64.7%) | $75,875 |
| Renter-Occupied | 285 (35.3%) | $39,345 |
| Average | 807 (100.0%) | $60,676 |
Occupancy by Householder Income Bracket in Shell Point
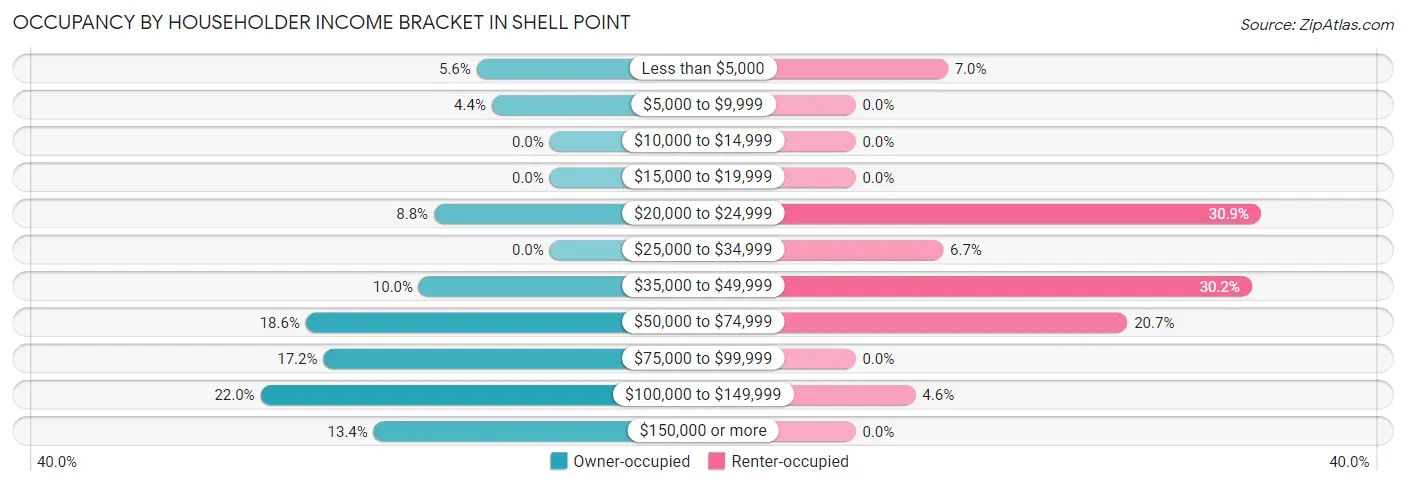
| Income Bracket | Owner-occupied | Renter-occupied |
| Less than $5,000 | 29 (5.6%) | 20 (7.0%) |
| $5,000 to $9,999 | 23 (4.4%) | 0 (0.0%) |
| $10,000 to $14,999 | 0 (0.0%) | 0 (0.0%) |
| $15,000 to $19,999 | 0 (0.0%) | 0 (0.0%) |
| $20,000 to $24,999 | 46 (8.8%) | 88 (30.9%) |
| $25,000 to $34,999 | 0 (0.0%) | 19 (6.7%) |
| $35,000 to $49,999 | 52 (10.0%) | 86 (30.2%) |
| $50,000 to $74,999 | 97 (18.6%) | 59 (20.7%) |
| $75,000 to $99,999 | 90 (17.2%) | 0 (0.0%) |
| $100,000 to $149,999 | 115 (22.0%) | 13 (4.6%) |
| $150,000 or more | 70 (13.4%) | 0 (0.0%) |
| Total | 522 (100.0%) | 285 (100.0%) |
Monthly Housing Cost Tiers in Shell Point
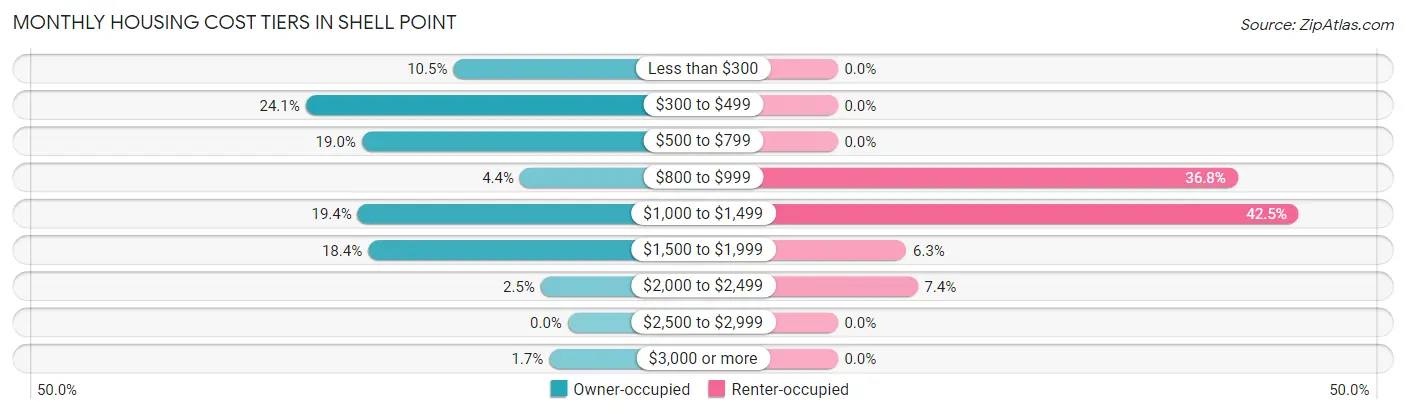
| Monthly Cost | Owner-occupied | Renter-occupied |
| Less than $300 | 55 (10.5%) | 0 (0.0%) |
| $300 to $499 | 126 (24.1%) | 0 (0.0%) |
| $500 to $799 | 99 (19.0%) | 0 (0.0%) |
| $800 to $999 | 23 (4.4%) | 105 (36.8%) |
| $1,000 to $1,499 | 101 (19.4%) | 121 (42.5%) |
| $1,500 to $1,999 | 96 (18.4%) | 18 (6.3%) |
| $2,000 to $2,499 | 13 (2.5%) | 21 (7.4%) |
| $2,500 to $2,999 | 0 (0.0%) | 0 (0.0%) |
| $3,000 or more | 9 (1.7%) | 0 (0.0%) |
| Total | 522 (100.0%) | 285 (100.0%) |
Physical Housing Characteristics in Shell Point
Housing Structures in Shell Point
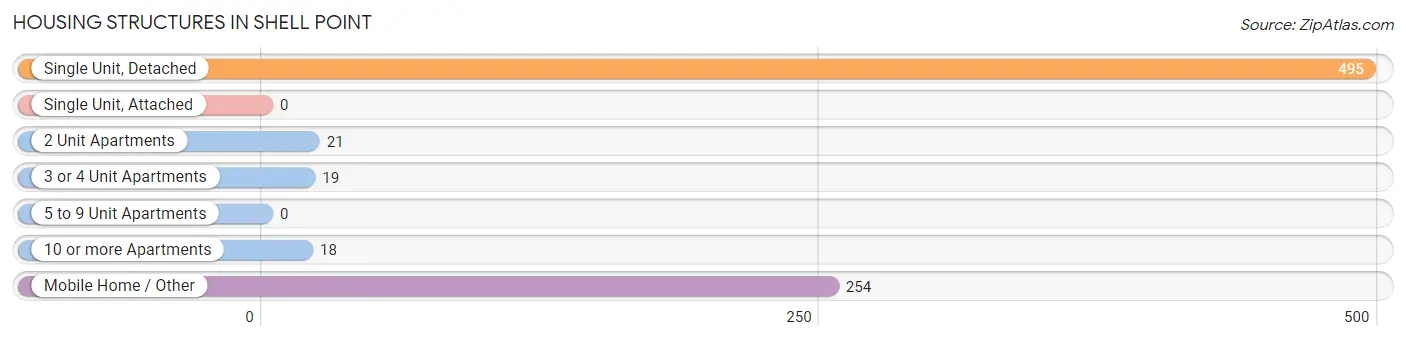
| Structure Type | # Housing Units | % Housing Units |
| Single Unit, Detached | 495 | 61.3% |
| Single Unit, Attached | 0 | 0.0% |
| 2 Unit Apartments | 21 | 2.6% |
| 3 or 4 Unit Apartments | 19 | 2.4% |
| 5 to 9 Unit Apartments | 0 | 0.0% |
| 10 or more Apartments | 18 | 2.2% |
| Mobile Home / Other | 254 | 31.5% |
| Total | 807 | 100.0% |
Housing Structures by Occupancy in Shell Point
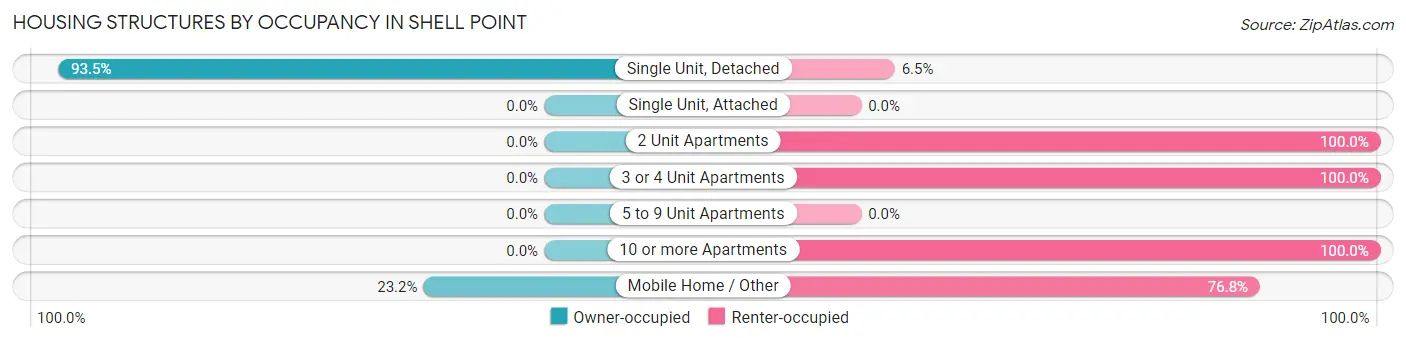
| Structure Type | Owner-occupied | Renter-occupied |
| Single Unit, Detached | 463 (93.5%) | 32 (6.5%) |
| Single Unit, Attached | 0 (0.0%) | 0 (0.0%) |
| 2 Unit Apartments | 0 (0.0%) | 21 (100.0%) |
| 3 or 4 Unit Apartments | 0 (0.0%) | 19 (100.0%) |
| 5 to 9 Unit Apartments | 0 (0.0%) | 0 (0.0%) |
| 10 or more Apartments | 0 (0.0%) | 18 (100.0%) |
| Mobile Home / Other | 59 (23.2%) | 195 (76.8%) |
| Total | 522 (64.7%) | 285 (35.3%) |
Housing Structures by Number of Rooms in Shell Point
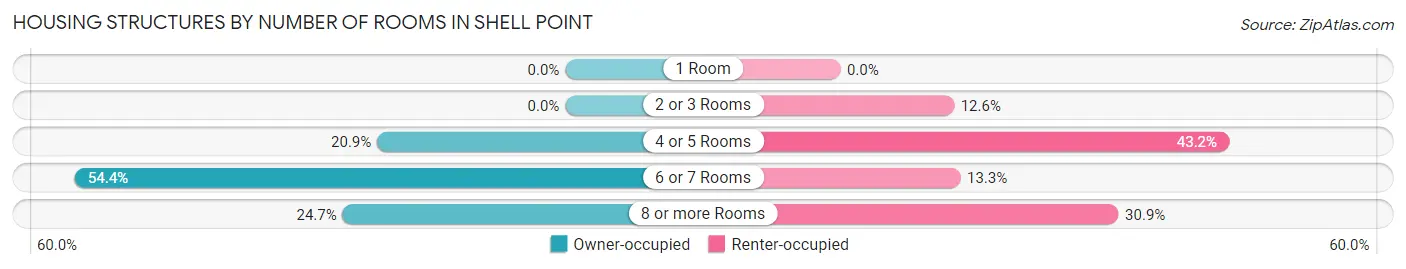
| Number of Rooms | Owner-occupied | Renter-occupied |
| 1 Room | 0 (0.0%) | 0 (0.0%) |
| 2 or 3 Rooms | 0 (0.0%) | 36 (12.6%) |
| 4 or 5 Rooms | 109 (20.9%) | 123 (43.2%) |
| 6 or 7 Rooms | 284 (54.4%) | 38 (13.3%) |
| 8 or more Rooms | 129 (24.7%) | 88 (30.9%) |
| Total | 522 (100.0%) | 285 (100.0%) |
Housing Structure by Heating Type in Shell Point
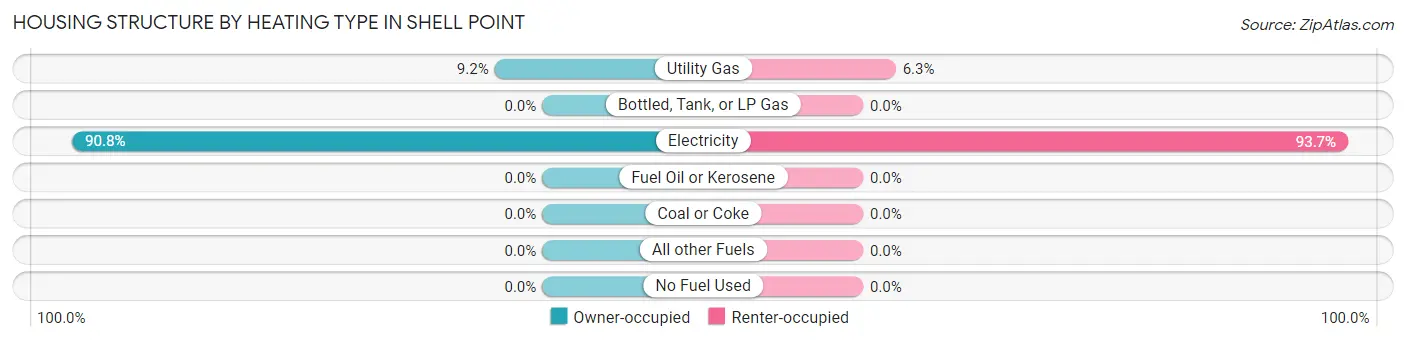
| Heating Type | Owner-occupied | Renter-occupied |
| Utility Gas | 48 (9.2%) | 18 (6.3%) |
| Bottled, Tank, or LP Gas | 0 (0.0%) | 0 (0.0%) |
| Electricity | 474 (90.8%) | 267 (93.7%) |
| Fuel Oil or Kerosene | 0 (0.0%) | 0 (0.0%) |
| Coal or Coke | 0 (0.0%) | 0 (0.0%) |
| All other Fuels | 0 (0.0%) | 0 (0.0%) |
| No Fuel Used | 0 (0.0%) | 0 (0.0%) |
| Total | 522 (100.0%) | 285 (100.0%) |
Household Vehicle Usage in Shell Point
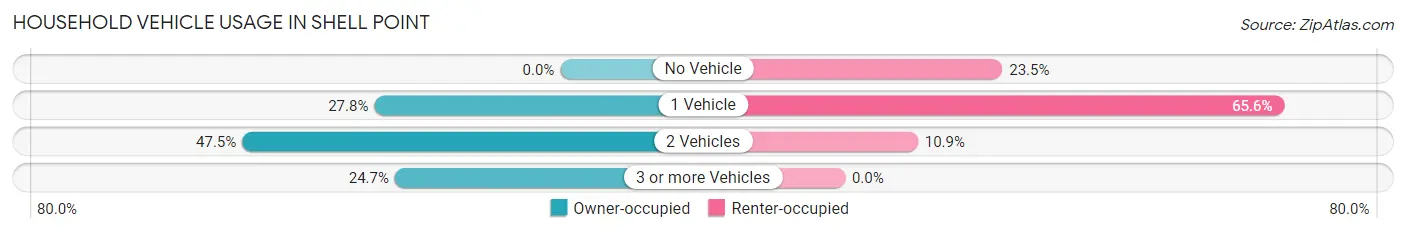
| Vehicles per Household | Owner-occupied | Renter-occupied |
| No Vehicle | 0 (0.0%) | 67 (23.5%) |
| 1 Vehicle | 145 (27.8%) | 187 (65.6%) |
| 2 Vehicles | 248 (47.5%) | 31 (10.9%) |
| 3 or more Vehicles | 129 (24.7%) | 0 (0.0%) |
| Total | 522 (100.0%) | 285 (100.0%) |
Real Estate & Mortgages in Shell Point
Real Estate and Mortgage Overview in Shell Point
| Characteristic | Without Mortgage | With Mortgage |
| Housing Units | 290 | 232 |
| Median Property Value | $271,900 | $221,000 |
| Median Household Income | $61,023 | $33 |
| Monthly Housing Costs | $436 | $9 |
| Real Estate Taxes | $1,159 | $0 |
Property Value by Mortgage Status in Shell Point
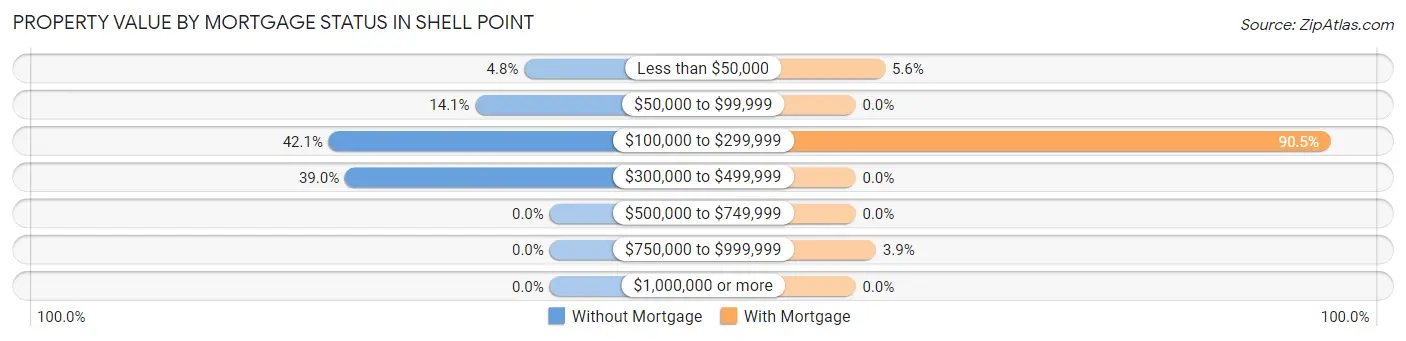
| Property Value | Without Mortgage | With Mortgage |
| Less than $50,000 | 14 (4.8%) | 13 (5.6%) |
| $50,000 to $99,999 | 41 (14.1%) | 0 (0.0%) |
| $100,000 to $299,999 | 122 (42.1%) | 210 (90.5%) |
| $300,000 to $499,999 | 113 (39.0%) | 0 (0.0%) |
| $500,000 to $749,999 | 0 (0.0%) | 0 (0.0%) |
| $750,000 to $999,999 | 0 (0.0%) | 9 (3.9%) |
| $1,000,000 or more | 0 (0.0%) | 0 (0.0%) |
| Total | 290 (100.0%) | 232 (100.0%) |
Household Income by Mortgage Status in Shell Point
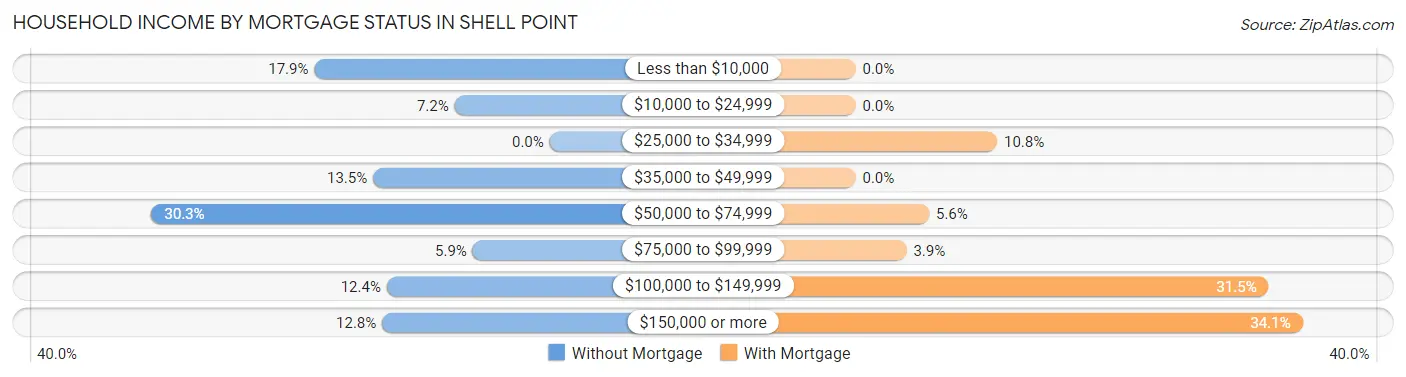
| Household Income | Without Mortgage | With Mortgage |
| Less than $10,000 | 52 (17.9%) | 0 (0.0%) |
| $10,000 to $24,999 | 21 (7.2%) | 0 (0.0%) |
| $25,000 to $34,999 | 0 (0.0%) | 25 (10.8%) |
| $35,000 to $49,999 | 39 (13.5%) | 0 (0.0%) |
| $50,000 to $74,999 | 88 (30.3%) | 13 (5.6%) |
| $75,000 to $99,999 | 17 (5.9%) | 9 (3.9%) |
| $100,000 to $149,999 | 36 (12.4%) | 73 (31.5%) |
| $150,000 or more | 37 (12.8%) | 79 (34.1%) |
| Total | 290 (100.0%) | 232 (100.0%) |
Property Value to Household Income Ratio in Shell Point
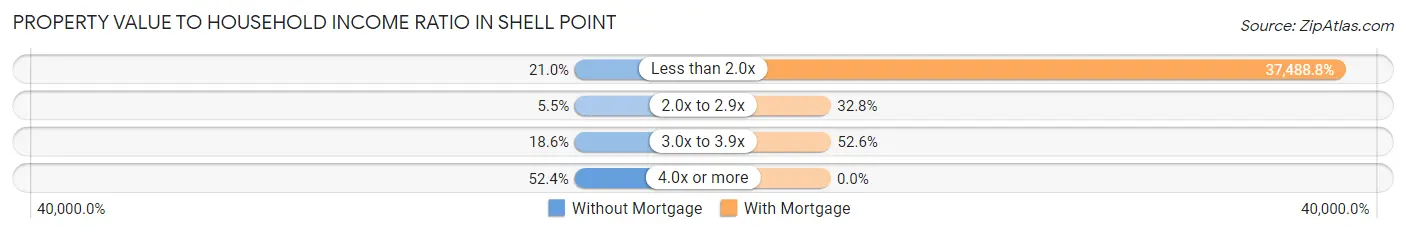
| Value-to-Income Ratio | Without Mortgage | With Mortgage |
| Less than 2.0x | 61 (21.0%) | 86,974 (37,488.8%) |
| 2.0x to 2.9x | 16 (5.5%) | 76 (32.8%) |
| 3.0x to 3.9x | 54 (18.6%) | 122 (52.6%) |
| 4.0x or more | 152 (52.4%) | 0 (0.0%) |
| Total | 290 (100.0%) | 232 (100.0%) |
Real Estate Taxes by Mortgage Status in Shell Point
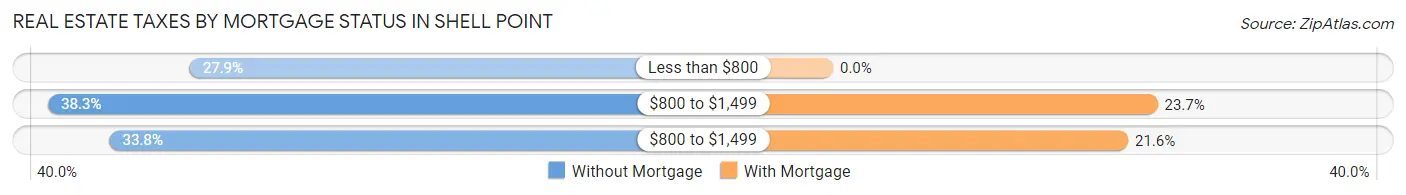
| Property Taxes | Without Mortgage | With Mortgage |
| Less than $800 | 81 (27.9%) | 0 (0.0%) |
| $800 to $1,499 | 111 (38.3%) | 55 (23.7%) |
| $800 to $1,499 | 98 (33.8%) | 50 (21.5%) |
| Total | 290 (100.0%) | 232 (100.0%) |
Health & Disability in Shell Point
Health Insurance Coverage by Age in Shell Point
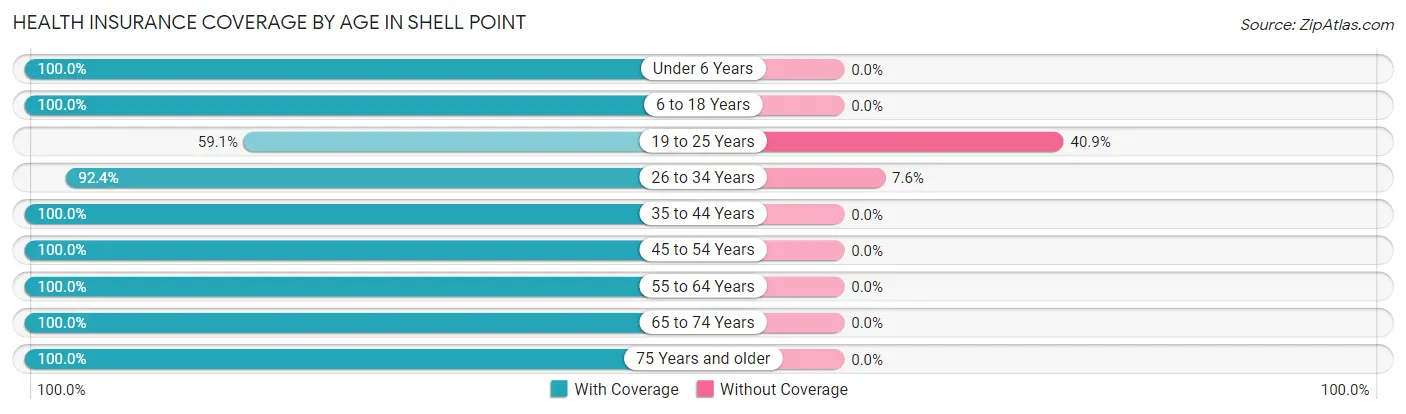
| Age Bracket | With Coverage | Without Coverage |
| Under 6 Years | 280 (100.0%) | 0 (0.0%) |
| 6 to 18 Years | 290 (100.0%) | 0 (0.0%) |
| 19 to 25 Years | 146 (59.1%) | 101 (40.9%) |
| 26 to 34 Years | 364 (92.4%) | 30 (7.6%) |
| 35 to 44 Years | 80 (100.0%) | 0 (0.0%) |
| 45 to 54 Years | 157 (100.0%) | 0 (0.0%) |
| 55 to 64 Years | 191 (100.0%) | 0 (0.0%) |
| 65 to 74 Years | 241 (100.0%) | 0 (0.0%) |
| 75 Years and older | 146 (100.0%) | 0 (0.0%) |
| Total | 1,895 (93.5%) | 131 (6.5%) |
Health Insurance Coverage by Citizenship Status in Shell Point
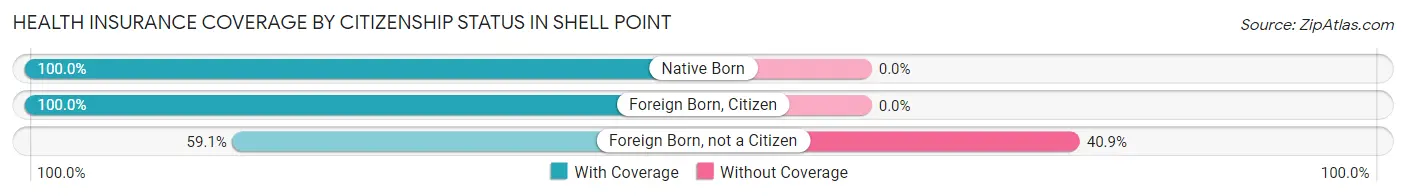
| Citizenship Status | With Coverage | Without Coverage |
| Native Born | 280 (100.0%) | 0 (0.0%) |
| Foreign Born, Citizen | 290 (100.0%) | 0 (0.0%) |
| Foreign Born, not a Citizen | 146 (59.1%) | 101 (40.9%) |
Health Insurance Coverage by Household Income in Shell Point
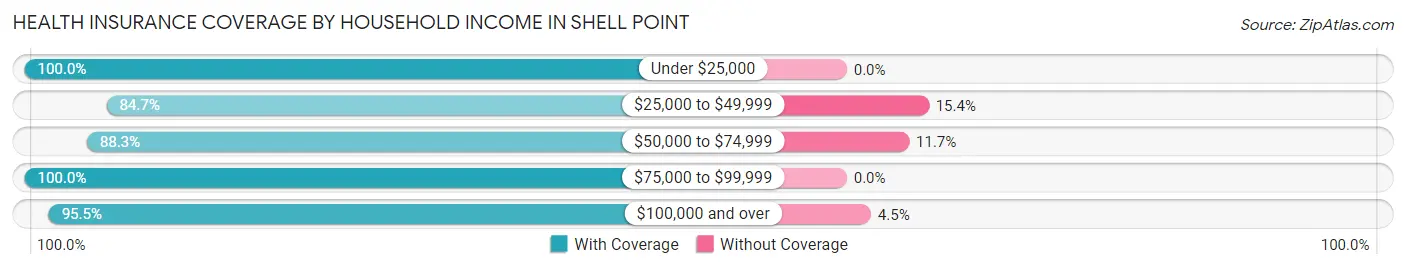
| Household Income | With Coverage | Without Coverage |
| Under $25,000 | 305 (100.0%) | 0 (0.0%) |
| $25,000 to $49,999 | 364 (84.7%) | 66 (15.3%) |
| $50,000 to $74,999 | 265 (88.3%) | 35 (11.7%) |
| $75,000 to $99,999 | 327 (100.0%) | 0 (0.0%) |
| $100,000 and over | 634 (95.5%) | 30 (4.5%) |
Public vs Private Health Insurance Coverage by Age in Shell Point
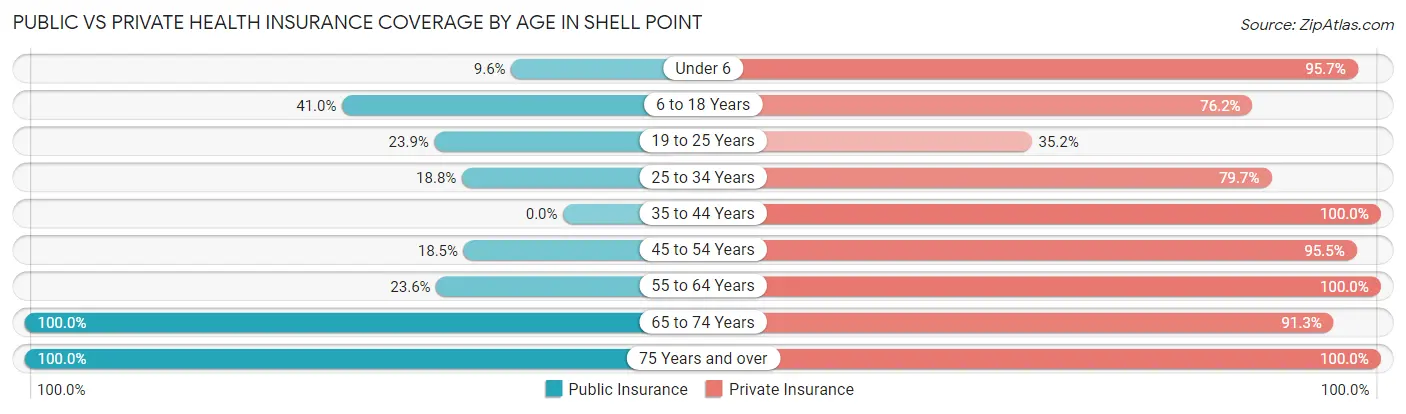
| Age Bracket | Public Insurance | Private Insurance |
| Under 6 | 27 (9.6%) | 268 (95.7%) |
| 6 to 18 Years | 119 (41.0%) | 221 (76.2%) |
| 19 to 25 Years | 59 (23.9%) | 87 (35.2%) |
| 25 to 34 Years | 74 (18.8%) | 314 (79.7%) |
| 35 to 44 Years | 0 (0.0%) | 80 (100.0%) |
| 45 to 54 Years | 29 (18.5%) | 150 (95.5%) |
| 55 to 64 Years | 45 (23.6%) | 191 (100.0%) |
| 65 to 74 Years | 241 (100.0%) | 220 (91.3%) |
| 75 Years and over | 146 (100.0%) | 146 (100.0%) |
| Total | 740 (36.5%) | 1,677 (82.8%) |
Disability Status by Sex by Age in Shell Point
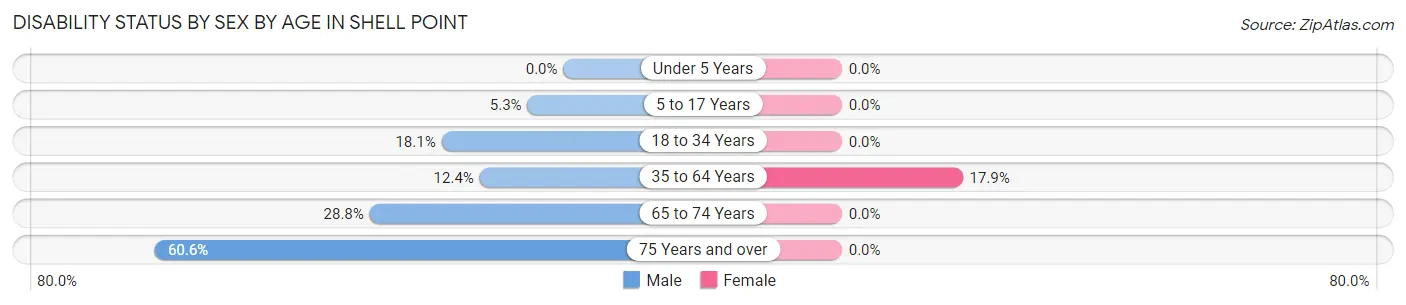
| Age Bracket | Male | Female |
| Under 5 Years | 0 (0.0%) | 0 (0.0%) |
| 5 to 17 Years | 8 (5.3%) | 0 (0.0%) |
| 18 to 34 Years | 57 (18.1%) | 0 (0.0%) |
| 35 to 64 Years | 22 (12.4%) | 45 (17.9%) |
| 65 to 74 Years | 42 (28.8%) | 0 (0.0%) |
| 75 Years and over | 57 (60.6%) | 0 (0.0%) |
Disability Class by Sex by Age in Shell Point
Disability Class: Hearing Difficulty
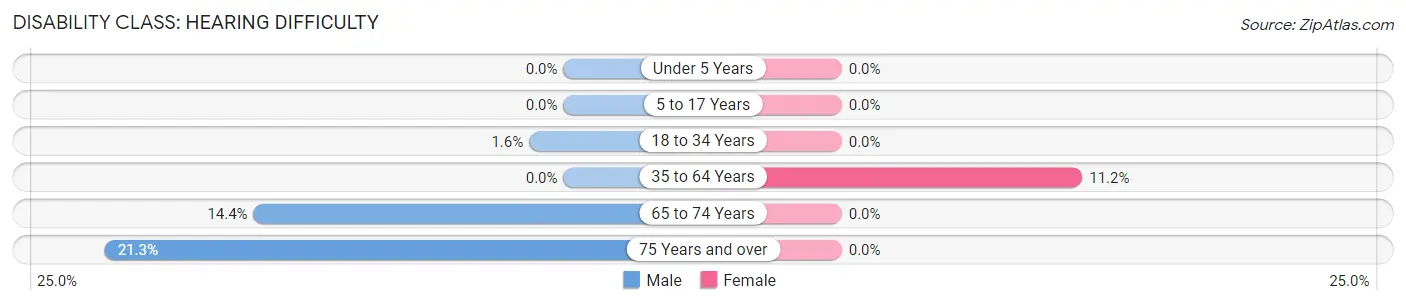
| Age Bracket | Male | Female |
| Under 5 Years | 0 (0.0%) | 0 (0.0%) |
| 5 to 17 Years | 0 (0.0%) | 0 (0.0%) |
| 18 to 34 Years | 5 (1.6%) | 0 (0.0%) |
| 35 to 64 Years | 0 (0.0%) | 28 (11.2%) |
| 65 to 74 Years | 21 (14.4%) | 0 (0.0%) |
| 75 Years and over | 20 (21.3%) | 0 (0.0%) |
Disability Class: Vision Difficulty
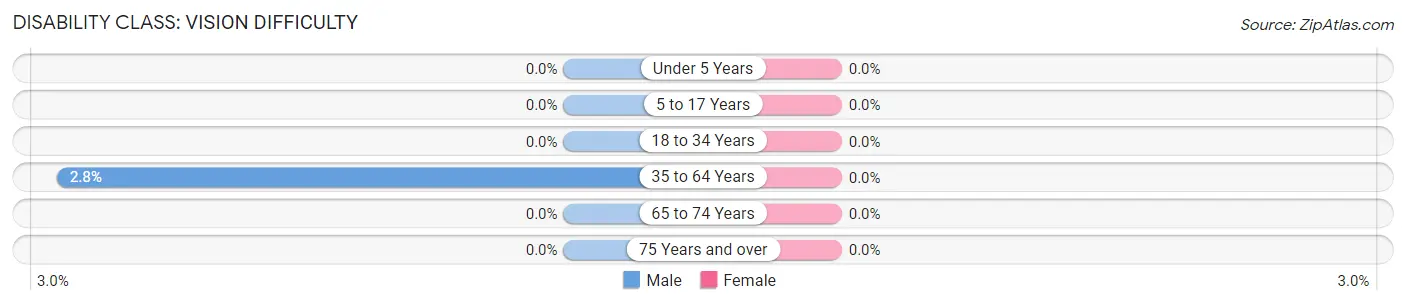
| Age Bracket | Male | Female |
| Under 5 Years | 0 (0.0%) | 0 (0.0%) |
| 5 to 17 Years | 0 (0.0%) | 0 (0.0%) |
| 18 to 34 Years | 0 (0.0%) | 0 (0.0%) |
| 35 to 64 Years | 5 (2.8%) | 0 (0.0%) |
| 65 to 74 Years | 0 (0.0%) | 0 (0.0%) |
| 75 Years and over | 0 (0.0%) | 0 (0.0%) |
Disability Class: Cognitive Difficulty
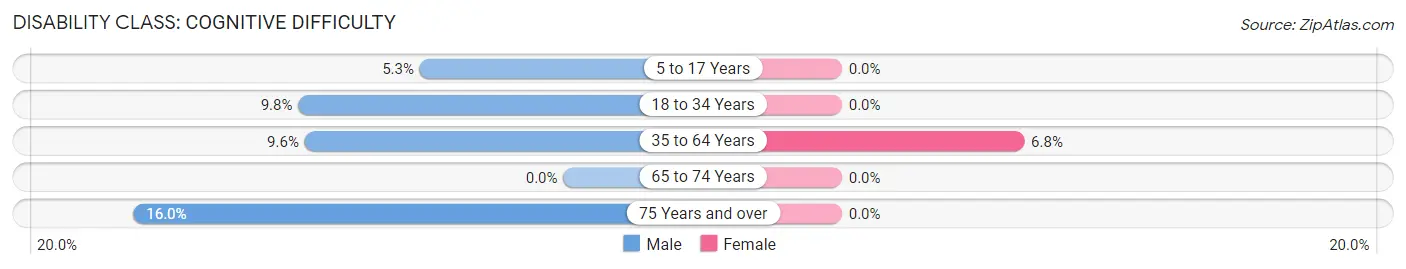
| Age Bracket | Male | Female |
| 5 to 17 Years | 8 (5.3%) | 0 (0.0%) |
| 18 to 34 Years | 31 (9.8%) | 0 (0.0%) |
| 35 to 64 Years | 17 (9.6%) | 17 (6.8%) |
| 65 to 74 Years | 0 (0.0%) | 0 (0.0%) |
| 75 Years and over | 15 (16.0%) | 0 (0.0%) |
Disability Class: Ambulatory Difficulty
| Age Bracket | Male | Female |
| 5 to 17 Years | 0 (0.0%) | 0 (0.0%) |
| 18 to 34 Years | 0 (0.0%) | 0 (0.0%) |
| 35 to 64 Years | 17 (9.6%) | 0 (0.0%) |
| 65 to 74 Years | 21 (14.4%) | 0 (0.0%) |
| 75 Years and over | 57 (60.6%) | 0 (0.0%) |
Disability Class: Self-Care Difficulty
| Age Bracket | Male | Female |
| 5 to 17 Years | 0 (0.0%) | 0 (0.0%) |
| 18 to 34 Years | 0 (0.0%) | 0 (0.0%) |
| 35 to 64 Years | 17 (9.6%) | 0 (0.0%) |
| 65 to 74 Years | 0 (0.0%) | 0 (0.0%) |
| 75 Years and over | 35 (37.2%) | 0 (0.0%) |
Technology Access in Shell Point
Computing Device Access in Shell Point
| Device Type | # Households | % Households |
| Desktop or Laptop | 617 | 76.5% |
| Smartphone | 697 | 86.4% |
| Tablet | 370 | 45.9% |
| No Computing Device | 35 | 4.3% |
| Total | 807 | 100.0% |
Internet Access in Shell Point
| Internet Type | # Households | % Households |
| Dial-Up Internet | 0 | 0.0% |
| Broadband Home | 438 | 54.3% |
| Cellular Data Only | 196 | 24.3% |
| Satellite Internet | 84 | 10.4% |
| No Internet | 41 | 5.1% |
| Total | 807 | 100.0% |
Shell Point Summary
Point Shell, South Carolina is a small town located in the Lowcountry region of the state. It is situated on the banks of the Ashepoo River, just south of the city of Charleston. The town has a population of just over 1,000 people and is known for its rich history, beautiful scenery, and unique culture.
History
Point Shell has a long and storied history. The area was first settled by Native Americans, who lived in the area for thousands of years before the arrival of Europeans. The first Europeans to settle in the area were French Huguenots, who arrived in the late 1600s. They established a trading post and a small settlement, which eventually grew into the town of Point Shell.
In the late 1700s, the town was a major port for the export of rice, cotton, and other goods. It was also a popular destination for wealthy planters, who built grand homes in the area. During the Civil War, the town was occupied by Union forces, who used it as a base of operations. After the war, the town slowly began to rebuild and by the early 1900s, it had become a popular tourist destination.
Geography
Point Shell is located in the Lowcountry region of South Carolina, just south of the city of Charleston. The town is situated on the banks of the Ashepoo River, which provides a picturesque backdrop for the town. The town is surrounded by lush marshlands and is home to a variety of wildlife, including alligators, turtles, and birds.
The town is located in Colleton County, which is part of the Charleston-North Charleston-Summerville Metropolitan Statistical Area. The town is located about 30 miles from Charleston and is accessible by car or boat.
Economy
The economy of Point Shell is largely based on tourism. The town is a popular destination for visitors who come to enjoy the scenery, wildlife, and history of the area. The town is also home to a number of small businesses, including restaurants, shops, and galleries.
The town is also home to a number of marinas, which provide access to the Ashepoo River and the surrounding waterways. These marinas offer a variety of services, including boat rentals, fishing charters, and boat tours.
Demographics
As of the 2010 census, the population of Point Shell was 1,072. The town is predominantly white, with a small African American population. The median household income is $41,250, and the median home value is $179,000.
Conclusion
Point Shell, South Carolina is a small town with a rich history, beautiful scenery, and unique culture. The town is a popular tourist destination and is home to a variety of small businesses. The town is also home to a number of marinas, which provide access to the Ashepoo River and the surrounding waterways. The town has a population of just over 1,000 people and is predominantly white, with a small African American population.
Common Questions
What is the Total Population of Shell Point?
Total Population of Shell Point is 2,026.
What is the Total Male Population of Shell Point?
Total Male Population of Shell Point is 957.
What is the Total Female Population of Shell Point?
Total Female Population of Shell Point is 1,069.
What is the Ratio of Males per 100 Females in Shell Point?
There are 89.52 Males per 100 Females in Shell Point.
What is the Ratio of Females per 100 Males in Shell Point?
There are 111.70 Females per 100 Males in Shell Point.
What is the Median Population Age in Shell Point?
Median Population Age in Shell Point is 30.1 Years.
What is the Average Family Size in Shell Point
Average Family Size in Shell Point is 3.2 People.
What is the Average Household Size in Shell Point
Average Household Size in Shell Point is 2.5 People.
What is Per Capita Income in Shell Point?
Per Capita income in Shell Point is $28,411.
What is the Median Family Income in Shell Point?
Median Family Income in Shell Point is $63,305.
What is the Median Household income in Shell Point?
Median Household Income in Shell Point is $60,676.
What is Income or Wage Gap in Shell Point?
Income or Wage Gap in Shell Point is 26.4%.
Women in Shell Point earn 73.6 cents for every dollar earned by a man.
What is Inequality or Gini Index in Shell Point?
Inequality or Gini Index in Shell Point is 0.41.
How Large is the Labor Force in Shell Point?
There are 961 People in the Labor Forcein in Shell Point.
What is the Percentage of People in the Labor Force in Shell Point?
62.5% of People are in the Labor Force in Shell Point.
What is the Unemployment Rate in Shell Point?
Unemployment Rate in Shell Point is 8.8%.