St George, SC
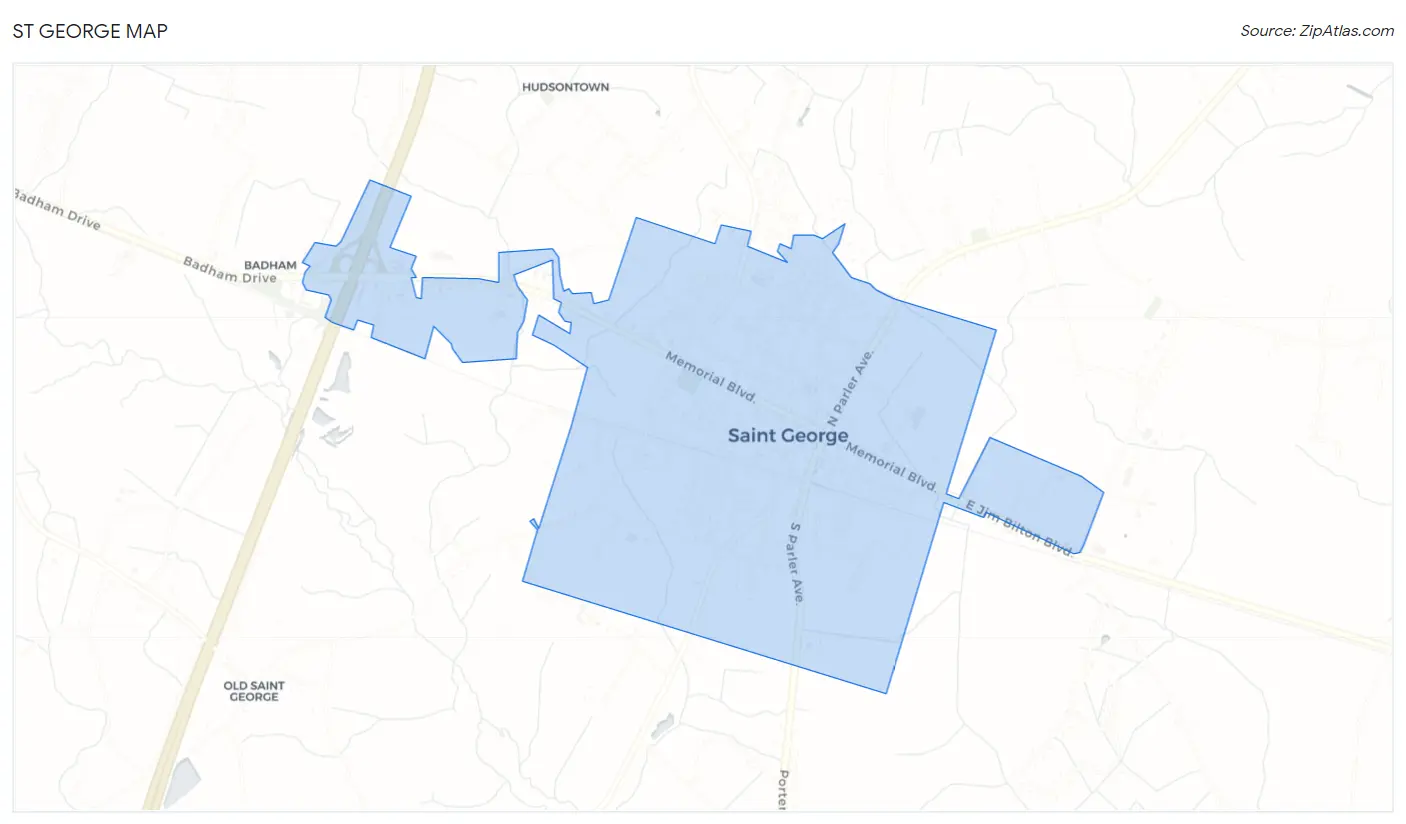
St George Map
St George Overview
1,901
TOTAL POPULATION
828
MALE POPULATION
1,073
FEMALE POPULATION
77.17
MALES / 100 FEMALES
129.59
FEMALES / 100 MALES
41.8
MEDIAN AGE
2.8
AVG FAMILY SIZE
2.3
AVG HOUSEHOLD SIZE
$22,188
PER CAPITA INCOME
$28,324
AVG FAMILY INCOME
$28,490
AVG HOUSEHOLD INCOME
52.6%
WAGE / INCOME GAP [ % ]
47.4¢/ $1
WAGE / INCOME GAP [ $ ]
0.48
INEQUALITY / GINI INDEX
636
LABOR FORCE [ PEOPLE ]
42.0%
PERCENT IN LABOR FORCE
0.8%
UNEMPLOYMENT RATE
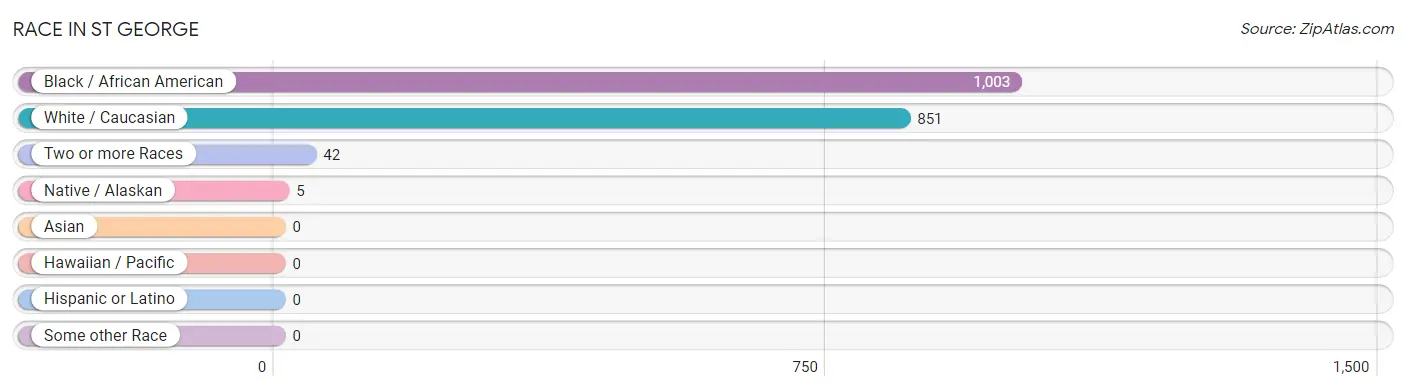
Race in St George
The most populous races in St George are Black / African American (1,003 | 52.8%), White / Caucasian (851 | 44.8%), and Two or more Races (42 | 2.2%).
| Race | # Population | % Population |
| Asian | 0 | 0.0% |
| Black / African American | 1,003 | 52.8% |
| Hawaiian / Pacific | 0 | 0.0% |
| Hispanic or Latino | 0 | 0.0% |
| Native / Alaskan | 5 | 0.3% |
| White / Caucasian | 851 | 44.8% |
| Two or more Races | 42 | 2.2% |
| Some other Race | 0 | 0.0% |
| Total | 1,901 | 100.0% |
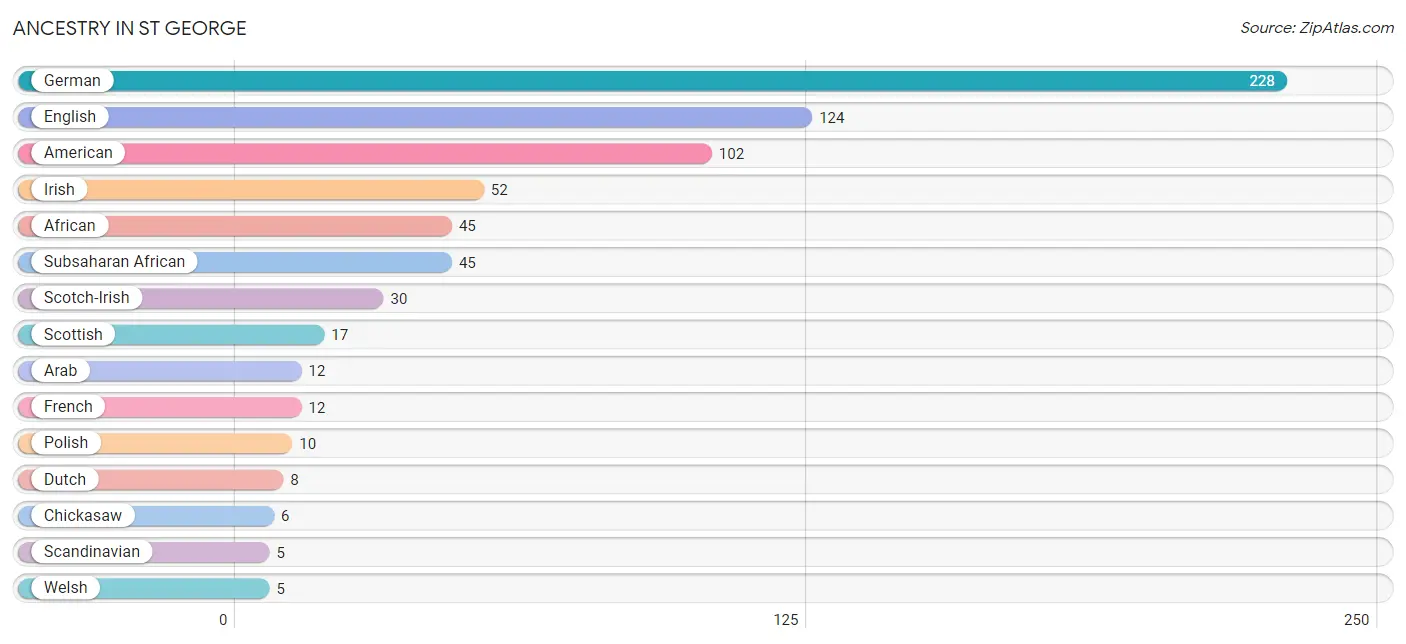
Ancestry in St George
The most populous ancestries reported in St George are German (228 | 12.0%), English (124 | 6.5%), American (102 | 5.4%), Irish (52 | 2.7%), and African (45 | 2.4%), together accounting for 29.0% of all St George residents.
| Ancestry | # Population | % Population |
| African | 45 | 2.4% |
| American | 102 | 5.4% |
| Arab | 12 | 0.6% |
| British | 4 | 0.2% |
| Chickasaw | 6 | 0.3% |
| Dutch | 8 | 0.4% |
| English | 124 | 6.5% |
| European | 3 | 0.2% |
| French | 12 | 0.6% |
| German | 228 | 12.0% |
| Hungarian | 2 | 0.1% |
| Irish | 52 | 2.7% |
| Polish | 10 | 0.5% |
| Scandinavian | 5 | 0.3% |
| Scotch-Irish | 30 | 1.6% |
| Scottish | 17 | 0.9% |
| Subsaharan African | 45 | 2.4% |
| Welsh | 5 | 0.3% | View All 18 Rows |
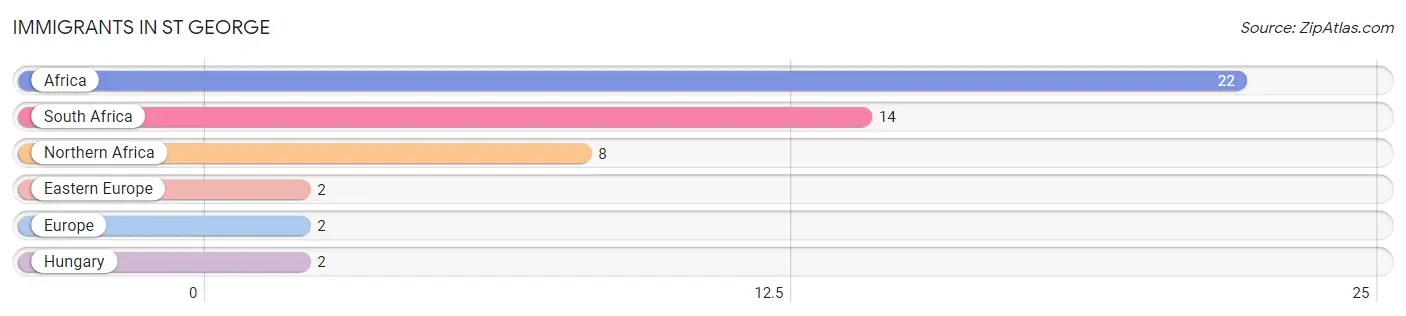
Immigrants in St George
The most numerous immigrant groups reported in St George came from Africa (22 | 1.2%), South Africa (14 | 0.7%), Northern Africa (8 | 0.4%), Eastern Europe (2 | 0.1%), and Europe (2 | 0.1%), together accounting for 2.5% of all St George residents.
| Immigration Origin | # Population | % Population |
| Africa | 22 | 1.2% |
| Eastern Europe | 2 | 0.1% |
| Europe | 2 | 0.1% |
| Hungary | 2 | 0.1% |
| Northern Africa | 8 | 0.4% |
| South Africa | 14 | 0.7% | View All 6 Rows |
Sex and Age in St George
Sex and Age in St George
The most populous age groups in St George are 70 to 74 Years (123 | 14.9%) for men and 5 to 9 Years (132 | 12.3%) for women.
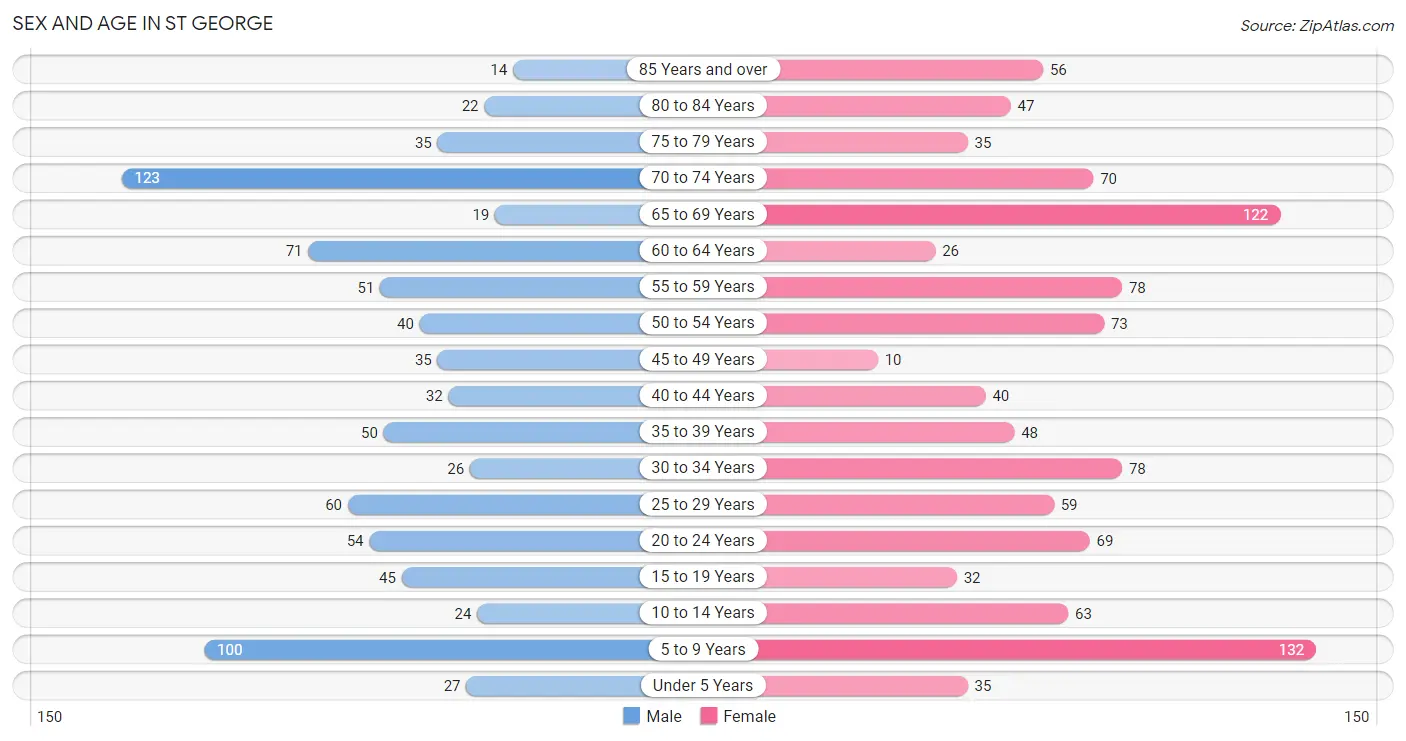
| Age Bracket | Male | Female |
| Under 5 Years | 27 (3.3%) | 35 (3.3%) |
| 5 to 9 Years | 100 (12.1%) | 132 (12.3%) |
| 10 to 14 Years | 24 (2.9%) | 63 (5.9%) |
| 15 to 19 Years | 45 (5.4%) | 32 (3.0%) |
| 20 to 24 Years | 54 (6.5%) | 69 (6.4%) |
| 25 to 29 Years | 60 (7.2%) | 59 (5.5%) |
| 30 to 34 Years | 26 (3.1%) | 78 (7.3%) |
| 35 to 39 Years | 50 (6.0%) | 48 (4.5%) |
| 40 to 44 Years | 32 (3.9%) | 40 (3.7%) |
| 45 to 49 Years | 35 (4.2%) | 10 (0.9%) |
| 50 to 54 Years | 40 (4.8%) | 73 (6.8%) |
| 55 to 59 Years | 51 (6.2%) | 78 (7.3%) |
| 60 to 64 Years | 71 (8.6%) | 26 (2.4%) |
| 65 to 69 Years | 19 (2.3%) | 122 (11.4%) |
| 70 to 74 Years | 123 (14.9%) | 70 (6.5%) |
| 75 to 79 Years | 35 (4.2%) | 35 (3.3%) |
| 80 to 84 Years | 22 (2.7%) | 47 (4.4%) |
| 85 Years and over | 14 (1.7%) | 56 (5.2%) |
| Total | 828 (100.0%) | 1,073 (100.0%) |
Families and Households in St George
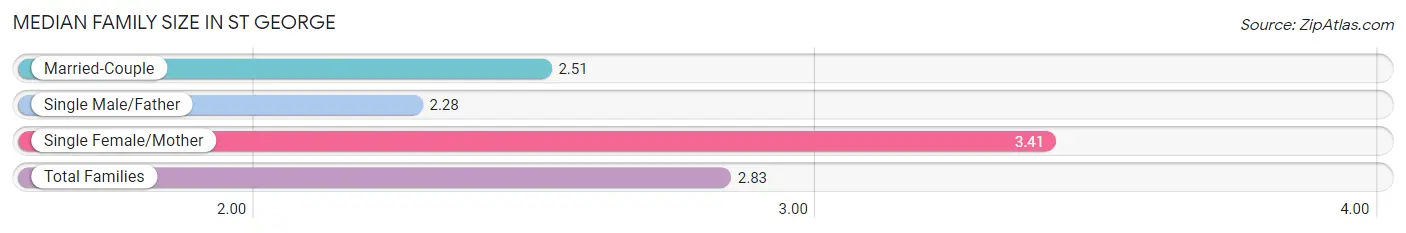
Median Family Size in St George
The median family size in St George is 2.83 persons per family, with single female/mother families (183 | 37.4%) accounting for the largest median family size of 3.41 persons per family. On the other hand, single male/father families (25 | 5.1%) represent the smallest median family size with 2.28 persons per family.
| Family Type | # Families | Family Size |
| Married-Couple | 281 (57.5%) | 2.51 |
| Single Male/Father | 25 (5.1%) | 2.28 |
| Single Female/Mother | 183 (37.4%) | 3.41 |
| Total Families | 489 (100.0%) | 2.83 |
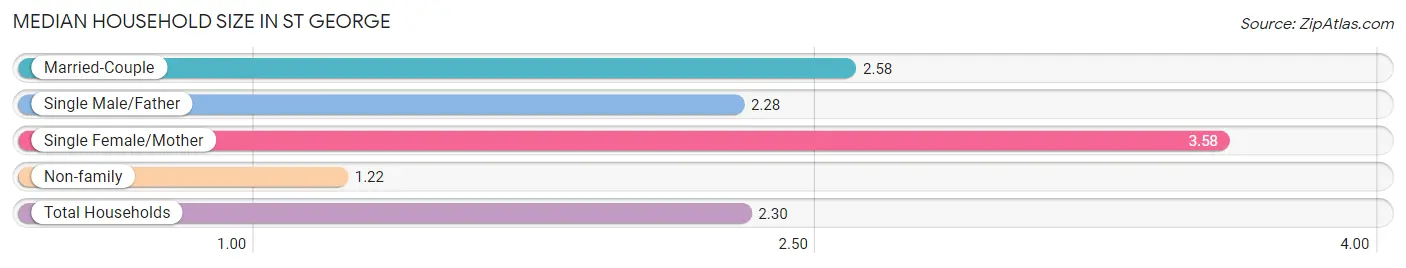
Median Household Size in St George
The median household size in St George is 2.30 persons per household, with single female/mother households (183 | 23.5%) accounting for the largest median household size of 3.58 persons per household. non-family households (288 | 37.1%) represent the smallest median household size with 1.22 persons per household.
| Household Type | # Households | Household Size |
| Married-Couple | 281 (36.2%) | 2.58 |
| Single Male/Father | 25 (3.2%) | 2.28 |
| Single Female/Mother | 183 (23.5%) | 3.58 |
| Non-family | 288 (37.1%) | 1.22 |
| Total Households | 777 (100.0%) | 2.30 |
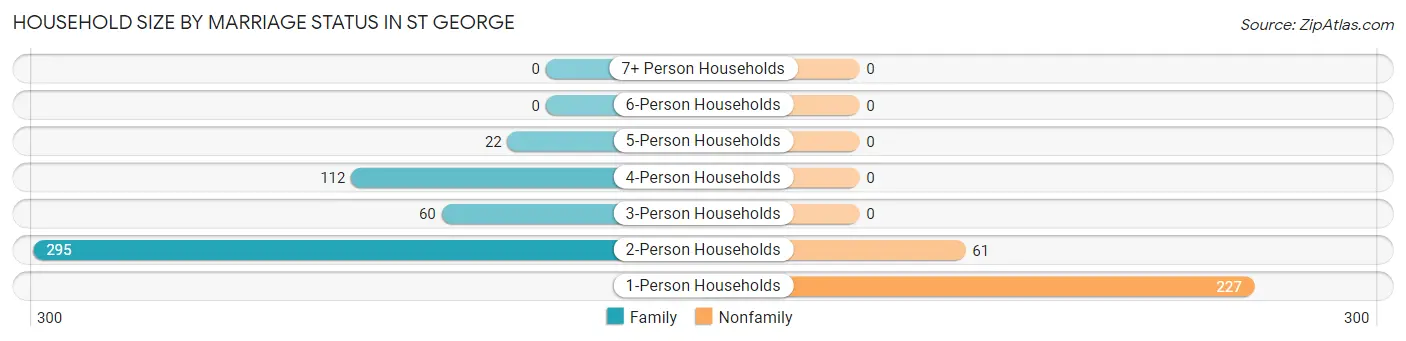
Household Size by Marriage Status in St George
Out of a total of 777 households in St George, 489 (62.9%) are family households, while 288 (37.1%) are nonfamily households. The most numerous type of family households are 2-person households, comprising 295, and the most common type of nonfamily households are 1-person households, comprising 227.
| Household Size | Family Households | Nonfamily Households |
| 1-Person Households | - | 227 (29.2%) |
| 2-Person Households | 295 (38.0%) | 61 (7.9%) |
| 3-Person Households | 60 (7.7%) | 0 (0.0%) |
| 4-Person Households | 112 (14.4%) | 0 (0.0%) |
| 5-Person Households | 22 (2.8%) | 0 (0.0%) |
| 6-Person Households | 0 (0.0%) | 0 (0.0%) |
| 7+ Person Households | 0 (0.0%) | 0 (0.0%) |
| Total | 489 (62.9%) | 288 (37.1%) |
Female Fertility in St George
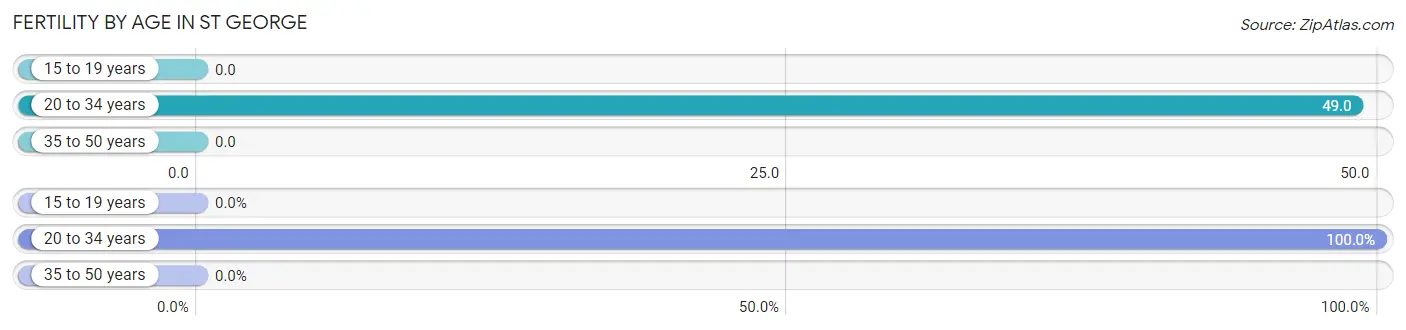
Fertility by Age in St George
Average fertility rate in St George is 29.0 births per 1,000 women. Women in the age bracket of 20 to 34 years have the highest fertility rate with 49.0 births per 1,000 women. Women in the age bracket of 20 to 34 years acount for 100.0% of all women with births.
| Age Bracket | Women with Births | Births / 1,000 Women |
| 15 to 19 years | 0 (0.0%) | 0.0 |
| 20 to 34 years | 10 (100.0%) | 49.0 |
| 35 to 50 years | 0 (0.0%) | 0.0 |
| Total | 10 (100.0%) | 29.0 |
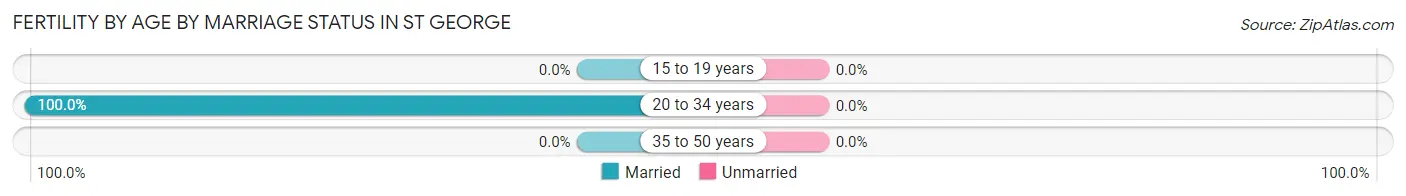
Fertility by Age by Marriage Status in St George
| Age Bracket | Married | Unmarried |
| 15 to 19 years | 0 (0.0%) | 0 (0.0%) |
| 20 to 34 years | 10 (100.0%) | 0 (0.0%) |
| 35 to 50 years | 0 (0.0%) | 0 (0.0%) |
| Total | 10 (100.0%) | 0 (0.0%) |
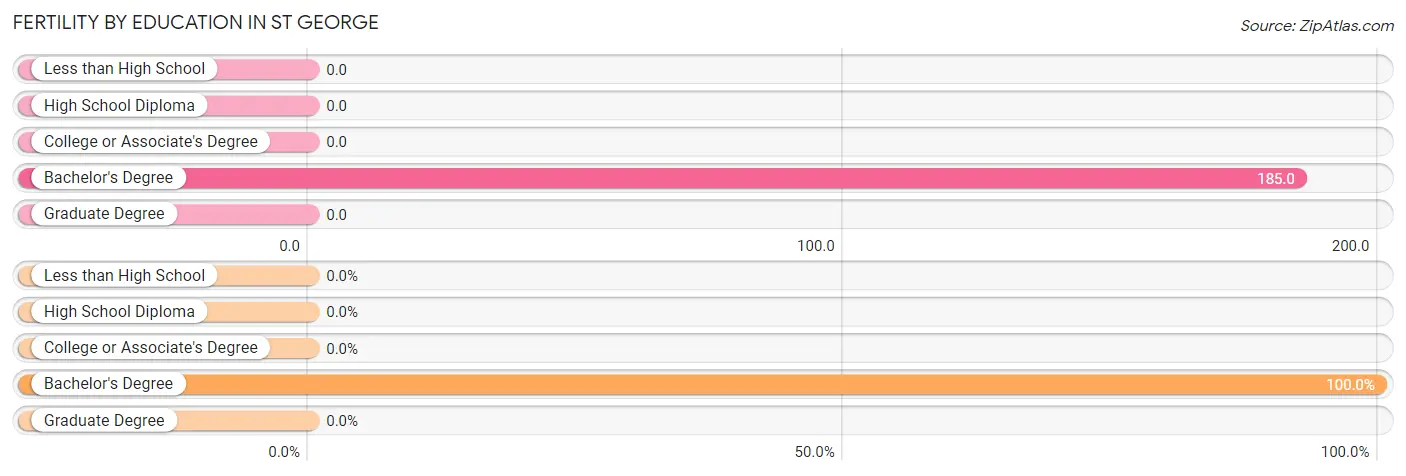
Fertility by Education in St George
| Educational Attainment | Women with Births | Births / 1,000 Women |
| Less than High School | 0 (0.0%) | 0.0 |
| High School Diploma | 0 (0.0%) | 0.0 |
| College or Associate's Degree | 0 (0.0%) | 0.0 |
| Bachelor's Degree | 10 (100.0%) | 185.0 |
| Graduate Degree | 0 (0.0%) | 0.0 |
| Total | 10 (100.0%) | 29.0 |
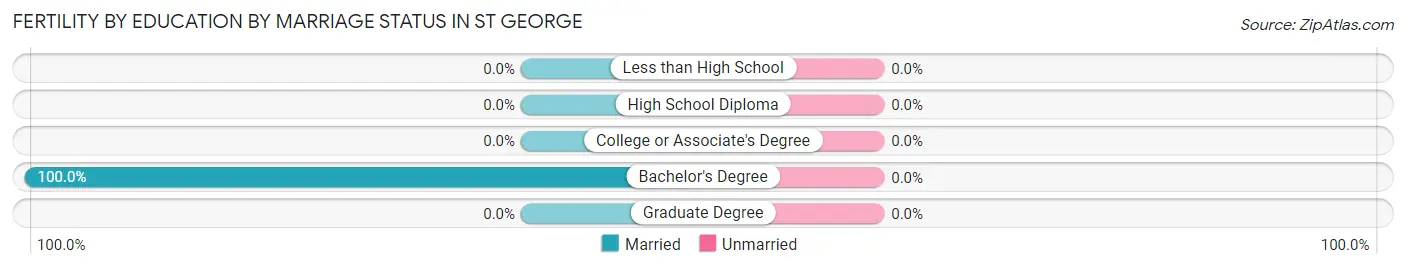
Fertility by Education by Marriage Status in St George
| Educational Attainment | Married | Unmarried |
| Less than High School | 0 (0.0%) | 0 (0.0%) |
| High School Diploma | 0 (0.0%) | 0 (0.0%) |
| College or Associate's Degree | 0 (0.0%) | 0 (0.0%) |
| Bachelor's Degree | 10 (100.0%) | 0 (0.0%) |
| Graduate Degree | 0 (0.0%) | 0 (0.0%) |
| Total | 10 (100.0%) | 0 (0.0%) |
Income in St George
Income Overview in St George
Per Capita Income in St George is $22,188, while median incomes of families and households are $28,324 and $28,490 respectively.
| Characteristic | Number | Measure |
| Per Capita Income | 1,901 | $22,188 |
| Median Family Income | 489 | $28,324 |
| Mean Family Income | 489 | $60,490 |
| Median Household Income | 777 | $28,490 |
| Mean Household Income | 777 | $50,591 |
| Income Deficit | 489 | $0 |
| Wage / Income Gap (%) | 1,901 | 52.62% |
| Wage / Income Gap ($) | 1,901 | 47.38¢ per $1 |
| Gini / Inequality Index | 1,901 | 0.48 |
Earnings by Sex in St George
Average Earnings in St George are $31,850, $44,167 for men and $20,927 for women, a difference of 52.6%.
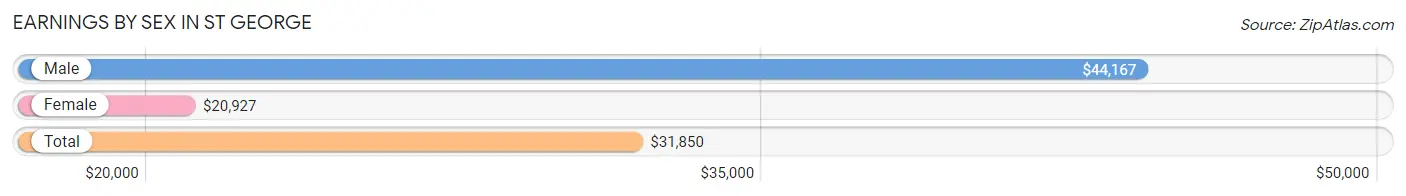
| Sex | Number | Average Earnings |
| Male | 306 (46.2%) | $44,167 |
| Female | 357 (53.8%) | $20,927 |
| Total | 663 (100.0%) | $31,850 |
Earnings by Sex by Income Bracket in St George
The most common earnings brackets in St George are $30,000 to $34,999 for men (46 | 15.0%) and $10,000 to $12,499 for women (50 | 14.0%).
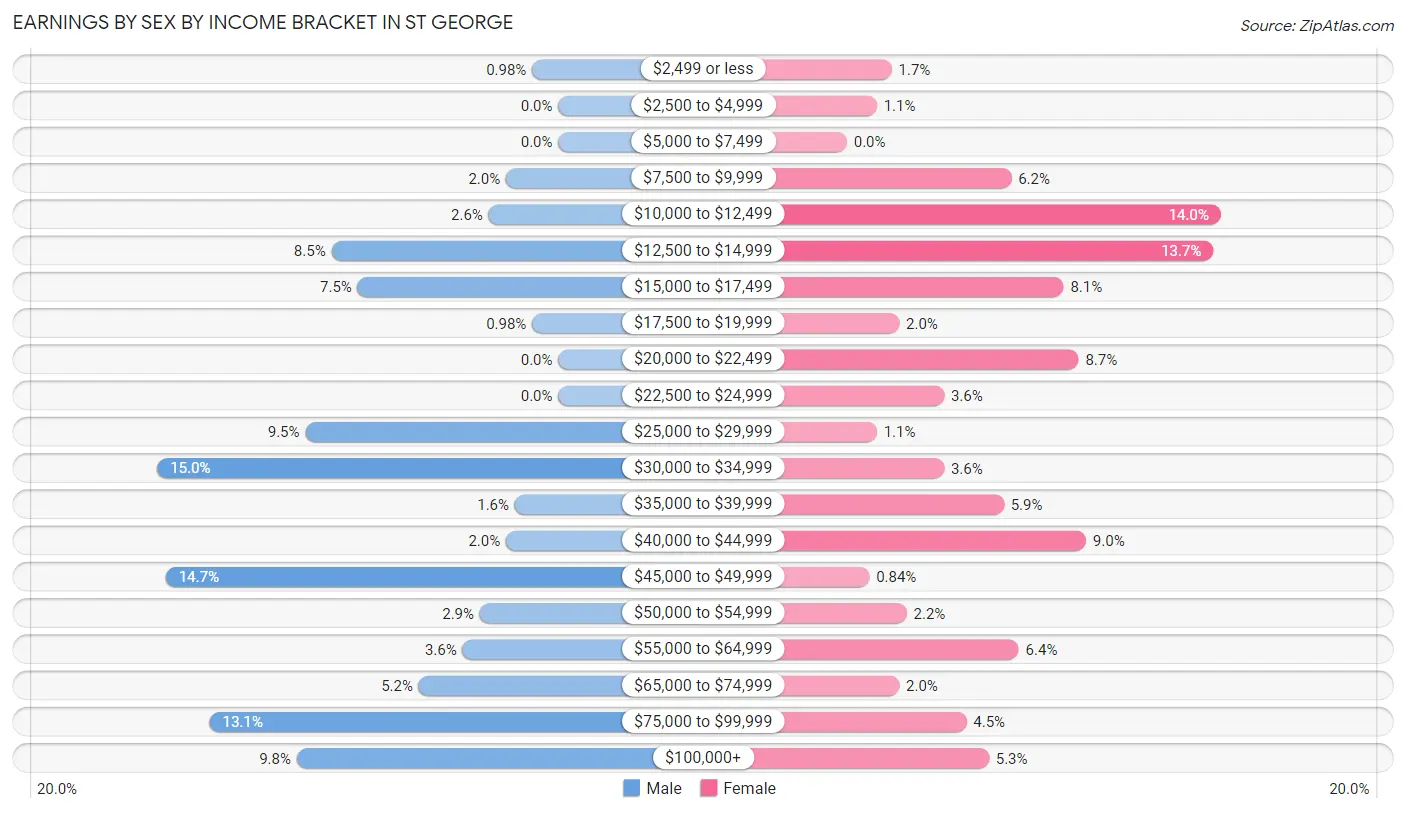
| Income | Male | Female |
| $2,499 or less | 3 (1.0%) | 6 (1.7%) |
| $2,500 to $4,999 | 0 (0.0%) | 4 (1.1%) |
| $5,000 to $7,499 | 0 (0.0%) | 0 (0.0%) |
| $7,500 to $9,999 | 6 (2.0%) | 22 (6.2%) |
| $10,000 to $12,499 | 8 (2.6%) | 50 (14.0%) |
| $12,500 to $14,999 | 26 (8.5%) | 49 (13.7%) |
| $15,000 to $17,499 | 23 (7.5%) | 29 (8.1%) |
| $17,500 to $19,999 | 3 (1.0%) | 7 (2.0%) |
| $20,000 to $22,499 | 0 (0.0%) | 31 (8.7%) |
| $22,500 to $24,999 | 0 (0.0%) | 13 (3.6%) |
| $25,000 to $29,999 | 29 (9.5%) | 4 (1.1%) |
| $30,000 to $34,999 | 46 (15.0%) | 13 (3.6%) |
| $35,000 to $39,999 | 5 (1.6%) | 21 (5.9%) |
| $40,000 to $44,999 | 6 (2.0%) | 32 (9.0%) |
| $45,000 to $49,999 | 45 (14.7%) | 3 (0.8%) |
| $50,000 to $54,999 | 9 (2.9%) | 8 (2.2%) |
| $55,000 to $64,999 | 11 (3.6%) | 23 (6.4%) |
| $65,000 to $74,999 | 16 (5.2%) | 7 (2.0%) |
| $75,000 to $99,999 | 40 (13.1%) | 16 (4.5%) |
| $100,000+ | 30 (9.8%) | 19 (5.3%) |
| Total | 306 (100.0%) | 357 (100.0%) |
Earnings by Sex by Educational Attainment in St George
Average earnings in St George are $46,136 for men and $23,077 for women, a difference of 50.0%. Men with an educational attainment of bachelor's degree enjoy the highest average annual earnings of $96,250, while those with college or associate's degree education earn the least with $33,831. Women with an educational attainment of graduate degree earn the most with the average annual earnings of $77,019, while those with high school diploma education have the smallest earnings of $17,112.
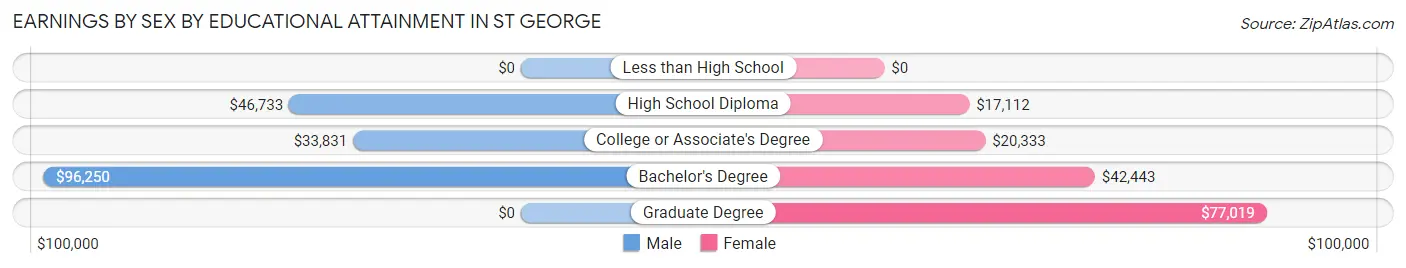
| Educational Attainment | Male Income | Female Income |
| Less than High School | - | - |
| High School Diploma | $46,733 | $17,112 |
| College or Associate's Degree | $33,831 | $20,333 |
| Bachelor's Degree | $96,250 | $42,443 |
| Graduate Degree | - | - |
| Total | $46,136 | $23,077 |
Family Income in St George
Family Income Brackets in St George
According to the St George family income data, there are 163 families falling into the $15,000 to $24,999 income range, which is the most common income bracket and makes up 33.3% of all families. Conversely, the $35,000 to $49,999 income bracket is the least frequent group with only 10 families (2.0%) belonging to this category.
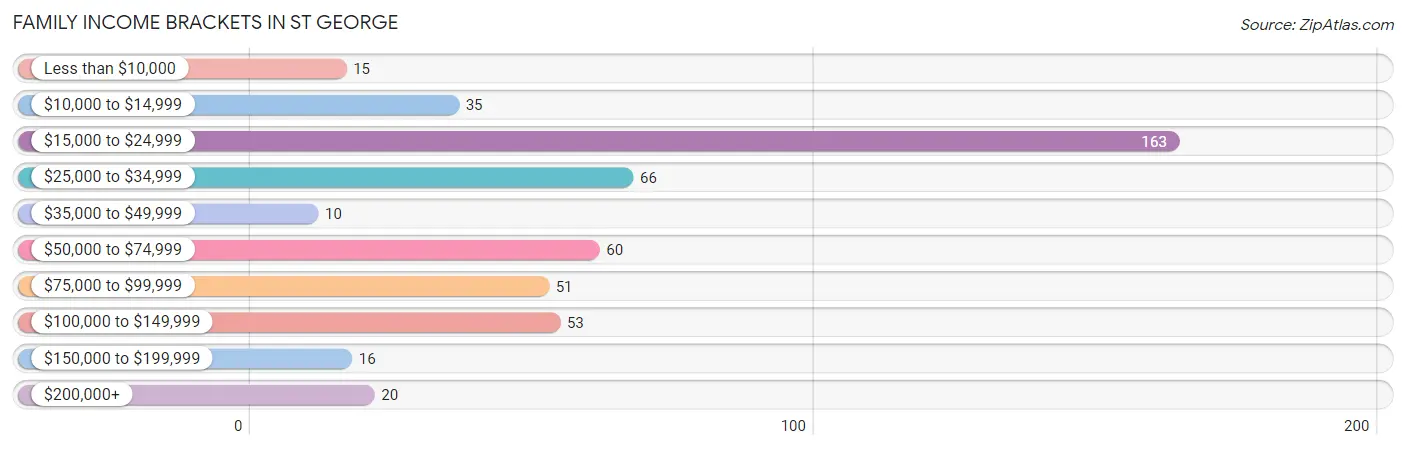
| Income Bracket | # Families | % Families |
| Less than $10,000 | 15 | 3.1% |
| $10,000 to $14,999 | 35 | 7.2% |
| $15,000 to $24,999 | 163 | 33.3% |
| $25,000 to $34,999 | 66 | 13.5% |
| $35,000 to $49,999 | 10 | 2.0% |
| $50,000 to $74,999 | 60 | 12.3% |
| $75,000 to $99,999 | 51 | 10.4% |
| $100,000 to $149,999 | 53 | 10.8% |
| $150,000 to $199,999 | 16 | 3.3% |
| $200,000+ | 20 | 4.1% |
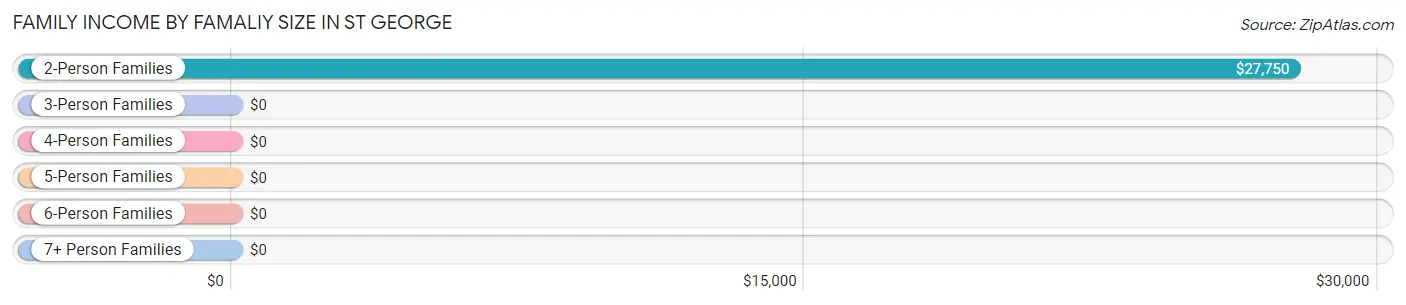
Family Income by Famaliy Size in St George
2-person families (309 | 63.2%) account for the highest median family income in St George with $27,750 per family, while 2-person families (309 | 63.2%) have the highest median income of $13,875 per family member.
| Income Bracket | # Families | Median Income |
| 2-Person Families | 309 (63.2%) | $27,750 |
| 3-Person Families | 60 (12.3%) | $0 |
| 4-Person Families | 118 (24.1%) | $0 |
| 5-Person Families | 2 (0.4%) | $0 |
| 6-Person Families | 0 (0.0%) | $0 |
| 7+ Person Families | 0 (0.0%) | $0 |
| Total | 489 (100.0%) | $28,324 |
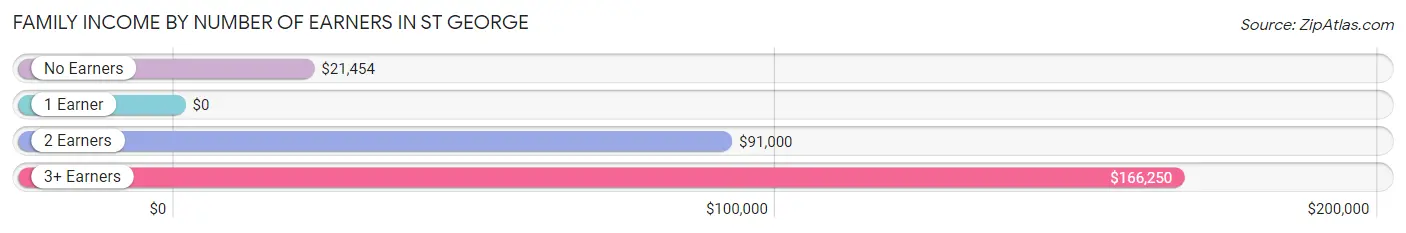
Family Income by Number of Earners in St George
| Number of Earners | # Families | Median Income |
| No Earners | 178 (36.4%) | $21,454 |
| 1 Earner | 189 (38.7%) | $0 |
| 2 Earners | 104 (21.3%) | $91,000 |
| 3+ Earners | 18 (3.7%) | $166,250 |
| Total | 489 (100.0%) | $28,324 |
Household Income in St George
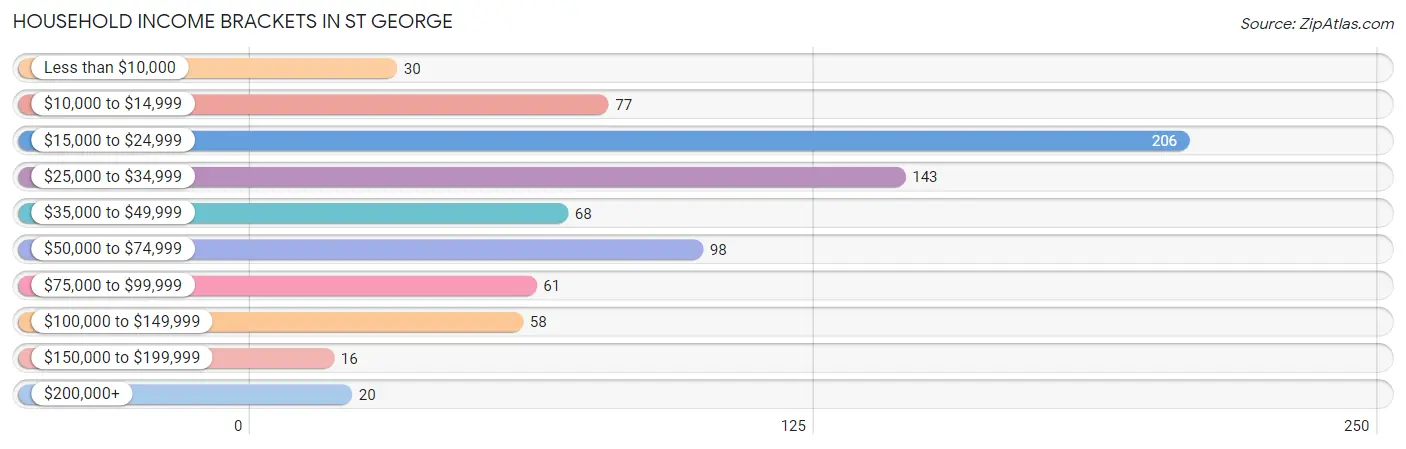
Household Income Brackets in St George
With 206 households falling in the category, the $15,000 to $24,999 income range is the most frequent in St George, accounting for 26.5% of all households. In contrast, only 16 households (2.1%) fall into the $150,000 to $199,999 income bracket, making it the least populous group.
| Income Bracket | # Households | % Households |
| Less than $10,000 | 30 | 3.9% |
| $10,000 to $14,999 | 77 | 9.9% |
| $15,000 to $24,999 | 206 | 26.5% |
| $25,000 to $34,999 | 143 | 18.4% |
| $35,000 to $49,999 | 68 | 8.8% |
| $50,000 to $74,999 | 98 | 12.6% |
| $75,000 to $99,999 | 61 | 7.9% |
| $100,000 to $149,999 | 58 | 7.5% |
| $150,000 to $199,999 | 16 | 2.1% |
| $200,000+ | 20 | 2.6% |
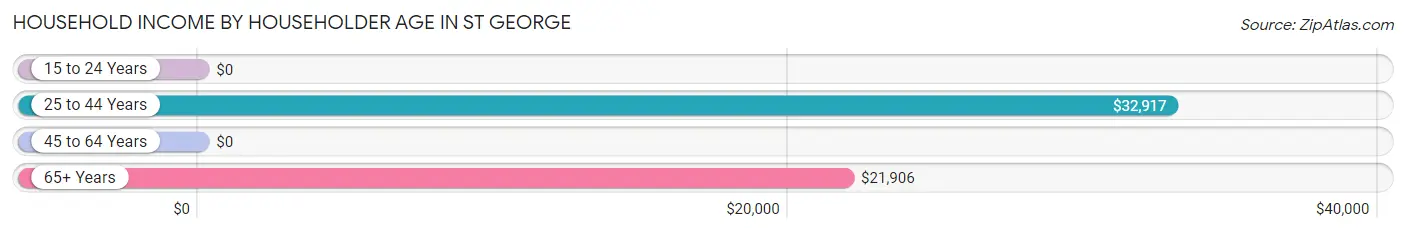
Household Income by Householder Age in St George
The median household income in St George is $28,490, with the highest median household income of $32,917 found in the 25 to 44 years age bracket for the primary householder. A total of 255 households (32.8%) fall into this category. Meanwhile, the 15 to 24 years age bracket for the primary householder has the lowest median household income of $0, with 28 households (3.6%) in this group.
| Income Bracket | # Households | Median Income |
| 15 to 24 Years | 28 (3.6%) | $0 |
| 25 to 44 Years | 255 (32.8%) | $32,917 |
| 45 to 64 Years | 170 (21.9%) | $0 |
| 65+ Years | 324 (41.7%) | $21,906 |
| Total | 777 (100.0%) | $28,490 |
Poverty in St George
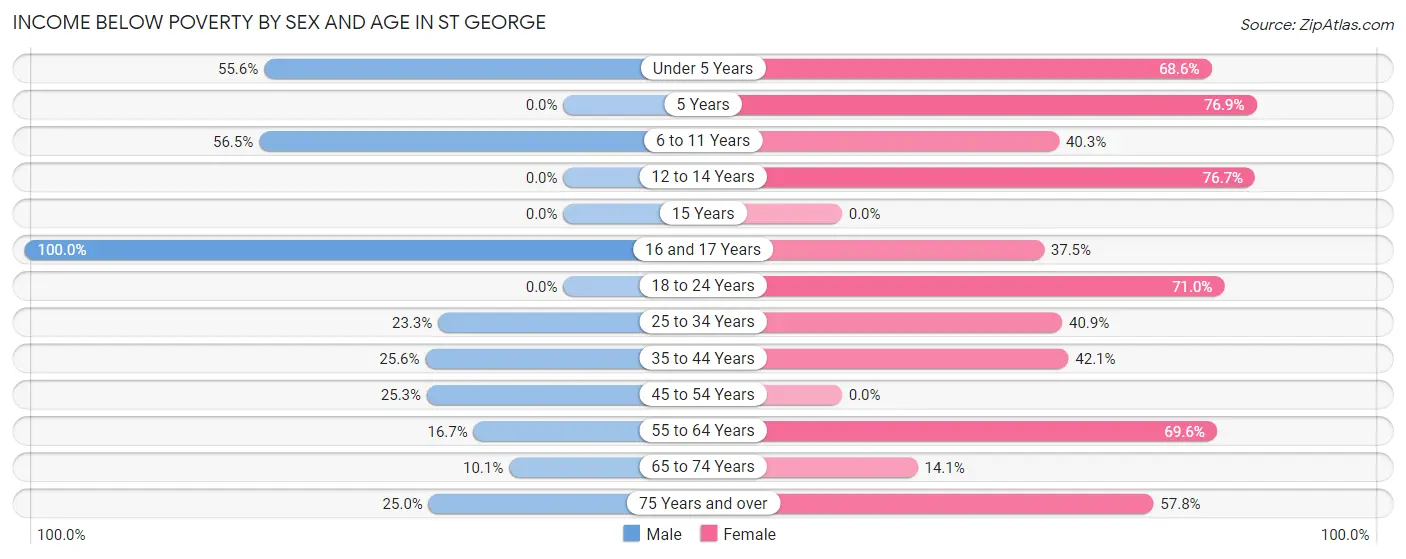
Income Below Poverty by Sex and Age in St George
With 28.6% poverty level for males and 42.5% for females among the residents of St George, 16 and 17 year old males and 5 year old females are the most vulnerable to poverty, with 39 males (100.0%) and 20 females (76.9%) in their respective age groups living below the poverty level.
| Age Bracket | Male | Female |
| Under 5 Years | 15 (55.6%) | 24 (68.6%) |
| 5 Years | 0 (0.0%) | 20 (76.9%) |
| 6 to 11 Years | 61 (56.5%) | 52 (40.3%) |
| 12 to 14 Years | 0 (0.0%) | 23 (76.7%) |
| 15 Years | 0 (0.0%) | 0 (0.0%) |
| 16 and 17 Years | 39 (100.0%) | 3 (37.5%) |
| 18 to 24 Years | 0 (0.0%) | 66 (71.0%) |
| 25 to 34 Years | 20 (23.3%) | 56 (40.9%) |
| 35 to 44 Years | 21 (25.6%) | 37 (42.0%) |
| 45 to 54 Years | 19 (25.3%) | 0 (0.0%) |
| 55 to 64 Years | 16 (16.7%) | 64 (69.6%) |
| 65 to 74 Years | 13 (10.1%) | 27 (14.1%) |
| 75 Years and over | 11 (25.0%) | 59 (57.8%) |
| Total | 215 (28.6%) | 431 (42.5%) |
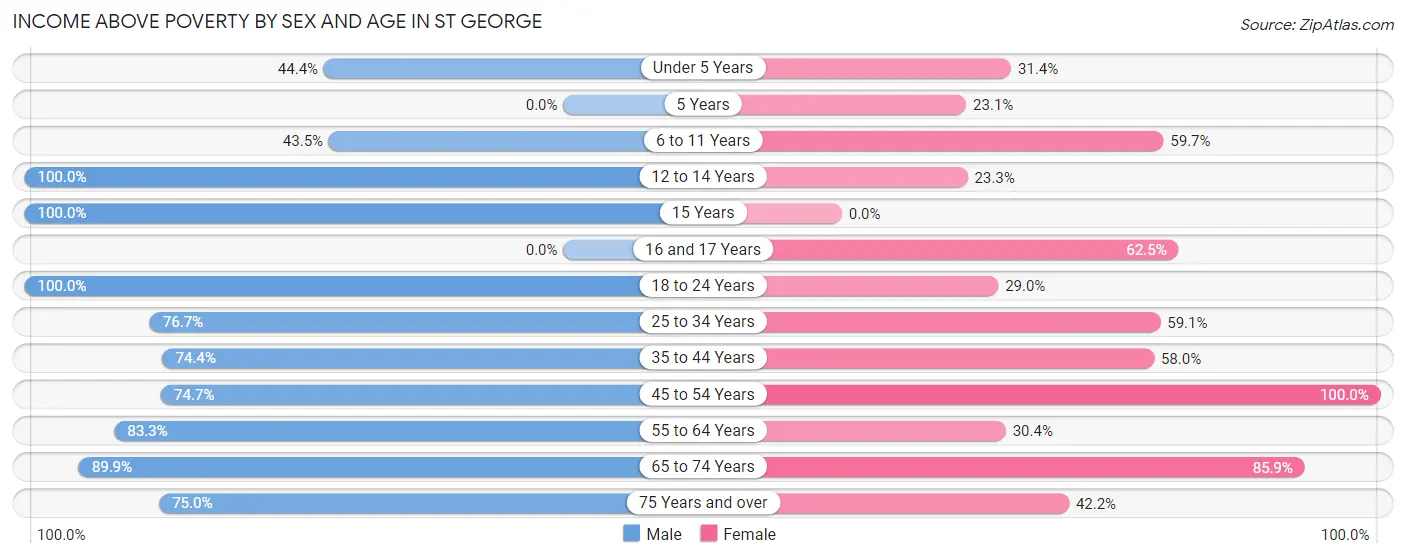
Income Above Poverty by Sex and Age in St George
According to the poverty statistics in St George, males aged 12 to 14 years and females aged 45 to 54 years are the age groups that are most secure financially, with 100.0% of males and 100.0% of females in these age groups living above the poverty line.
| Age Bracket | Male | Female |
| Under 5 Years | 12 (44.4%) | 11 (31.4%) |
| 5 Years | 0 (0.0%) | 6 (23.1%) |
| 6 to 11 Years | 47 (43.5%) | 77 (59.7%) |
| 12 to 14 Years | 6 (100.0%) | 7 (23.3%) |
| 15 Years | 6 (100.0%) | 0 (0.0%) |
| 16 and 17 Years | 0 (0.0%) | 5 (62.5%) |
| 18 to 24 Years | 54 (100.0%) | 27 (29.0%) |
| 25 to 34 Years | 66 (76.7%) | 81 (59.1%) |
| 35 to 44 Years | 61 (74.4%) | 51 (58.0%) |
| 45 to 54 Years | 56 (74.7%) | 83 (100.0%) |
| 55 to 64 Years | 80 (83.3%) | 28 (30.4%) |
| 65 to 74 Years | 116 (89.9%) | 165 (85.9%) |
| 75 Years and over | 33 (75.0%) | 43 (42.2%) |
| Total | 537 (71.4%) | 584 (57.5%) |
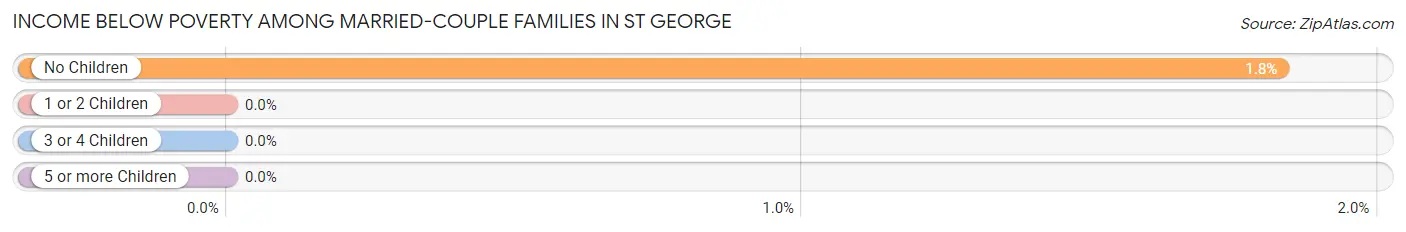
Income Below Poverty Among Married-Couple Families in St George
The poverty statistics for married-couple families in St George show that 1.4% or 4 of the total 281 families live below the poverty line. Families with no children have the highest poverty rate of 1.8%, comprising of 4 families. On the other hand, families with 1 or 2 children have the lowest poverty rate of 0.0%, which includes 0 families.
| Children | Above Poverty | Below Poverty |
| No Children | 214 (98.2%) | 4 (1.8%) |
| 1 or 2 Children | 62 (100.0%) | 0 (0.0%) |
| 3 or 4 Children | 1 (100.0%) | 0 (0.0%) |
| 5 or more Children | 0 (0.0%) | 0 (0.0%) |
| Total | 277 (98.6%) | 4 (1.4%) |
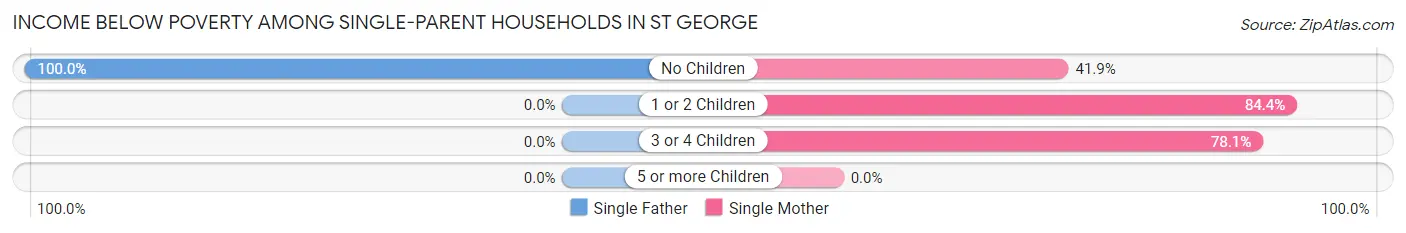
Income Below Poverty Among Single-Parent Households in St George
According to the poverty data in St George, 100.0% or 25 single-father households and 65.0% or 119 single-mother households are living below the poverty line. Among single-father households, those with no children have the highest poverty rate, with 25 households (100.0%) experiencing poverty. Likewise, among single-mother households, those with 1 or 2 children have the highest poverty rate, with 38 households (84.4%) falling below the poverty line.
| Children | Single Father | Single Mother |
| No Children | 25 (100.0%) | 31 (41.9%) |
| 1 or 2 Children | 0 (0.0%) | 38 (84.4%) |
| 3 or 4 Children | 0 (0.0%) | 50 (78.1%) |
| 5 or more Children | 0 (0.0%) | 0 (0.0%) |
| Total | 25 (100.0%) | 119 (65.0%) |
Income Below Poverty Among Married-Couple vs Single-Parent Households in St George
The poverty data for St George shows that 4 of the married-couple family households (1.4%) and 144 of the single-parent households (69.2%) are living below the poverty level. Within the married-couple family households, those with no children have the highest poverty rate, with 4 households (1.8%) falling below the poverty line. Among the single-parent households, those with 1 or 2 children have the highest poverty rate, with 38 household (84.4%) living below poverty.
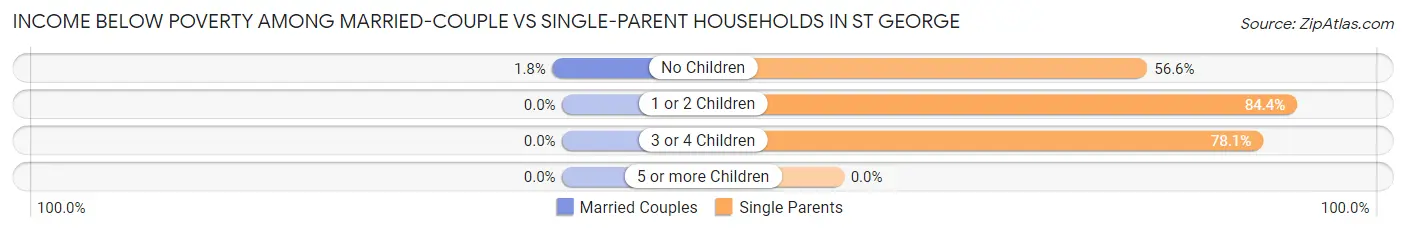
| Children | Married-Couple Families | Single-Parent Households |
| No Children | 4 (1.8%) | 56 (56.6%) |
| 1 or 2 Children | 0 (0.0%) | 38 (84.4%) |
| 3 or 4 Children | 0 (0.0%) | 50 (78.1%) |
| 5 or more Children | 0 (0.0%) | 0 (0.0%) |
| Total | 4 (1.4%) | 144 (69.2%) |
Employment Characteristics in St George
Employment by Class of Employer in St George
Among the 624 employed individuals in St George, private company employees (490 | 78.5%), not-for-profit organizations (38 | 6.1%), and self-employed (not incorporated) (25 | 4.0%) make up the most common classes of employment.
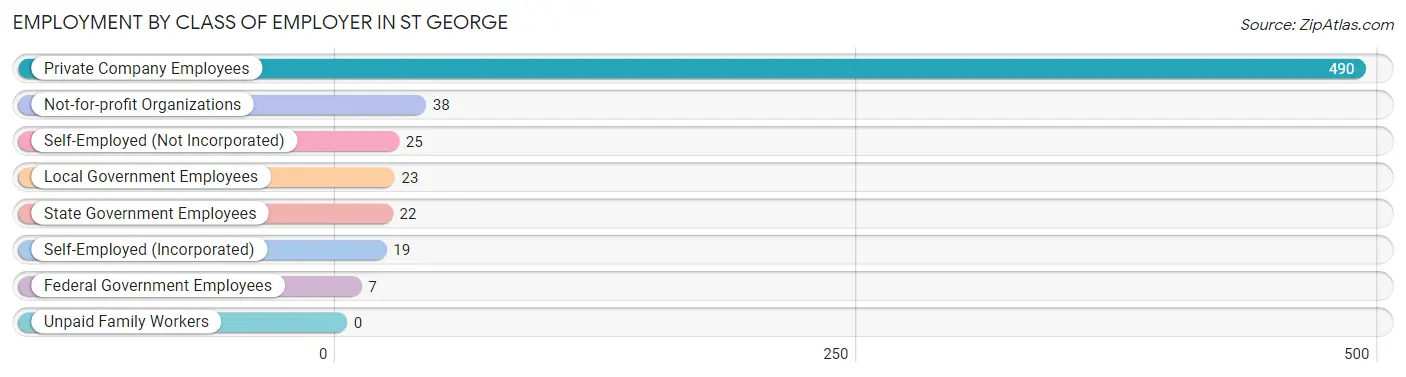
| Employer Class | # Employees | % Employees |
| Private Company Employees | 490 | 78.5% |
| Self-Employed (Incorporated) | 19 | 3.0% |
| Self-Employed (Not Incorporated) | 25 | 4.0% |
| Not-for-profit Organizations | 38 | 6.1% |
| Local Government Employees | 23 | 3.7% |
| State Government Employees | 22 | 3.5% |
| Federal Government Employees | 7 | 1.1% |
| Unpaid Family Workers | 0 | 0.0% |
| Total | 624 | 100.0% |
Employment Status by Age in St George
According to the labor force statistics for St George, out of the total population over 16 years of age (1,514), 42.0% or 636 individuals are in the labor force, with 0.8% or 5 of them unemployed. The age group with the highest labor force participation rate is 25 to 29 years, with 87.4% or 104 individuals in the labor force. Within the labor force, the 65 to 74 years age range has the highest percentage of unemployed individuals, with 10.2% or 5 of them being unemployed.
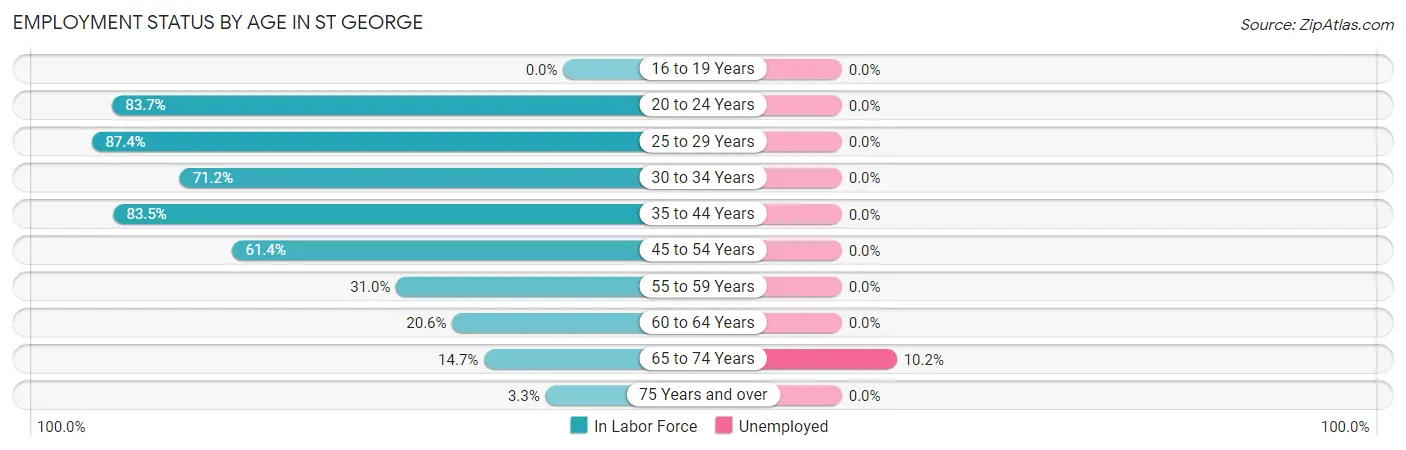
| Age Bracket | In Labor Force | Unemployed |
| 16 to 19 Years | 0 (0.0%) | 0 (0.0%) |
| 20 to 24 Years | 103 (83.7%) | 0 (0.0%) |
| 25 to 29 Years | 104 (87.4%) | 0 (0.0%) |
| 30 to 34 Years | 74 (71.2%) | 0 (0.0%) |
| 35 to 44 Years | 142 (83.5%) | 0 (0.0%) |
| 45 to 54 Years | 97 (61.4%) | 0 (0.0%) |
| 55 to 59 Years | 40 (31.0%) | 0 (0.0%) |
| 60 to 64 Years | 20 (20.6%) | 0 (0.0%) |
| 65 to 74 Years | 49 (14.7%) | 5 (10.2%) |
| 75 Years and over | 7 (3.3%) | 0 (0.0%) |
| Total | 636 (42.0%) | 5 (0.8%) |
Employment Status by Educational Attainment in St George
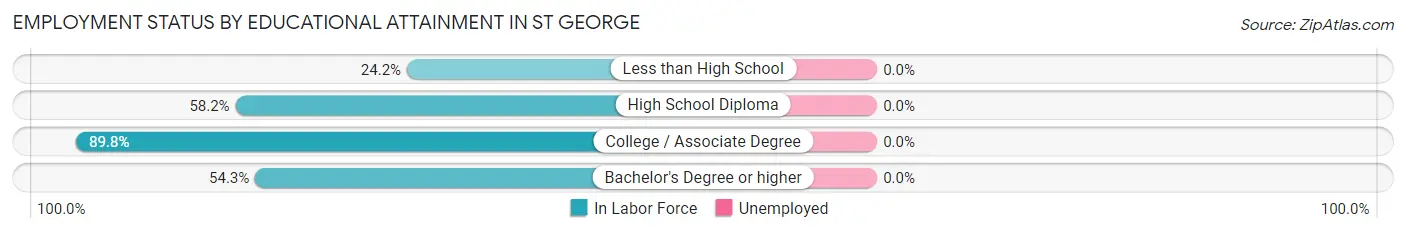
| Educational Attainment | In Labor Force | Unemployed |
| Less than High School | 16 (24.2%) | 0 (0.0%) |
| High School Diploma | 181 (58.2%) | 0 (0.0%) |
| College / Associate Degree | 159 (89.8%) | 0 (0.0%) |
| Bachelor's Degree or higher | 121 (54.3%) | 0 (0.0%) |
| Total | 477 (61.4%) | 0 (0.0%) |
Employment Occupations by Sex in St George
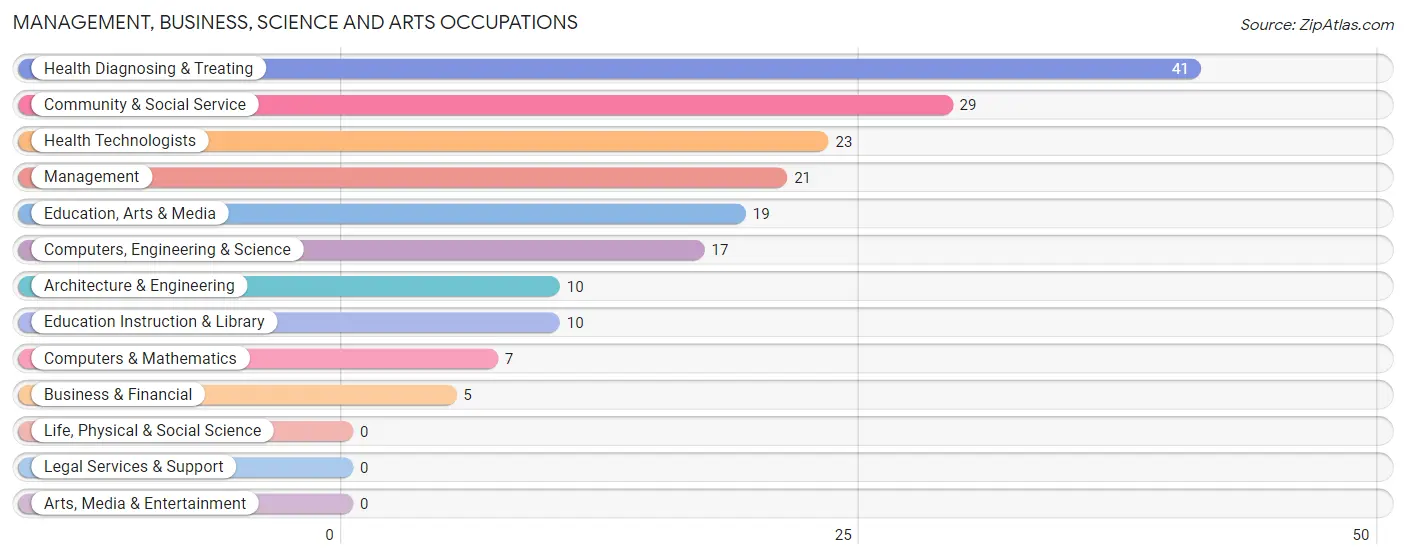
Management, Business, Science and Arts Occupations
The most common Management, Business, Science and Arts occupations in St George are Health Diagnosing & Treating (41 | 6.5%), Community & Social Service (29 | 4.6%), Health Technologists (23 | 3.6%), Management (21 | 3.3%), and Education, Arts & Media (19 | 3.0%).
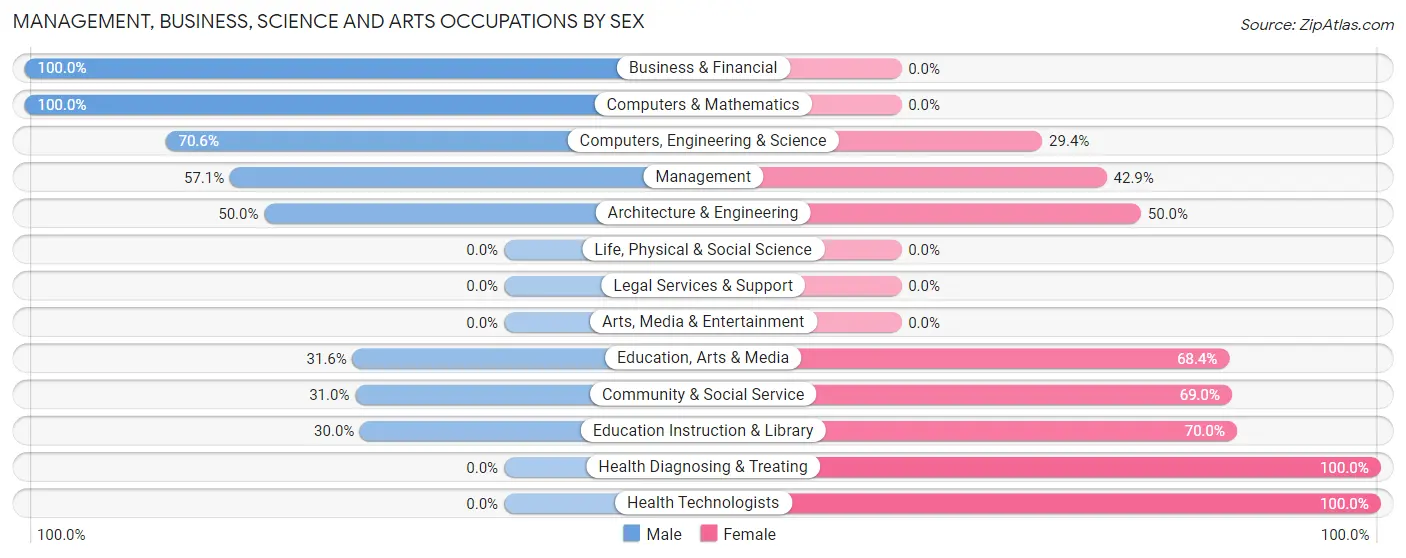
Management, Business, Science and Arts Occupations by Sex
Within the Management, Business, Science and Arts occupations in St George, the most male-oriented occupations are Business & Financial (100.0%), Computers & Mathematics (100.0%), and Computers, Engineering & Science (70.6%), while the most female-oriented occupations are Health Diagnosing & Treating (100.0%), Health Technologists (100.0%), and Education Instruction & Library (70.0%).
| Occupation | Male | Female |
| Management | 12 (57.1%) | 9 (42.9%) |
| Business & Financial | 5 (100.0%) | 0 (0.0%) |
| Computers, Engineering & Science | 12 (70.6%) | 5 (29.4%) |
| Computers & Mathematics | 7 (100.0%) | 0 (0.0%) |
| Architecture & Engineering | 5 (50.0%) | 5 (50.0%) |
| Life, Physical & Social Science | 0 (0.0%) | 0 (0.0%) |
| Community & Social Service | 9 (31.0%) | 20 (69.0%) |
| Education, Arts & Media | 6 (31.6%) | 13 (68.4%) |
| Legal Services & Support | 0 (0.0%) | 0 (0.0%) |
| Education Instruction & Library | 3 (30.0%) | 7 (70.0%) |
| Arts, Media & Entertainment | 0 (0.0%) | 0 (0.0%) |
| Health Diagnosing & Treating | 0 (0.0%) | 41 (100.0%) |
| Health Technologists | 0 (0.0%) | 23 (100.0%) |
| Total (Category) | 38 (33.6%) | 75 (66.4%) |
| Total (Overall) | 292 (46.3%) | 339 (53.7%) |
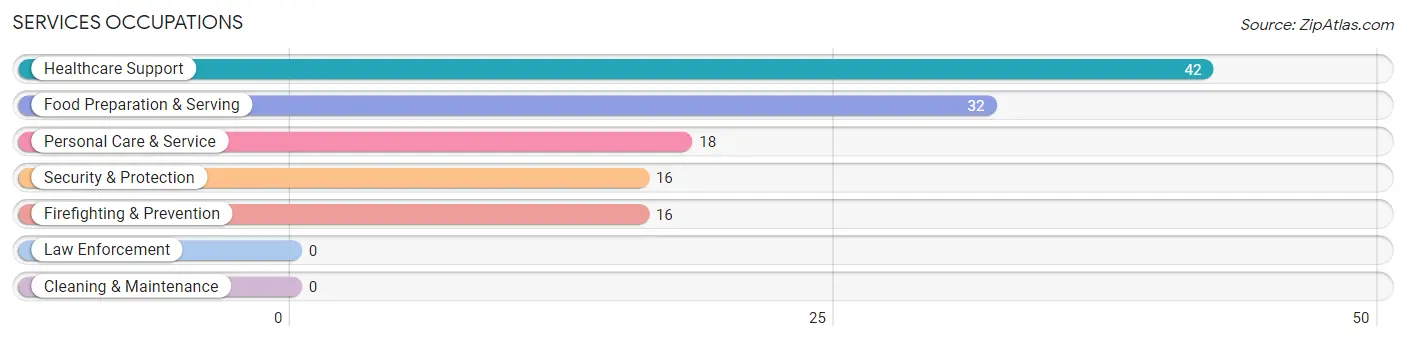
Services Occupations
The most common Services occupations in St George are Healthcare Support (42 | 6.7%), Food Preparation & Serving (32 | 5.1%), Personal Care & Service (18 | 2.9%), Security & Protection (16 | 2.5%), and Firefighting & Prevention (16 | 2.5%).
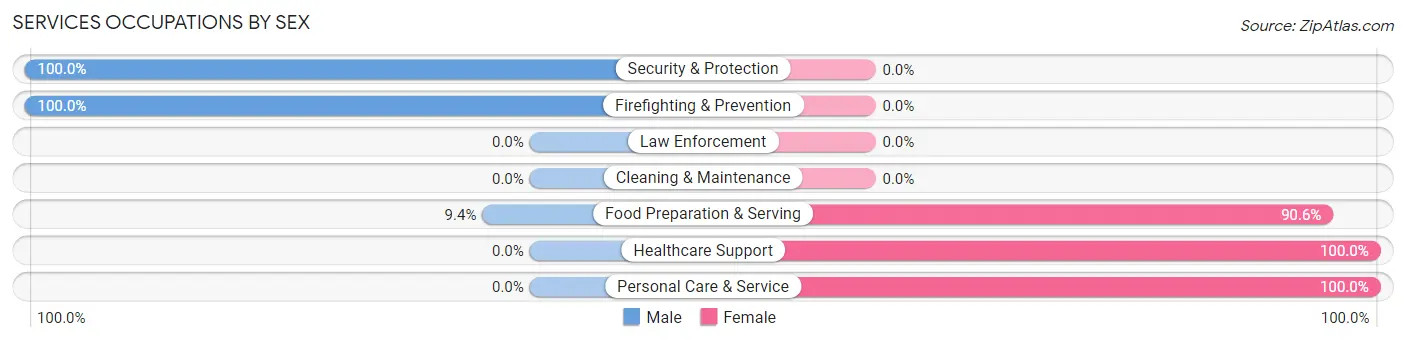
Services Occupations by Sex
Within the Services occupations in St George, the most male-oriented occupations are Security & Protection (100.0%), Firefighting & Prevention (100.0%), and Food Preparation & Serving (9.4%), while the most female-oriented occupations are Healthcare Support (100.0%), Personal Care & Service (100.0%), and Food Preparation & Serving (90.6%).
| Occupation | Male | Female |
| Healthcare Support | 0 (0.0%) | 42 (100.0%) |
| Security & Protection | 16 (100.0%) | 0 (0.0%) |
| Firefighting & Prevention | 16 (100.0%) | 0 (0.0%) |
| Law Enforcement | 0 (0.0%) | 0 (0.0%) |
| Food Preparation & Serving | 3 (9.4%) | 29 (90.6%) |
| Cleaning & Maintenance | 0 (0.0%) | 0 (0.0%) |
| Personal Care & Service | 0 (0.0%) | 18 (100.0%) |
| Total (Category) | 19 (17.6%) | 89 (82.4%) |
| Total (Overall) | 292 (46.3%) | 339 (53.7%) |
Sales and Office Occupations
The most common Sales and Office occupations in St George are Sales & Related (131 | 20.8%), and Office & Administration (70 | 11.1%).

Sales and Office Occupations by Sex

| Occupation | Male | Female |
| Sales & Related | 64 (48.8%) | 67 (51.1%) |
| Office & Administration | 5 (7.1%) | 65 (92.9%) |
| Total (Category) | 69 (34.3%) | 132 (65.7%) |
| Total (Overall) | 292 (46.3%) | 339 (53.7%) |
Natural Resources, Construction and Maintenance Occupations
The most common Natural Resources, Construction and Maintenance occupations in St George are Construction & Extraction (55 | 8.7%), and Installation, Maintenance & Repair (29 | 4.6%).
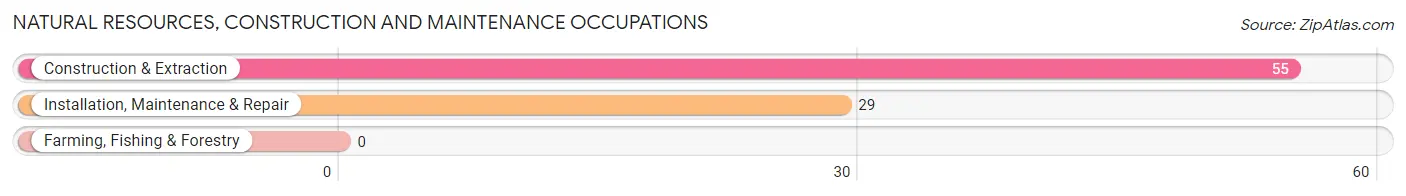
Natural Resources, Construction and Maintenance Occupations by Sex
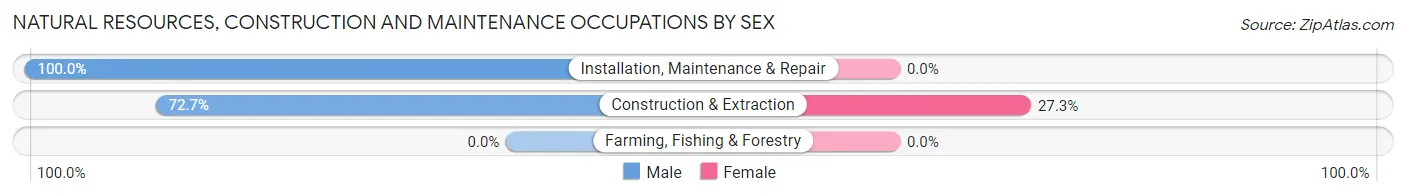
| Occupation | Male | Female |
| Farming, Fishing & Forestry | 0 (0.0%) | 0 (0.0%) |
| Construction & Extraction | 40 (72.7%) | 15 (27.3%) |
| Installation, Maintenance & Repair | 29 (100.0%) | 0 (0.0%) |
| Total (Category) | 69 (82.1%) | 15 (17.9%) |
| Total (Overall) | 292 (46.3%) | 339 (53.7%) |
Production, Transportation and Moving Occupations
The most common Production, Transportation and Moving occupations in St George are Production (84 | 13.3%), Transportation (30 | 4.8%), and Material Moving (11 | 1.7%).
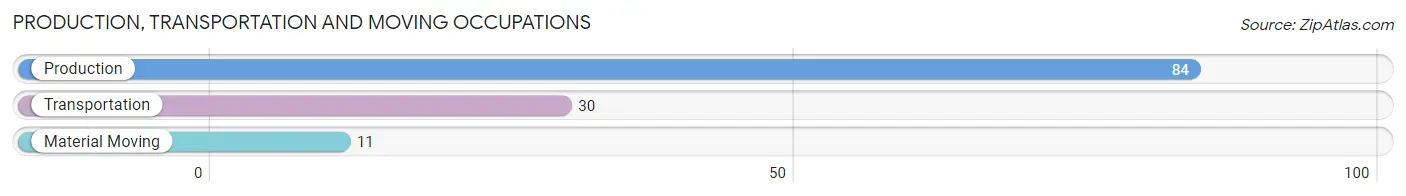
Production, Transportation and Moving Occupations by Sex
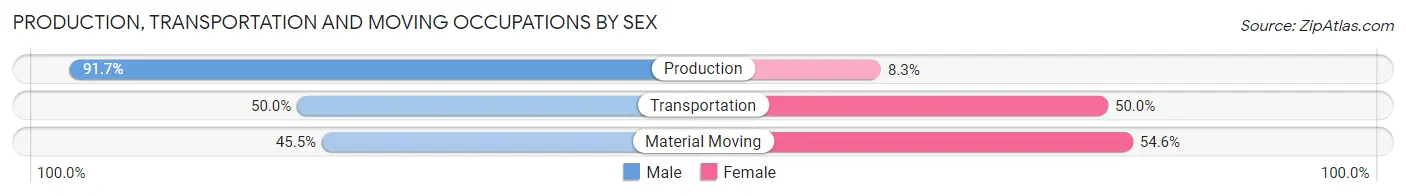
| Occupation | Male | Female |
| Production | 77 (91.7%) | 7 (8.3%) |
| Transportation | 15 (50.0%) | 15 (50.0%) |
| Material Moving | 5 (45.5%) | 6 (54.5%) |
| Total (Category) | 97 (77.6%) | 28 (22.4%) |
| Total (Overall) | 292 (46.3%) | 339 (53.7%) |
Employment Industries by Sex in St George
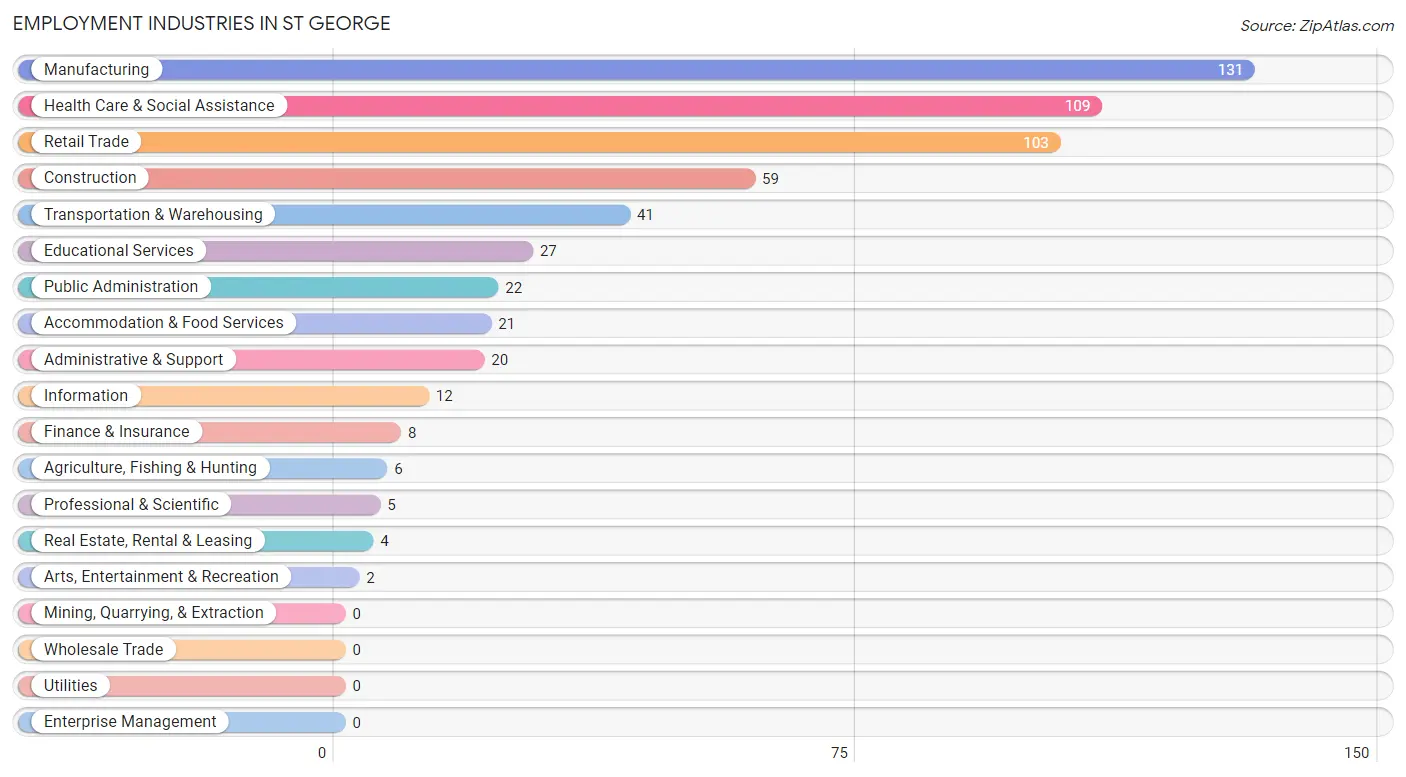
Employment Industries in St George
The major employment industries in St George include Manufacturing (131 | 20.8%), Health Care & Social Assistance (109 | 17.3%), Retail Trade (103 | 16.3%), Construction (59 | 9.3%), and Transportation & Warehousing (41 | 6.5%).
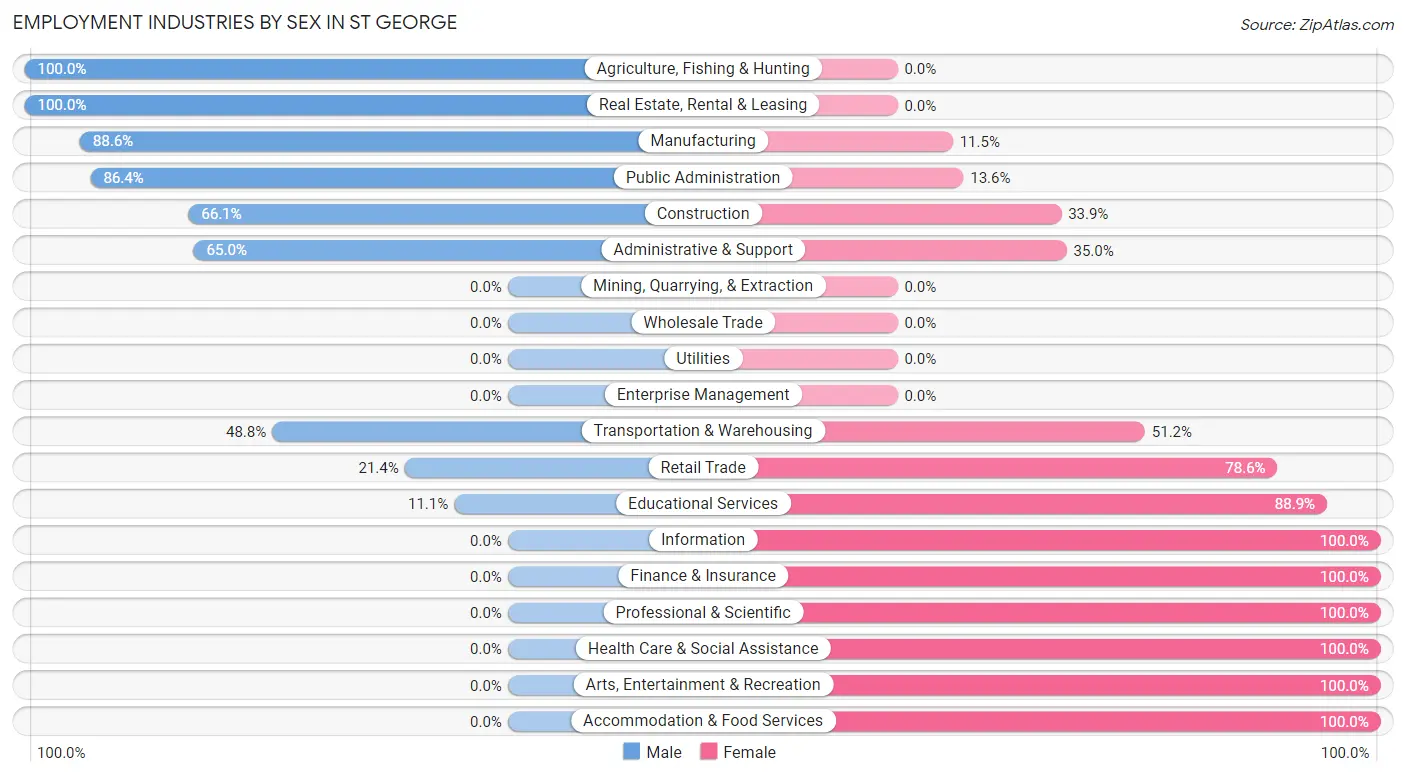
Employment Industries by Sex in St George
The St George industries that see more men than women are Agriculture, Fishing & Hunting (100.0%), Real Estate, Rental & Leasing (100.0%), and Manufacturing (88.5%), whereas the industries that tend to have a higher number of women are Information (100.0%), Finance & Insurance (100.0%), and Professional & Scientific (100.0%).
| Industry | Male | Female |
| Agriculture, Fishing & Hunting | 6 (100.0%) | 0 (0.0%) |
| Mining, Quarrying, & Extraction | 0 (0.0%) | 0 (0.0%) |
| Construction | 39 (66.1%) | 20 (33.9%) |
| Manufacturing | 116 (88.5%) | 15 (11.5%) |
| Wholesale Trade | 0 (0.0%) | 0 (0.0%) |
| Retail Trade | 22 (21.4%) | 81 (78.6%) |
| Transportation & Warehousing | 20 (48.8%) | 21 (51.2%) |
| Utilities | 0 (0.0%) | 0 (0.0%) |
| Information | 0 (0.0%) | 12 (100.0%) |
| Finance & Insurance | 0 (0.0%) | 8 (100.0%) |
| Real Estate, Rental & Leasing | 4 (100.0%) | 0 (0.0%) |
| Professional & Scientific | 0 (0.0%) | 5 (100.0%) |
| Enterprise Management | 0 (0.0%) | 0 (0.0%) |
| Administrative & Support | 13 (65.0%) | 7 (35.0%) |
| Educational Services | 3 (11.1%) | 24 (88.9%) |
| Health Care & Social Assistance | 0 (0.0%) | 109 (100.0%) |
| Arts, Entertainment & Recreation | 0 (0.0%) | 2 (100.0%) |
| Accommodation & Food Services | 0 (0.0%) | 21 (100.0%) |
| Public Administration | 19 (86.4%) | 3 (13.6%) |
| Total | 292 (46.3%) | 339 (53.7%) |
Education in St George
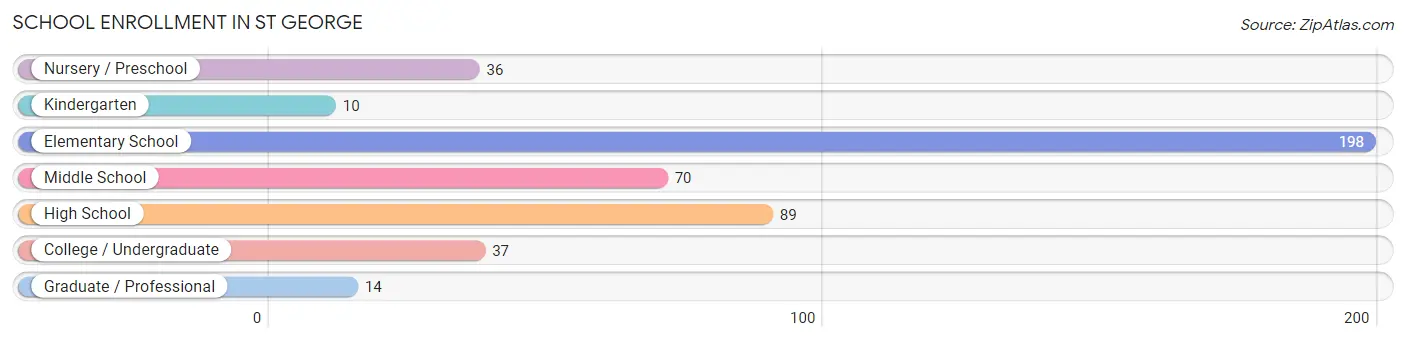
School Enrollment in St George
The most common levels of schooling among the 454 students in St George are elementary school (198 | 43.6%), high school (89 | 19.6%), and middle school (70 | 15.4%).
| School Level | # Students | % Students |
| Nursery / Preschool | 36 | 7.9% |
| Kindergarten | 10 | 2.2% |
| Elementary School | 198 | 43.6% |
| Middle School | 70 | 15.4% |
| High School | 89 | 19.6% |
| College / Undergraduate | 37 | 8.2% |
| Graduate / Professional | 14 | 3.1% |
| Total | 454 | 100.0% |
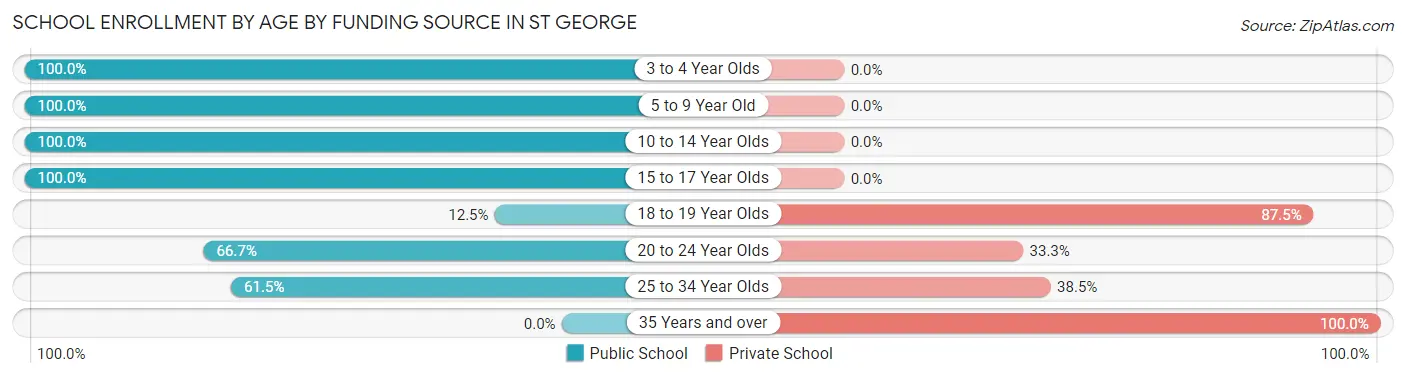
School Enrollment by Age by Funding Source in St George
Out of a total of 454 students who are enrolled in schools in St George, 43 (9.5%) attend a private institution, while the remaining 411 (90.5%) are enrolled in public schools. The age group of 35 years and over has the highest likelihood of being enrolled in private schools, with 7 (100.0% in the age bracket) enrolled. Conversely, the age group of 3 to 4 year olds has the lowest likelihood of being enrolled in a private school, with 10 (100.0% in the age bracket) attending a public institution.
| Age Bracket | Public School | Private School |
| 3 to 4 Year Olds | 10 (100.0%) | 0 (0.0%) |
| 5 to 9 Year Old | 232 (100.0%) | 0 (0.0%) |
| 10 to 14 Year Olds | 87 (100.0%) | 0 (0.0%) |
| 15 to 17 Year Olds | 53 (100.0%) | 0 (0.0%) |
| 18 to 19 Year Olds | 3 (12.5%) | 21 (87.5%) |
| 20 to 24 Year Olds | 10 (66.7%) | 5 (33.3%) |
| 25 to 34 Year Olds | 16 (61.5%) | 10 (38.5%) |
| 35 Years and over | 0 (0.0%) | 7 (100.0%) |
| Total | 411 (90.5%) | 43 (9.5%) |
Educational Attainment by Field of Study in St George
Education (81 | 31.4%), business (53 | 20.5%), arts & humanities (47 | 18.2%), science & technology (32 | 12.4%), and engineering (12 | 4.6%) are the most common fields of study among 258 individuals in St George who have obtained a bachelor's degree or higher.
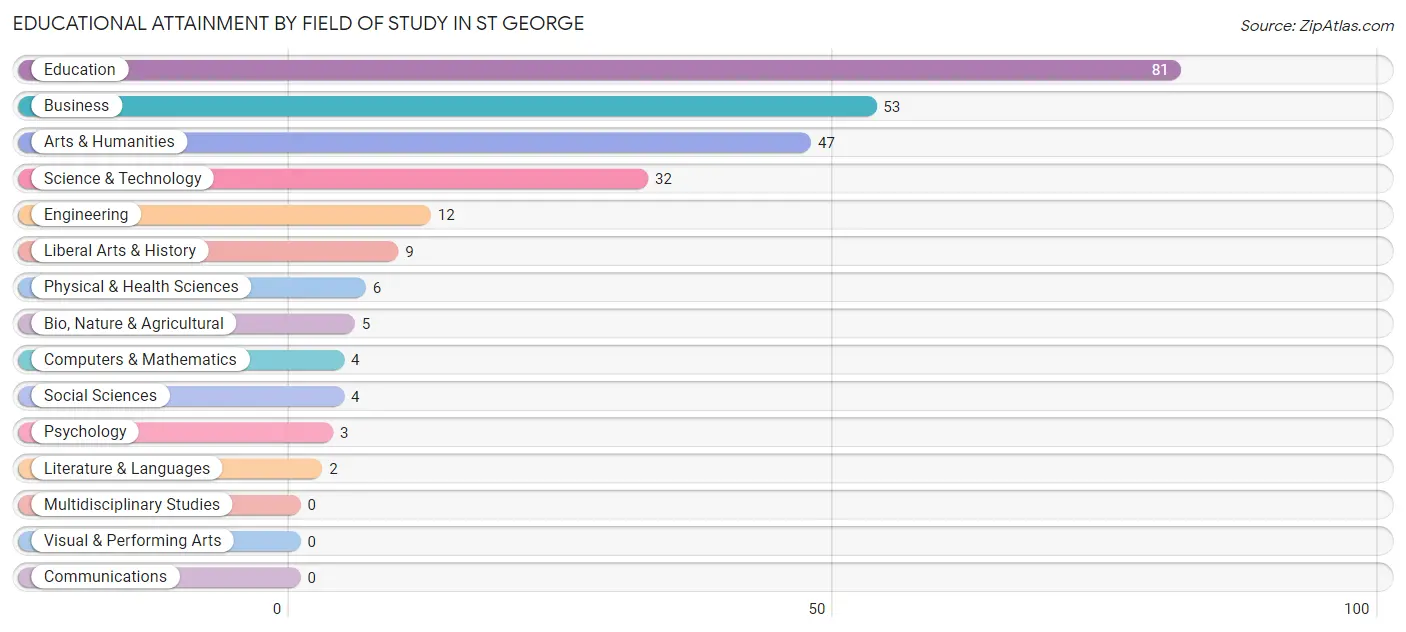
| Field of Study | # Graduates | % Graduates |
| Computers & Mathematics | 4 | 1.5% |
| Bio, Nature & Agricultural | 5 | 1.9% |
| Physical & Health Sciences | 6 | 2.3% |
| Psychology | 3 | 1.2% |
| Social Sciences | 4 | 1.5% |
| Engineering | 12 | 4.6% |
| Multidisciplinary Studies | 0 | 0.0% |
| Science & Technology | 32 | 12.4% |
| Business | 53 | 20.5% |
| Education | 81 | 31.4% |
| Literature & Languages | 2 | 0.8% |
| Liberal Arts & History | 9 | 3.5% |
| Visual & Performing Arts | 0 | 0.0% |
| Communications | 0 | 0.0% |
| Arts & Humanities | 47 | 18.2% |
| Total | 258 | 100.0% |
Transportation & Commute in St George
Vehicle Availability by Sex in St George
The most prevalent vehicle ownership categories in St George are males with 2 vehicles (137, accounting for 46.9%) and females with 2 vehicles (50, making up 41.3%).
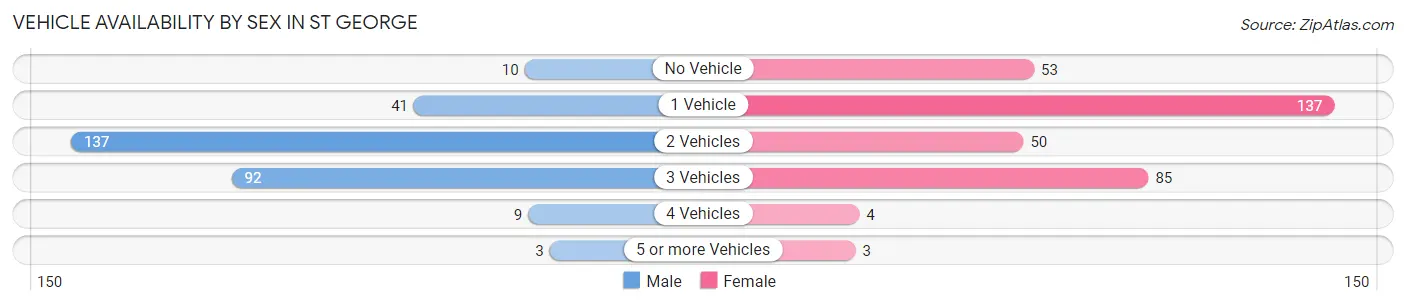
| Vehicles Available | Male | Female |
| No Vehicle | 10 (3.4%) | 53 (16.0%) |
| 1 Vehicle | 41 (14.0%) | 137 (41.3%) |
| 2 Vehicles | 137 (46.9%) | 50 (15.1%) |
| 3 Vehicles | 92 (31.5%) | 85 (25.6%) |
| 4 Vehicles | 9 (3.1%) | 4 (1.2%) |
| 5 or more Vehicles | 3 (1.0%) | 3 (0.9%) |
| Total | 292 (100.0%) | 332 (100.0%) |
Commute Time in St George
The most frequently occuring commute durations in St George are 5 to 9 minutes (95 commuters, 15.5%), 30 to 34 minutes (87 commuters, 14.2%), and 45 to 59 minutes (81 commuters, 13.2%).
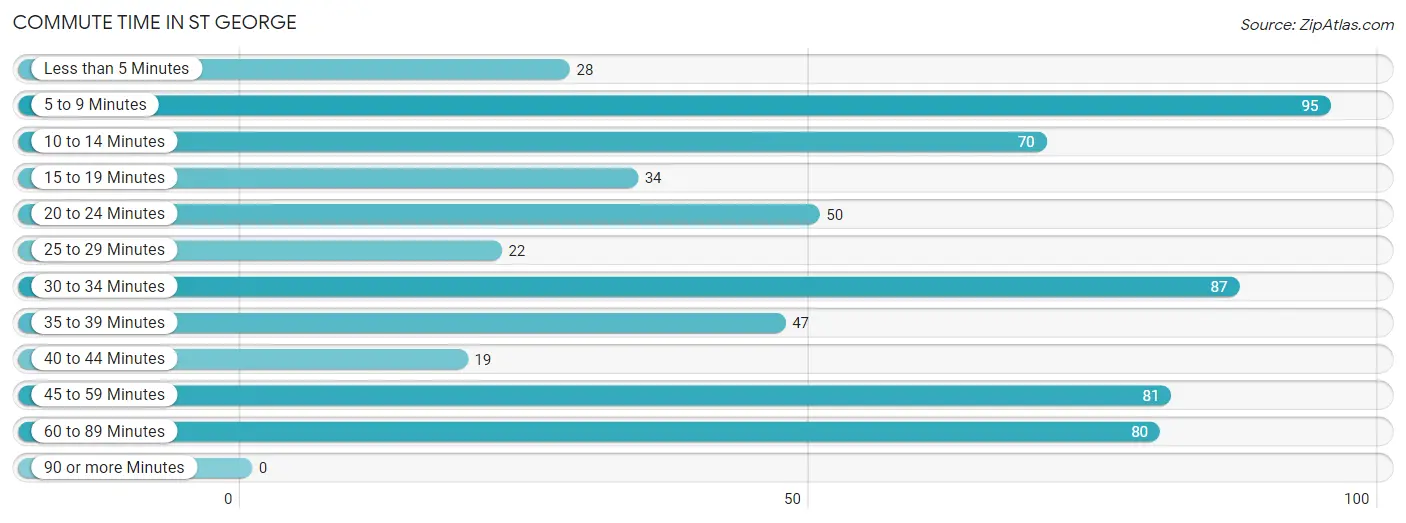
| Commute Time | # Commuters | % Commuters |
| Less than 5 Minutes | 28 | 4.6% |
| 5 to 9 Minutes | 95 | 15.5% |
| 10 to 14 Minutes | 70 | 11.4% |
| 15 to 19 Minutes | 34 | 5.6% |
| 20 to 24 Minutes | 50 | 8.2% |
| 25 to 29 Minutes | 22 | 3.6% |
| 30 to 34 Minutes | 87 | 14.2% |
| 35 to 39 Minutes | 47 | 7.7% |
| 40 to 44 Minutes | 19 | 3.1% |
| 45 to 59 Minutes | 81 | 13.2% |
| 60 to 89 Minutes | 80 | 13.1% |
| 90 or more Minutes | 0 | 0.0% |
Commute Time by Sex in St George
The most common commute times in St George are 45 to 59 minutes (71 commuters, 24.3%) for males and 5 to 9 minutes (67 commuters, 20.9%) for females.
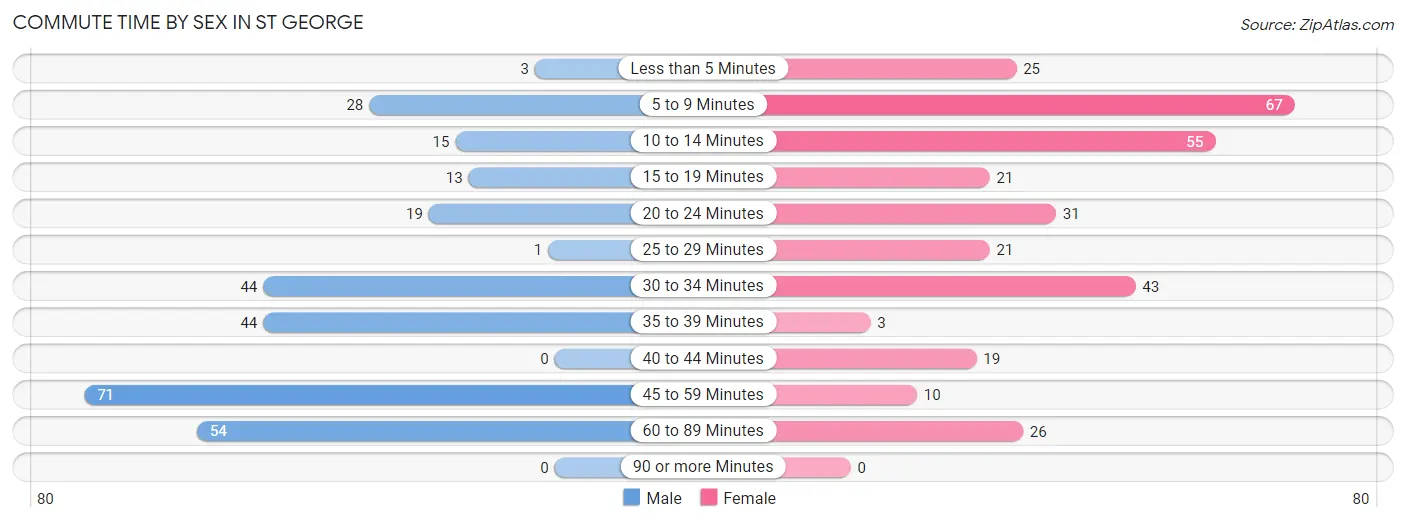
| Commute Time | Male | Female |
| Less than 5 Minutes | 3 (1.0%) | 25 (7.8%) |
| 5 to 9 Minutes | 28 (9.6%) | 67 (20.9%) |
| 10 to 14 Minutes | 15 (5.1%) | 55 (17.1%) |
| 15 to 19 Minutes | 13 (4.4%) | 21 (6.5%) |
| 20 to 24 Minutes | 19 (6.5%) | 31 (9.7%) |
| 25 to 29 Minutes | 1 (0.3%) | 21 (6.5%) |
| 30 to 34 Minutes | 44 (15.1%) | 43 (13.4%) |
| 35 to 39 Minutes | 44 (15.1%) | 3 (0.9%) |
| 40 to 44 Minutes | 0 (0.0%) | 19 (5.9%) |
| 45 to 59 Minutes | 71 (24.3%) | 10 (3.1%) |
| 60 to 89 Minutes | 54 (18.5%) | 26 (8.1%) |
| 90 or more Minutes | 0 (0.0%) | 0 (0.0%) |
Time of Departure to Work by Sex in St George
The most frequent times of departure to work in St George are 7:00 AM to 7:29 AM (69, 23.6%) for males and 7:30 AM to 7:59 AM (63, 19.6%) for females.
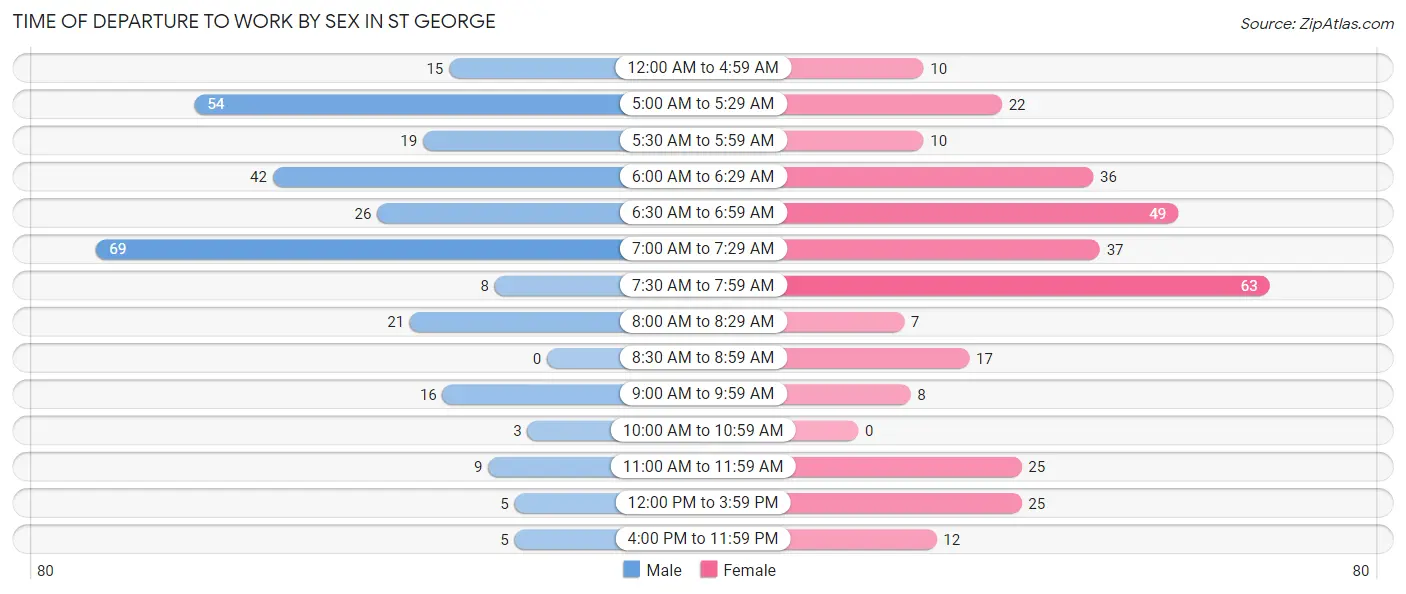
| Time of Departure | Male | Female |
| 12:00 AM to 4:59 AM | 15 (5.1%) | 10 (3.1%) |
| 5:00 AM to 5:29 AM | 54 (18.5%) | 22 (6.9%) |
| 5:30 AM to 5:59 AM | 19 (6.5%) | 10 (3.1%) |
| 6:00 AM to 6:29 AM | 42 (14.4%) | 36 (11.2%) |
| 6:30 AM to 6:59 AM | 26 (8.9%) | 49 (15.3%) |
| 7:00 AM to 7:29 AM | 69 (23.6%) | 37 (11.5%) |
| 7:30 AM to 7:59 AM | 8 (2.7%) | 63 (19.6%) |
| 8:00 AM to 8:29 AM | 21 (7.2%) | 7 (2.2%) |
| 8:30 AM to 8:59 AM | 0 (0.0%) | 17 (5.3%) |
| 9:00 AM to 9:59 AM | 16 (5.5%) | 8 (2.5%) |
| 10:00 AM to 10:59 AM | 3 (1.0%) | 0 (0.0%) |
| 11:00 AM to 11:59 AM | 9 (3.1%) | 25 (7.8%) |
| 12:00 PM to 3:59 PM | 5 (1.7%) | 25 (7.8%) |
| 4:00 PM to 11:59 PM | 5 (1.7%) | 12 (3.7%) |
| Total | 292 (100.0%) | 321 (100.0%) |
Housing Occupancy in St George
Occupancy by Ownership in St George
Of the total 777 dwellings in St George, owner-occupied units account for 382 (49.2%), while renter-occupied units make up 395 (50.8%).
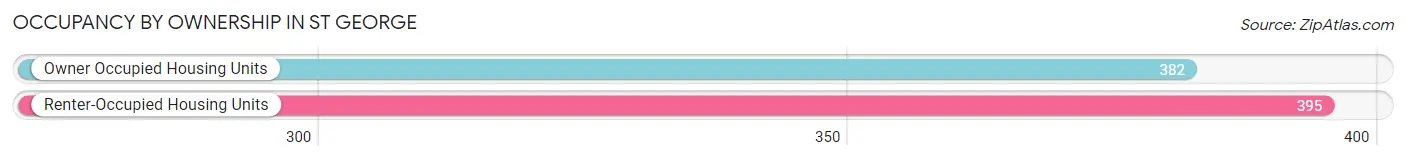
| Occupancy | # Housing Units | % Housing Units |
| Owner Occupied Housing Units | 382 | 49.2% |
| Renter-Occupied Housing Units | 395 | 50.8% |
| Total Occupied Housing Units | 777 | 100.0% |
Occupancy by Household Size in St George
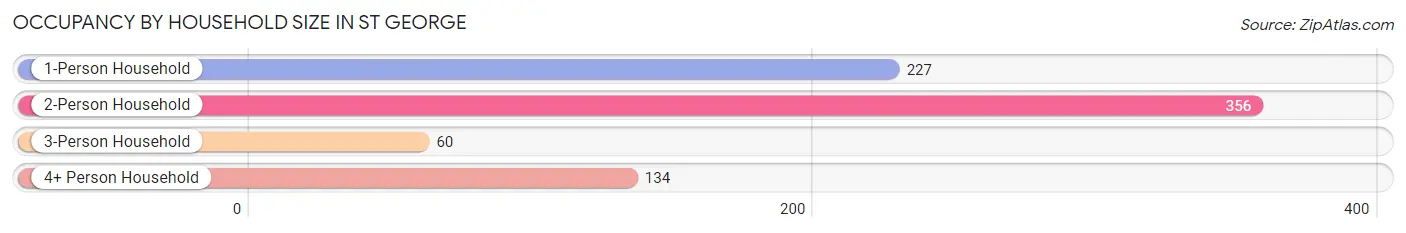
| Household Size | # Housing Units | % Housing Units |
| 1-Person Household | 227 | 29.2% |
| 2-Person Household | 356 | 45.8% |
| 3-Person Household | 60 | 7.7% |
| 4+ Person Household | 134 | 17.2% |
| Total Housing Units | 777 | 100.0% |
Occupancy by Ownership by Household Size in St George
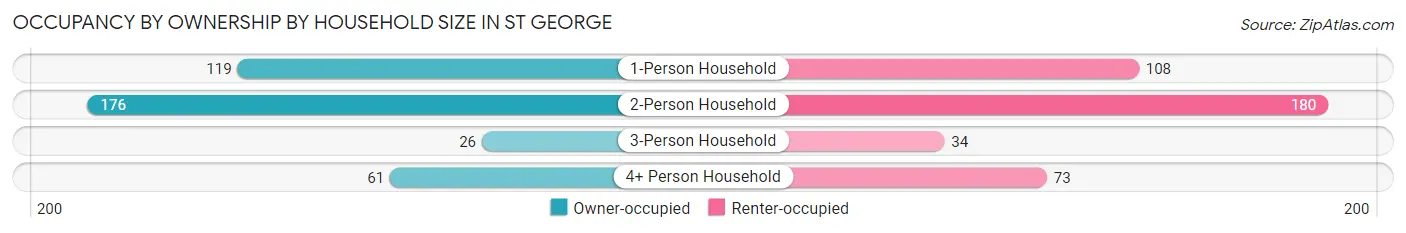
| Household Size | Owner-occupied | Renter-occupied |
| 1-Person Household | 119 (52.4%) | 108 (47.6%) |
| 2-Person Household | 176 (49.4%) | 180 (50.6%) |
| 3-Person Household | 26 (43.3%) | 34 (56.7%) |
| 4+ Person Household | 61 (45.5%) | 73 (54.5%) |
| Total Housing Units | 382 (49.2%) | 395 (50.8%) |
Occupancy by Educational Attainment in St George
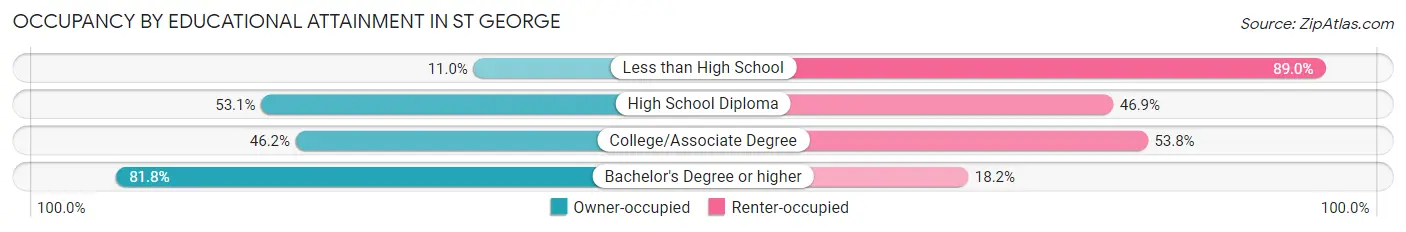
| Household Size | Owner-occupied | Renter-occupied |
| Less than High School | 16 (11.0%) | 130 (89.0%) |
| High School Diploma | 121 (53.1%) | 107 (46.9%) |
| College/Associate Degree | 110 (46.2%) | 128 (53.8%) |
| Bachelor's Degree or higher | 135 (81.8%) | 30 (18.2%) |
Occupancy by Age of Householder in St George
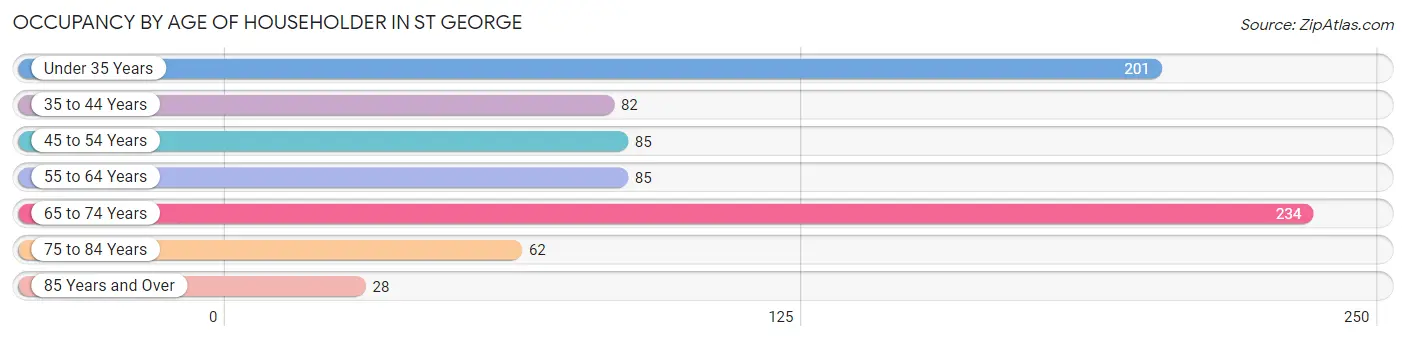
| Age Bracket | # Households | % Households |
| Under 35 Years | 201 | 25.9% |
| 35 to 44 Years | 82 | 10.5% |
| 45 to 54 Years | 85 | 10.9% |
| 55 to 64 Years | 85 | 10.9% |
| 65 to 74 Years | 234 | 30.1% |
| 75 to 84 Years | 62 | 8.0% |
| 85 Years and Over | 28 | 3.6% |
| Total | 777 | 100.0% |
Housing Finances in St George
Median Income by Occupancy in St George
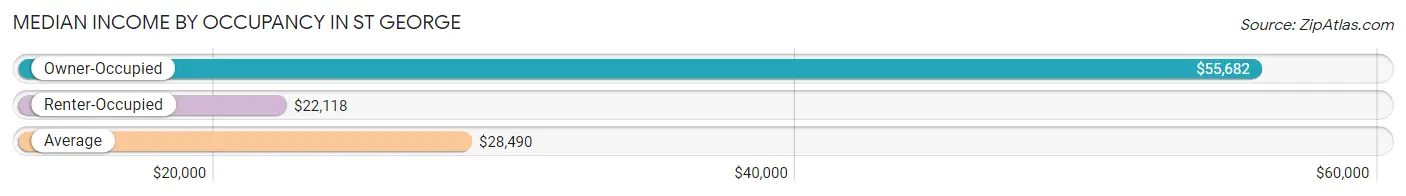
| Occupancy Type | # Households | Median Income |
| Owner-Occupied | 382 (49.2%) | $55,682 |
| Renter-Occupied | 395 (50.8%) | $22,118 |
| Average | 777 (100.0%) | $28,490 |
Occupancy by Householder Income Bracket in St George
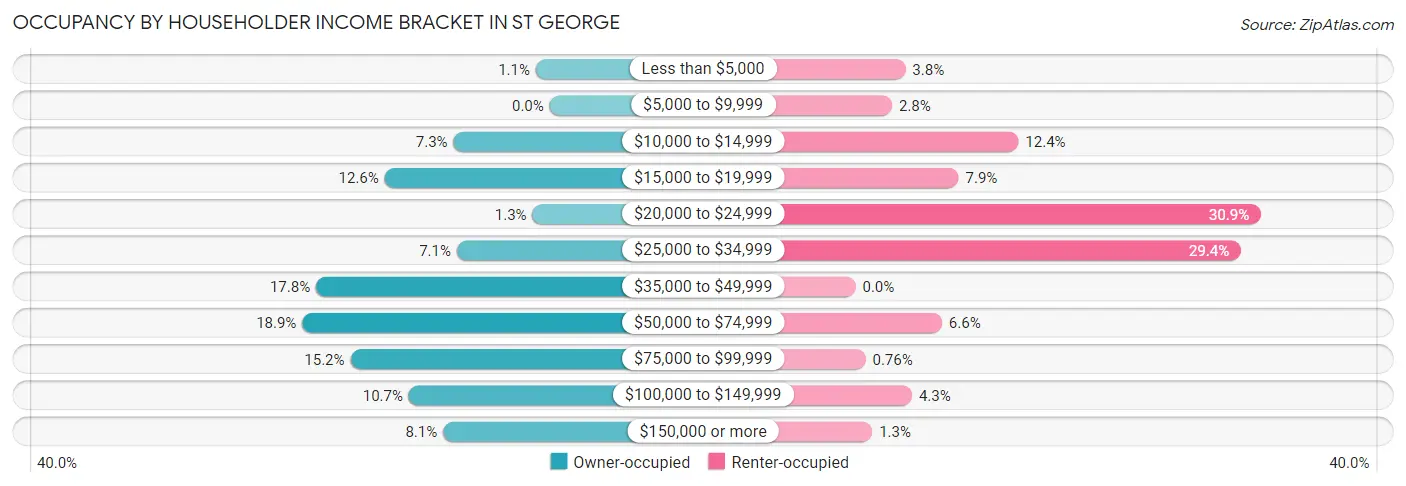
| Income Bracket | Owner-occupied | Renter-occupied |
| Less than $5,000 | 4 (1.1%) | 15 (3.8%) |
| $5,000 to $9,999 | 0 (0.0%) | 11 (2.8%) |
| $10,000 to $14,999 | 28 (7.3%) | 49 (12.4%) |
| $15,000 to $19,999 | 48 (12.6%) | 31 (7.9%) |
| $20,000 to $24,999 | 5 (1.3%) | 122 (30.9%) |
| $25,000 to $34,999 | 27 (7.1%) | 116 (29.4%) |
| $35,000 to $49,999 | 68 (17.8%) | 0 (0.0%) |
| $50,000 to $74,999 | 72 (18.9%) | 26 (6.6%) |
| $75,000 to $99,999 | 58 (15.2%) | 3 (0.8%) |
| $100,000 to $149,999 | 41 (10.7%) | 17 (4.3%) |
| $150,000 or more | 31 (8.1%) | 5 (1.3%) |
| Total | 382 (100.0%) | 395 (100.0%) |
Monthly Housing Cost Tiers in St George
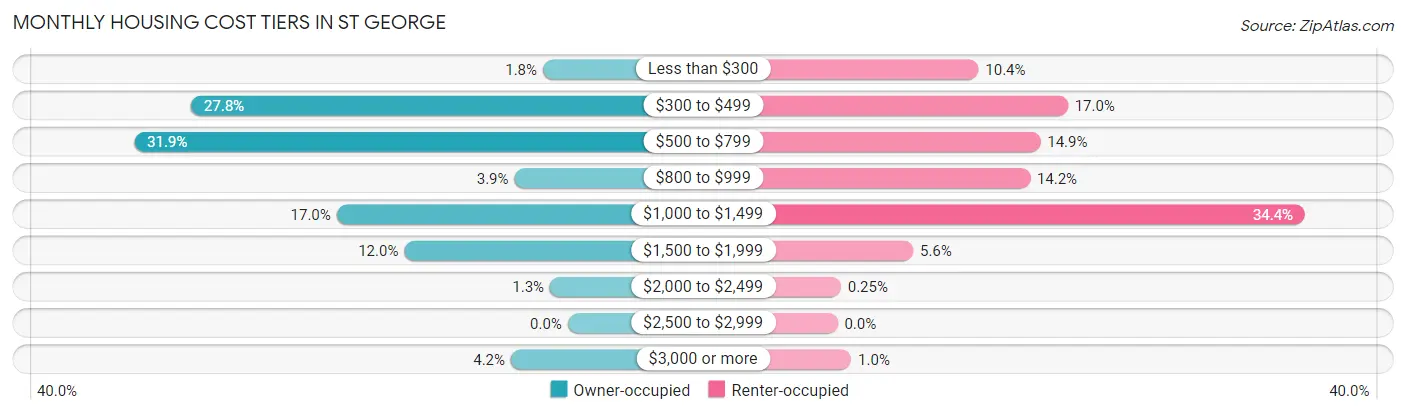
| Monthly Cost | Owner-occupied | Renter-occupied |
| Less than $300 | 7 (1.8%) | 41 (10.4%) |
| $300 to $499 | 106 (27.8%) | 67 (17.0%) |
| $500 to $799 | 122 (31.9%) | 59 (14.9%) |
| $800 to $999 | 15 (3.9%) | 56 (14.2%) |
| $1,000 to $1,499 | 65 (17.0%) | 136 (34.4%) |
| $1,500 to $1,999 | 46 (12.0%) | 22 (5.6%) |
| $2,000 to $2,499 | 5 (1.3%) | 1 (0.3%) |
| $2,500 to $2,999 | 0 (0.0%) | 0 (0.0%) |
| $3,000 or more | 16 (4.2%) | 4 (1.0%) |
| Total | 382 (100.0%) | 395 (100.0%) |
Physical Housing Characteristics in St George
Housing Structures in St George
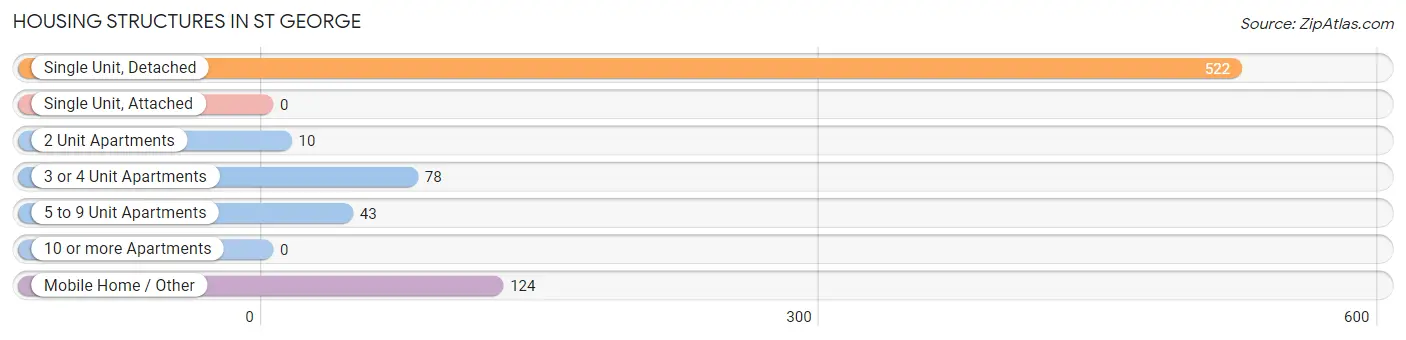
| Structure Type | # Housing Units | % Housing Units |
| Single Unit, Detached | 522 | 67.2% |
| Single Unit, Attached | 0 | 0.0% |
| 2 Unit Apartments | 10 | 1.3% |
| 3 or 4 Unit Apartments | 78 | 10.0% |
| 5 to 9 Unit Apartments | 43 | 5.5% |
| 10 or more Apartments | 0 | 0.0% |
| Mobile Home / Other | 124 | 16.0% |
| Total | 777 | 100.0% |
Housing Structures by Occupancy in St George
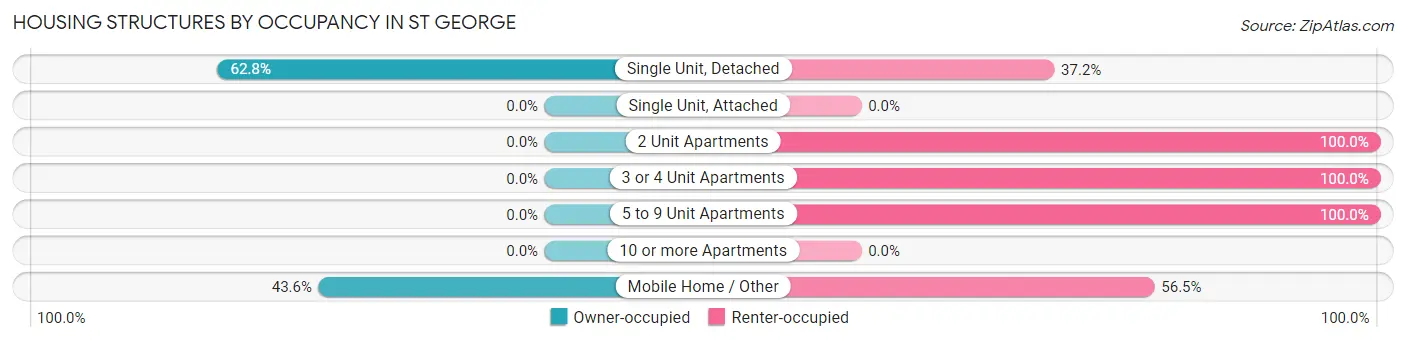
| Structure Type | Owner-occupied | Renter-occupied |
| Single Unit, Detached | 328 (62.8%) | 194 (37.2%) |
| Single Unit, Attached | 0 (0.0%) | 0 (0.0%) |
| 2 Unit Apartments | 0 (0.0%) | 10 (100.0%) |
| 3 or 4 Unit Apartments | 0 (0.0%) | 78 (100.0%) |
| 5 to 9 Unit Apartments | 0 (0.0%) | 43 (100.0%) |
| 10 or more Apartments | 0 (0.0%) | 0 (0.0%) |
| Mobile Home / Other | 54 (43.5%) | 70 (56.5%) |
| Total | 382 (49.2%) | 395 (50.8%) |
Housing Structures by Number of Rooms in St George
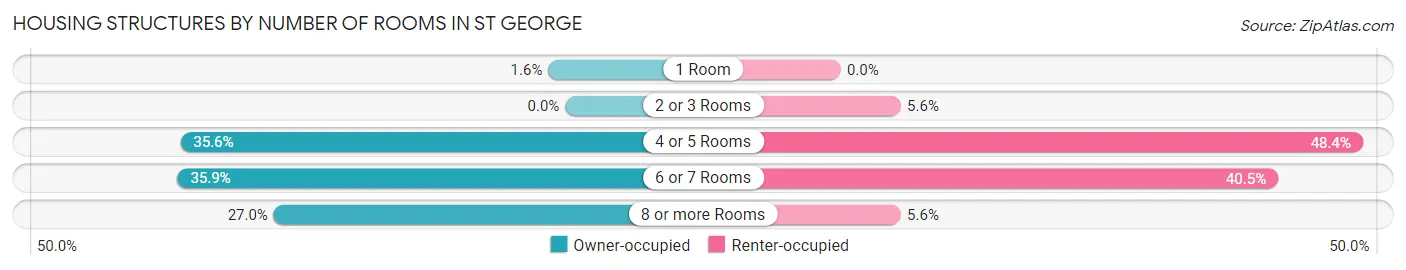
| Number of Rooms | Owner-occupied | Renter-occupied |
| 1 Room | 6 (1.6%) | 0 (0.0%) |
| 2 or 3 Rooms | 0 (0.0%) | 22 (5.6%) |
| 4 or 5 Rooms | 136 (35.6%) | 191 (48.3%) |
| 6 or 7 Rooms | 137 (35.9%) | 160 (40.5%) |
| 8 or more Rooms | 103 (27.0%) | 22 (5.6%) |
| Total | 382 (100.0%) | 395 (100.0%) |
Housing Structure by Heating Type in St George
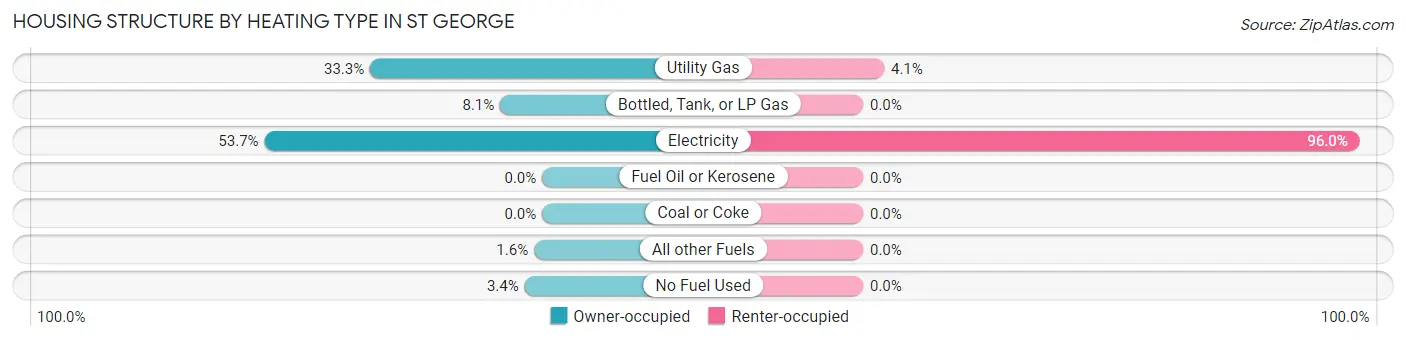
| Heating Type | Owner-occupied | Renter-occupied |
| Utility Gas | 127 (33.3%) | 16 (4.1%) |
| Bottled, Tank, or LP Gas | 31 (8.1%) | 0 (0.0%) |
| Electricity | 205 (53.7%) | 379 (96.0%) |
| Fuel Oil or Kerosene | 0 (0.0%) | 0 (0.0%) |
| Coal or Coke | 0 (0.0%) | 0 (0.0%) |
| All other Fuels | 6 (1.6%) | 0 (0.0%) |
| No Fuel Used | 13 (3.4%) | 0 (0.0%) |
| Total | 382 (100.0%) | 395 (100.0%) |
Household Vehicle Usage in St George
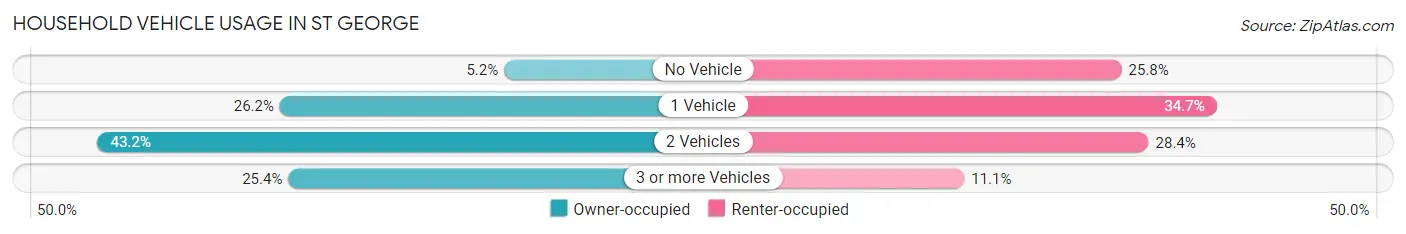
| Vehicles per Household | Owner-occupied | Renter-occupied |
| No Vehicle | 20 (5.2%) | 102 (25.8%) |
| 1 Vehicle | 100 (26.2%) | 137 (34.7%) |
| 2 Vehicles | 165 (43.2%) | 112 (28.3%) |
| 3 or more Vehicles | 97 (25.4%) | 44 (11.1%) |
| Total | 382 (100.0%) | 395 (100.0%) |
Real Estate & Mortgages in St George
Real Estate and Mortgage Overview in St George
| Characteristic | Without Mortgage | With Mortgage |
| Housing Units | 209 | 173 |
| Median Property Value | $92,400 | $187,500 |
| Median Household Income | $35,568 | $24 |
| Monthly Housing Costs | $482 | $16 |
| Real Estate Taxes | $744 | $11 |
Property Value by Mortgage Status in St George
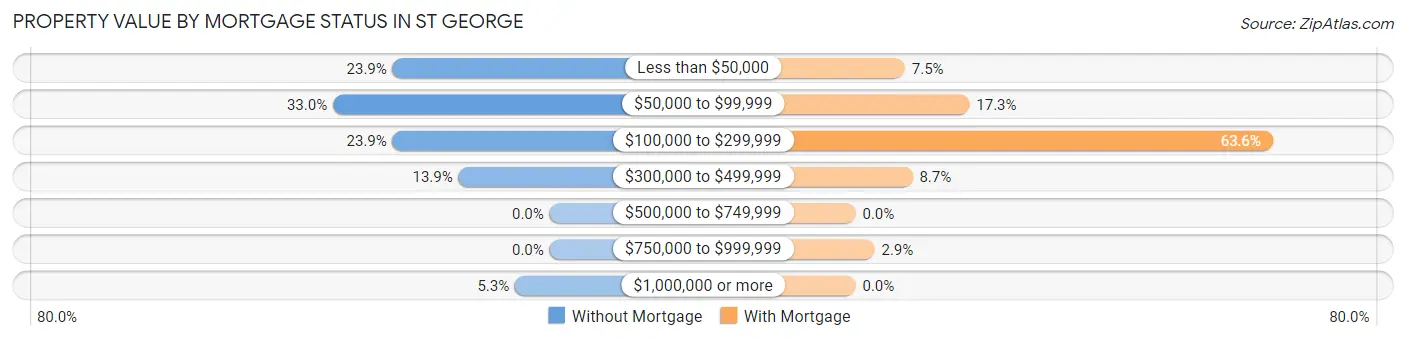
| Property Value | Without Mortgage | With Mortgage |
| Less than $50,000 | 50 (23.9%) | 13 (7.5%) |
| $50,000 to $99,999 | 69 (33.0%) | 30 (17.3%) |
| $100,000 to $299,999 | 50 (23.9%) | 110 (63.6%) |
| $300,000 to $499,999 | 29 (13.9%) | 15 (8.7%) |
| $500,000 to $749,999 | 0 (0.0%) | 0 (0.0%) |
| $750,000 to $999,999 | 0 (0.0%) | 5 (2.9%) |
| $1,000,000 or more | 11 (5.3%) | 0 (0.0%) |
| Total | 209 (100.0%) | 173 (100.0%) |
Household Income by Mortgage Status in St George
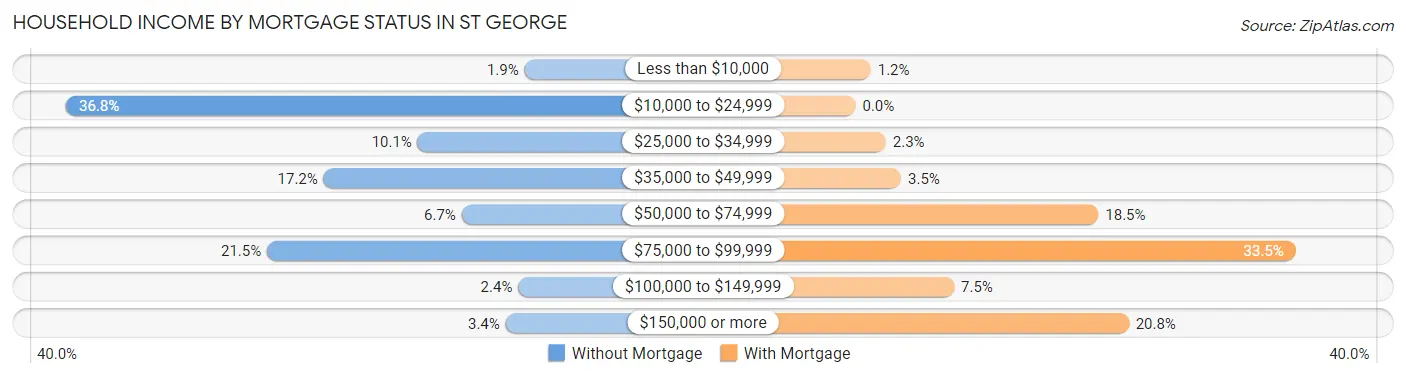
| Household Income | Without Mortgage | With Mortgage |
| Less than $10,000 | 4 (1.9%) | 2 (1.2%) |
| $10,000 to $24,999 | 77 (36.8%) | 0 (0.0%) |
| $25,000 to $34,999 | 21 (10.1%) | 4 (2.3%) |
| $35,000 to $49,999 | 36 (17.2%) | 6 (3.5%) |
| $50,000 to $74,999 | 14 (6.7%) | 32 (18.5%) |
| $75,000 to $99,999 | 45 (21.5%) | 58 (33.5%) |
| $100,000 to $149,999 | 5 (2.4%) | 13 (7.5%) |
| $150,000 or more | 7 (3.4%) | 36 (20.8%) |
| Total | 209 (100.0%) | 173 (100.0%) |
Property Value to Household Income Ratio in St George
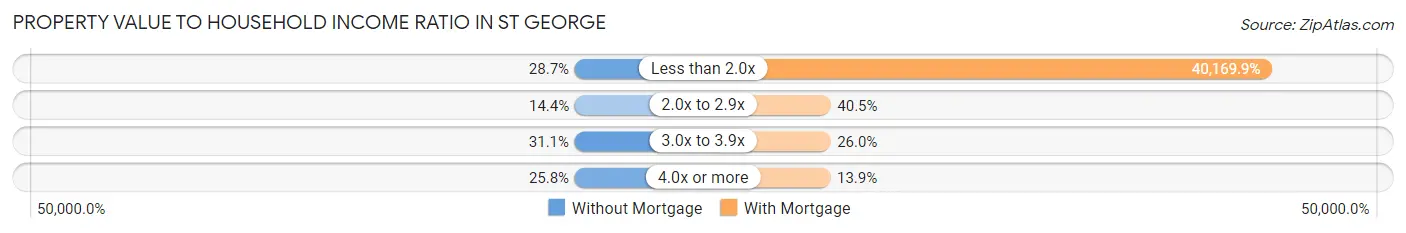
| Value-to-Income Ratio | Without Mortgage | With Mortgage |
| Less than 2.0x | 60 (28.7%) | 69,494 (40,169.9%) |
| 2.0x to 2.9x | 30 (14.3%) | 70 (40.5%) |
| 3.0x to 3.9x | 65 (31.1%) | 45 (26.0%) |
| 4.0x or more | 54 (25.8%) | 24 (13.9%) |
| Total | 209 (100.0%) | 173 (100.0%) |
Real Estate Taxes by Mortgage Status in St George
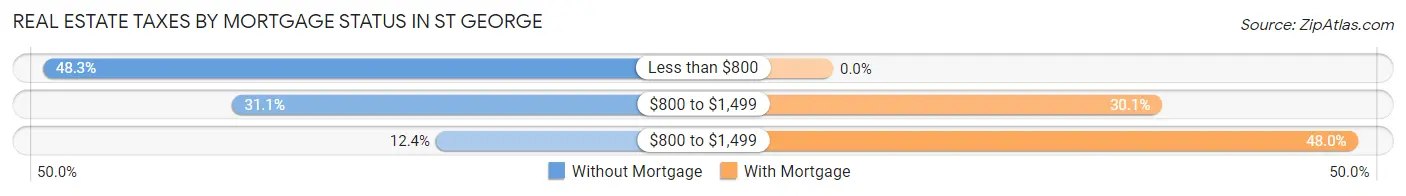
| Property Taxes | Without Mortgage | With Mortgage |
| Less than $800 | 101 (48.3%) | 0 (0.0%) |
| $800 to $1,499 | 65 (31.1%) | 52 (30.1%) |
| $800 to $1,499 | 26 (12.4%) | 83 (48.0%) |
| Total | 209 (100.0%) | 173 (100.0%) |
Health & Disability in St George
Health Insurance Coverage by Age in St George
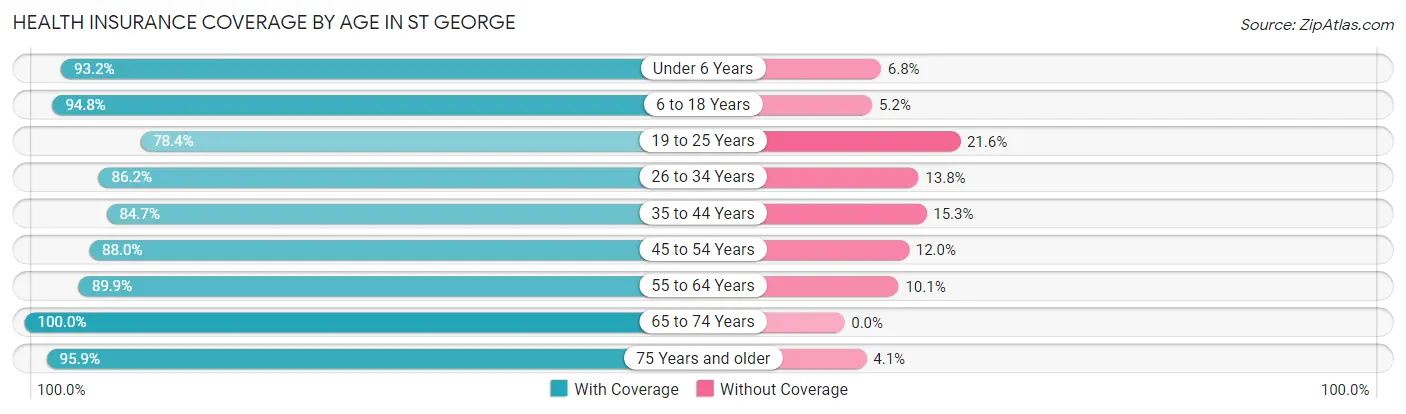
| Age Bracket | With Coverage | Without Coverage |
| Under 6 Years | 82 (93.2%) | 6 (6.8%) |
| 6 to 18 Years | 328 (94.8%) | 18 (5.2%) |
| 19 to 25 Years | 120 (78.4%) | 33 (21.6%) |
| 26 to 34 Years | 187 (86.2%) | 30 (13.8%) |
| 35 to 44 Years | 144 (84.7%) | 26 (15.3%) |
| 45 to 54 Years | 139 (88.0%) | 19 (12.0%) |
| 55 to 64 Years | 169 (89.9%) | 19 (10.1%) |
| 65 to 74 Years | 321 (100.0%) | 0 (0.0%) |
| 75 Years and older | 140 (95.9%) | 6 (4.1%) |
| Total | 1,630 (91.2%) | 157 (8.8%) |
Health Insurance Coverage by Citizenship Status in St George
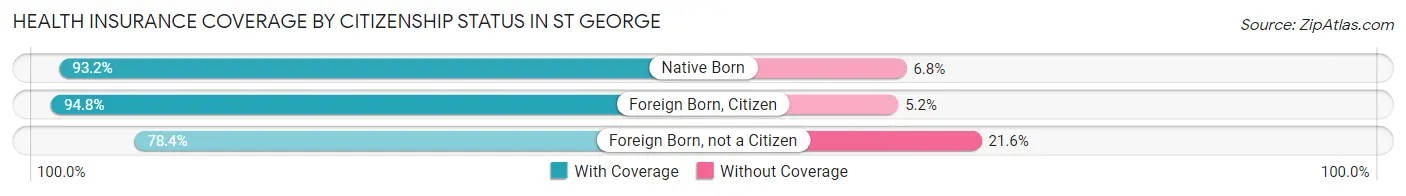
| Citizenship Status | With Coverage | Without Coverage |
| Native Born | 82 (93.2%) | 6 (6.8%) |
| Foreign Born, Citizen | 328 (94.8%) | 18 (5.2%) |
| Foreign Born, not a Citizen | 120 (78.4%) | 33 (21.6%) |
Health Insurance Coverage by Household Income in St George
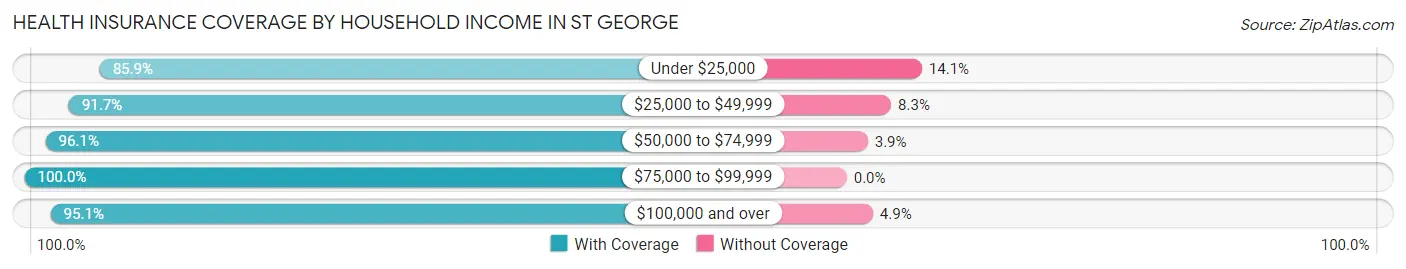
| Household Income | With Coverage | Without Coverage |
| Under $25,000 | 604 (85.9%) | 99 (14.1%) |
| $25,000 to $49,999 | 364 (91.7%) | 33 (8.3%) |
| $50,000 to $74,999 | 293 (96.1%) | 12 (3.9%) |
| $75,000 to $99,999 | 116 (100.0%) | 0 (0.0%) |
| $100,000 and over | 253 (95.1%) | 13 (4.9%) |
Public vs Private Health Insurance Coverage by Age in St George
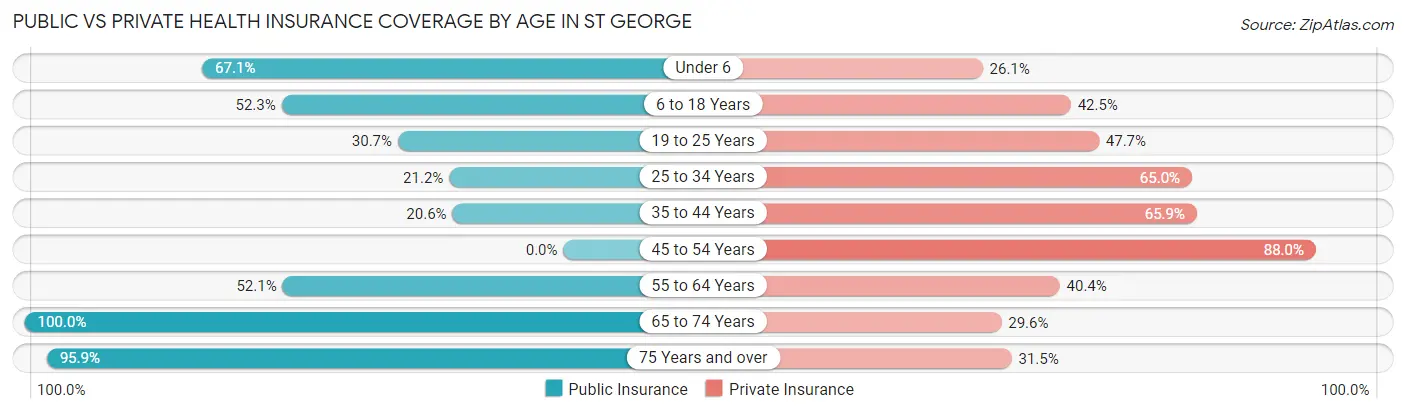
| Age Bracket | Public Insurance | Private Insurance |
| Under 6 | 59 (67.0%) | 23 (26.1%) |
| 6 to 18 Years | 181 (52.3%) | 147 (42.5%) |
| 19 to 25 Years | 47 (30.7%) | 73 (47.7%) |
| 25 to 34 Years | 46 (21.2%) | 141 (65.0%) |
| 35 to 44 Years | 35 (20.6%) | 112 (65.9%) |
| 45 to 54 Years | 0 (0.0%) | 139 (88.0%) |
| 55 to 64 Years | 98 (52.1%) | 76 (40.4%) |
| 65 to 74 Years | 321 (100.0%) | 95 (29.6%) |
| 75 Years and over | 140 (95.9%) | 46 (31.5%) |
| Total | 927 (51.9%) | 852 (47.7%) |
Disability Status by Sex by Age in St George
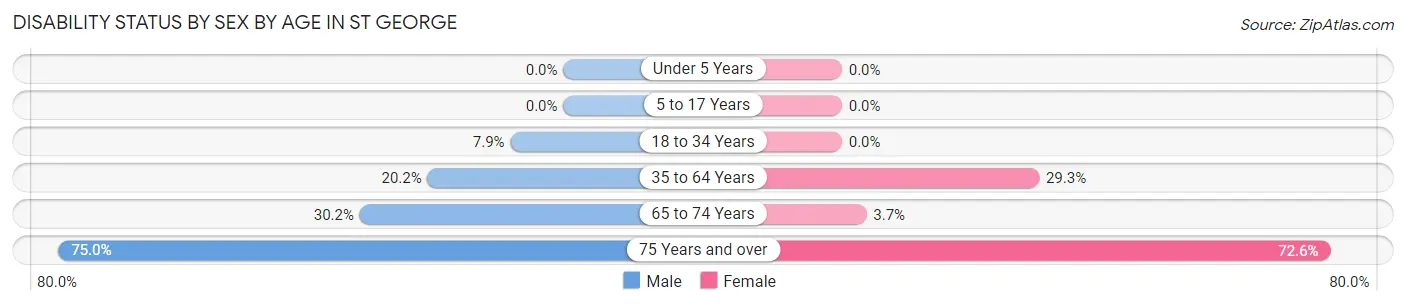
| Age Bracket | Male | Female |
| Under 5 Years | 0 (0.0%) | 0 (0.0%) |
| 5 to 17 Years | 0 (0.0%) | 0 (0.0%) |
| 18 to 34 Years | 11 (7.9%) | 0 (0.0%) |
| 35 to 64 Years | 51 (20.2%) | 77 (29.3%) |
| 65 to 74 Years | 39 (30.2%) | 7 (3.6%) |
| 75 Years and over | 33 (75.0%) | 74 (72.6%) |
Disability Class by Sex by Age in St George
Disability Class: Hearing Difficulty
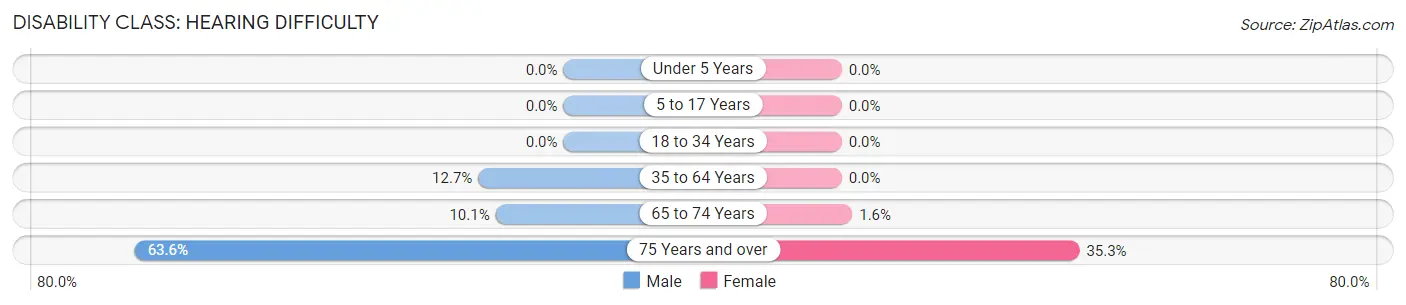
| Age Bracket | Male | Female |
| Under 5 Years | 0 (0.0%) | 0 (0.0%) |
| 5 to 17 Years | 0 (0.0%) | 0 (0.0%) |
| 18 to 34 Years | 0 (0.0%) | 0 (0.0%) |
| 35 to 64 Years | 32 (12.7%) | 0 (0.0%) |
| 65 to 74 Years | 13 (10.1%) | 3 (1.6%) |
| 75 Years and over | 28 (63.6%) | 36 (35.3%) |
Disability Class: Vision Difficulty
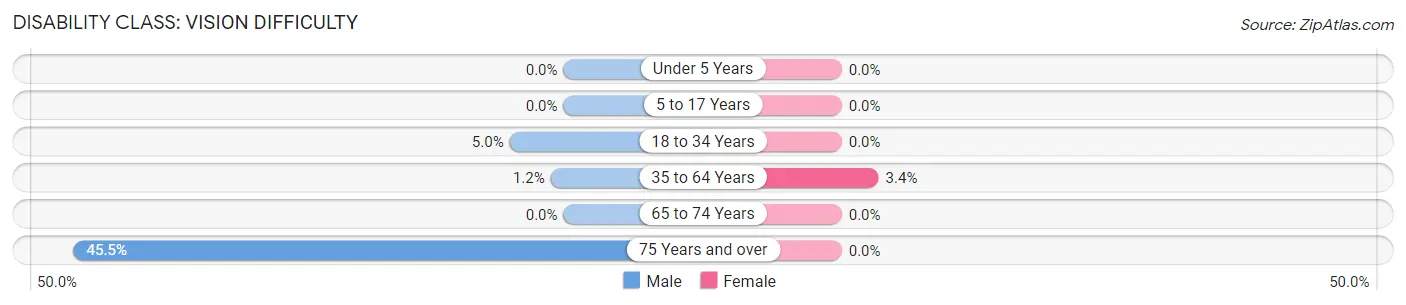
| Age Bracket | Male | Female |
| Under 5 Years | 0 (0.0%) | 0 (0.0%) |
| 5 to 17 Years | 0 (0.0%) | 0 (0.0%) |
| 18 to 34 Years | 7 (5.0%) | 0 (0.0%) |
| 35 to 64 Years | 3 (1.2%) | 9 (3.4%) |
| 65 to 74 Years | 0 (0.0%) | 0 (0.0%) |
| 75 Years and over | 20 (45.5%) | 0 (0.0%) |
Disability Class: Cognitive Difficulty
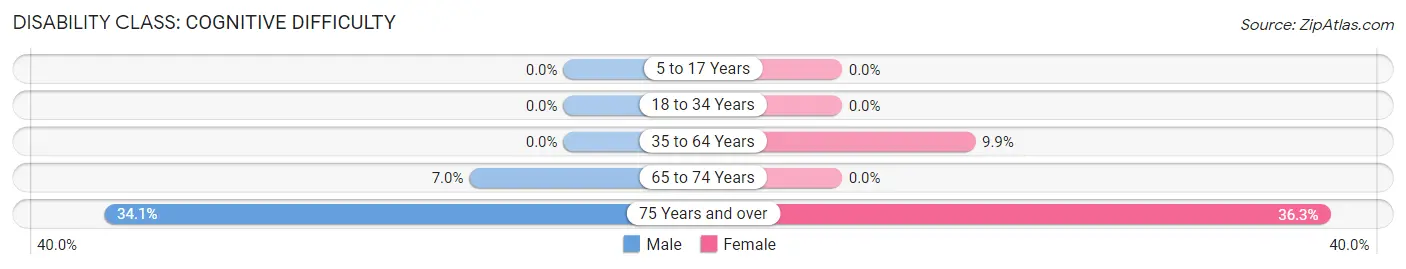
| Age Bracket | Male | Female |
| 5 to 17 Years | 0 (0.0%) | 0 (0.0%) |
| 18 to 34 Years | 0 (0.0%) | 0 (0.0%) |
| 35 to 64 Years | 0 (0.0%) | 26 (9.9%) |
| 65 to 74 Years | 9 (7.0%) | 0 (0.0%) |
| 75 Years and over | 15 (34.1%) | 37 (36.3%) |
Disability Class: Ambulatory Difficulty
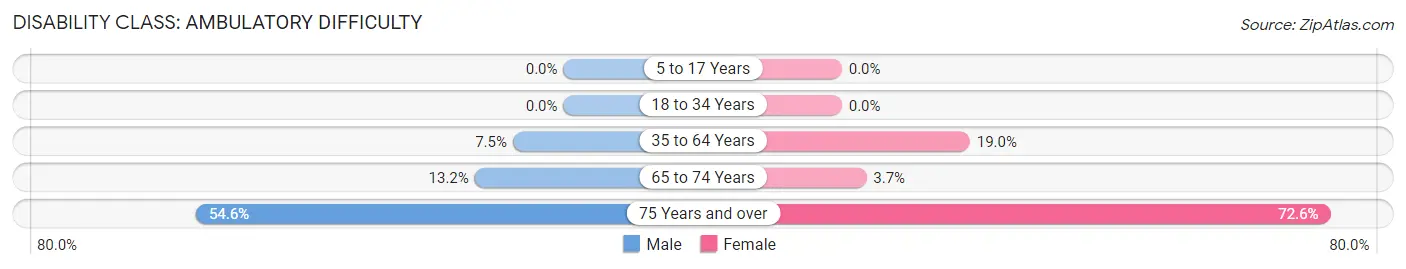
| Age Bracket | Male | Female |
| 5 to 17 Years | 0 (0.0%) | 0 (0.0%) |
| 18 to 34 Years | 0 (0.0%) | 0 (0.0%) |
| 35 to 64 Years | 19 (7.5%) | 50 (19.0%) |
| 65 to 74 Years | 17 (13.2%) | 7 (3.6%) |
| 75 Years and over | 24 (54.5%) | 74 (72.6%) |
Disability Class: Self-Care Difficulty
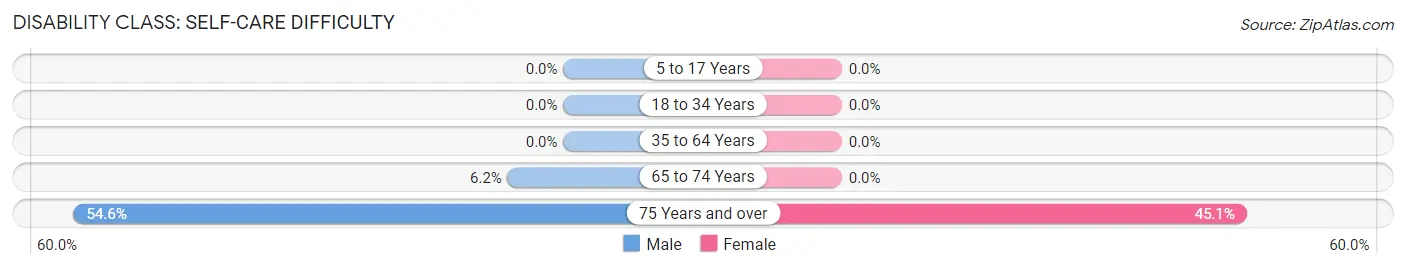
| Age Bracket | Male | Female |
| 5 to 17 Years | 0 (0.0%) | 0 (0.0%) |
| 18 to 34 Years | 0 (0.0%) | 0 (0.0%) |
| 35 to 64 Years | 0 (0.0%) | 0 (0.0%) |
| 65 to 74 Years | 8 (6.2%) | 0 (0.0%) |
| 75 Years and over | 24 (54.5%) | 46 (45.1%) |
Technology Access in St George
Computing Device Access in St George
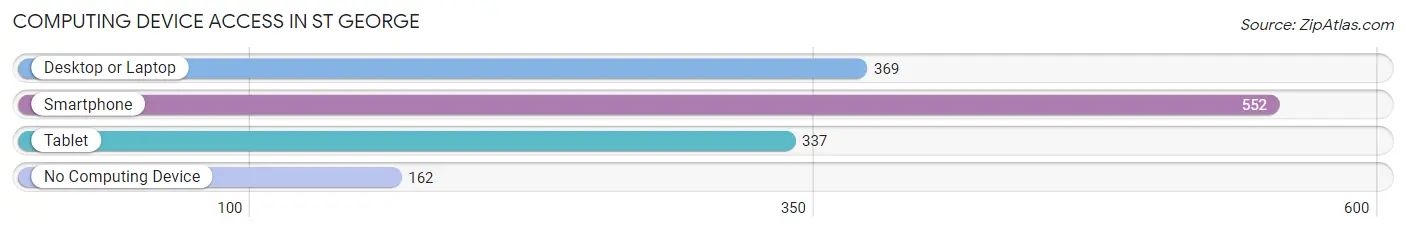
| Device Type | # Households | % Households |
| Desktop or Laptop | 369 | 47.5% |
| Smartphone | 552 | 71.0% |
| Tablet | 337 | 43.4% |
| No Computing Device | 162 | 20.8% |
| Total | 777 | 100.0% |
Internet Access in St George
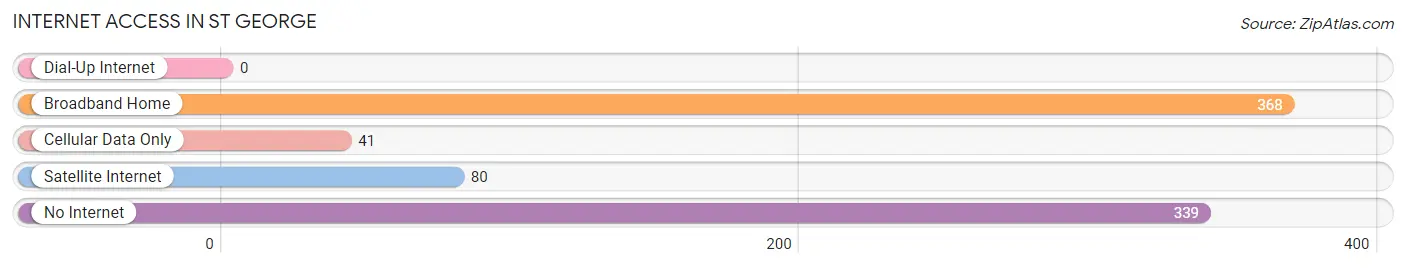
| Internet Type | # Households | % Households |
| Dial-Up Internet | 0 | 0.0% |
| Broadband Home | 368 | 47.4% |
| Cellular Data Only | 41 | 5.3% |
| Satellite Internet | 80 | 10.3% |
| No Internet | 339 | 43.6% |
| Total | 777 | 100.0% |
St George Summary
St George is a small town located in Dorchester County, South Carolina. It is situated on the banks of the Ashley River, about 25 miles northwest of Charleston. The town was founded in 1734 and is one of the oldest towns in the state. It is the county seat of Dorchester County and is home to a population of approximately 2,000 people.
Geography
St George is located in the Lowcountry region of South Carolina, which is characterized by its flat terrain and coastal plains. The town is situated on the banks of the Ashley River, which is a major tributary of the Cooper River. The town is surrounded by several small towns and villages, including Summerville, Ridgeville, and Harleyville. The town is also located near the Francis Marion National Forest, which is a popular destination for outdoor recreation.
The climate in St George is humid subtropical, with hot, humid summers and mild winters. The average annual temperature is around 70 degrees Fahrenheit, with temperatures reaching as high as 95 degrees in the summer months. The town receives an average of 48 inches of rain per year, with the wettest months being June and July.
Economy
The economy of St George is largely based on agriculture and tourism. The town is home to several farms, which produce a variety of crops, including corn, soybeans, cotton, and peanuts. The town is also home to several tourist attractions, including the Ashley River Plantation, the St George Historic District, and the St George Museum.
The town is also home to several small businesses, including restaurants, retail stores, and professional services. The town is served by the Dorchester County School District, which provides educational services to the town's students.
Demographics
As of the 2010 census, the population of St George was 2,000 people. The racial makeup of the town was 79.2% White, 17.2% African American, 0.7% Native American, 0.7% Asian, 0.2% Pacific Islander, and 1.9% from other races. The median household income was $37,500, and the median family income was $45,000.
The town is home to several churches, including the St George United Methodist Church, the St George Presbyterian Church, and the St George Baptist Church. The town is also home to several schools, including the St George Elementary School, the St George Middle School, and the St George High School.
Conclusion
St George is a small town located in Dorchester County, South Carolina. It is situated on the banks of the Ashley River, about 25 miles northwest of Charleston. The town was founded in 1734 and is one of the oldest towns in the state. It is the county seat of Dorchester County and is home to a population of approximately 2,000 people. The economy of St George is largely based on agriculture and tourism, and the town is home to several small businesses, churches, and schools. The racial makeup of the town is 79.2% White, 17.2% African American, 0.7% Native American, 0.7% Asian, 0.2% Pacific Islander, and 1.9% from other races. The median household income was $37,500, and the median family income was $45,000.
Common Questions
What is the Total Population of St George?
Total Population of St George is 1,901.
What is the Total Male Population of St George?
Total Male Population of St George is 828.
What is the Total Female Population of St George?
Total Female Population of St George is 1,073.
What is the Ratio of Males per 100 Females in St George?
There are 77.17 Males per 100 Females in St George.
What is the Ratio of Females per 100 Males in St George?
There are 129.59 Females per 100 Males in St George.
What is the Median Population Age in St George?
Median Population Age in St George is 41.8 Years.
What is the Average Family Size in St George
Average Family Size in St George is 2.8 People.
What is the Average Household Size in St George
Average Household Size in St George is 2.3 People.
What is Per Capita Income in St George?
Per Capita income in St George is $22,188.
What is the Median Family Income in St George?
Median Family Income in St George is $28,324.
What is the Median Household income in St George?
Median Household Income in St George is $28,490.
What is Income or Wage Gap in St George?
Income or Wage Gap in St George is 52.6%.
Women in St George earn 47.4 cents for every dollar earned by a man.
What is Inequality or Gini Index in St George?
Inequality or Gini Index in St George is 0.48.
How Large is the Labor Force in St George?
There are 636 People in the Labor Forcein in St George.
What is the Percentage of People in the Labor Force in St George?
42.0% of People are in the Labor Force in St George.
What is the Unemployment Rate in St George?
Unemployment Rate in St George is 0.8%.