Somali vs Scottish Receiving Food Stamps

COMPARE

Somali
Race
Ancestry
AfghanAfricanAlaska NativeAlaskan AthabascanAlbanianAleutAlsatianAmericanApacheArabArapahoArgentineanArmenianAssyrian/Chaldean/SyriacAustralianAustrianBahamianBangladeshiBarbadianBasqueBelgianBelizeanBermudanBhutaneseBlackfeetBolivianBrazilianBritishBritish West IndianBulgarianBurmeseCajunCambodianCanadianCape VerdeanCarpatho RusynCelticCentral AmericanCentral American IndianCherokeeCheyenneChickasawChileanChineseChippewaChoctawColombianColvilleComancheCosta RicanCreeCreekCroatianCrowCubanCypriotCzechCzechoslovakianDanishDelawareDominicanDutchDutch West IndianEastern EuropeanEcuadorianEgyptianEnglishEstonianEthiopianEuropeanFijianFilipinoFinnishFrenchFrench American IndianFrench CanadianGermanGerman RussianGhanaianGreekGuamanian/ChamorroGuatemalanGuyaneseHaitianHmongHonduranHopiHoumaHungarianIcelanderIndian (Asian)IndonesianInupiatIranianIraqiIrishIroquoisIsraeliItalianJamaicanJapaneseJordanianKenyanKiowaKoreanLaotianLatvianLebaneseLiberianLithuanianLumbeeLuxembourgerMacedonianMalaysianMalteseMarshalleseMenomineeMexicanMexican American IndianMongolianMoroccanNative HawaiianNavajoNepaleseNew ZealanderNicaraguanNigerianNorthern EuropeanNorwegianOkinawanOsageOttawaPaiutePakistaniPalestinianPanamanianParaguayanPennsylvania GermanPeruvianPimaPolishPortuguesePotawatomiPuebloPuerto RicanPuget Sound SalishRomanianRussianSalvadoranSamoanScandinavianScotch-IrishSeminoleSenegaleseSerbianShoshoneSierra LeoneanSiouxSlavicSlovakSloveneSomaliSouth AfricanSouth AmericanSouth American IndianSoviet UnionSpaniardSpanishSpanish AmericanSpanish American IndianSri LankanSubsaharan AfricanSudaneseSwedishSwissSyrianTaiwaneseThaiTlingit-HaidaTohono O'OdhamTonganTrinidadian and TobagonianTsimshianTurkishU.S. Virgin IslanderUgandanUkrainianUruguayanUteVenezuelanVietnameseWelshWest IndianYakamaYaquiYugoslavianYumanYup'ikZimbabwean
Immigration
NonimmigrantsImmigrantsAfghanistanAfricaAlbaniaArgentinaArmeniaAsiaAustraliaAustriaBahamasBangladeshBarbadosBelarusBelgiumBelizeBoliviaBosnia and HerzegovinaBrazilBulgariaBurma/MyanmarCabo VerdeCambodiaCameroonCanadaCaribbeanCentral AmericaChileChinaColombiaCongoCosta RicaCroatiaCubaCzechoslovakiaDenmarkDominicaDominican RepublicEastern AfricaEastern AsiaEastern EuropeEcuadorEgyptEl SalvadorEnglandEritreaEthiopiaEuropeFijiFranceGermanyGhanaGreeceGrenadaGuatemalaGuyanaHaitiHondurasHong KongHungaryIndiaIndonesiaIranIraqIrelandIsraelItalyJamaicaJapanJordanKazakhstanKenyaKoreaKuwaitLaosLatin AmericaLatviaLebanonLiberiaLithuaniaMalaysiaMexicoMicronesiaMiddle AfricaMoldovaMoroccoNepalNetherlandsNicaraguaNigeriaNorth AmericaNorth MacedoniaNorthern AfricaNorthern EuropeNorwayOceaniaPakistanPanamaPeruPhilippinesPolandPortugalRomaniaRussiaSaudi ArabiaScotlandSenegalSerbiaSierra LeoneSingaporeSomaliaSouth AfricaSouth AmericaSouth Central AsiaSouth Eastern AsiaSouthern EuropeSpainSri LankaSt. Vincent and the GrenadinesSudanSwedenSwitzerlandSyriaTaiwanThailandTrinidad and TobagoTurkeyUgandaUkraineUruguayUzbekistanVenezuelaVietnamWest IndiesWestern AfricaWestern AsiaWestern EuropeYemenZaireZimbabweAzores
Scottish
Race
Ancestry
AfghanAfricanAlaska NativeAlaskan AthabascanAlbanianAleutAlsatianAmericanApacheArabArapahoArgentineanArmenianAssyrian/Chaldean/SyriacAustralianAustrianBahamianBangladeshiBarbadianBasqueBelgianBelizeanBermudanBhutaneseBlackfeetBolivianBrazilianBritishBritish West IndianBulgarianBurmeseCajunCambodianCanadianCape VerdeanCarpatho RusynCelticCentral AmericanCentral American IndianCherokeeCheyenneChickasawChileanChineseChippewaChoctawColombianColvilleComancheCosta RicanCreeCreekCroatianCrowCubanCypriotCzechCzechoslovakianDanishDelawareDominicanDutchDutch West IndianEastern EuropeanEcuadorianEgyptianEnglishEstonianEthiopianEuropeanFijianFilipinoFinnishFrenchFrench American IndianFrench CanadianGermanGerman RussianGhanaianGreekGuamanian/ChamorroGuatemalanGuyaneseHaitianHmongHonduranHopiHoumaHungarianIcelanderIndian (Asian)IndonesianInupiatIranianIraqiIrishIroquoisIsraeliItalianJamaicanJapaneseJordanianKenyanKiowaKoreanLaotianLatvianLebaneseLiberianLithuanianLumbeeLuxembourgerMacedonianMalaysianMalteseMarshalleseMenomineeMexicanMexican American IndianMongolianMoroccanNative HawaiianNavajoNepaleseNew ZealanderNicaraguanNigerianNorthern EuropeanNorwegianOkinawanOsageOttawaPaiutePakistaniPalestinianPanamanianParaguayanPennsylvania GermanPeruvianPimaPolishPortuguesePotawatomiPuebloPuerto RicanPuget Sound SalishRomanianRussianSalvadoranSamoanScandinavianScotch-IrishScottishSeminoleSenegaleseSerbianShoshoneSierra LeoneanSiouxSlavicSlovakSloveneSouth AfricanSouth AmericanSouth American IndianSoviet UnionSpaniardSpanishSpanish AmericanSpanish American IndianSri LankanSubsaharan AfricanSudaneseSwedishSwissSyrianTaiwaneseThaiTlingit-HaidaTohono O'OdhamTonganTrinidadian and TobagonianTsimshianTurkishU.S. Virgin IslanderUgandanUkrainianUruguayanUteVenezuelanVietnameseWelshWest IndianYakamaYaquiYugoslavianYumanYup'ikZimbabwean
Immigration
NonimmigrantsImmigrantsAfghanistanAfricaAlbaniaArgentinaArmeniaAsiaAustraliaAustriaBahamasBangladeshBarbadosBelarusBelgiumBelizeBoliviaBosnia and HerzegovinaBrazilBulgariaBurma/MyanmarCabo VerdeCambodiaCameroonCanadaCaribbeanCentral AmericaChileChinaColombiaCongoCosta RicaCroatiaCubaCzechoslovakiaDenmarkDominicaDominican RepublicEastern AfricaEastern AsiaEastern EuropeEcuadorEgyptEl SalvadorEnglandEritreaEthiopiaEuropeFijiFranceGermanyGhanaGreeceGrenadaGuatemalaGuyanaHaitiHondurasHong KongHungaryIndiaIndonesiaIranIraqIrelandIsraelItalyJamaicaJapanJordanKazakhstanKenyaKoreaKuwaitLaosLatin AmericaLatviaLebanonLiberiaLithuaniaMalaysiaMexicoMicronesiaMiddle AfricaMoldovaMoroccoNepalNetherlandsNicaraguaNigeriaNorth AmericaNorth MacedoniaNorthern AfricaNorthern EuropeNorwayOceaniaPakistanPanamaPeruPhilippinesPolandPortugalRomaniaRussiaSaudi ArabiaScotlandSenegalSerbiaSierra LeoneSingaporeSomaliaSouth AfricaSouth AmericaSouth Central AsiaSouth Eastern AsiaSouthern EuropeSpainSri LankaSt. Vincent and the GrenadinesSudanSwedenSwitzerlandSyriaTaiwanThailandTrinidad and TobagoTurkeyUgandaUkraineUruguayUzbekistanVenezuelaVietnamWest IndiesWestern AfricaWestern AsiaWestern EuropeYemenZaireZimbabweAzores
Receiving Food Stamps
Income
Poverty
Unemployment
Labor Participation
Family Structure
Vehicle Availability
Education Level
Disability

Receiving Food Stamps Comparison

Somalis

Scottish

Tragic
Exceptional
13.7%
RECEIVING FOOD STAMPS
0.9/ 100
METRIC RATING
243rd/ 347
METRIC RANK
9.9%
RECEIVING FOOD STAMPS
98.9/ 100
METRIC RATING
71st/ 347
METRIC RANK

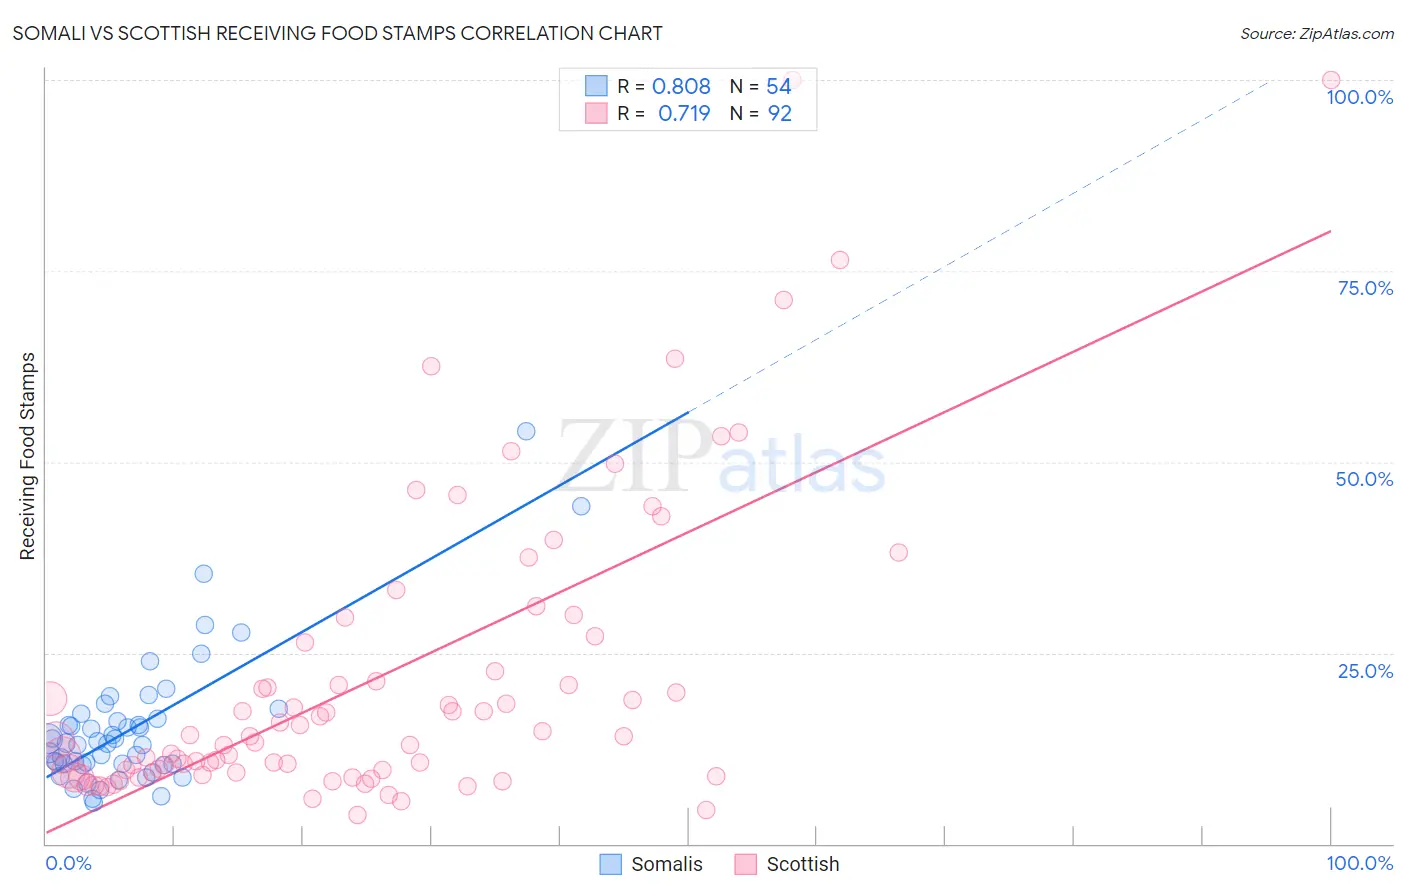
Somali vs Scottish Receiving Food Stamps Correlation Chart

The statistical analysis conducted on geographies consisting of 99,256,962 people shows a very strong positive correlation between the proportion of Somalis and percentage of population receiving government assistance and/or food stamps in the United States with a correlation coefficient (R) of 0.808 and weighted average of 13.7%. Similarly, the statistical analysis conducted on geographies consisting of 563,544,150 people shows a strong positive correlation between the proportion of Scottish and percentage of population receiving government assistance and/or food stamps in the United States with a correlation coefficient (R) of 0.719 and weighted average of 9.9%, a difference of 38.3%.
Somali vs Scottish Receiving Food Stamps

Receiving Food Stamps Correlation Summary

MeasurementSomaliScottish
Minimum5.4%3.7%
Maximum54.0%100.0%
Range48.6%96.3%
Mean15.2%21.7%
Median13.1%13.8%
Interquartile 25% (IQ1)10.4%9.4%
Interquartile 75% (IQ3)16.3%24.5%
Interquartile Range (IQR)5.9%15.1%
Standard Deviation (Sample)9.0%19.9%
Standard Deviation (Population)8.9%19.8%

Similar Demographics by Receiving Food Stamps

Demographics Similar to Somalis by Receiving Food Stamps

In terms of receiving food stamps, the demographic groups most similar to Somalis are Cajun (13.7%, a difference of 0.16%), Immigrants from Panama (13.6%, a difference of 0.19%), Immigrants from Somalia (13.7%, a difference of 0.20%), Choctaw (13.6%, a difference of 0.38%), and Cree (13.7%, a difference of 0.44%).
DemographicsRating | RankReceiving Food Stamps
Crow
1.6
/100
|
#236
Tragic
13.4%
Immigrants | El Salvador
1.5
/100
|
#237
Tragic
13.5%
French American Indians
1.4
/100
|
#238
Tragic
13.5%
Immigrants | Micronesia
1.3
/100
|
#239
Tragic
13.5%
Iroquois
1.2
/100
|
#240
Tragic
13.5%
Choctaw
1.0
/100
|
#241
Tragic
13.6%
Immigrants | Panama
1.0
/100
|
#242
Tragic
13.6%
Somalis
0.9
/100
|
#243
Tragic
13.7%
Cajuns
0.9
/100
|
#244
Tragic
13.7%
Immigrants | Somalia
0.9
/100
|
#245
Tragic
13.7%
Cree
0.8
/100
|
#246
Tragic
13.7%
Mexican American Indians
0.7
/100
|
#247
Tragic
13.8%
Immigrants | Laos
0.7
/100
|
#248
Tragic
13.8%
Indonesians
0.6
/100
|
#249
Tragic
13.9%
Immigrants | Cambodia
0.5
/100
|
#250
Tragic
13.9%

Demographics Similar to Scottish by Receiving Food Stamps

In terms of receiving food stamps, the demographic groups most similar to Scottish are Immigrants from Serbia (9.9%, a difference of 0.13%), Italian (9.9%, a difference of 0.18%), Immigrants from Asia (9.9%, a difference of 0.24%), Macedonian (9.9%, a difference of 0.30%), and Northern European (9.8%, a difference of 0.39%).
DemographicsRating | RankReceiving Food Stamps
Immigrants | North America
99.2
/100
|
#64
Exceptional
9.8%
Immigrants | Turkey
99.1
/100
|
#65
Exceptional
9.8%
Slovenes
99.1
/100
|
#66
Exceptional
9.8%
Immigrants | Indonesia
99.0
/100
|
#67
Exceptional
9.8%
Northern Europeans
99.0
/100
|
#68
Exceptional
9.8%
Italians
99.0
/100
|
#69
Exceptional
9.9%
Immigrants | Serbia
99.0
/100
|
#70
Exceptional
9.9%
Scottish
98.9
/100
|
#71
Exceptional
9.9%
Immigrants | Asia
98.9
/100
|
#72
Exceptional
9.9%
Macedonians
98.9
/100
|
#73
Exceptional
9.9%
New Zealanders
98.8
/100
|
#74
Exceptional
9.9%
Immigrants | Zimbabwe
98.7
/100
|
#75
Exceptional
9.9%
Immigrants | Croatia
98.7
/100
|
#76
Exceptional
10.0%
Immigrants | North Macedonia
98.7
/100
|
#77
Exceptional
10.0%
South Africans
98.7
/100
|
#78
Exceptional
10.0%