Somali vs Immigrants from Costa Rica Receiving Food Stamps
COMPARE
Somali
Immigrants from Costa Rica
Receiving Food Stamps
Receiving Food Stamps Comparison
Somalis
Immigrants from Costa Rica
13.7%
RECEIVING FOOD STAMPS
0.9/ 100
METRIC RATING
243rd/ 347
METRIC RANK
12.2%
RECEIVING FOOD STAMPS
25.4/ 100
METRIC RATING
198th/ 347
METRIC RANK
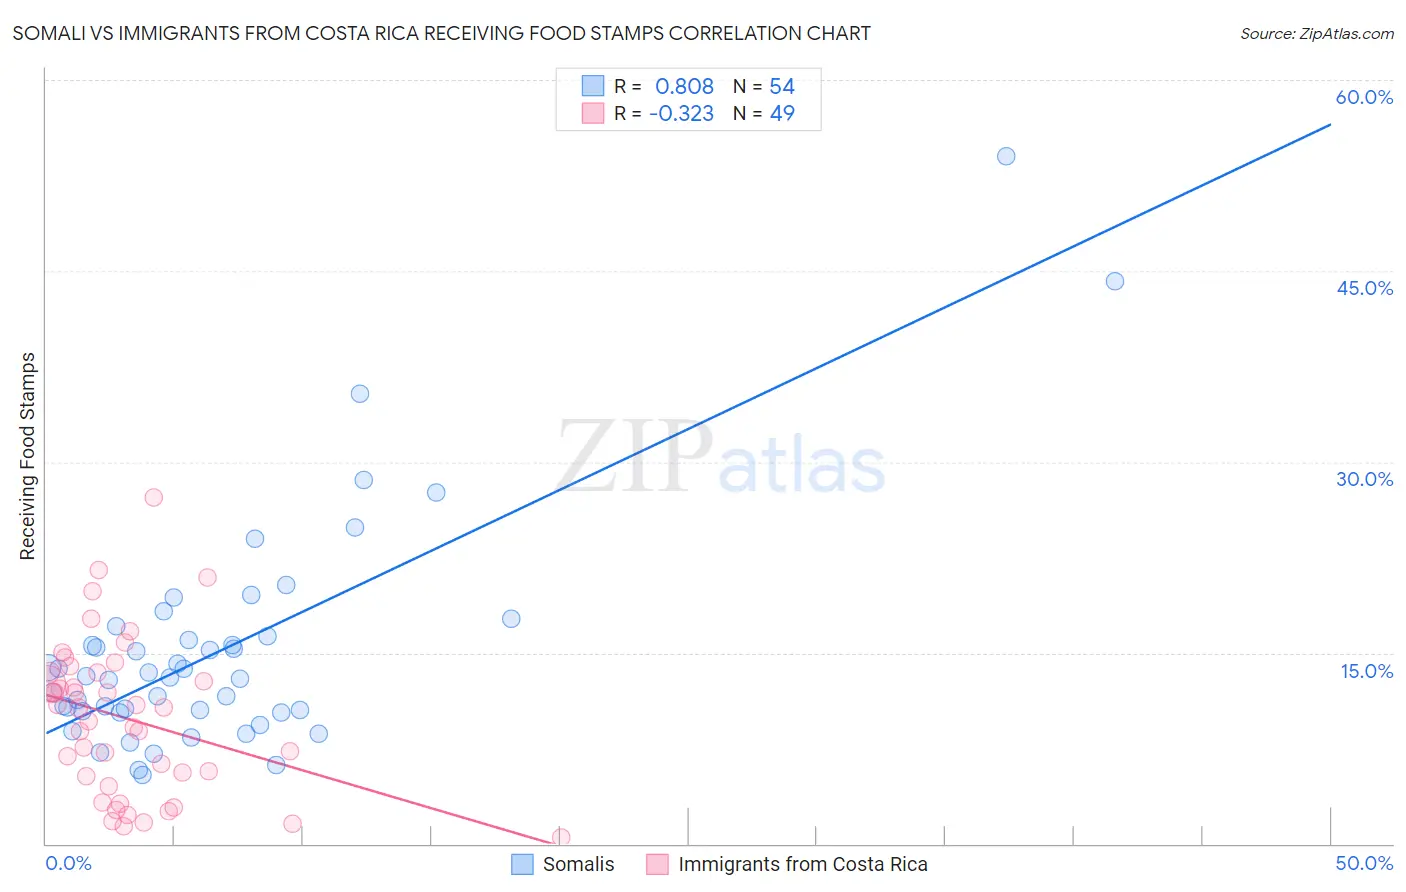
Somali vs Immigrants from Costa Rica Receiving Food Stamps Correlation Chart
The statistical analysis conducted on geographies consisting of 99,256,962 people shows a very strong positive correlation between the proportion of Somalis and percentage of population receiving government assistance and/or food stamps in the United States with a correlation coefficient (R) of 0.808 and weighted average of 13.7%. Similarly, the statistical analysis conducted on geographies consisting of 204,093,870 people shows a mild negative correlation between the proportion of Immigrants from Costa Rica and percentage of population receiving government assistance and/or food stamps in the United States with a correlation coefficient (R) of -0.323 and weighted average of 12.2%, a difference of 12.1%.
Receiving Food Stamps Correlation Summary
| Measurement | Somali | Immigrants from Costa Rica |
| Minimum | 5.4% | 0.50% |
| Maximum | 54.0% | 27.2% |
| Range | 48.6% | 26.7% |
| Mean | 15.2% | 9.8% |
| Median | 13.1% | 10.7% |
| Interquartile 25% (IQ1) | 10.4% | 4.9% |
| Interquartile 75% (IQ3) | 16.3% | 13.5% |
| Interquartile Range (IQR) | 5.9% | 8.6% |
| Standard Deviation (Sample) | 9.0% | 6.0% |
| Standard Deviation (Population) | 8.9% | 6.0% |
Similar Demographics by Receiving Food Stamps
Demographics Similar to Somalis by Receiving Food Stamps
In terms of receiving food stamps, the demographic groups most similar to Somalis are Cajun (13.7%, a difference of 0.16%), Immigrants from Panama (13.6%, a difference of 0.19%), Immigrants from Somalia (13.7%, a difference of 0.20%), Choctaw (13.6%, a difference of 0.38%), and Cree (13.7%, a difference of 0.44%).
| Demographics | Rating | Rank | Receiving Food Stamps |
| Crow | 1.6 /100 | #236 | Tragic 13.4% |
| Immigrants | El Salvador | 1.5 /100 | #237 | Tragic 13.5% |
| French American Indians | 1.4 /100 | #238 | Tragic 13.5% |
| Immigrants | Micronesia | 1.3 /100 | #239 | Tragic 13.5% |
| Iroquois | 1.2 /100 | #240 | Tragic 13.5% |
| Choctaw | 1.0 /100 | #241 | Tragic 13.6% |
| Immigrants | Panama | 1.0 /100 | #242 | Tragic 13.6% |
| Somalis | 0.9 /100 | #243 | Tragic 13.7% |
| Cajuns | 0.9 /100 | #244 | Tragic 13.7% |
| Immigrants | Somalia | 0.9 /100 | #245 | Tragic 13.7% |
| Cree | 0.8 /100 | #246 | Tragic 13.7% |
| Mexican American Indians | 0.7 /100 | #247 | Tragic 13.8% |
| Immigrants | Laos | 0.7 /100 | #248 | Tragic 13.8% |
| Indonesians | 0.6 /100 | #249 | Tragic 13.9% |
| Immigrants | Cambodia | 0.5 /100 | #250 | Tragic 13.9% |
Demographics Similar to Immigrants from Costa Rica by Receiving Food Stamps
In terms of receiving food stamps, the demographic groups most similar to Immigrants from Costa Rica are Portuguese (12.2%, a difference of 0.050%), Delaware (12.2%, a difference of 0.13%), Iraqi (12.2%, a difference of 0.21%), American (12.2%, a difference of 0.24%), and Immigrants from Sudan (12.1%, a difference of 0.30%).
| Demographics | Rating | Rank | Receiving Food Stamps |
| Venezuelans | 32.1 /100 | #191 | Fair 12.0% |
| Samoans | 31.0 /100 | #192 | Fair 12.1% |
| Immigrants | Fiji | 27.8 /100 | #193 | Fair 12.1% |
| Immigrants | Sudan | 27.1 /100 | #194 | Fair 12.1% |
| Americans | 26.7 /100 | #195 | Fair 12.2% |
| Iraqis | 26.6 /100 | #196 | Fair 12.2% |
| Delaware | 26.1 /100 | #197 | Fair 12.2% |
| Immigrants | Costa Rica | 25.4 /100 | #198 | Fair 12.2% |
| Portuguese | 25.1 /100 | #199 | Fair 12.2% |
| Sierra Leoneans | 23.6 /100 | #200 | Fair 12.2% |
| Ugandans | 22.5 /100 | #201 | Fair 12.2% |
| Immigrants | Venezuela | 20.1 /100 | #202 | Fair 12.3% |
| Shoshone | 17.7 /100 | #203 | Poor 12.4% |
| Immigrants | Nonimmigrants | 17.6 /100 | #204 | Poor 12.4% |
| Aleuts | 17.3 /100 | #205 | Poor 12.4% |