Fishkill, NY
Fishkill Map
Fishkill Overview
2,177
TOTAL POPULATION
1,051
MALE POPULATION
1,126
FEMALE POPULATION
93.34
MALES / 100 FEMALES
107.14
FEMALES / 100 MALES
47.1
MEDIAN AGE
2.6
AVG FAMILY SIZE
1.9
AVG HOUSEHOLD SIZE
$53,415
PER CAPITA INCOME
$105,078
AVG FAMILY INCOME
$94,205
AVG HOUSEHOLD INCOME
12.2%
WAGE / INCOME GAP [ % ]
87.8¢/ $1
WAGE / INCOME GAP [ $ ]
0.36
INEQUALITY / GINI INDEX
1,270
LABOR FORCE [ PEOPLE ]
65.8%
PERCENT IN LABOR FORCE
6.7%
UNEMPLOYMENT RATE
Fishkill Zip Codes
Fishkill Area Codes
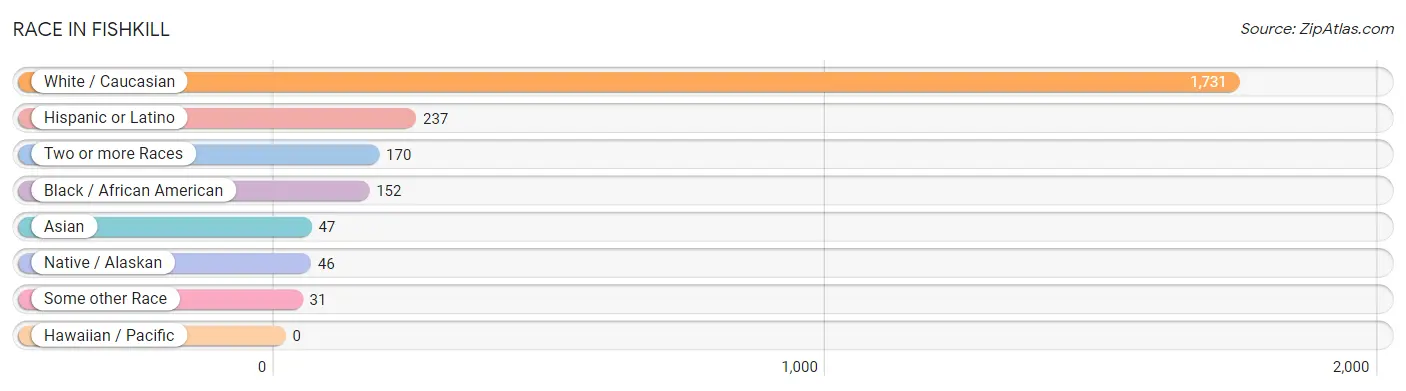
Race in Fishkill
The most populous races in Fishkill are White / Caucasian (1,731 | 79.5%), Hispanic or Latino (237 | 10.9%), and Two or more Races (170 | 7.8%).
| Race | # Population | % Population |
| Asian | 47 | 2.2% |
| Black / African American | 152 | 7.0% |
| Hawaiian / Pacific | 0 | 0.0% |
| Hispanic or Latino | 237 | 10.9% |
| Native / Alaskan | 46 | 2.1% |
| White / Caucasian | 1,731 | 79.5% |
| Two or more Races | 170 | 7.8% |
| Some other Race | 31 | 1.4% |
| Total | 2,177 | 100.0% |
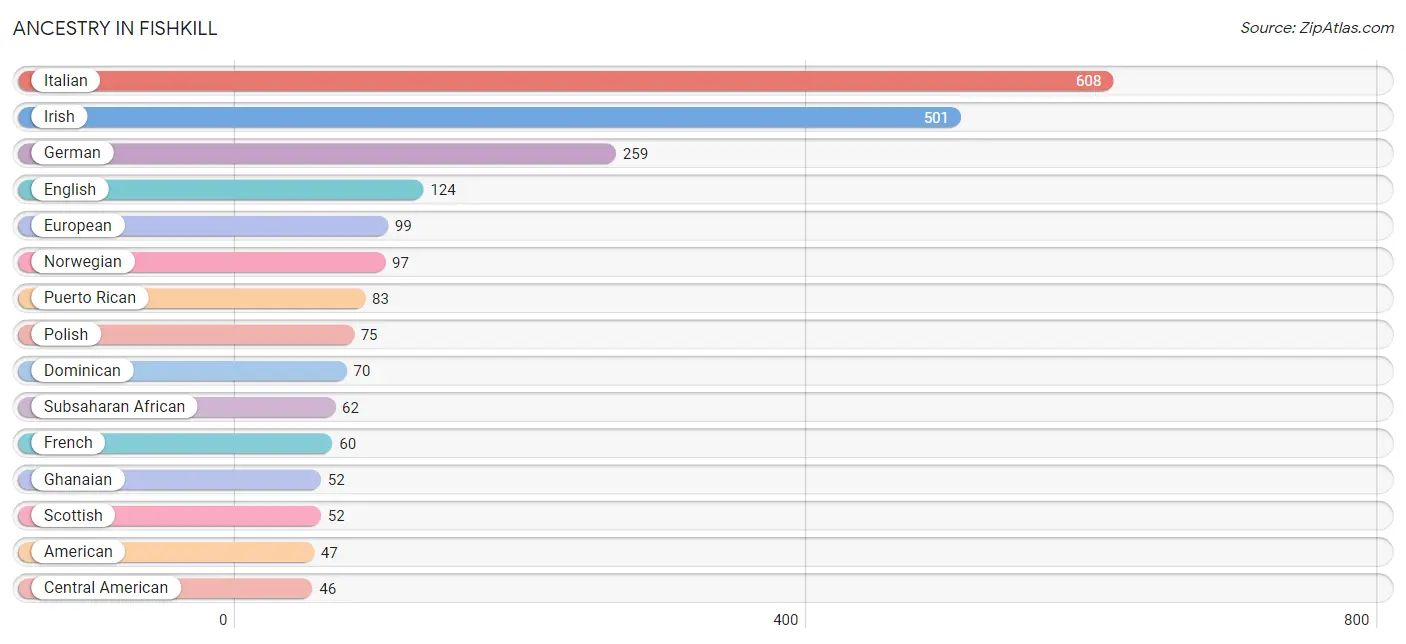
Ancestry in Fishkill
The most populous ancestries reported in Fishkill are Italian (608 | 27.9%), Irish (501 | 23.0%), German (259 | 11.9%), English (124 | 5.7%), and European (99 | 4.5%), together accounting for 73.1% of all Fishkill residents.
| Ancestry | # Population | % Population |
| American | 47 | 2.2% |
| Armenian | 23 | 1.1% |
| Austrian | 5 | 0.2% |
| Barbadian | 13 | 0.6% |
| British | 8 | 0.4% |
| Central American | 46 | 2.1% |
| Central American Indian | 46 | 2.1% |
| Cherokee | 11 | 0.5% |
| Colombian | 16 | 0.7% |
| Dominican | 70 | 3.2% |
| Dutch | 34 | 1.6% |
| Eastern European | 12 | 0.5% |
| English | 124 | 5.7% |
| European | 99 | 4.5% |
| French | 60 | 2.8% |
| French Canadian | 7 | 0.3% |
| German | 259 | 11.9% |
| Ghanaian | 52 | 2.4% |
| Greek | 6 | 0.3% |
| Guatemalan | 46 | 2.1% |
| Haitian | 10 | 0.5% |
| Hungarian | 20 | 0.9% |
| Indian (Asian) | 14 | 0.6% |
| Irish | 501 | 23.0% |
| Italian | 608 | 27.9% |
| Jamaican | 6 | 0.3% |
| Japanese | 16 | 0.7% |
| Mexican | 22 | 1.0% |
| Norwegian | 97 | 4.5% |
| Polish | 75 | 3.5% |
| Puerto Rican | 83 | 3.8% |
| Russian | 26 | 1.2% |
| Scandinavian | 14 | 0.6% |
| Scotch-Irish | 28 | 1.3% |
| Scottish | 52 | 2.4% |
| South American | 16 | 0.7% |
| Subsaharan African | 62 | 2.9% |
| Swiss | 10 | 0.5% |
| Thai | 25 | 1.1% |
| Welsh | 25 | 1.1% | View All 40 Rows |
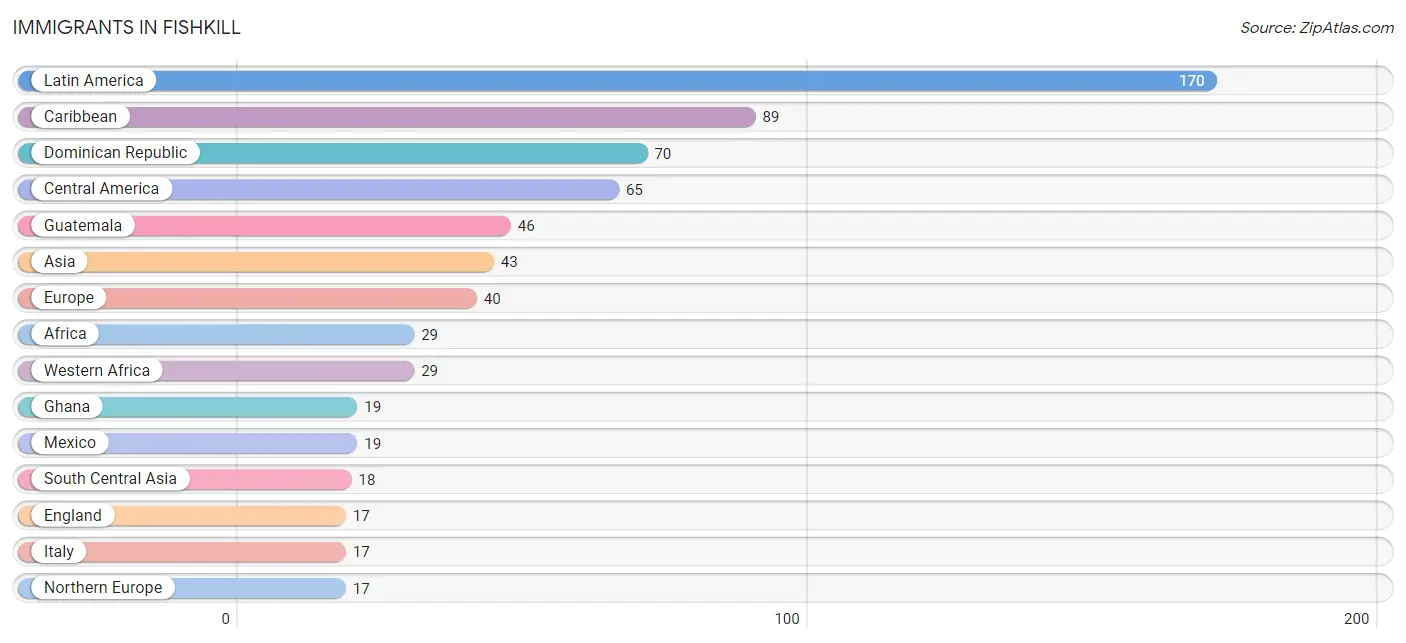
Immigrants in Fishkill
The most numerous immigrant groups reported in Fishkill came from Latin America (170 | 7.8%), Caribbean (89 | 4.1%), Dominican Republic (70 | 3.2%), Central America (65 | 3.0%), and Guatemala (46 | 2.1%), together accounting for 20.2% of all Fishkill residents.
| Immigration Origin | # Population | % Population |
| Africa | 29 | 1.3% |
| Asia | 43 | 2.0% |
| Barbados | 13 | 0.6% |
| Cambodia | 11 | 0.5% |
| Caribbean | 89 | 4.1% |
| Central America | 65 | 3.0% |
| Colombia | 16 | 0.7% |
| Dominican Republic | 70 | 3.2% |
| Eastern Asia | 14 | 0.6% |
| Eastern Europe | 6 | 0.3% |
| England | 17 | 0.8% |
| Europe | 40 | 1.8% |
| Ghana | 19 | 0.9% |
| Guatemala | 46 | 2.1% |
| Hungary | 6 | 0.3% |
| India | 11 | 0.5% |
| Iran | 7 | 0.3% |
| Italy | 17 | 0.8% |
| Jamaica | 6 | 0.3% |
| Korea | 14 | 0.6% |
| Latin America | 170 | 7.8% |
| Mexico | 19 | 0.9% |
| Northern Europe | 17 | 0.8% |
| South America | 16 | 0.7% |
| South Central Asia | 18 | 0.8% |
| South Eastern Asia | 11 | 0.5% |
| Southern Europe | 17 | 0.8% |
| Western Africa | 29 | 1.3% | View All 28 Rows |
Sex and Age in Fishkill
Sex and Age in Fishkill
The most populous age groups in Fishkill are 45 to 49 Years (139 | 13.2%) for men and 30 to 34 Years (101 | 9.0%) for women.
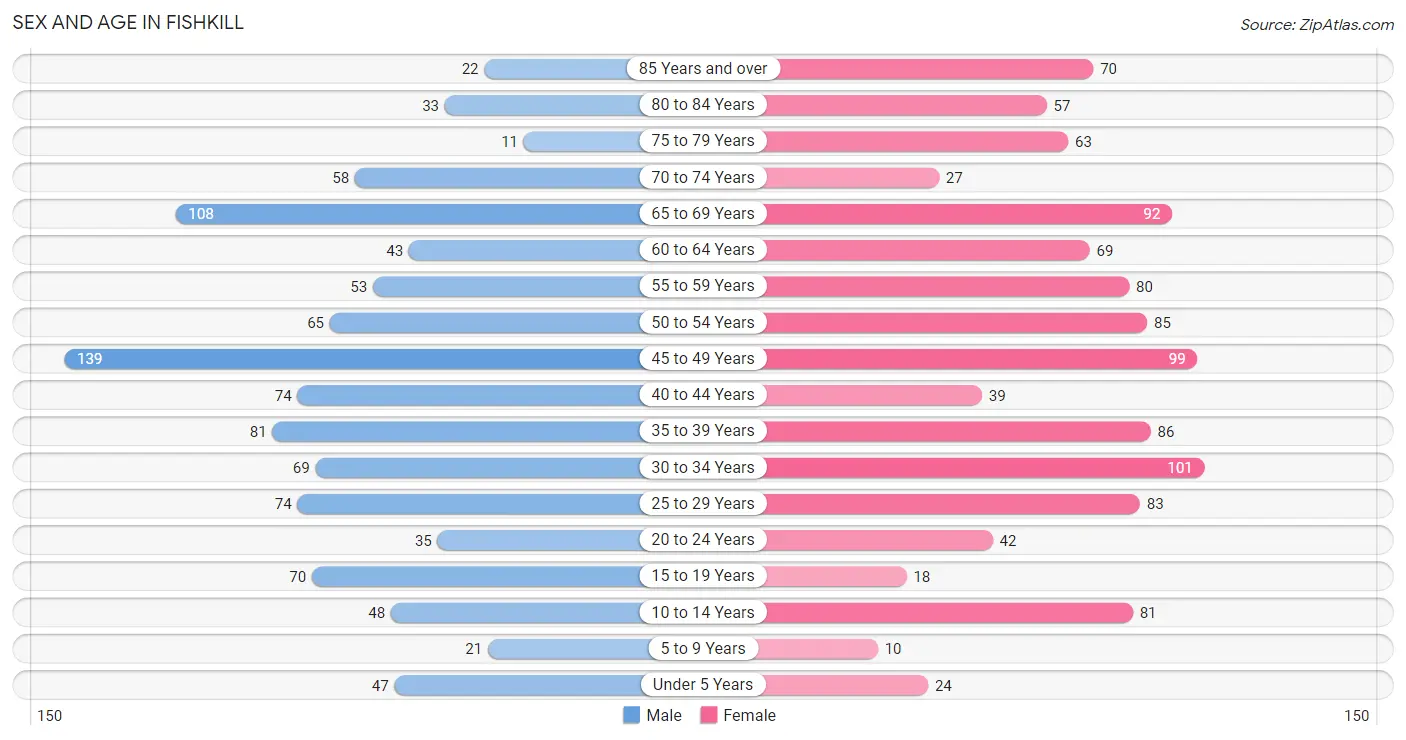
| Age Bracket | Male | Female |
| Under 5 Years | 47 (4.5%) | 24 (2.1%) |
| 5 to 9 Years | 21 (2.0%) | 10 (0.9%) |
| 10 to 14 Years | 48 (4.6%) | 81 (7.2%) |
| 15 to 19 Years | 70 (6.7%) | 18 (1.6%) |
| 20 to 24 Years | 35 (3.3%) | 42 (3.7%) |
| 25 to 29 Years | 74 (7.0%) | 83 (7.4%) |
| 30 to 34 Years | 69 (6.6%) | 101 (9.0%) |
| 35 to 39 Years | 81 (7.7%) | 86 (7.6%) |
| 40 to 44 Years | 74 (7.0%) | 39 (3.5%) |
| 45 to 49 Years | 139 (13.2%) | 99 (8.8%) |
| 50 to 54 Years | 65 (6.2%) | 85 (7.5%) |
| 55 to 59 Years | 53 (5.0%) | 80 (7.1%) |
| 60 to 64 Years | 43 (4.1%) | 69 (6.1%) |
| 65 to 69 Years | 108 (10.3%) | 92 (8.2%) |
| 70 to 74 Years | 58 (5.5%) | 27 (2.4%) |
| 75 to 79 Years | 11 (1.1%) | 63 (5.6%) |
| 80 to 84 Years | 33 (3.1%) | 57 (5.1%) |
| 85 Years and over | 22 (2.1%) | 70 (6.2%) |
| Total | 1,051 (100.0%) | 1,126 (100.0%) |
Families and Households in Fishkill
Median Family Size in Fishkill
The median family size in Fishkill is 2.60 persons per family, with single female/mother families (54 | 9.7%) accounting for the largest median family size of 2.69 persons per family. On the other hand, single male/father families (46 | 8.2%) represent the smallest median family size with 1.98 persons per family.
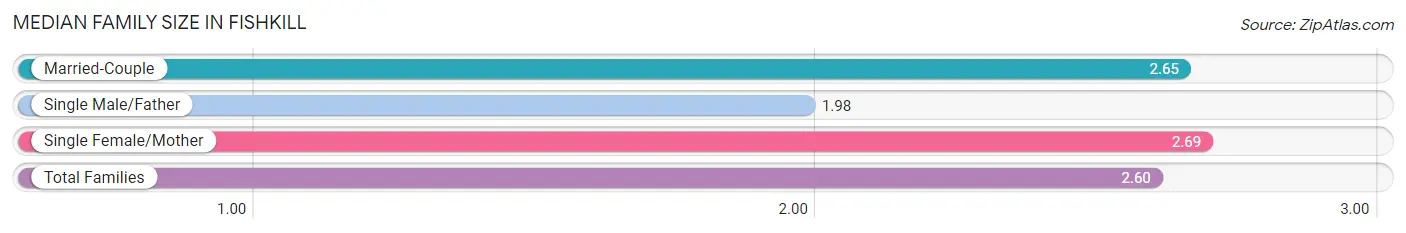
| Family Type | # Families | Family Size |
| Married-Couple | 459 (82.1%) | 2.65 |
| Single Male/Father | 46 (8.2%) | 1.98 |
| Single Female/Mother | 54 (9.7%) | 2.69 |
| Total Families | 559 (100.0%) | 2.60 |
Median Household Size in Fishkill
The median household size in Fishkill is 1.90 persons per household, with single female/mother households (54 | 4.7%) accounting for the largest median household size of 3.09 persons per household. non-family households (589 | 51.3%) represent the smallest median household size with 1.17 persons per household.
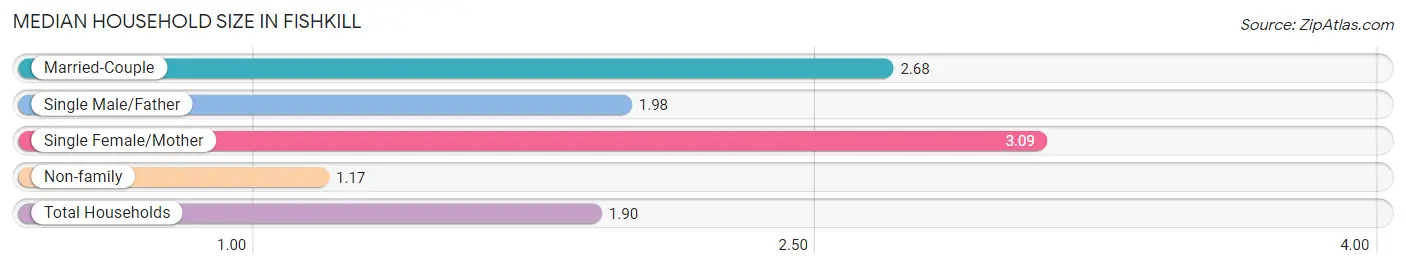
| Household Type | # Households | Household Size |
| Married-Couple | 459 (40.0%) | 2.68 |
| Single Male/Father | 46 (4.0%) | 1.98 |
| Single Female/Mother | 54 (4.7%) | 3.09 |
| Non-family | 589 (51.3%) | 1.17 |
| Total Households | 1,148 (100.0%) | 1.90 |
Household Size by Marriage Status in Fishkill
Out of a total of 1,148 households in Fishkill, 559 (48.7%) are family households, while 589 (51.3%) are nonfamily households. The most numerous type of family households are 2-person households, comprising 286, and the most common type of nonfamily households are 1-person households, comprising 476.
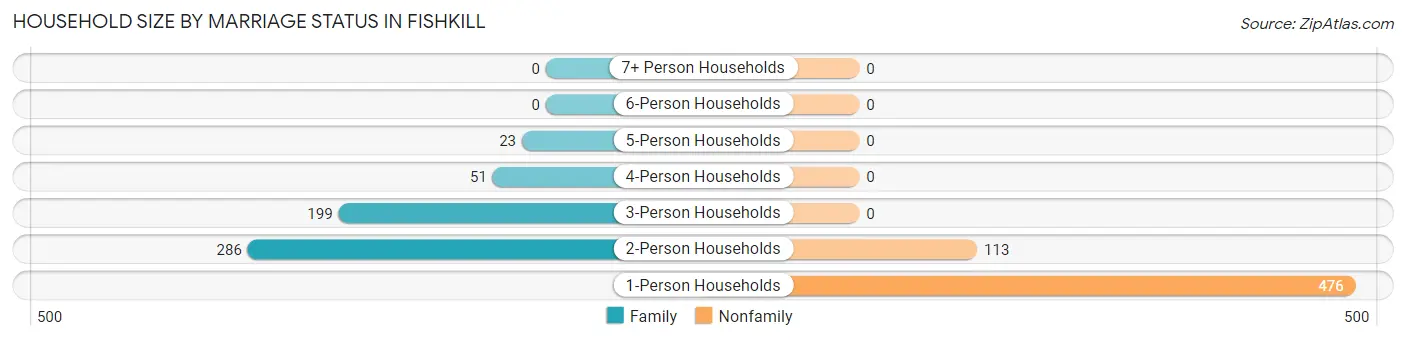
| Household Size | Family Households | Nonfamily Households |
| 1-Person Households | - | 476 (41.5%) |
| 2-Person Households | 286 (24.9%) | 113 (9.8%) |
| 3-Person Households | 199 (17.3%) | 0 (0.0%) |
| 4-Person Households | 51 (4.4%) | 0 (0.0%) |
| 5-Person Households | 23 (2.0%) | 0 (0.0%) |
| 6-Person Households | 0 (0.0%) | 0 (0.0%) |
| 7+ Person Households | 0 (0.0%) | 0 (0.0%) |
| Total | 559 (48.7%) | 589 (51.3%) |
Female Fertility in Fishkill
Fertility by Age in Fishkill
Average fertility rate in Fishkill is 57.0 births per 1,000 women. Women in the age bracket of 20 to 34 years have the highest fertility rate with 75.0 births per 1,000 women. Women in the age bracket of 20 to 34 years acount for 63.0% of all women with births.
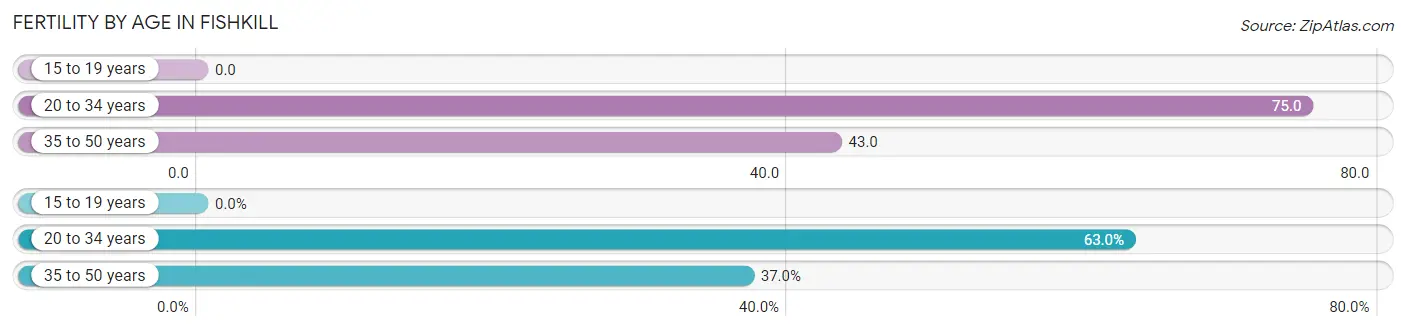
| Age Bracket | Women with Births | Births / 1,000 Women |
| 15 to 19 years | 0 (0.0%) | 0.0 |
| 20 to 34 years | 17 (63.0%) | 75.0 |
| 35 to 50 years | 10 (37.0%) | 43.0 |
| Total | 27 (100.0%) | 57.0 |
Fertility by Age by Marriage Status in Fishkill
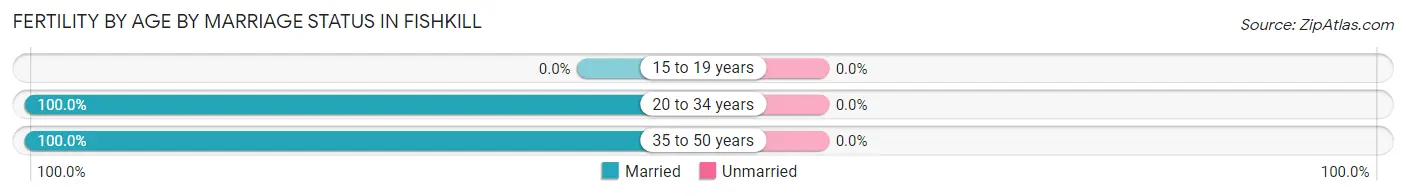
| Age Bracket | Married | Unmarried |
| 15 to 19 years | 0 (0.0%) | 0 (0.0%) |
| 20 to 34 years | 17 (100.0%) | 0 (0.0%) |
| 35 to 50 years | 10 (100.0%) | 0 (0.0%) |
| Total | 27 (100.0%) | 0 (0.0%) |
Fertility by Education in Fishkill
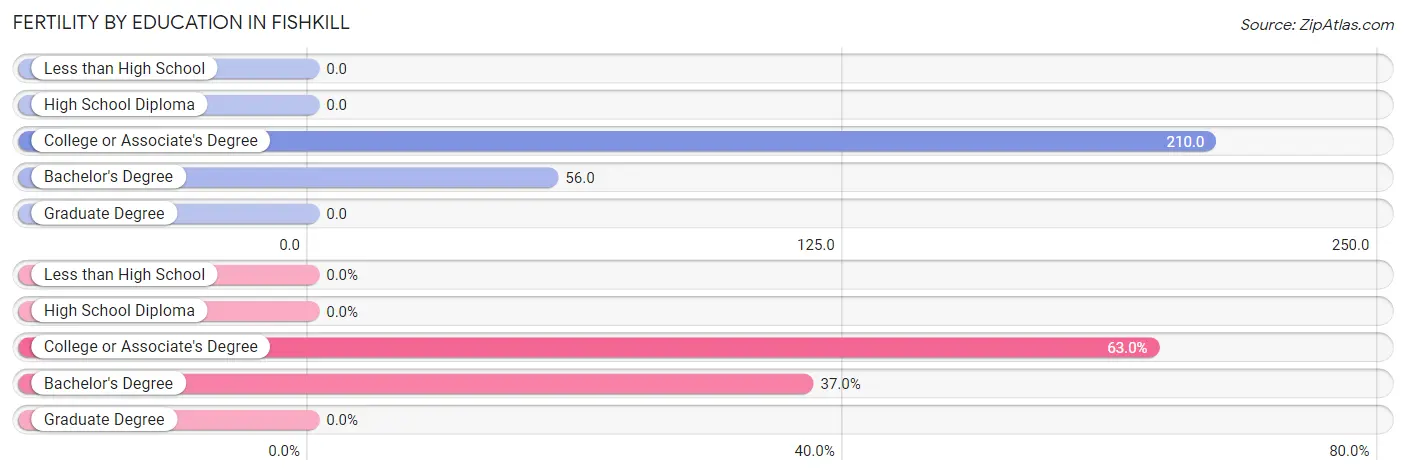
| Educational Attainment | Women with Births | Births / 1,000 Women |
| Less than High School | 0 (0.0%) | 0.0 |
| High School Diploma | 0 (0.0%) | 0.0 |
| College or Associate's Degree | 17 (63.0%) | 210.0 |
| Bachelor's Degree | 10 (37.0%) | 56.0 |
| Graduate Degree | 0 (0.0%) | 0.0 |
| Total | 27 (100.0%) | 57.0 |
Fertility by Education by Marriage Status in Fishkill
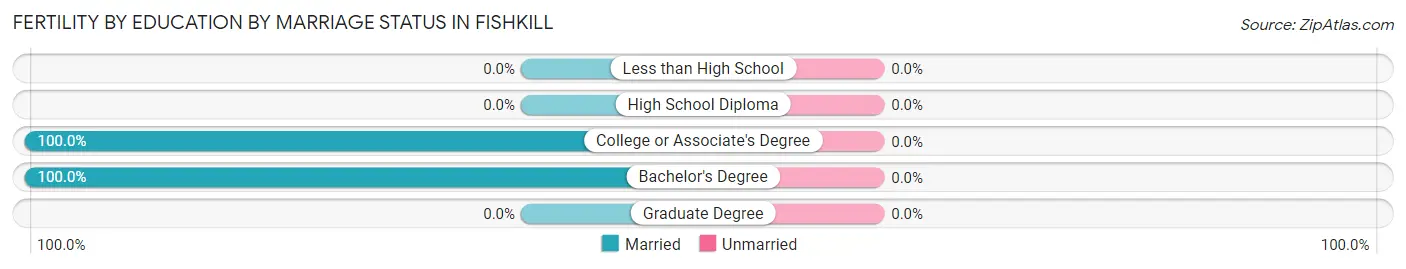
| Educational Attainment | Married | Unmarried |
| Less than High School | 0 (0.0%) | 0 (0.0%) |
| High School Diploma | 0 (0.0%) | 0 (0.0%) |
| College or Associate's Degree | 17 (100.0%) | 0 (0.0%) |
| Bachelor's Degree | 10 (100.0%) | 0 (0.0%) |
| Graduate Degree | 0 (0.0%) | 0 (0.0%) |
| Total | 27 (100.0%) | 0 (0.0%) |
Income in Fishkill
Income Overview in Fishkill
Per Capita Income in Fishkill is $53,415, while median incomes of families and households are $105,078 and $94,205 respectively.
| Characteristic | Number | Measure |
| Per Capita Income | 2,177 | $53,415 |
| Median Family Income | 559 | $105,078 |
| Mean Family Income | 559 | $120,762 |
| Median Household Income | 1,148 | $94,205 |
| Mean Household Income | 1,148 | $100,609 |
| Income Deficit | 559 | $0 |
| Wage / Income Gap (%) | 2,177 | 12.21% |
| Wage / Income Gap ($) | 2,177 | 87.79¢ per $1 |
| Gini / Inequality Index | 2,177 | 0.36 |
Earnings by Sex in Fishkill
Average Earnings in Fishkill are $62,813, $69,083 for men and $60,650 for women, a difference of 12.2%.
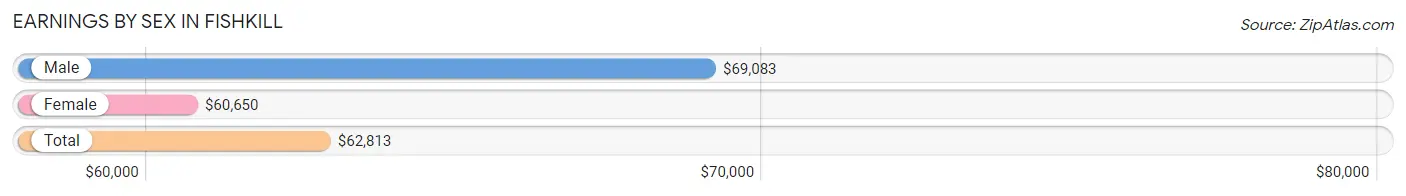
| Sex | Number | Average Earnings |
| Male | 683 (52.5%) | $69,083 |
| Female | 619 (47.5%) | $60,650 |
| Total | 1,302 (100.0%) | $62,813 |
Earnings by Sex by Income Bracket in Fishkill
The most common earnings brackets in Fishkill are $75,000 to $99,999 for men (189 | 27.7%) and $100,000+ for women (151 | 24.4%).
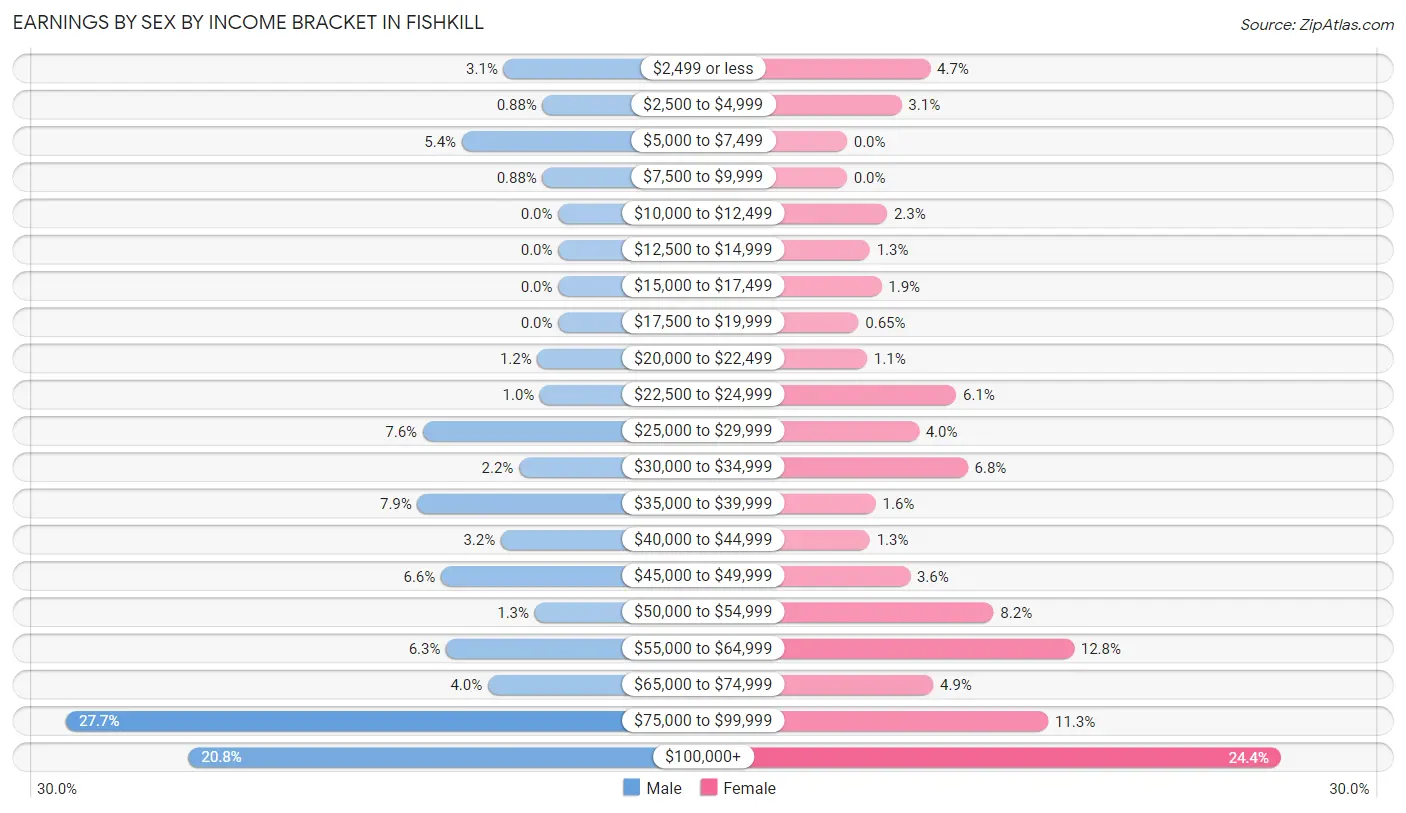
| Income | Male | Female |
| $2,499 or less | 21 (3.1%) | 29 (4.7%) |
| $2,500 to $4,999 | 6 (0.9%) | 19 (3.1%) |
| $5,000 to $7,499 | 37 (5.4%) | 0 (0.0%) |
| $7,500 to $9,999 | 6 (0.9%) | 0 (0.0%) |
| $10,000 to $12,499 | 0 (0.0%) | 14 (2.3%) |
| $12,500 to $14,999 | 0 (0.0%) | 8 (1.3%) |
| $15,000 to $17,499 | 0 (0.0%) | 12 (1.9%) |
| $17,500 to $19,999 | 0 (0.0%) | 4 (0.6%) |
| $20,000 to $22,499 | 8 (1.2%) | 7 (1.1%) |
| $22,500 to $24,999 | 7 (1.0%) | 38 (6.1%) |
| $25,000 to $29,999 | 52 (7.6%) | 25 (4.0%) |
| $30,000 to $34,999 | 15 (2.2%) | 42 (6.8%) |
| $35,000 to $39,999 | 54 (7.9%) | 10 (1.6%) |
| $40,000 to $44,999 | 22 (3.2%) | 8 (1.3%) |
| $45,000 to $49,999 | 45 (6.6%) | 22 (3.5%) |
| $50,000 to $54,999 | 9 (1.3%) | 51 (8.2%) |
| $55,000 to $64,999 | 43 (6.3%) | 79 (12.8%) |
| $65,000 to $74,999 | 27 (4.0%) | 30 (4.9%) |
| $75,000 to $99,999 | 189 (27.7%) | 70 (11.3%) |
| $100,000+ | 142 (20.8%) | 151 (24.4%) |
| Total | 683 (100.0%) | 619 (100.0%) |
Earnings by Sex by Educational Attainment in Fishkill
Average earnings in Fishkill are $76,042 for men and $62,875 for women, a difference of 17.3%. Men with an educational attainment of graduate degree enjoy the highest average annual earnings of $95,100, while those with less than high school education earn the least with $41,023. Women with an educational attainment of graduate degree earn the most with the average annual earnings of $85,625, while those with high school diploma education have the smallest earnings of $50,917.
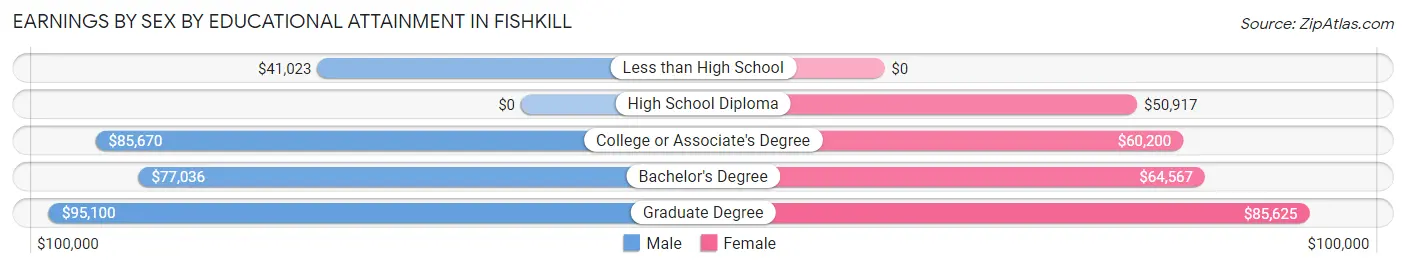
| Educational Attainment | Male Income | Female Income |
| Less than High School | $41,023 | $0 |
| High School Diploma | - | - |
| College or Associate's Degree | $85,670 | $60,200 |
| Bachelor's Degree | $77,036 | $64,567 |
| Graduate Degree | $95,100 | $85,625 |
| Total | $76,042 | $62,875 |
Family Income in Fishkill
Family Income Brackets in Fishkill
According to the Fishkill family income data, there are 131 families falling into the $100,000 to $149,999 income range, which is the most common income bracket and makes up 23.4% of all families.
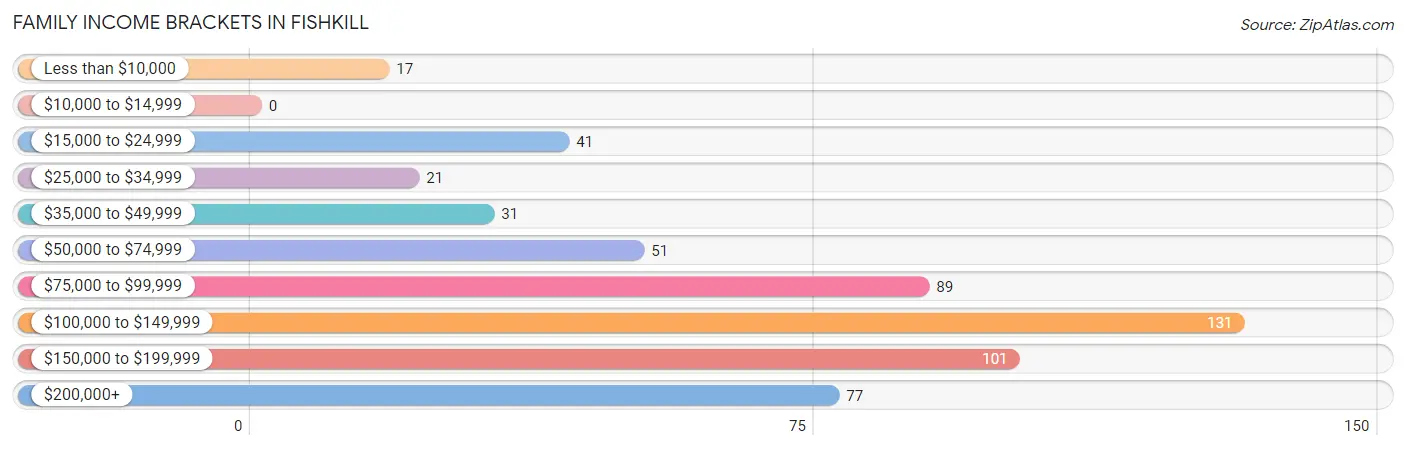
| Income Bracket | # Families | % Families |
| Less than $10,000 | 17 | 3.0% |
| $10,000 to $14,999 | 0 | 0.0% |
| $15,000 to $24,999 | 41 | 7.3% |
| $25,000 to $34,999 | 21 | 3.8% |
| $35,000 to $49,999 | 31 | 5.5% |
| $50,000 to $74,999 | 51 | 9.1% |
| $75,000 to $99,999 | 89 | 15.9% |
| $100,000 to $149,999 | 131 | 23.4% |
| $150,000 to $199,999 | 101 | 18.1% |
| $200,000+ | 77 | 13.8% |
Family Income by Famaliy Size in Fishkill
3-person families (219 | 39.2%) account for the highest median family income in Fishkill with $126,910 per family, while 2-person families (286 | 51.2%) have the highest median income of $43,344 per family member.
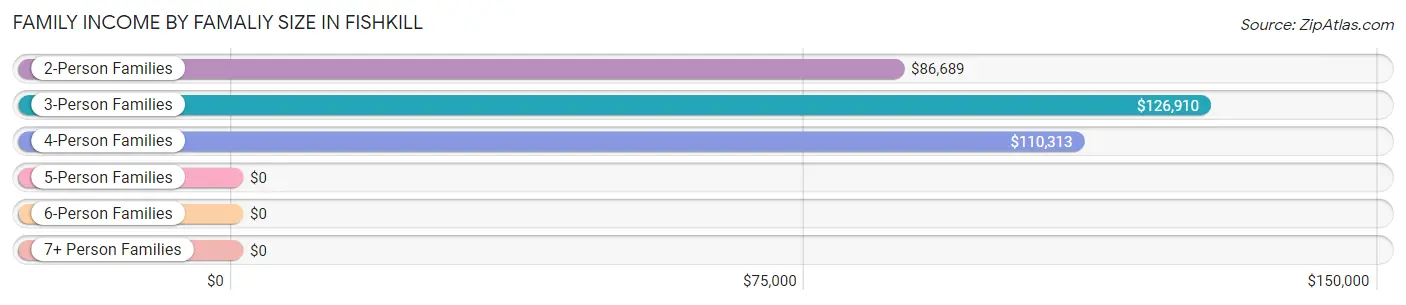
| Income Bracket | # Families | Median Income |
| 2-Person Families | 286 (51.2%) | $86,689 |
| 3-Person Families | 219 (39.2%) | $126,910 |
| 4-Person Families | 31 (5.6%) | $110,313 |
| 5-Person Families | 23 (4.1%) | $0 |
| 6-Person Families | 0 (0.0%) | $0 |
| 7+ Person Families | 0 (0.0%) | $0 |
| Total | 559 (100.0%) | $105,078 |
Family Income by Number of Earners in Fishkill
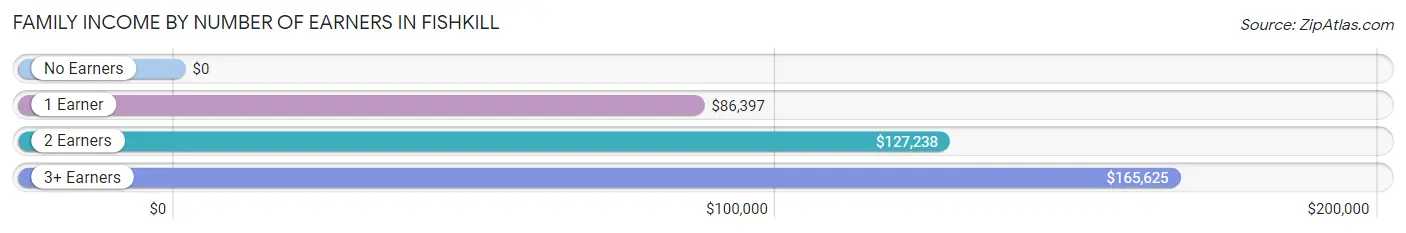
| Number of Earners | # Families | Median Income |
| No Earners | 116 (20.7%) | $0 |
| 1 Earner | 123 (22.0%) | $86,397 |
| 2 Earners | 267 (47.8%) | $127,238 |
| 3+ Earners | 53 (9.5%) | $165,625 |
| Total | 559 (100.0%) | $105,078 |
Household Income in Fishkill
Household Income Brackets in Fishkill
With 350 households falling in the category, the $100,000 to $149,999 income range is the most frequent in Fishkill, accounting for 30.5% of all households.
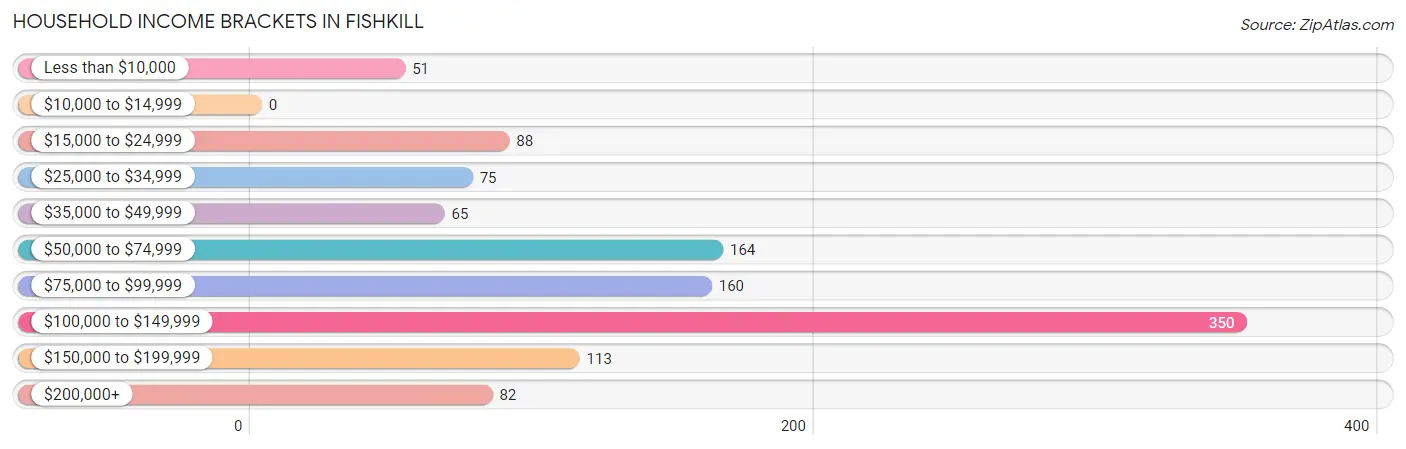
| Income Bracket | # Households | % Households |
| Less than $10,000 | 51 | 4.4% |
| $10,000 to $14,999 | 0 | 0.0% |
| $15,000 to $24,999 | 88 | 7.7% |
| $25,000 to $34,999 | 75 | 6.5% |
| $35,000 to $49,999 | 65 | 5.7% |
| $50,000 to $74,999 | 164 | 14.3% |
| $75,000 to $99,999 | 160 | 13.9% |
| $100,000 to $149,999 | 350 | 30.5% |
| $150,000 to $199,999 | 113 | 9.8% |
| $200,000+ | 82 | 7.1% |
Household Income by Householder Age in Fishkill
The median household income in Fishkill is $94,205, with the highest median household income of $126,424 found in the 45 to 64 years age bracket for the primary householder. A total of 357 households (31.1%) fall into this category. Meanwhile, the 15 to 24 years age bracket for the primary householder has the lowest median household income of $0, with 30 households (2.6%) in this group.
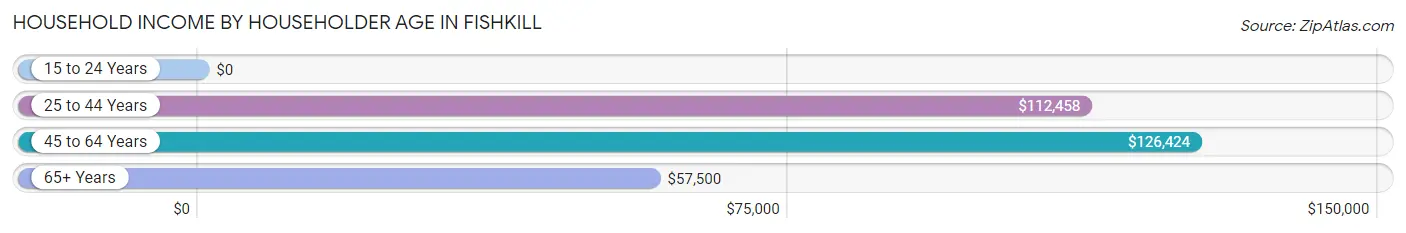
| Income Bracket | # Households | Median Income |
| 15 to 24 Years | 30 (2.6%) | $0 |
| 25 to 44 Years | 347 (30.2%) | $112,458 |
| 45 to 64 Years | 357 (31.1%) | $126,424 |
| 65+ Years | 414 (36.1%) | $57,500 |
| Total | 1,148 (100.0%) | $94,205 |
Poverty in Fishkill
Income Below Poverty by Sex and Age in Fishkill
With 3.2% poverty level for males and 7.4% for females among the residents of Fishkill, 12 to 14 year old males and 18 to 24 year old females are the most vulnerable to poverty, with 10 males (37.0%) and 12 females (28.6%) in their respective age groups living below the poverty level.
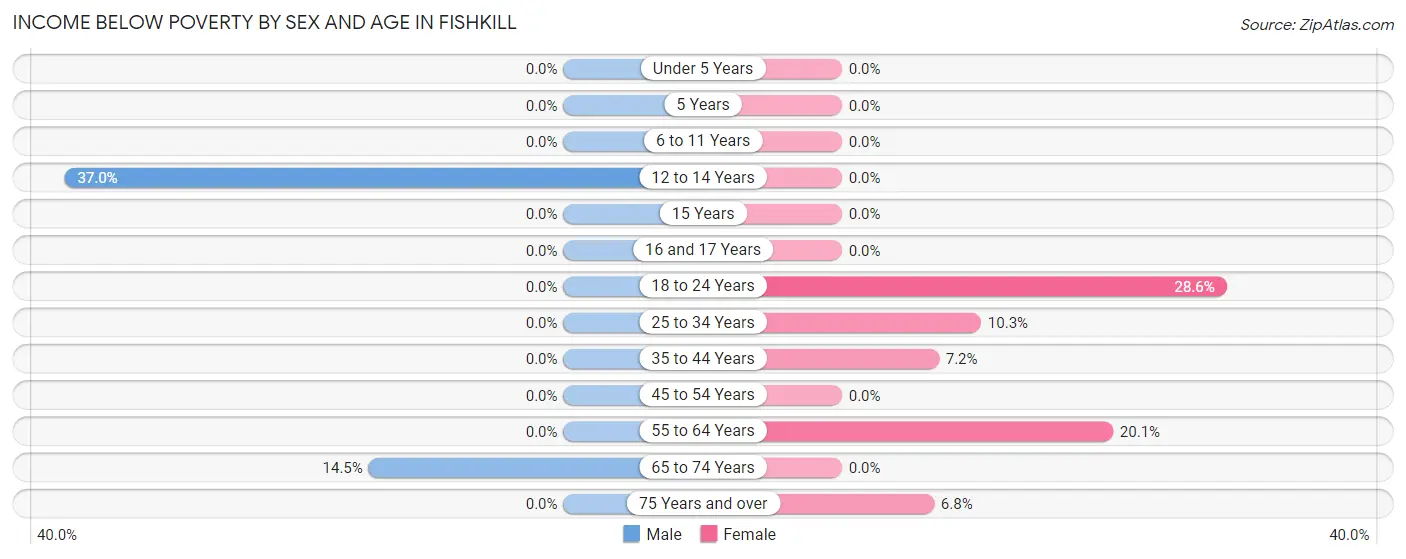
| Age Bracket | Male | Female |
| Under 5 Years | 0 (0.0%) | 0 (0.0%) |
| 5 Years | 0 (0.0%) | 0 (0.0%) |
| 6 to 11 Years | 0 (0.0%) | 0 (0.0%) |
| 12 to 14 Years | 10 (37.0%) | 0 (0.0%) |
| 15 Years | 0 (0.0%) | 0 (0.0%) |
| 16 and 17 Years | 0 (0.0%) | 0 (0.0%) |
| 18 to 24 Years | 0 (0.0%) | 12 (28.6%) |
| 25 to 34 Years | 0 (0.0%) | 19 (10.3%) |
| 35 to 44 Years | 0 (0.0%) | 9 (7.2%) |
| 45 to 54 Years | 0 (0.0%) | 0 (0.0%) |
| 55 to 64 Years | 0 (0.0%) | 30 (20.1%) |
| 65 to 74 Years | 24 (14.5%) | 0 (0.0%) |
| 75 Years and over | 0 (0.0%) | 13 (6.8%) |
| Total | 34 (3.2%) | 83 (7.4%) |
Income Above Poverty by Sex and Age in Fishkill
According to the poverty statistics in Fishkill, males aged under 5 years and females aged under 5 years are the age groups that are most secure financially, with 100.0% of males and 100.0% of females in these age groups living above the poverty line.
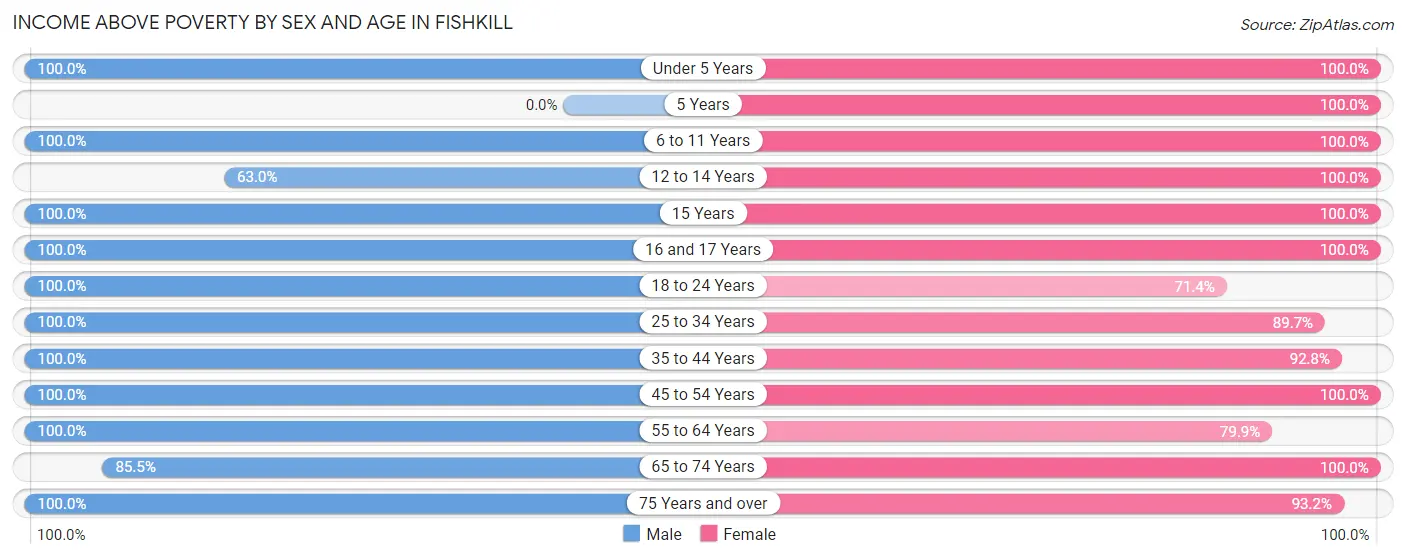
| Age Bracket | Male | Female |
| Under 5 Years | 47 (100.0%) | 24 (100.0%) |
| 5 Years | 0 (0.0%) | 3 (100.0%) |
| 6 to 11 Years | 42 (100.0%) | 42 (100.0%) |
| 12 to 14 Years | 17 (63.0%) | 46 (100.0%) |
| 15 Years | 5 (100.0%) | 11 (100.0%) |
| 16 and 17 Years | 57 (100.0%) | 7 (100.0%) |
| 18 to 24 Years | 43 (100.0%) | 30 (71.4%) |
| 25 to 34 Years | 143 (100.0%) | 165 (89.7%) |
| 35 to 44 Years | 155 (100.0%) | 116 (92.8%) |
| 45 to 54 Years | 204 (100.0%) | 184 (100.0%) |
| 55 to 64 Years | 96 (100.0%) | 119 (79.9%) |
| 65 to 74 Years | 142 (85.5%) | 119 (100.0%) |
| 75 Years and over | 66 (100.0%) | 177 (93.2%) |
| Total | 1,017 (96.8%) | 1,043 (92.6%) |
Income Below Poverty Among Married-Couple Families in Fishkill
The poverty statistics for married-couple families in Fishkill show that 3.7% or 17 of the total 459 families live below the poverty line. Families with no children have the highest poverty rate of 5.6%, comprising of 17 families. On the other hand, families with 1 or 2 children have the lowest poverty rate of 0.0%, which includes 0 families.
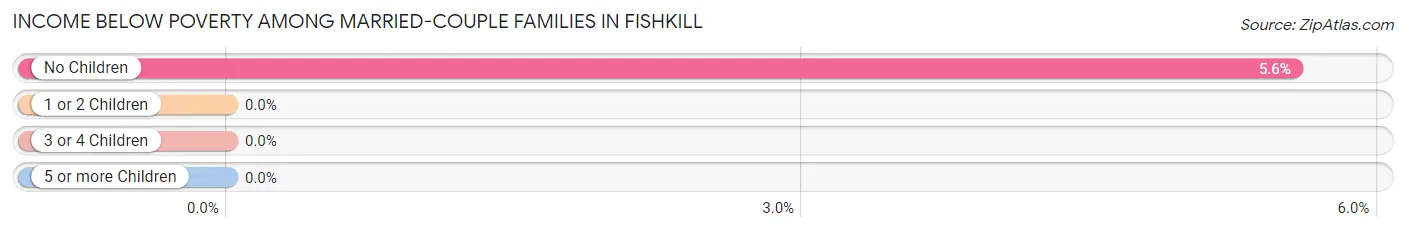
| Children | Above Poverty | Below Poverty |
| No Children | 289 (94.4%) | 17 (5.6%) |
| 1 or 2 Children | 130 (100.0%) | 0 (0.0%) |
| 3 or 4 Children | 23 (100.0%) | 0 (0.0%) |
| 5 or more Children | 0 (0.0%) | 0 (0.0%) |
| Total | 442 (96.3%) | 17 (3.7%) |
Income Below Poverty Among Single-Parent Households in Fishkill
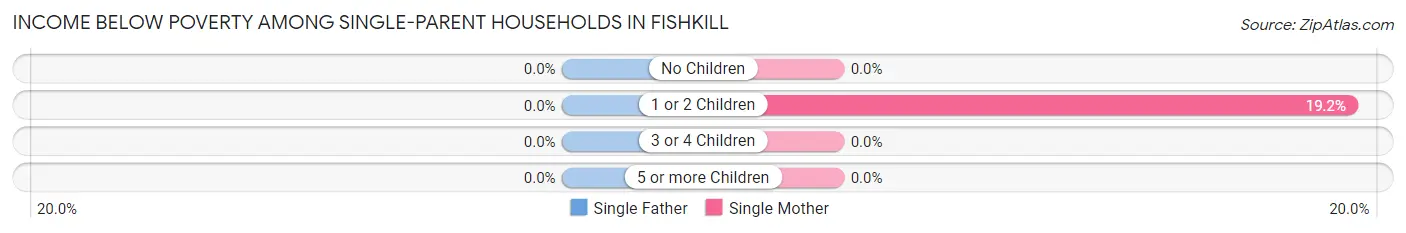
| Children | Single Father | Single Mother |
| No Children | 0 (0.0%) | 0 (0.0%) |
| 1 or 2 Children | 0 (0.0%) | 9 (19.2%) |
| 3 or 4 Children | 0 (0.0%) | 0 (0.0%) |
| 5 or more Children | 0 (0.0%) | 0 (0.0%) |
| Total | 0 (0.0%) | 9 (16.7%) |
Income Below Poverty Among Married-Couple vs Single-Parent Households in Fishkill
The poverty data for Fishkill shows that 17 of the married-couple family households (3.7%) and 9 of the single-parent households (9.0%) are living below the poverty level. Within the married-couple family households, those with no children have the highest poverty rate, with 17 households (5.6%) falling below the poverty line. Among the single-parent households, those with 1 or 2 children have the highest poverty rate, with 9 household (10.2%) living below poverty.
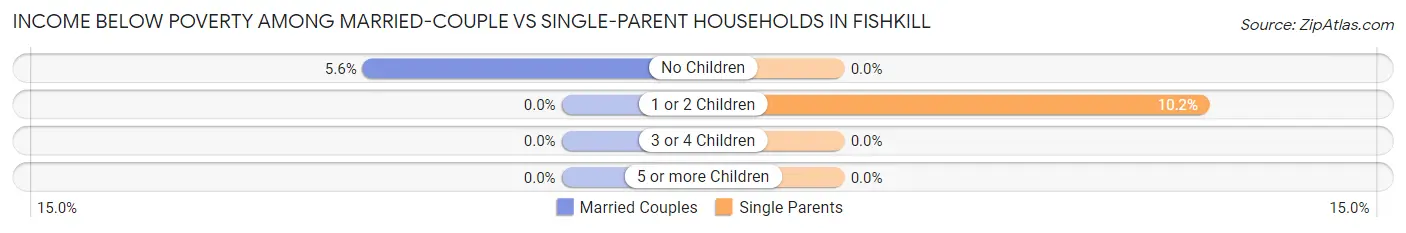
| Children | Married-Couple Families | Single-Parent Households |
| No Children | 17 (5.6%) | 0 (0.0%) |
| 1 or 2 Children | 0 (0.0%) | 9 (10.2%) |
| 3 or 4 Children | 0 (0.0%) | 0 (0.0%) |
| 5 or more Children | 0 (0.0%) | 0 (0.0%) |
| Total | 17 (3.7%) | 9 (9.0%) |
Employment Characteristics in Fishkill
Employment by Class of Employer in Fishkill
Among the 1,146 employed individuals in Fishkill, private company employees (669 | 58.4%), local government employees (180 | 15.7%), and not-for-profit organizations (121 | 10.6%) make up the most common classes of employment.
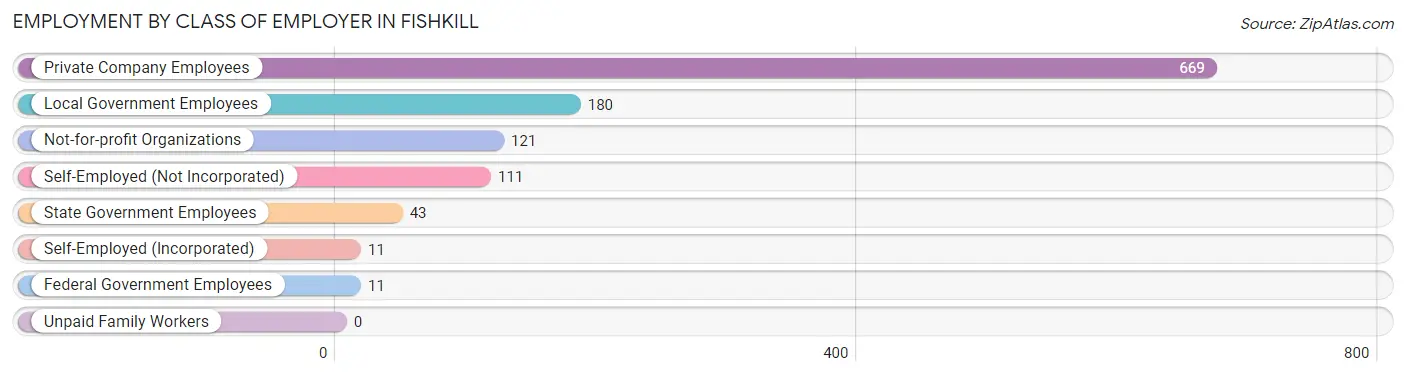
| Employer Class | # Employees | % Employees |
| Private Company Employees | 669 | 58.4% |
| Self-Employed (Incorporated) | 11 | 1.0% |
| Self-Employed (Not Incorporated) | 111 | 9.7% |
| Not-for-profit Organizations | 121 | 10.6% |
| Local Government Employees | 180 | 15.7% |
| State Government Employees | 43 | 3.7% |
| Federal Government Employees | 11 | 1.0% |
| Unpaid Family Workers | 0 | 0.0% |
| Total | 1,146 | 100.0% |
Employment Status by Age in Fishkill
According to the labor force statistics for Fishkill, out of the total population over 16 years of age (1,930), 65.8% or 1,270 individuals are in the labor force, with 6.7% or 85 of them unemployed. The age group with the highest labor force participation rate is 20 to 24 years, with 100.0% or 77 individuals in the labor force. Within the labor force, the 20 to 24 years age range has the highest percentage of unemployed individuals, with 36.4% or 28 of them being unemployed.
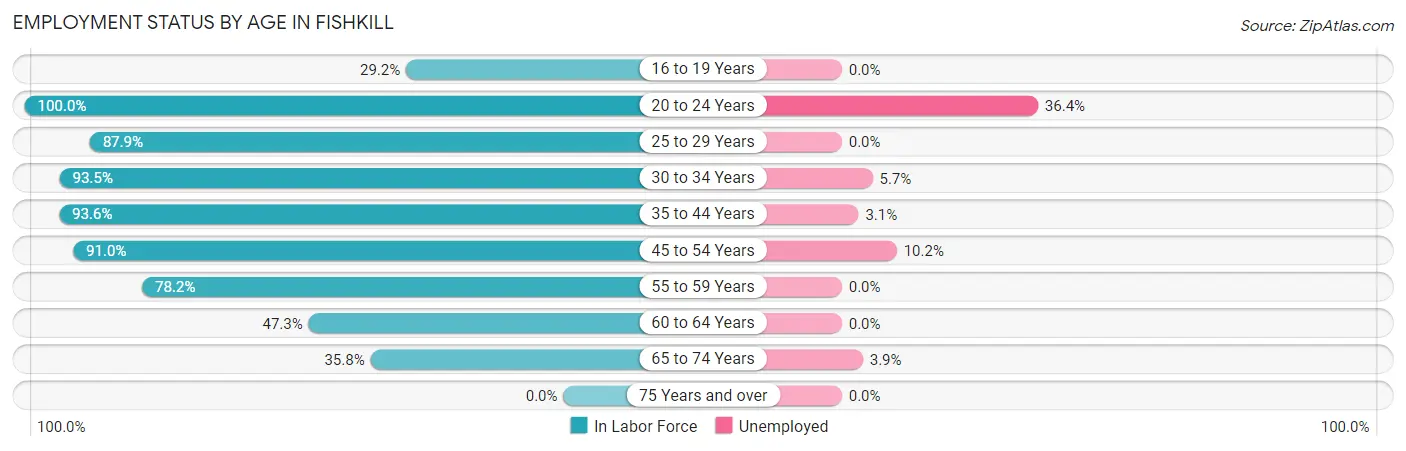
| Age Bracket | In Labor Force | Unemployed |
| 16 to 19 Years | 21 (29.2%) | 0 (0.0%) |
| 20 to 24 Years | 77 (100.0%) | 28 (36.4%) |
| 25 to 29 Years | 138 (87.9%) | 0 (0.0%) |
| 30 to 34 Years | 159 (93.5%) | 9 (5.7%) |
| 35 to 44 Years | 262 (93.6%) | 8 (3.1%) |
| 45 to 54 Years | 353 (91.0%) | 36 (10.2%) |
| 55 to 59 Years | 104 (78.2%) | 0 (0.0%) |
| 60 to 64 Years | 53 (47.3%) | 0 (0.0%) |
| 65 to 74 Years | 102 (35.8%) | 4 (3.9%) |
| 75 Years and over | 0 (0.0%) | 0 (0.0%) |
| Total | 1,270 (65.8%) | 85 (6.7%) |
Employment Status by Educational Attainment in Fishkill
According to labor force statistics for Fishkill, 86.2% of individuals (1,069) out of the total population between 25 and 64 years of age (1,240) are in the labor force, with 5.0% or 53 of them being unemployed. The group with the highest labor force participation rate are those with the educational attainment of college / associate degree, with 91.9% or 249 individuals in the labor force. Within the labor force, individuals with bachelor's degree or higher education have the highest percentage of unemployment, with 7.1% or 42 of them being unemployed.
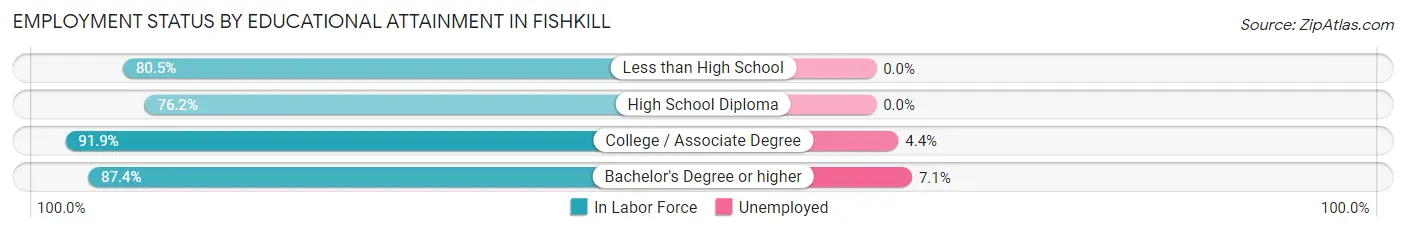
| Educational Attainment | In Labor Force | Unemployed |
| Less than High School | 103 (80.5%) | 0 (0.0%) |
| High School Diploma | 125 (76.2%) | 0 (0.0%) |
| College / Associate Degree | 249 (91.9%) | 12 (4.4%) |
| Bachelor's Degree or higher | 592 (87.4%) | 48 (7.1%) |
| Total | 1,069 (86.2%) | 62 (5.0%) |
Employment Occupations by Sex in Fishkill
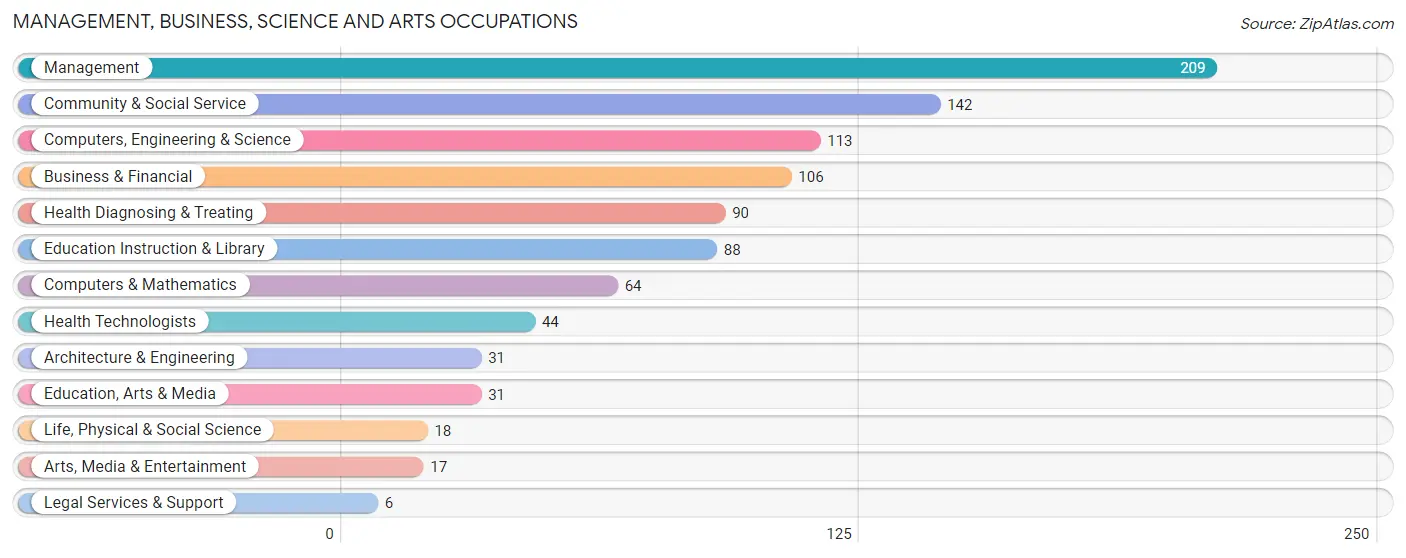
Management, Business, Science and Arts Occupations
The most common Management, Business, Science and Arts occupations in Fishkill are Management (209 | 17.6%), Community & Social Service (142 | 12.0%), Computers, Engineering & Science (113 | 9.5%), Business & Financial (106 | 8.9%), and Health Diagnosing & Treating (90 | 7.6%).
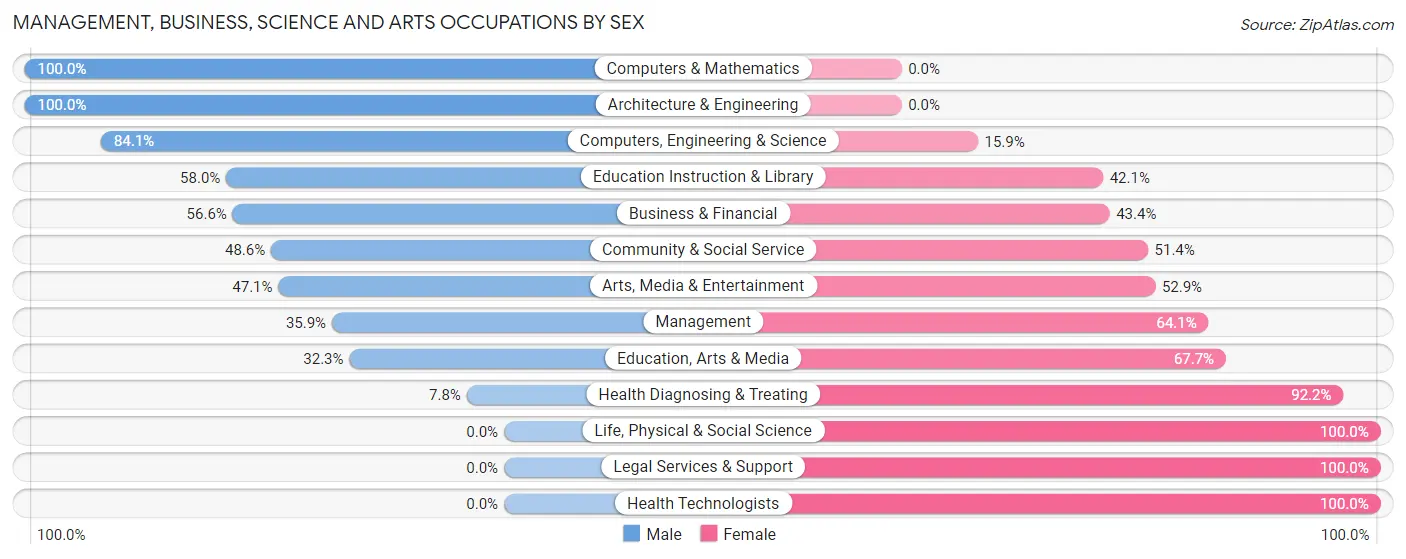
Management, Business, Science and Arts Occupations by Sex
Within the Management, Business, Science and Arts occupations in Fishkill, the most male-oriented occupations are Computers & Mathematics (100.0%), Architecture & Engineering (100.0%), and Computers, Engineering & Science (84.1%), while the most female-oriented occupations are Life, Physical & Social Science (100.0%), Legal Services & Support (100.0%), and Health Technologists (100.0%).
| Occupation | Male | Female |
| Management | 75 (35.9%) | 134 (64.1%) |
| Business & Financial | 60 (56.6%) | 46 (43.4%) |
| Computers, Engineering & Science | 95 (84.1%) | 18 (15.9%) |
| Computers & Mathematics | 64 (100.0%) | 0 (0.0%) |
| Architecture & Engineering | 31 (100.0%) | 0 (0.0%) |
| Life, Physical & Social Science | 0 (0.0%) | 18 (100.0%) |
| Community & Social Service | 69 (48.6%) | 73 (51.4%) |
| Education, Arts & Media | 10 (32.3%) | 21 (67.7%) |
| Legal Services & Support | 0 (0.0%) | 6 (100.0%) |
| Education Instruction & Library | 51 (58.0%) | 37 (42.0%) |
| Arts, Media & Entertainment | 8 (47.1%) | 9 (52.9%) |
| Health Diagnosing & Treating | 7 (7.8%) | 83 (92.2%) |
| Health Technologists | 0 (0.0%) | 44 (100.0%) |
| Total (Category) | 306 (46.4%) | 354 (53.6%) |
| Total (Overall) | 624 (52.7%) | 560 (47.3%) |
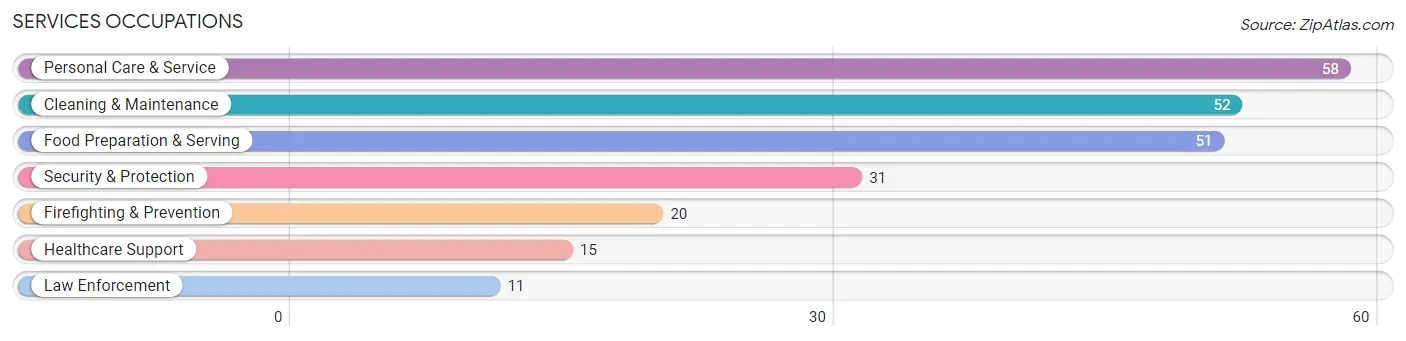
Services Occupations
The most common Services occupations in Fishkill are Personal Care & Service (58 | 4.9%), Cleaning & Maintenance (52 | 4.4%), Food Preparation & Serving (51 | 4.3%), Security & Protection (31 | 2.6%), and Firefighting & Prevention (20 | 1.7%).
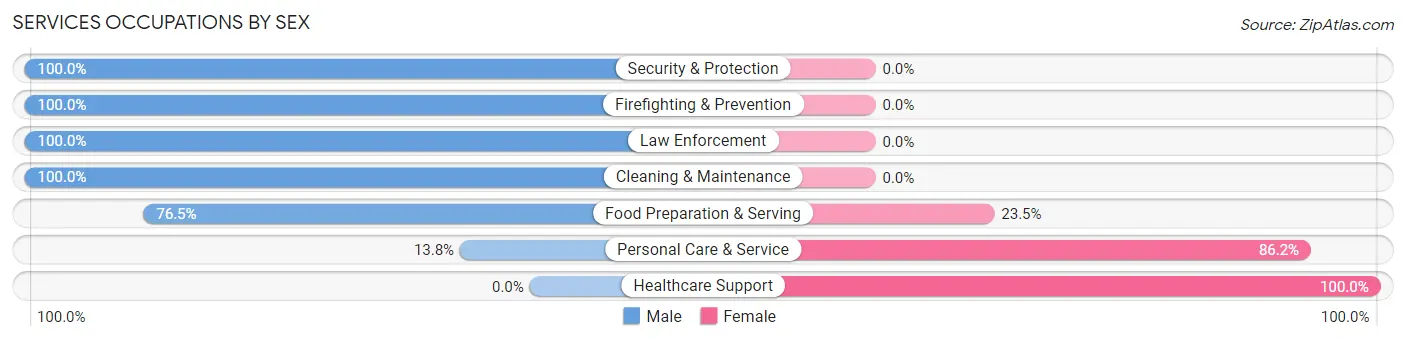
Services Occupations by Sex
Within the Services occupations in Fishkill, the most male-oriented occupations are Security & Protection (100.0%), Firefighting & Prevention (100.0%), and Law Enforcement (100.0%), while the most female-oriented occupations are Healthcare Support (100.0%), Personal Care & Service (86.2%), and Food Preparation & Serving (23.5%).
| Occupation | Male | Female |
| Healthcare Support | 0 (0.0%) | 15 (100.0%) |
| Security & Protection | 31 (100.0%) | 0 (0.0%) |
| Firefighting & Prevention | 20 (100.0%) | 0 (0.0%) |
| Law Enforcement | 11 (100.0%) | 0 (0.0%) |
| Food Preparation & Serving | 39 (76.5%) | 12 (23.5%) |
| Cleaning & Maintenance | 52 (100.0%) | 0 (0.0%) |
| Personal Care & Service | 8 (13.8%) | 50 (86.2%) |
| Total (Category) | 130 (62.8%) | 77 (37.2%) |
| Total (Overall) | 624 (52.7%) | 560 (47.3%) |
Sales and Office Occupations
The most common Sales and Office occupations in Fishkill are Sales & Related (88 | 7.4%), and Office & Administration (76 | 6.4%).
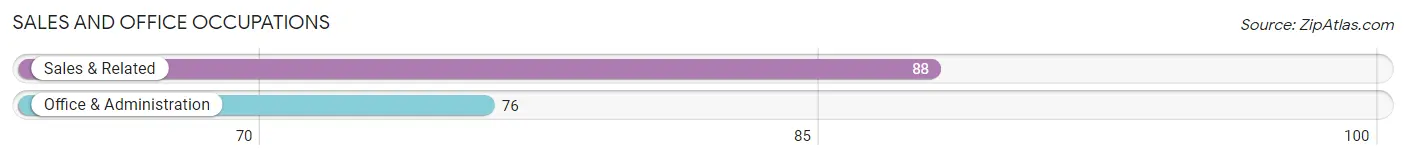
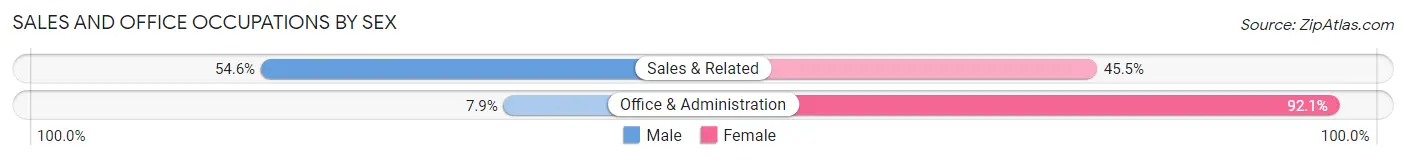
Sales and Office Occupations by Sex
| Occupation | Male | Female |
| Sales & Related | 48 (54.5%) | 40 (45.5%) |
| Office & Administration | 6 (7.9%) | 70 (92.1%) |
| Total (Category) | 54 (32.9%) | 110 (67.1%) |
| Total (Overall) | 624 (52.7%) | 560 (47.3%) |
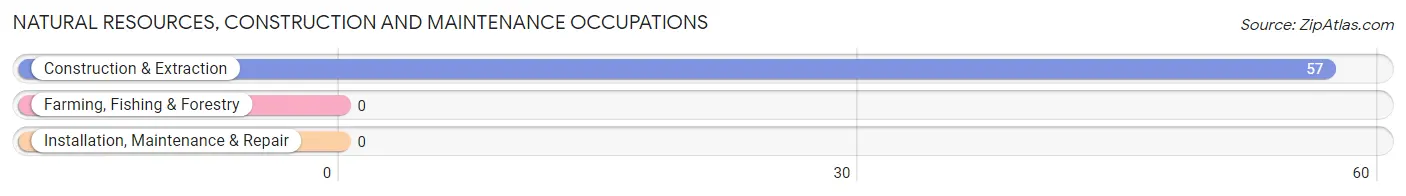
Natural Resources, Construction and Maintenance Occupations
The most common Natural Resources, Construction and Maintenance occupations in Fishkill are , and Construction & Extraction (57 | 4.8%).
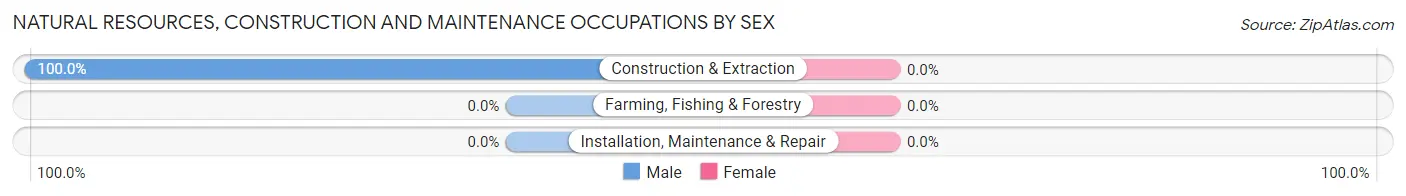
Natural Resources, Construction and Maintenance Occupations by Sex
| Occupation | Male | Female |
| Farming, Fishing & Forestry | 0 (0.0%) | 0 (0.0%) |
| Construction & Extraction | 57 (100.0%) | 0 (0.0%) |
| Installation, Maintenance & Repair | 0 (0.0%) | 0 (0.0%) |
| Total (Category) | 57 (100.0%) | 0 (0.0%) |
| Total (Overall) | 624 (52.7%) | 560 (47.3%) |
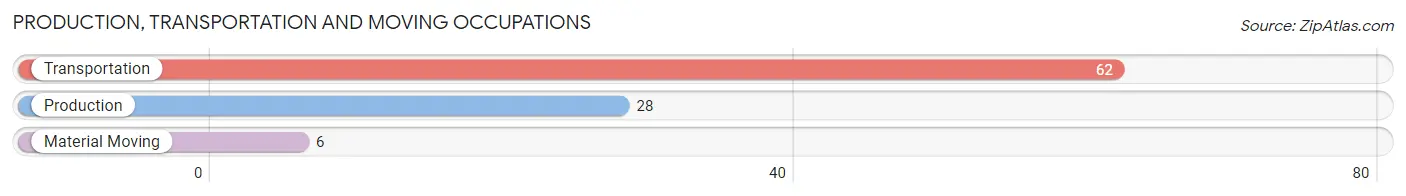
Production, Transportation and Moving Occupations
The most common Production, Transportation and Moving occupations in Fishkill are Transportation (62 | 5.2%), Production (28 | 2.4%), and Material Moving (6 | 0.5%).
Production, Transportation and Moving Occupations by Sex
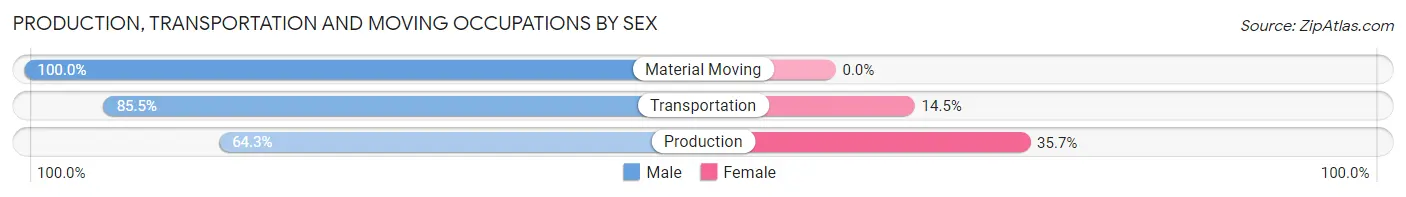
| Occupation | Male | Female |
| Production | 18 (64.3%) | 10 (35.7%) |
| Transportation | 53 (85.5%) | 9 (14.5%) |
| Material Moving | 6 (100.0%) | 0 (0.0%) |
| Total (Category) | 77 (80.2%) | 19 (19.8%) |
| Total (Overall) | 624 (52.7%) | 560 (47.3%) |
Employment Industries by Sex in Fishkill
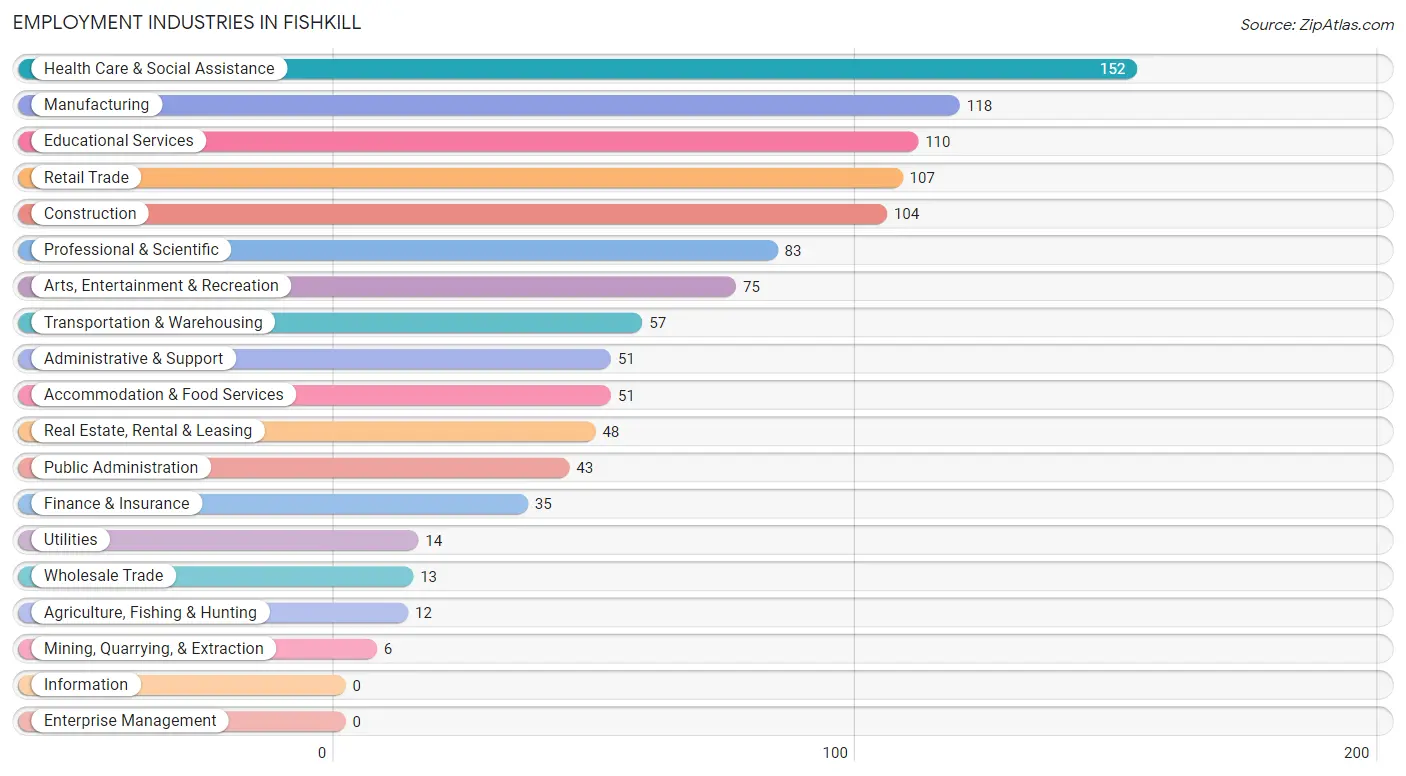
Employment Industries in Fishkill
The major employment industries in Fishkill include Health Care & Social Assistance (152 | 12.8%), Manufacturing (118 | 10.0%), Educational Services (110 | 9.3%), Retail Trade (107 | 9.0%), and Construction (104 | 8.8%).
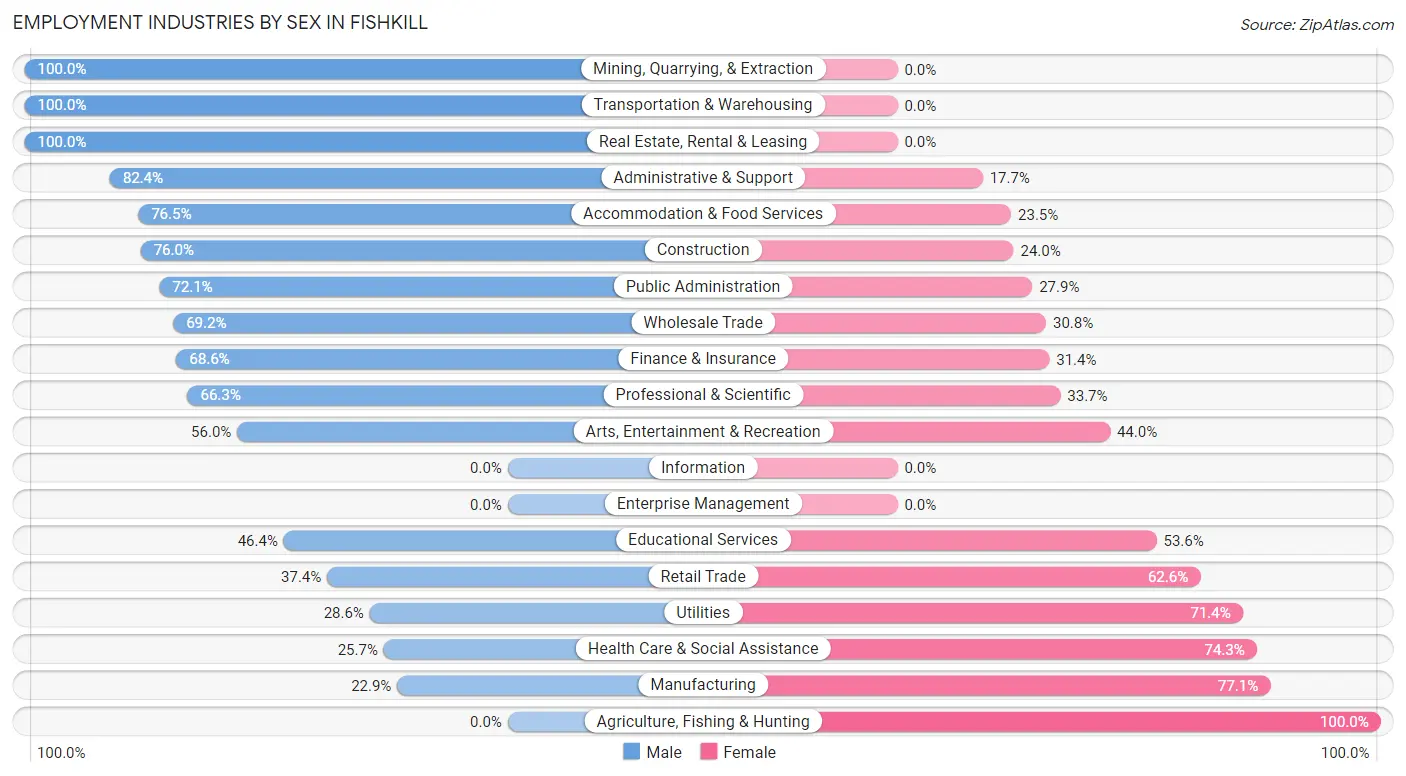
Employment Industries by Sex in Fishkill
The Fishkill industries that see more men than women are Mining, Quarrying, & Extraction (100.0%), Transportation & Warehousing (100.0%), and Real Estate, Rental & Leasing (100.0%), whereas the industries that tend to have a higher number of women are Agriculture, Fishing & Hunting (100.0%), Manufacturing (77.1%), and Health Care & Social Assistance (74.3%).
| Industry | Male | Female |
| Agriculture, Fishing & Hunting | 0 (0.0%) | 12 (100.0%) |
| Mining, Quarrying, & Extraction | 6 (100.0%) | 0 (0.0%) |
| Construction | 79 (76.0%) | 25 (24.0%) |
| Manufacturing | 27 (22.9%) | 91 (77.1%) |
| Wholesale Trade | 9 (69.2%) | 4 (30.8%) |
| Retail Trade | 40 (37.4%) | 67 (62.6%) |
| Transportation & Warehousing | 57 (100.0%) | 0 (0.0%) |
| Utilities | 4 (28.6%) | 10 (71.4%) |
| Information | 0 (0.0%) | 0 (0.0%) |
| Finance & Insurance | 24 (68.6%) | 11 (31.4%) |
| Real Estate, Rental & Leasing | 48 (100.0%) | 0 (0.0%) |
| Professional & Scientific | 55 (66.3%) | 28 (33.7%) |
| Enterprise Management | 0 (0.0%) | 0 (0.0%) |
| Administrative & Support | 42 (82.4%) | 9 (17.6%) |
| Educational Services | 51 (46.4%) | 59 (53.6%) |
| Health Care & Social Assistance | 39 (25.7%) | 113 (74.3%) |
| Arts, Entertainment & Recreation | 42 (56.0%) | 33 (44.0%) |
| Accommodation & Food Services | 39 (76.5%) | 12 (23.5%) |
| Public Administration | 31 (72.1%) | 12 (27.9%) |
| Total | 624 (52.7%) | 560 (47.3%) |
Education in Fishkill
School Enrollment in Fishkill
The most common levels of schooling among the 308 students in Fishkill are high school (110 | 35.7%), middle school (94 | 30.5%), and college / undergraduate (62 | 20.1%).
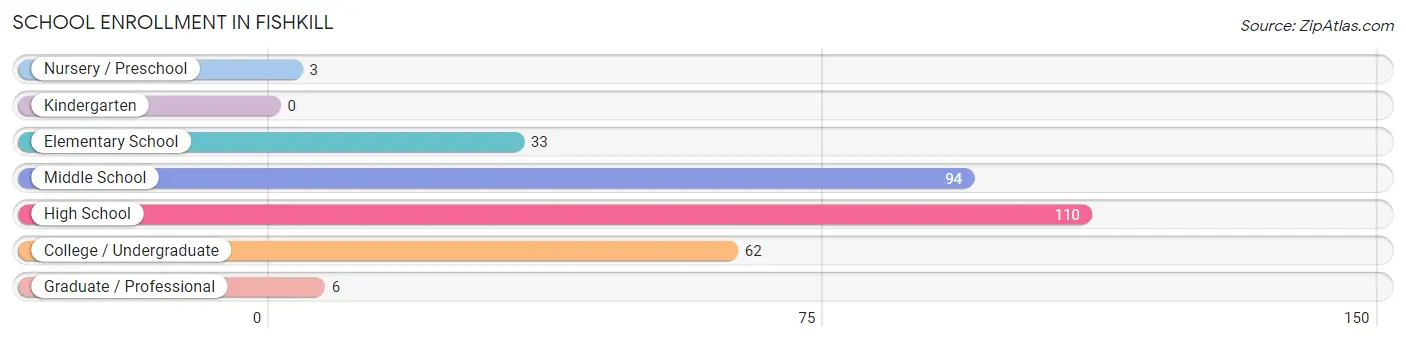
| School Level | # Students | % Students |
| Nursery / Preschool | 3 | 1.0% |
| Kindergarten | 0 | 0.0% |
| Elementary School | 33 | 10.7% |
| Middle School | 94 | 30.5% |
| High School | 110 | 35.7% |
| College / Undergraduate | 62 | 20.1% |
| Graduate / Professional | 6 | 1.9% |
| Total | 308 | 100.0% |
School Enrollment by Age by Funding Source in Fishkill
Out of a total of 308 students who are enrolled in schools in Fishkill, 44 (14.3%) attend a private institution, while the remaining 264 (85.7%) are enrolled in public schools. The age group of 18 to 19 year olds has the highest likelihood of being enrolled in private schools, with 8 (100.0% in the age bracket) enrolled. Conversely, the age group of 20 to 24 year olds has the lowest likelihood of being enrolled in a private school, with 10 (100.0% in the age bracket) attending a public institution.
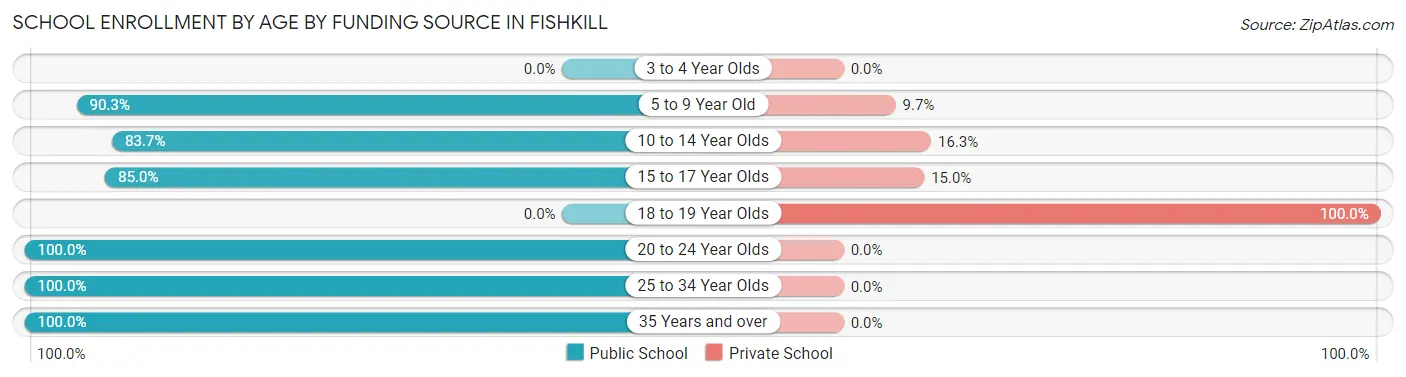
| Age Bracket | Public School | Private School |
| 3 to 4 Year Olds | 0 (0.0%) | 0 (0.0%) |
| 5 to 9 Year Old | 28 (90.3%) | 3 (9.7%) |
| 10 to 14 Year Olds | 108 (83.7%) | 21 (16.3%) |
| 15 to 17 Year Olds | 68 (85.0%) | 12 (15.0%) |
| 18 to 19 Year Olds | 0 (0.0%) | 8 (100.0%) |
| 20 to 24 Year Olds | 10 (100.0%) | 0 (0.0%) |
| 25 to 34 Year Olds | 36 (100.0%) | 0 (0.0%) |
| 35 Years and over | 14 (100.0%) | 0 (0.0%) |
| Total | 264 (85.7%) | 44 (14.3%) |
Educational Attainment by Field of Study in Fishkill
Business (138 | 14.5%), visual & performing arts (109 | 11.4%), education (93 | 9.8%), computers & mathematics (87 | 9.1%), and communications (82 | 8.6%) are the most common fields of study among 953 individuals in Fishkill who have obtained a bachelor's degree or higher.
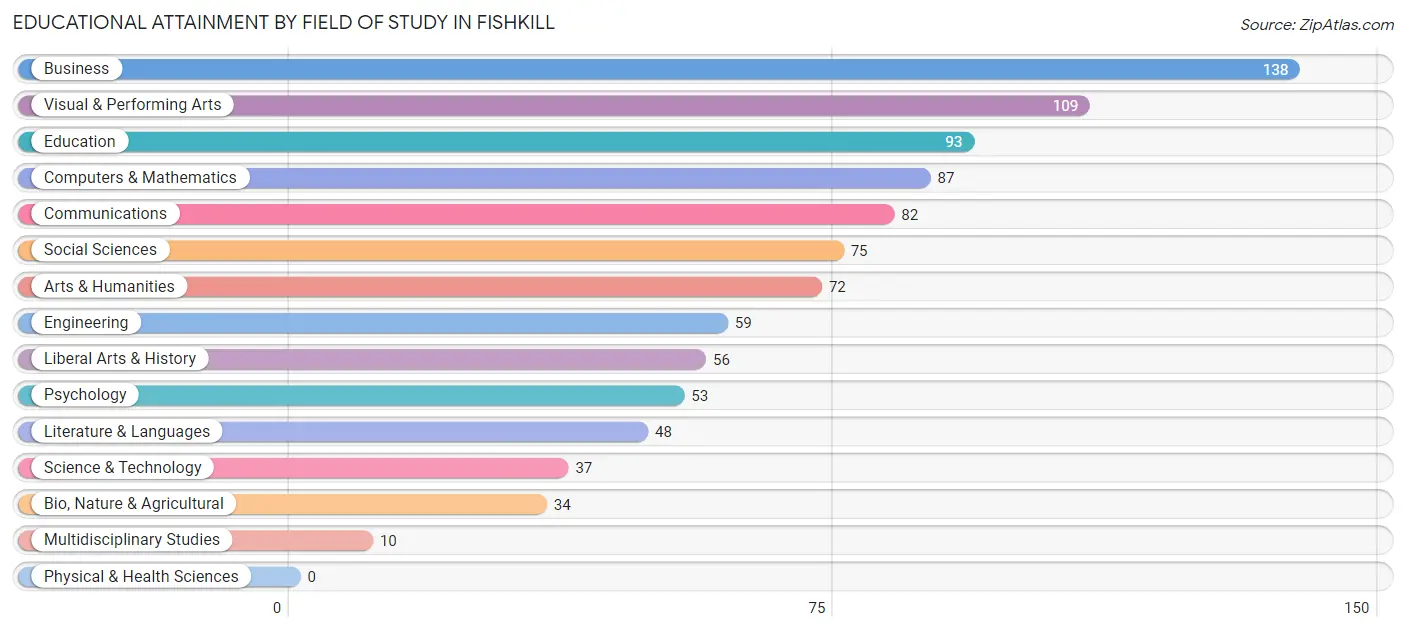
| Field of Study | # Graduates | % Graduates |
| Computers & Mathematics | 87 | 9.1% |
| Bio, Nature & Agricultural | 34 | 3.6% |
| Physical & Health Sciences | 0 | 0.0% |
| Psychology | 53 | 5.6% |
| Social Sciences | 75 | 7.9% |
| Engineering | 59 | 6.2% |
| Multidisciplinary Studies | 10 | 1.1% |
| Science & Technology | 37 | 3.9% |
| Business | 138 | 14.5% |
| Education | 93 | 9.8% |
| Literature & Languages | 48 | 5.0% |
| Liberal Arts & History | 56 | 5.9% |
| Visual & Performing Arts | 109 | 11.4% |
| Communications | 82 | 8.6% |
| Arts & Humanities | 72 | 7.6% |
| Total | 953 | 100.0% |
Transportation & Commute in Fishkill
Vehicle Availability by Sex in Fishkill
The most prevalent vehicle ownership categories in Fishkill are males with 2 vehicles (353, accounting for 58.3%) and females with 2 vehicles (280, making up 65.4%).
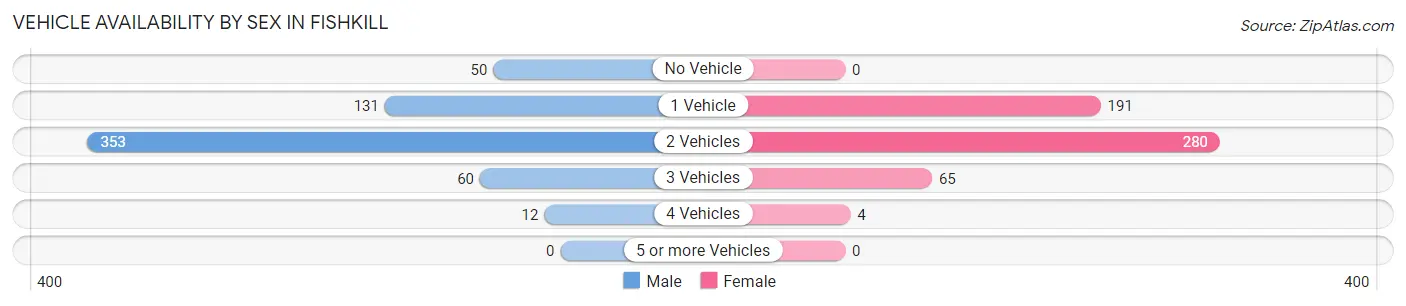
| Vehicles Available | Male | Female |
| No Vehicle | 50 (8.3%) | 0 (0.0%) |
| 1 Vehicle | 131 (21.6%) | 191 (35.4%) |
| 2 Vehicles | 353 (58.3%) | 280 (51.8%) |
| 3 Vehicles | 60 (9.9%) | 65 (12.0%) |
| 4 Vehicles | 12 (2.0%) | 4 (0.7%) |
| 5 or more Vehicles | 0 (0.0%) | 0 (0.0%) |
| Total | 606 (100.0%) | 540 (100.0%) |
Commute Time in Fishkill
The most frequently occuring commute durations in Fishkill are 15 to 19 minutes (155 commuters, 14.6%), 10 to 14 minutes (141 commuters, 13.3%), and 20 to 24 minutes (127 commuters, 11.9%).
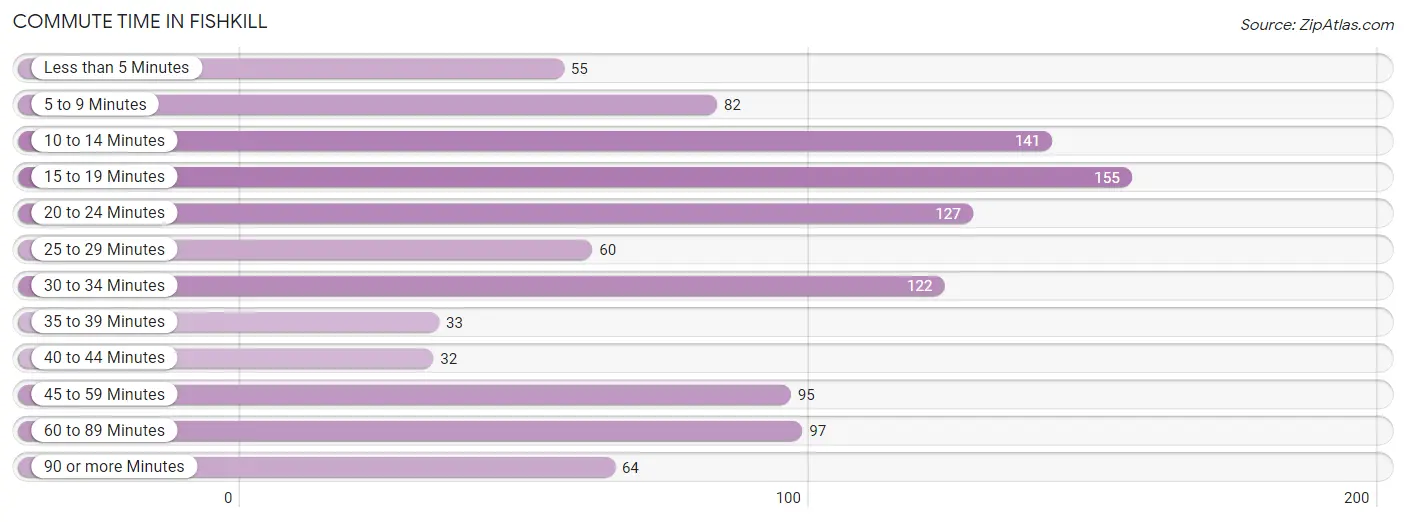
| Commute Time | # Commuters | % Commuters |
| Less than 5 Minutes | 55 | 5.2% |
| 5 to 9 Minutes | 82 | 7.7% |
| 10 to 14 Minutes | 141 | 13.3% |
| 15 to 19 Minutes | 155 | 14.6% |
| 20 to 24 Minutes | 127 | 11.9% |
| 25 to 29 Minutes | 60 | 5.6% |
| 30 to 34 Minutes | 122 | 11.5% |
| 35 to 39 Minutes | 33 | 3.1% |
| 40 to 44 Minutes | 32 | 3.0% |
| 45 to 59 Minutes | 95 | 8.9% |
| 60 to 89 Minutes | 97 | 9.1% |
| 90 or more Minutes | 64 | 6.0% |
Commute Time by Sex in Fishkill
The most common commute times in Fishkill are 30 to 34 minutes (93 commuters, 15.8%) for males and 20 to 24 minutes (69 commuters, 14.6%) for females.
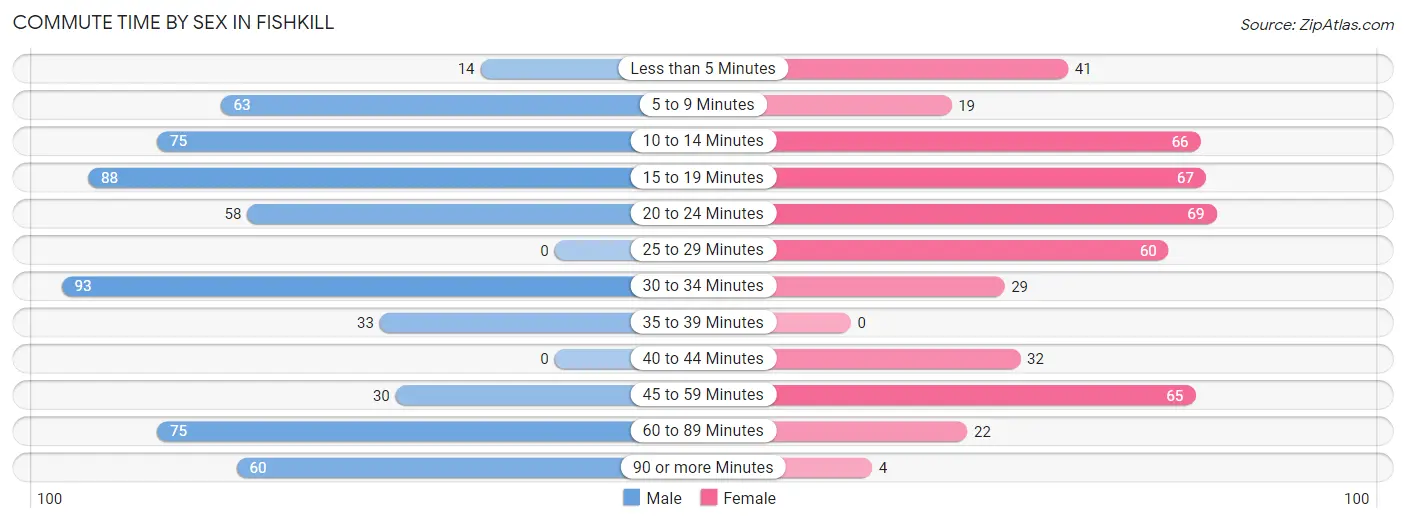
| Commute Time | Male | Female |
| Less than 5 Minutes | 14 (2.4%) | 41 (8.6%) |
| 5 to 9 Minutes | 63 (10.7%) | 19 (4.0%) |
| 10 to 14 Minutes | 75 (12.7%) | 66 (13.9%) |
| 15 to 19 Minutes | 88 (14.9%) | 67 (14.1%) |
| 20 to 24 Minutes | 58 (9.9%) | 69 (14.6%) |
| 25 to 29 Minutes | 0 (0.0%) | 60 (12.7%) |
| 30 to 34 Minutes | 93 (15.8%) | 29 (6.1%) |
| 35 to 39 Minutes | 33 (5.6%) | 0 (0.0%) |
| 40 to 44 Minutes | 0 (0.0%) | 32 (6.8%) |
| 45 to 59 Minutes | 30 (5.1%) | 65 (13.7%) |
| 60 to 89 Minutes | 75 (12.7%) | 22 (4.6%) |
| 90 or more Minutes | 60 (10.2%) | 4 (0.8%) |
Time of Departure to Work by Sex in Fishkill
The most frequent times of departure to work in Fishkill are 12:00 PM to 3:59 PM (84, 14.3%) for males and 7:30 AM to 7:59 AM (128, 27.0%) for females.
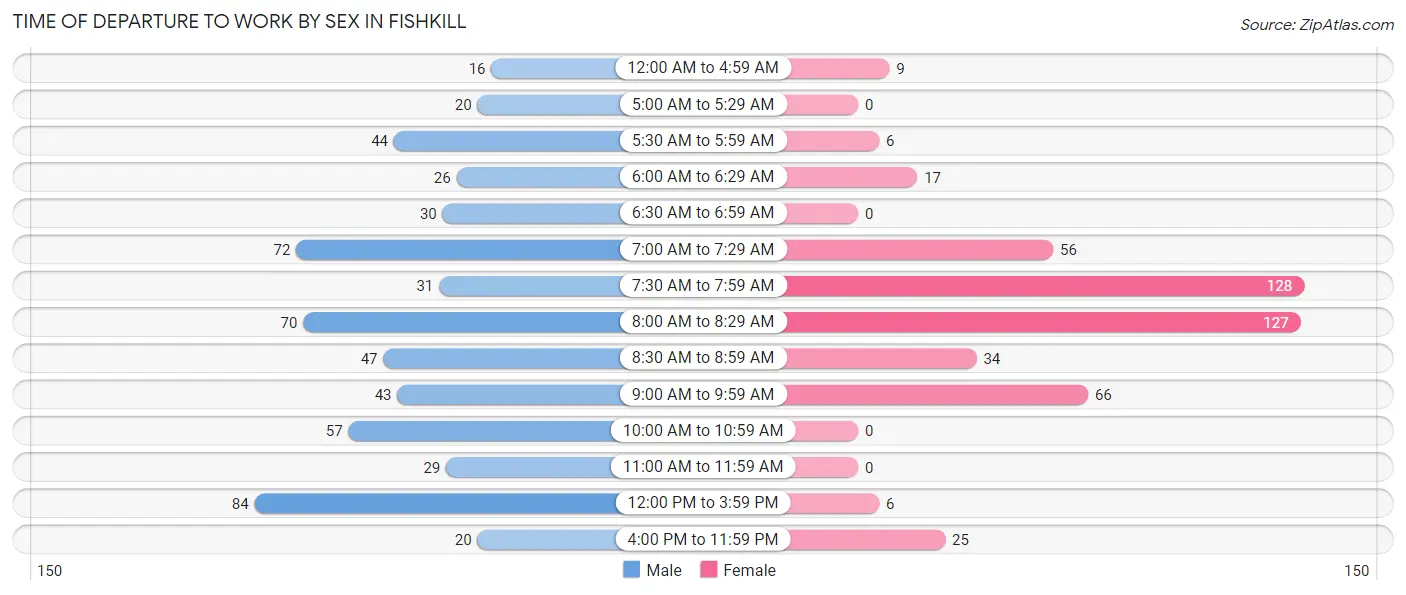
| Time of Departure | Male | Female |
| 12:00 AM to 4:59 AM | 16 (2.7%) | 9 (1.9%) |
| 5:00 AM to 5:29 AM | 20 (3.4%) | 0 (0.0%) |
| 5:30 AM to 5:59 AM | 44 (7.5%) | 6 (1.3%) |
| 6:00 AM to 6:29 AM | 26 (4.4%) | 17 (3.6%) |
| 6:30 AM to 6:59 AM | 30 (5.1%) | 0 (0.0%) |
| 7:00 AM to 7:29 AM | 72 (12.2%) | 56 (11.8%) |
| 7:30 AM to 7:59 AM | 31 (5.3%) | 128 (27.0%) |
| 8:00 AM to 8:29 AM | 70 (11.9%) | 127 (26.8%) |
| 8:30 AM to 8:59 AM | 47 (8.0%) | 34 (7.2%) |
| 9:00 AM to 9:59 AM | 43 (7.3%) | 66 (13.9%) |
| 10:00 AM to 10:59 AM | 57 (9.7%) | 0 (0.0%) |
| 11:00 AM to 11:59 AM | 29 (4.9%) | 0 (0.0%) |
| 12:00 PM to 3:59 PM | 84 (14.3%) | 6 (1.3%) |
| 4:00 PM to 11:59 PM | 20 (3.4%) | 25 (5.3%) |
| Total | 589 (100.0%) | 474 (100.0%) |
Housing Occupancy in Fishkill
Occupancy by Ownership in Fishkill
Of the total 1,148 dwellings in Fishkill, owner-occupied units account for 402 (35.0%), while renter-occupied units make up 746 (65.0%).
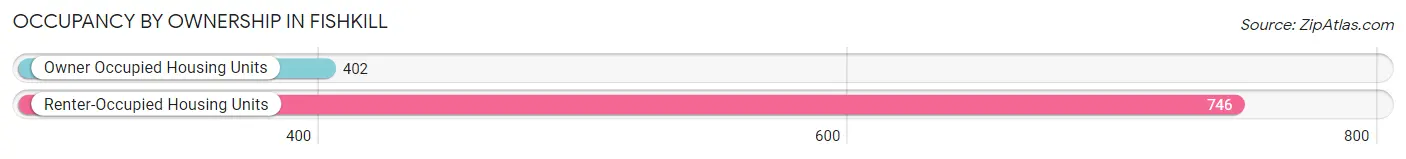
| Occupancy | # Housing Units | % Housing Units |
| Owner Occupied Housing Units | 402 | 35.0% |
| Renter-Occupied Housing Units | 746 | 65.0% |
| Total Occupied Housing Units | 1,148 | 100.0% |
Occupancy by Household Size in Fishkill
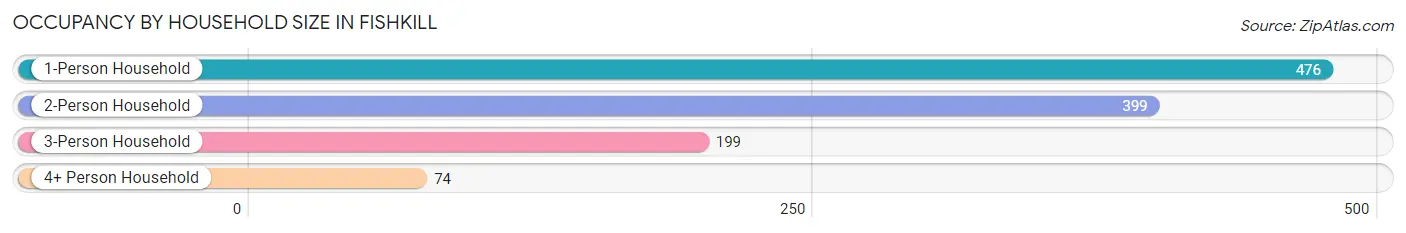
| Household Size | # Housing Units | % Housing Units |
| 1-Person Household | 476 | 41.5% |
| 2-Person Household | 399 | 34.8% |
| 3-Person Household | 199 | 17.3% |
| 4+ Person Household | 74 | 6.5% |
| Total Housing Units | 1,148 | 100.0% |
Occupancy by Ownership by Household Size in Fishkill
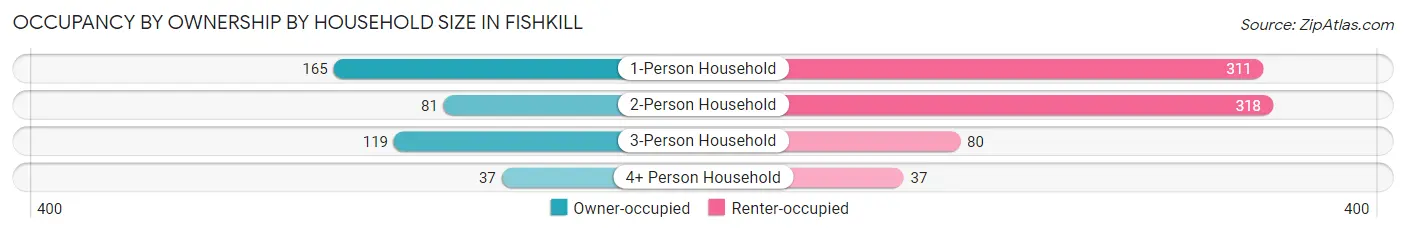
| Household Size | Owner-occupied | Renter-occupied |
| 1-Person Household | 165 (34.7%) | 311 (65.3%) |
| 2-Person Household | 81 (20.3%) | 318 (79.7%) |
| 3-Person Household | 119 (59.8%) | 80 (40.2%) |
| 4+ Person Household | 37 (50.0%) | 37 (50.0%) |
| Total Housing Units | 402 (35.0%) | 746 (65.0%) |
Occupancy by Educational Attainment in Fishkill
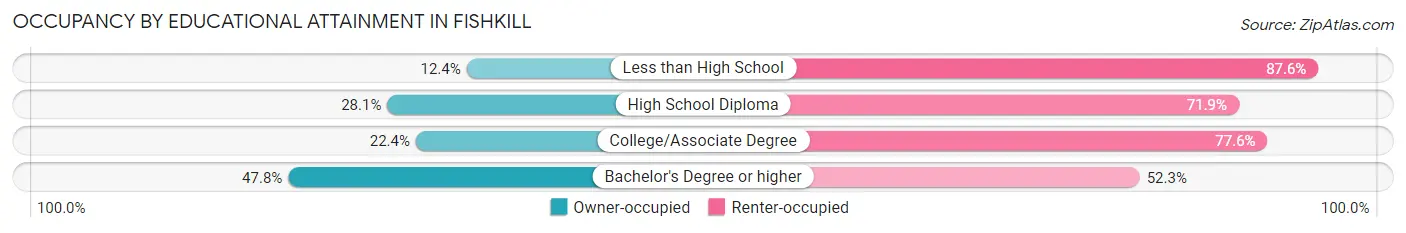
| Household Size | Owner-occupied | Renter-occupied |
| Less than High School | 12 (12.4%) | 85 (87.6%) |
| High School Diploma | 68 (28.1%) | 174 (71.9%) |
| College/Associate Degree | 57 (22.4%) | 197 (77.6%) |
| Bachelor's Degree or higher | 265 (47.7%) | 290 (52.2%) |
Occupancy by Age of Householder in Fishkill
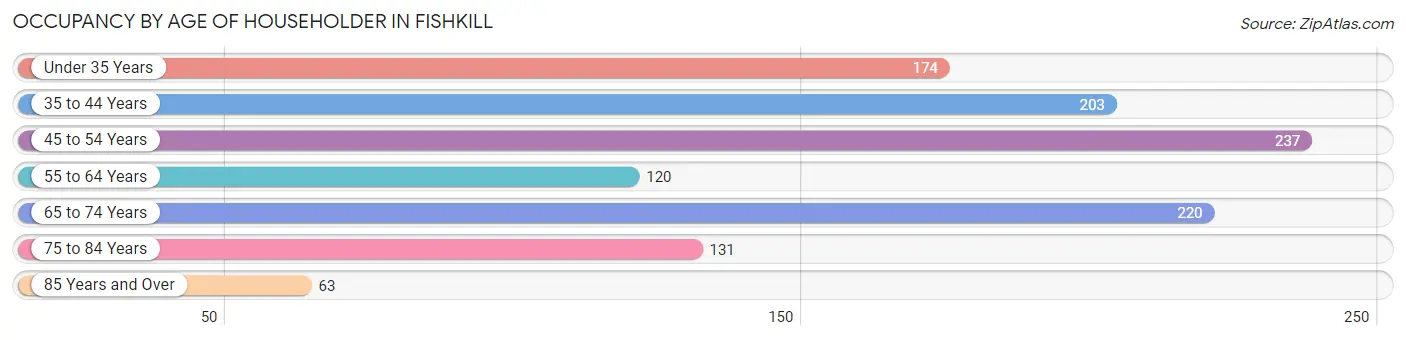
| Age Bracket | # Households | % Households |
| Under 35 Years | 174 | 15.2% |
| 35 to 44 Years | 203 | 17.7% |
| 45 to 54 Years | 237 | 20.6% |
| 55 to 64 Years | 120 | 10.4% |
| 65 to 74 Years | 220 | 19.2% |
| 75 to 84 Years | 131 | 11.4% |
| 85 Years and Over | 63 | 5.5% |
| Total | 1,148 | 100.0% |
Housing Finances in Fishkill
Median Income by Occupancy in Fishkill
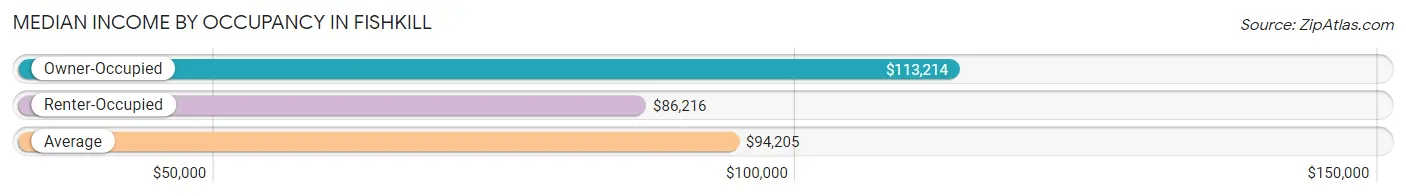
| Occupancy Type | # Households | Median Income |
| Owner-Occupied | 402 (35.0%) | $113,214 |
| Renter-Occupied | 746 (65.0%) | $86,216 |
| Average | 1,148 (100.0%) | $94,205 |
Occupancy by Householder Income Bracket in Fishkill
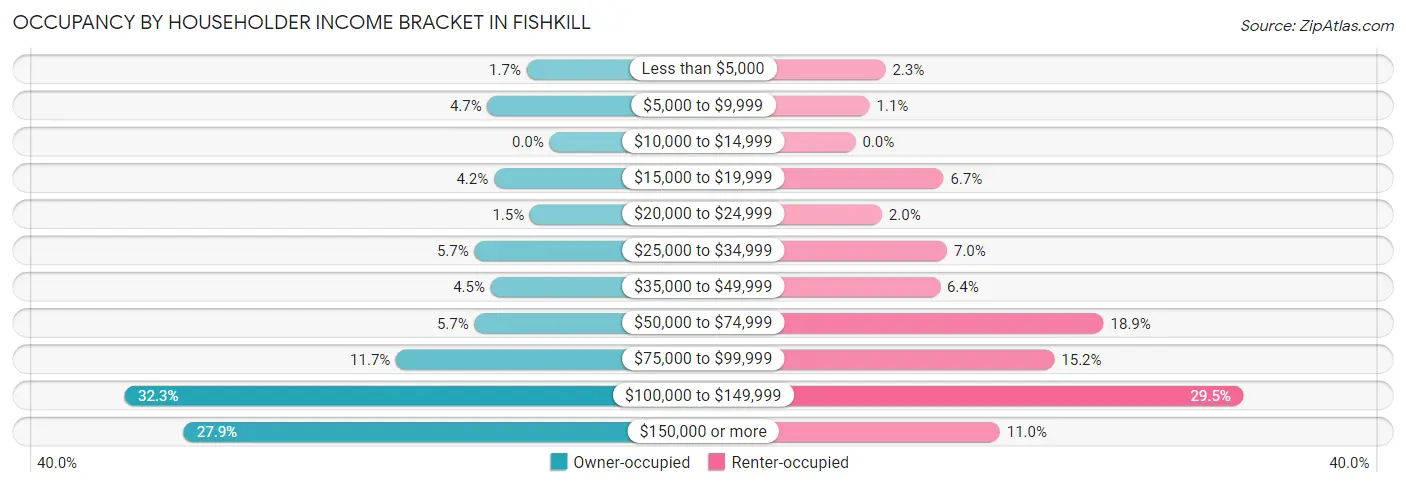
| Income Bracket | Owner-occupied | Renter-occupied |
| Less than $5,000 | 7 (1.7%) | 17 (2.3%) |
| $5,000 to $9,999 | 19 (4.7%) | 8 (1.1%) |
| $10,000 to $14,999 | 0 (0.0%) | 0 (0.0%) |
| $15,000 to $19,999 | 17 (4.2%) | 50 (6.7%) |
| $20,000 to $24,999 | 6 (1.5%) | 15 (2.0%) |
| $25,000 to $34,999 | 23 (5.7%) | 52 (7.0%) |
| $35,000 to $49,999 | 18 (4.5%) | 48 (6.4%) |
| $50,000 to $74,999 | 23 (5.7%) | 141 (18.9%) |
| $75,000 to $99,999 | 47 (11.7%) | 113 (15.1%) |
| $100,000 to $149,999 | 130 (32.3%) | 220 (29.5%) |
| $150,000 or more | 112 (27.9%) | 82 (11.0%) |
| Total | 402 (100.0%) | 746 (100.0%) |
Monthly Housing Cost Tiers in Fishkill
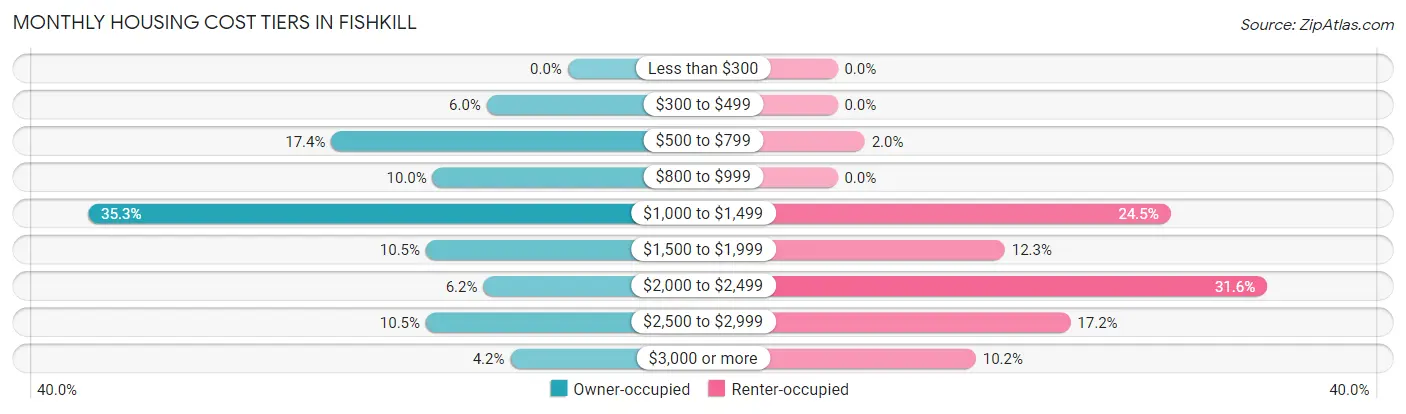
| Monthly Cost | Owner-occupied | Renter-occupied |
| Less than $300 | 0 (0.0%) | 0 (0.0%) |
| $300 to $499 | 24 (6.0%) | 0 (0.0%) |
| $500 to $799 | 70 (17.4%) | 15 (2.0%) |
| $800 to $999 | 40 (10.0%) | 0 (0.0%) |
| $1,000 to $1,499 | 142 (35.3%) | 183 (24.5%) |
| $1,500 to $1,999 | 42 (10.4%) | 92 (12.3%) |
| $2,000 to $2,499 | 25 (6.2%) | 236 (31.6%) |
| $2,500 to $2,999 | 42 (10.4%) | 128 (17.2%) |
| $3,000 or more | 17 (4.2%) | 76 (10.2%) |
| Total | 402 (100.0%) | 746 (100.0%) |
Physical Housing Characteristics in Fishkill
Housing Structures in Fishkill
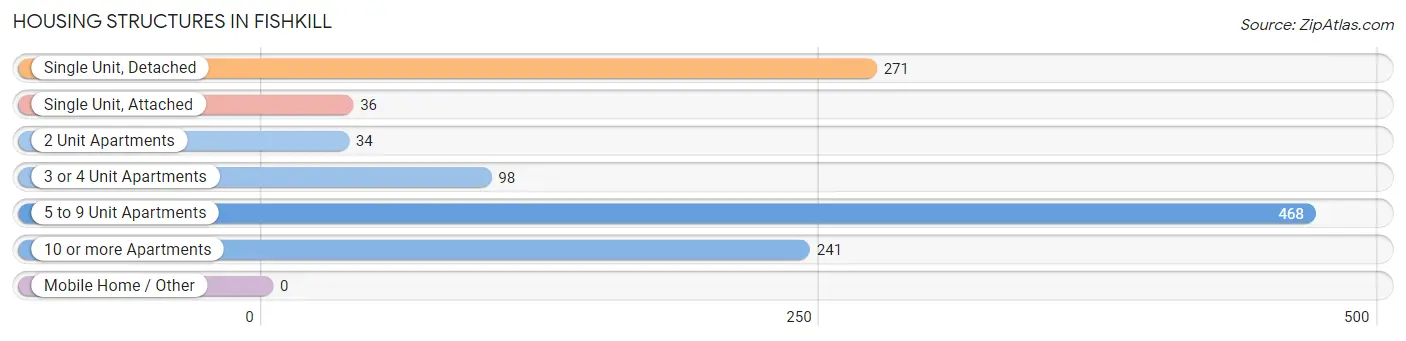
| Structure Type | # Housing Units | % Housing Units |
| Single Unit, Detached | 271 | 23.6% |
| Single Unit, Attached | 36 | 3.1% |
| 2 Unit Apartments | 34 | 3.0% |
| 3 or 4 Unit Apartments | 98 | 8.5% |
| 5 to 9 Unit Apartments | 468 | 40.8% |
| 10 or more Apartments | 241 | 21.0% |
| Mobile Home / Other | 0 | 0.0% |
| Total | 1,148 | 100.0% |
Housing Structures by Occupancy in Fishkill
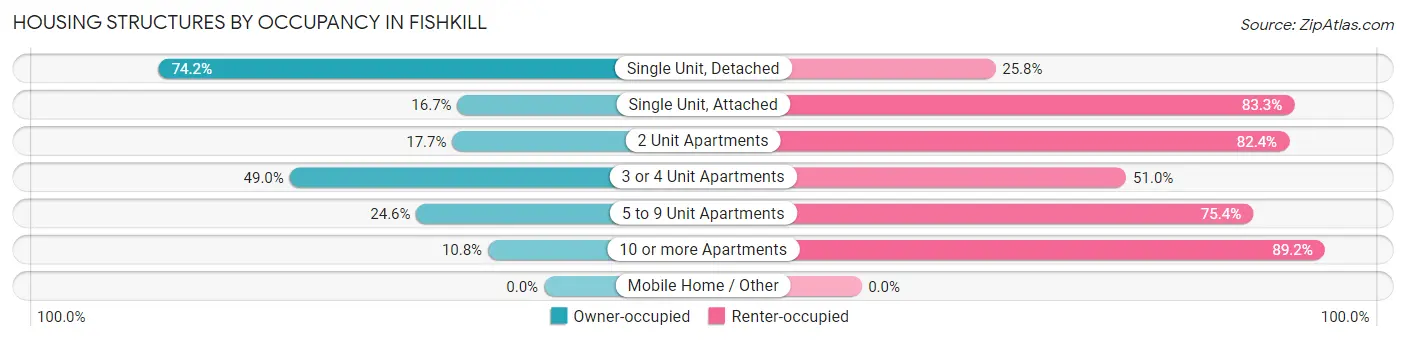
| Structure Type | Owner-occupied | Renter-occupied |
| Single Unit, Detached | 201 (74.2%) | 70 (25.8%) |
| Single Unit, Attached | 6 (16.7%) | 30 (83.3%) |
| 2 Unit Apartments | 6 (17.6%) | 28 (82.4%) |
| 3 or 4 Unit Apartments | 48 (49.0%) | 50 (51.0%) |
| 5 to 9 Unit Apartments | 115 (24.6%) | 353 (75.4%) |
| 10 or more Apartments | 26 (10.8%) | 215 (89.2%) |
| Mobile Home / Other | 0 (0.0%) | 0 (0.0%) |
| Total | 402 (35.0%) | 746 (65.0%) |
Housing Structures by Number of Rooms in Fishkill
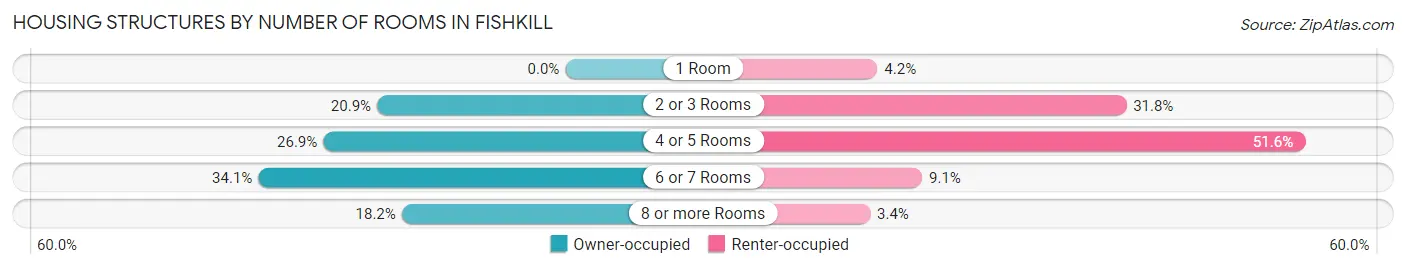
| Number of Rooms | Owner-occupied | Renter-occupied |
| 1 Room | 0 (0.0%) | 31 (4.2%) |
| 2 or 3 Rooms | 84 (20.9%) | 237 (31.8%) |
| 4 or 5 Rooms | 108 (26.9%) | 385 (51.6%) |
| 6 or 7 Rooms | 137 (34.1%) | 68 (9.1%) |
| 8 or more Rooms | 73 (18.2%) | 25 (3.4%) |
| Total | 402 (100.0%) | 746 (100.0%) |
Housing Structure by Heating Type in Fishkill
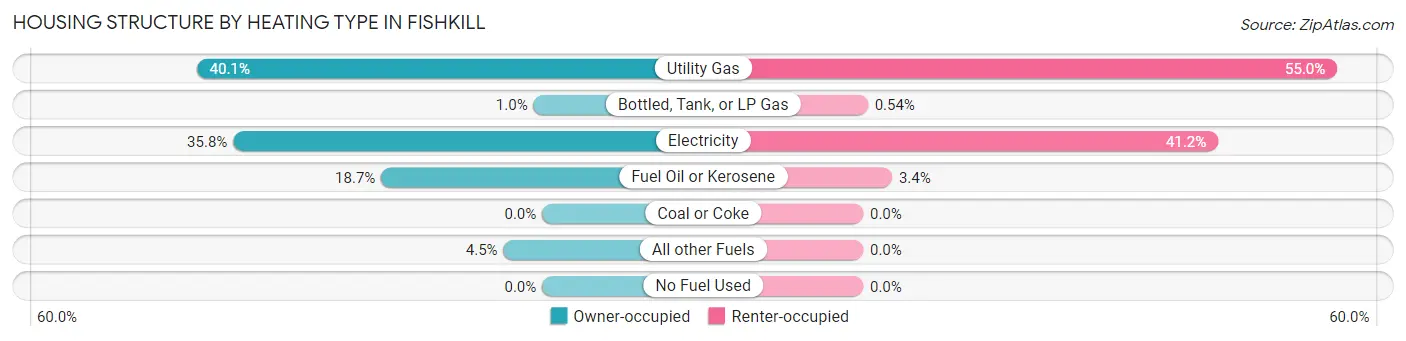
| Heating Type | Owner-occupied | Renter-occupied |
| Utility Gas | 161 (40.1%) | 410 (55.0%) |
| Bottled, Tank, or LP Gas | 4 (1.0%) | 4 (0.5%) |
| Electricity | 144 (35.8%) | 307 (41.1%) |
| Fuel Oil or Kerosene | 75 (18.7%) | 25 (3.4%) |
| Coal or Coke | 0 (0.0%) | 0 (0.0%) |
| All other Fuels | 18 (4.5%) | 0 (0.0%) |
| No Fuel Used | 0 (0.0%) | 0 (0.0%) |
| Total | 402 (100.0%) | 746 (100.0%) |
Household Vehicle Usage in Fishkill
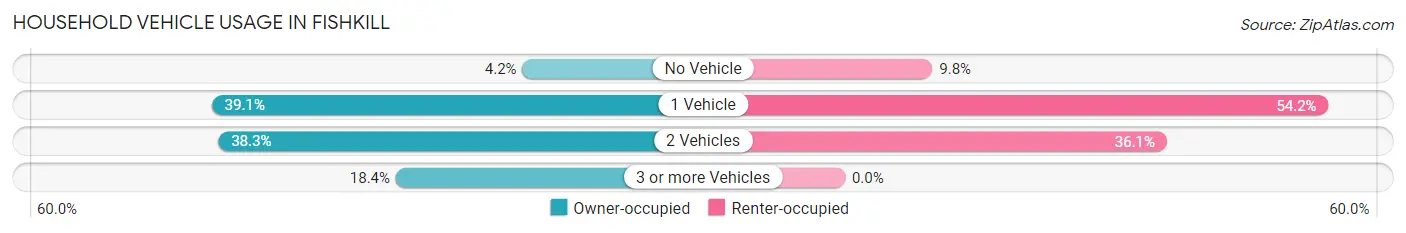
| Vehicles per Household | Owner-occupied | Renter-occupied |
| No Vehicle | 17 (4.2%) | 73 (9.8%) |
| 1 Vehicle | 157 (39.1%) | 404 (54.2%) |
| 2 Vehicles | 154 (38.3%) | 269 (36.1%) |
| 3 or more Vehicles | 74 (18.4%) | 0 (0.0%) |
| Total | 402 (100.0%) | 746 (100.0%) |
Real Estate & Mortgages in Fishkill
Real Estate and Mortgage Overview in Fishkill
| Characteristic | Without Mortgage | With Mortgage |
| Housing Units | 174 | 228 |
| Median Property Value | $324,400 | $236,400 |
| Median Household Income | $106,310 | $61 |
| Monthly Housing Costs | $791 | $17 |
| Real Estate Taxes | $4,466 | $6 |
Property Value by Mortgage Status in Fishkill
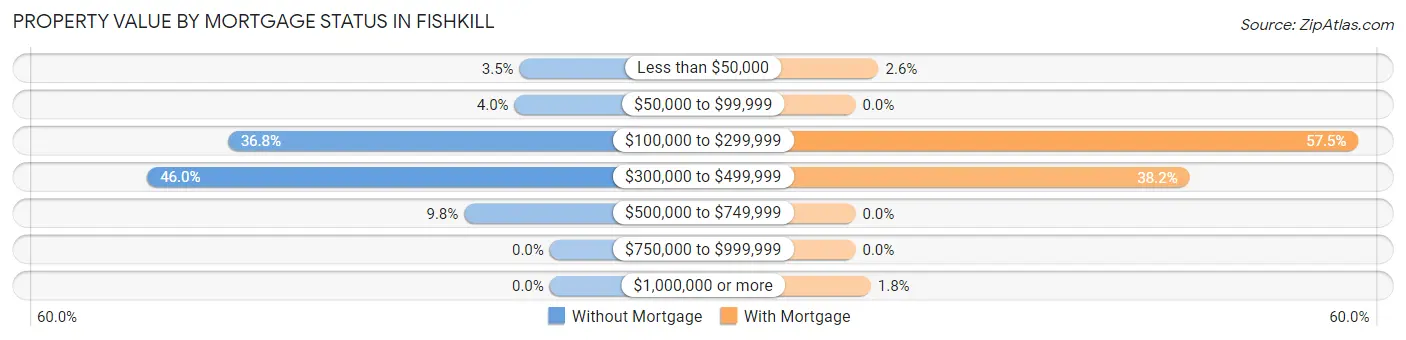
| Property Value | Without Mortgage | With Mortgage |
| Less than $50,000 | 6 (3.5%) | 6 (2.6%) |
| $50,000 to $99,999 | 7 (4.0%) | 0 (0.0%) |
| $100,000 to $299,999 | 64 (36.8%) | 131 (57.5%) |
| $300,000 to $499,999 | 80 (46.0%) | 87 (38.2%) |
| $500,000 to $749,999 | 17 (9.8%) | 0 (0.0%) |
| $750,000 to $999,999 | 0 (0.0%) | 0 (0.0%) |
| $1,000,000 or more | 0 (0.0%) | 4 (1.8%) |
| Total | 174 (100.0%) | 228 (100.0%) |
Household Income by Mortgage Status in Fishkill
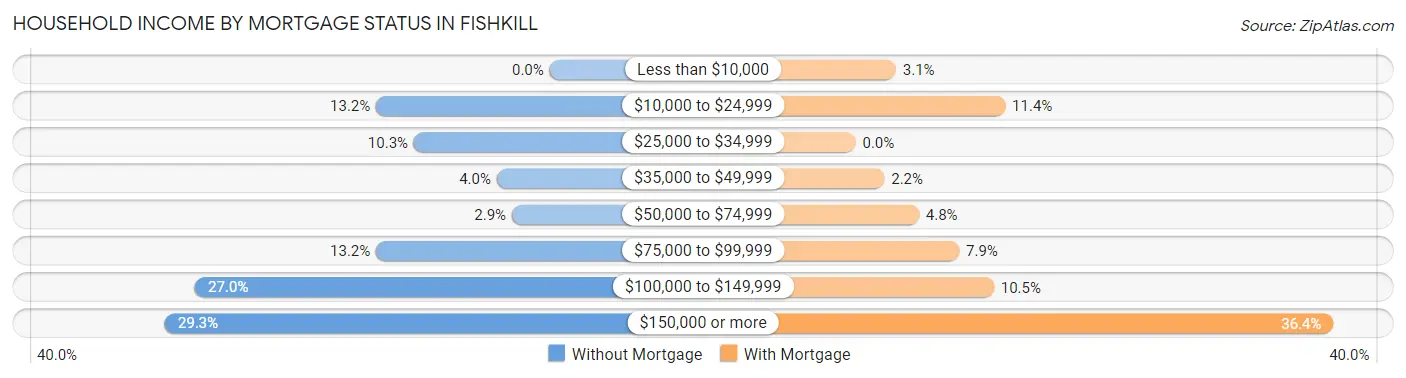
| Household Income | Without Mortgage | With Mortgage |
| Less than $10,000 | 0 (0.0%) | 7 (3.1%) |
| $10,000 to $24,999 | 23 (13.2%) | 26 (11.4%) |
| $25,000 to $34,999 | 18 (10.3%) | 0 (0.0%) |
| $35,000 to $49,999 | 7 (4.0%) | 5 (2.2%) |
| $50,000 to $74,999 | 5 (2.9%) | 11 (4.8%) |
| $75,000 to $99,999 | 23 (13.2%) | 18 (7.9%) |
| $100,000 to $149,999 | 47 (27.0%) | 24 (10.5%) |
| $150,000 or more | 51 (29.3%) | 83 (36.4%) |
| Total | 174 (100.0%) | 228 (100.0%) |
Property Value to Household Income Ratio in Fishkill
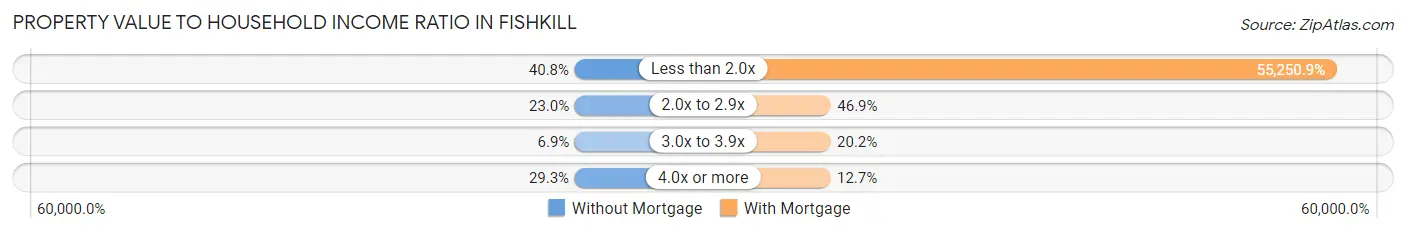
| Value-to-Income Ratio | Without Mortgage | With Mortgage |
| Less than 2.0x | 71 (40.8%) | 125,972 (55,250.9%) |
| 2.0x to 2.9x | 40 (23.0%) | 107 (46.9%) |
| 3.0x to 3.9x | 12 (6.9%) | 46 (20.2%) |
| 4.0x or more | 51 (29.3%) | 29 (12.7%) |
| Total | 174 (100.0%) | 228 (100.0%) |
Real Estate Taxes by Mortgage Status in Fishkill
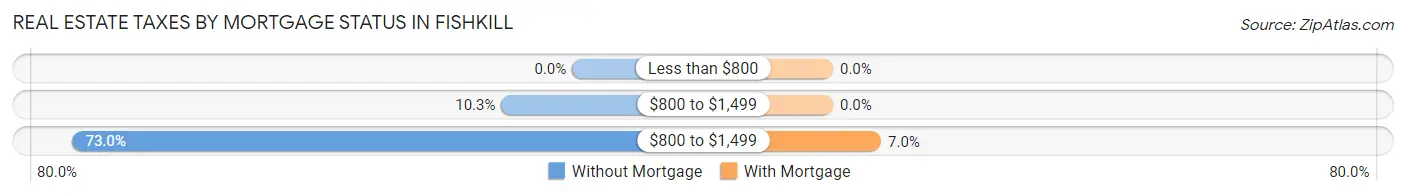
| Property Taxes | Without Mortgage | With Mortgage |
| Less than $800 | 0 (0.0%) | 0 (0.0%) |
| $800 to $1,499 | 18 (10.3%) | 0 (0.0%) |
| $800 to $1,499 | 127 (73.0%) | 16 (7.0%) |
| Total | 174 (100.0%) | 228 (100.0%) |
Health & Disability in Fishkill
Health Insurance Coverage by Age in Fishkill
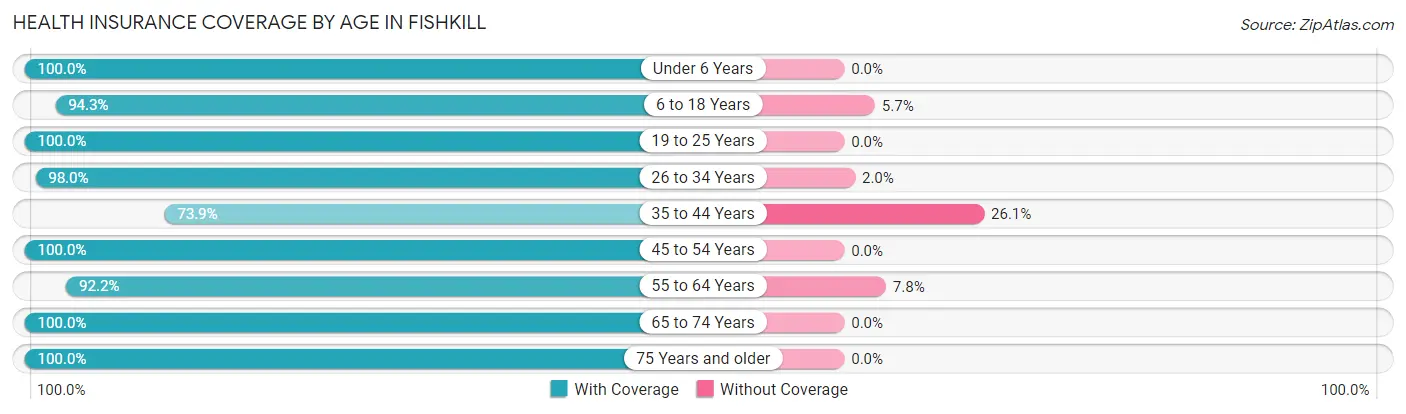
| Age Bracket | With Coverage | Without Coverage |
| Under 6 Years | 74 (100.0%) | 0 (0.0%) |
| 6 to 18 Years | 231 (94.3%) | 14 (5.7%) |
| 19 to 25 Years | 104 (100.0%) | 0 (0.0%) |
| 26 to 34 Years | 294 (98.0%) | 6 (2.0%) |
| 35 to 44 Years | 207 (73.9%) | 73 (26.1%) |
| 45 to 54 Years | 388 (100.0%) | 0 (0.0%) |
| 55 to 64 Years | 226 (92.2%) | 19 (7.8%) |
| 65 to 74 Years | 285 (100.0%) | 0 (0.0%) |
| 75 Years and older | 256 (100.0%) | 0 (0.0%) |
| Total | 2,065 (94.9%) | 112 (5.1%) |
Health Insurance Coverage by Citizenship Status in Fishkill
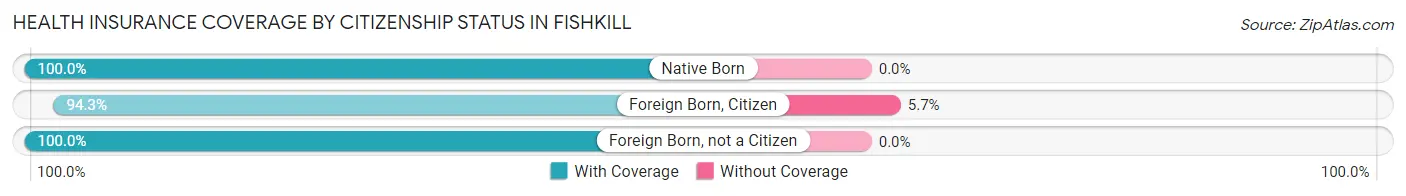
| Citizenship Status | With Coverage | Without Coverage |
| Native Born | 74 (100.0%) | 0 (0.0%) |
| Foreign Born, Citizen | 231 (94.3%) | 14 (5.7%) |
| Foreign Born, not a Citizen | 104 (100.0%) | 0 (0.0%) |
Health Insurance Coverage by Household Income in Fishkill
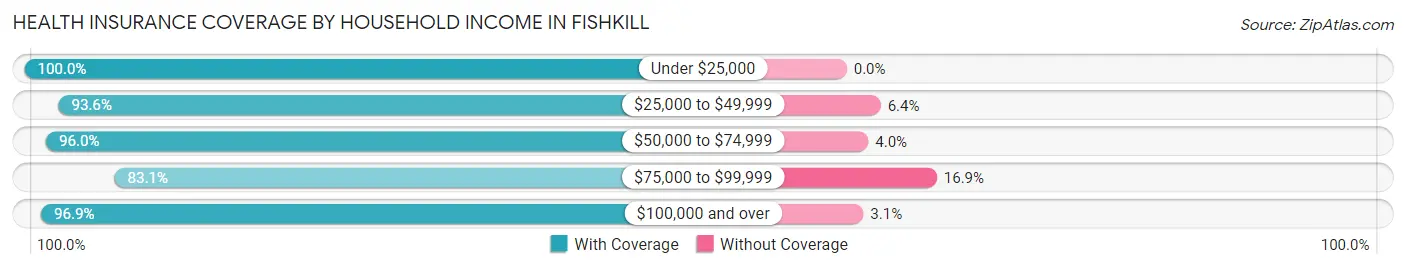
| Household Income | With Coverage | Without Coverage |
| Under $25,000 | 237 (100.0%) | 0 (0.0%) |
| $25,000 to $49,999 | 206 (93.6%) | 14 (6.4%) |
| $50,000 to $74,999 | 214 (96.0%) | 9 (4.0%) |
| $75,000 to $99,999 | 256 (83.1%) | 52 (16.9%) |
| $100,000 and over | 1,152 (96.9%) | 37 (3.1%) |
Public vs Private Health Insurance Coverage by Age in Fishkill
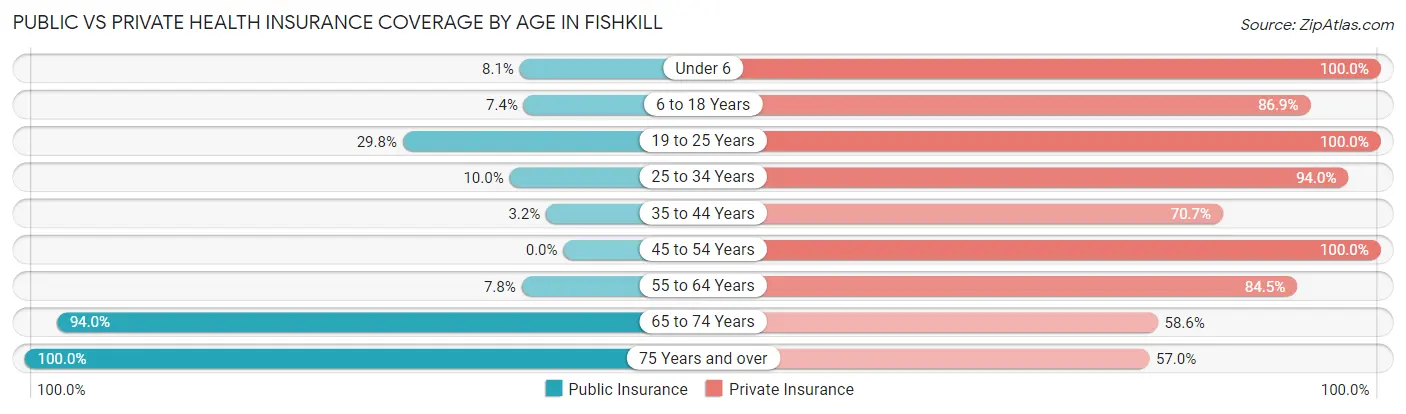
| Age Bracket | Public Insurance | Private Insurance |
| Under 6 | 6 (8.1%) | 74 (100.0%) |
| 6 to 18 Years | 18 (7.3%) | 213 (86.9%) |
| 19 to 25 Years | 31 (29.8%) | 104 (100.0%) |
| 25 to 34 Years | 30 (10.0%) | 282 (94.0%) |
| 35 to 44 Years | 9 (3.2%) | 198 (70.7%) |
| 45 to 54 Years | 0 (0.0%) | 388 (100.0%) |
| 55 to 64 Years | 19 (7.8%) | 207 (84.5%) |
| 65 to 74 Years | 268 (94.0%) | 167 (58.6%) |
| 75 Years and over | 256 (100.0%) | 146 (57.0%) |
| Total | 637 (29.3%) | 1,779 (81.7%) |
Disability Status by Sex by Age in Fishkill
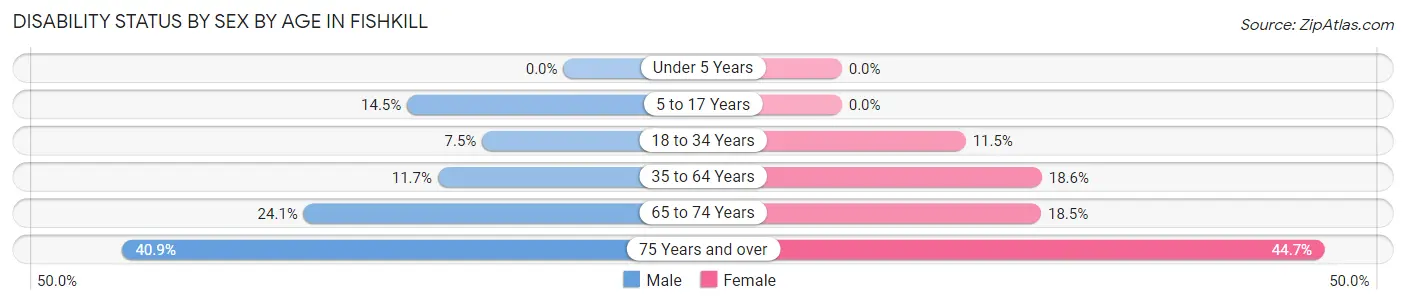
| Age Bracket | Male | Female |
| Under 5 Years | 0 (0.0%) | 0 (0.0%) |
| 5 to 17 Years | 19 (14.5%) | 0 (0.0%) |
| 18 to 34 Years | 14 (7.5%) | 26 (11.5%) |
| 35 to 64 Years | 53 (11.7%) | 85 (18.6%) |
| 65 to 74 Years | 40 (24.1%) | 22 (18.5%) |
| 75 Years and over | 27 (40.9%) | 85 (44.7%) |
Disability Class by Sex by Age in Fishkill
Disability Class: Hearing Difficulty
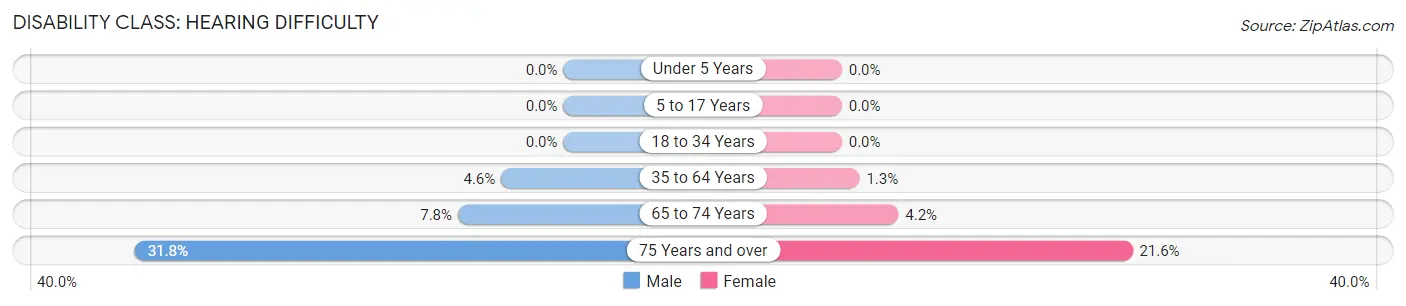
| Age Bracket | Male | Female |
| Under 5 Years | 0 (0.0%) | 0 (0.0%) |
| 5 to 17 Years | 0 (0.0%) | 0 (0.0%) |
| 18 to 34 Years | 0 (0.0%) | 0 (0.0%) |
| 35 to 64 Years | 21 (4.6%) | 6 (1.3%) |
| 65 to 74 Years | 13 (7.8%) | 5 (4.2%) |
| 75 Years and over | 21 (31.8%) | 41 (21.6%) |
Disability Class: Vision Difficulty
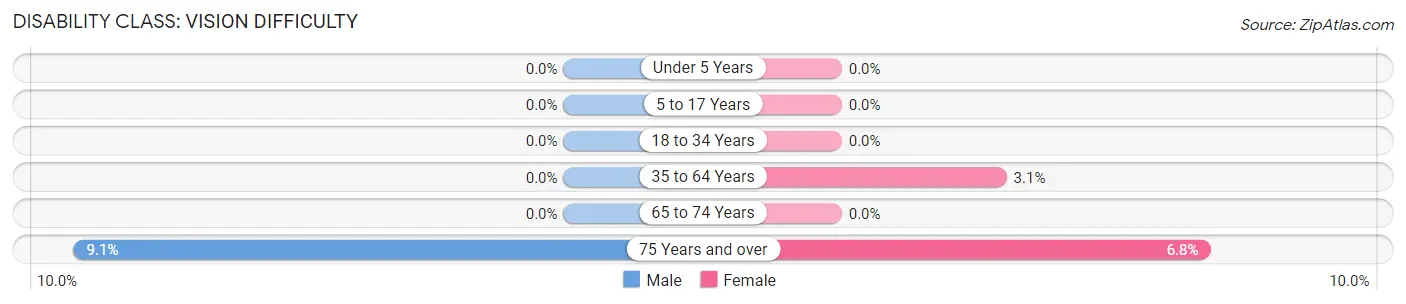
| Age Bracket | Male | Female |
| Under 5 Years | 0 (0.0%) | 0 (0.0%) |
| 5 to 17 Years | 0 (0.0%) | 0 (0.0%) |
| 18 to 34 Years | 0 (0.0%) | 0 (0.0%) |
| 35 to 64 Years | 0 (0.0%) | 14 (3.1%) |
| 65 to 74 Years | 0 (0.0%) | 0 (0.0%) |
| 75 Years and over | 6 (9.1%) | 13 (6.8%) |
Disability Class: Cognitive Difficulty
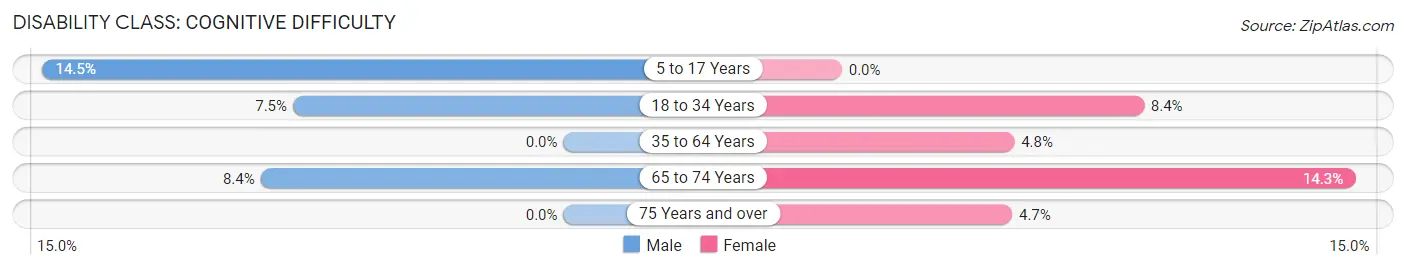
| Age Bracket | Male | Female |
| 5 to 17 Years | 19 (14.5%) | 0 (0.0%) |
| 18 to 34 Years | 14 (7.5%) | 19 (8.4%) |
| 35 to 64 Years | 0 (0.0%) | 22 (4.8%) |
| 65 to 74 Years | 14 (8.4%) | 17 (14.3%) |
| 75 Years and over | 0 (0.0%) | 9 (4.7%) |
Disability Class: Ambulatory Difficulty
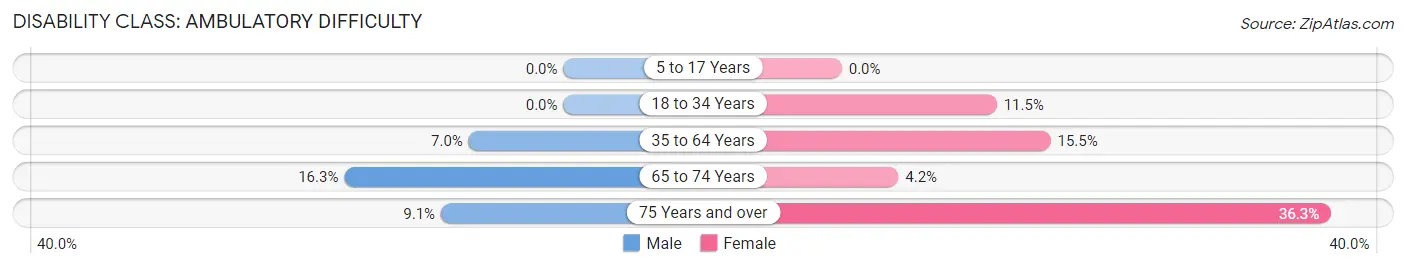
| Age Bracket | Male | Female |
| 5 to 17 Years | 0 (0.0%) | 0 (0.0%) |
| 18 to 34 Years | 0 (0.0%) | 26 (11.5%) |
| 35 to 64 Years | 32 (7.0%) | 71 (15.5%) |
| 65 to 74 Years | 27 (16.3%) | 5 (4.2%) |
| 75 Years and over | 6 (9.1%) | 69 (36.3%) |
Disability Class: Self-Care Difficulty
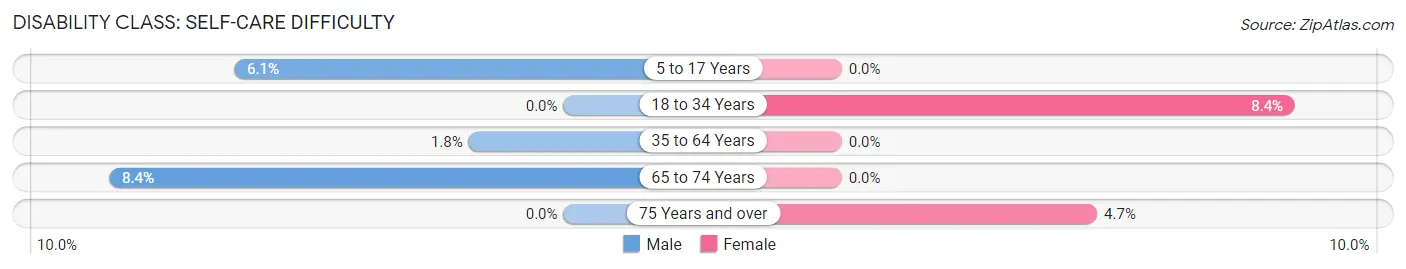
| Age Bracket | Male | Female |
| 5 to 17 Years | 8 (6.1%) | 0 (0.0%) |
| 18 to 34 Years | 0 (0.0%) | 19 (8.4%) |
| 35 to 64 Years | 8 (1.8%) | 0 (0.0%) |
| 65 to 74 Years | 14 (8.4%) | 0 (0.0%) |
| 75 Years and over | 0 (0.0%) | 9 (4.7%) |
Technology Access in Fishkill
Computing Device Access in Fishkill
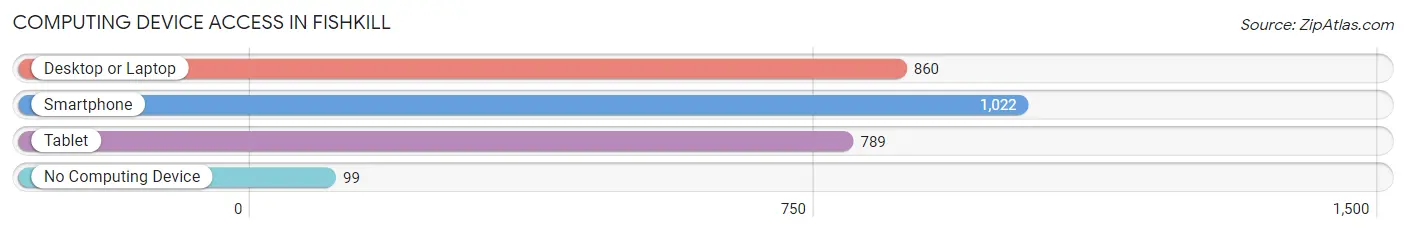
| Device Type | # Households | % Households |
| Desktop or Laptop | 860 | 74.9% |
| Smartphone | 1,022 | 89.0% |
| Tablet | 789 | 68.7% |
| No Computing Device | 99 | 8.6% |
| Total | 1,148 | 100.0% |
Internet Access in Fishkill
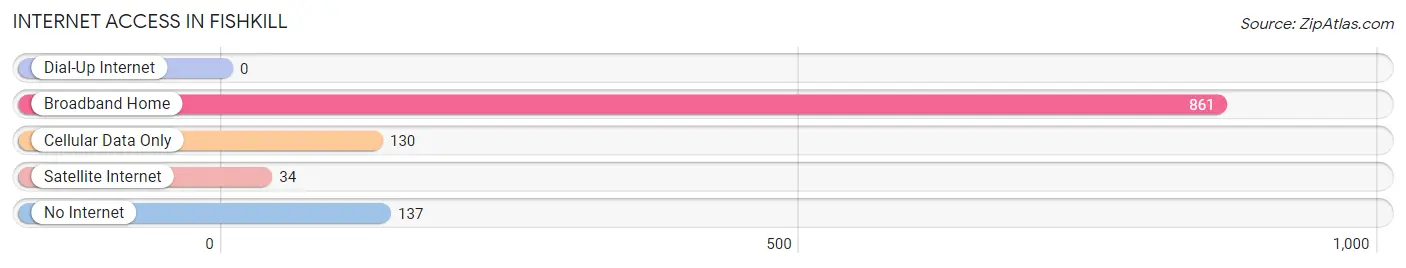
| Internet Type | # Households | % Households |
| Dial-Up Internet | 0 | 0.0% |
| Broadband Home | 861 | 75.0% |
| Cellular Data Only | 130 | 11.3% |
| Satellite Internet | 34 | 3.0% |
| No Internet | 137 | 11.9% |
| Total | 1,148 | 100.0% |
Fishkill Summary
History
Fishkill is a village located in Dutchess County, New York. It is part of the Town of Fishkill, which was established in 1788. The village was originally known as Fishkill Landing, and was a major port on the Hudson River. It was a popular stop for travelers and traders, and was the site of a Revolutionary War encampment.
The village was officially incorporated in 1871, and was named after the Fishkill Creek, which runs through the area. The creek was named by the Dutch settlers who first settled the area in the 1600s. The name is derived from the Dutch words “vis” and “kill”, which mean “fish” and “stream”, respectively.
The village of Fishkill has a rich history of industry and commerce. In the late 1800s, the village was home to several factories, including a paper mill, a brickyard, and a tannery. The village was also home to a number of hotels, which served travelers and traders.
In the early 1900s, the village began to experience a period of growth and development. The village was home to several large businesses, including a brewery, a shoe factory, and a furniture factory. The village also became a popular tourist destination, and was home to several resorts and amusement parks.
The village of Fishkill experienced a period of decline in the mid-1900s, as many of the factories and businesses closed. However, the village has experienced a resurgence in recent years, and is now home to several businesses and restaurants.
Geography
Fishkill is located in Dutchess County, New York, approximately 70 miles north of New York City. The village is situated on the east bank of the Hudson River, and is bordered by the towns of East Fishkill, Wappinger, and Beacon.
The village of Fishkill covers an area of approximately 2.5 square miles, and has a population of approximately 8,000 people. The village is located at an elevation of approximately 200 feet above sea level.
The climate in Fishkill is classified as humid continental, with warm summers and cold winters. The average temperature in the summer is around 75 degrees Fahrenheit, and the average temperature in the winter is around 25 degrees Fahrenheit.
Economy
The economy of Fishkill is largely based on tourism and retail. The village is home to several restaurants, shops, and other businesses. The village is also home to several large employers, including IBM, PepsiCo, and the Dutchess County government.
The village of Fishkill is also home to several educational institutions, including Dutchess Community College and Marist College. The village is also home to several parks and recreational areas, including the Hudson Valley Rail Trail and the Fishkill Creek Park.
Demographics
The population of Fishkill is approximately 8,000 people, according to the 2010 census. The population is largely white (83.3%), with smaller percentages of African American (7.2%), Asian (3.7%), and Hispanic (3.2%) residents.
The median household income in Fishkill is approximately $60,000, and the median home value is approximately $250,000. The village has a high rate of homeownership, with approximately 75% of residents owning their own homes.
The village of Fishkill is served by the Wappingers Central School District, which includes several elementary, middle, and high schools. The village is also home to several private schools, including the Fishkill Christian Academy and the Fishkill Montessori School.
Common Questions
What is the Total Population of Fishkill?
Total Population of Fishkill is 2,177.
What is the Total Male Population of Fishkill?
Total Male Population of Fishkill is 1,051.
What is the Total Female Population of Fishkill?
Total Female Population of Fishkill is 1,126.
What is the Ratio of Males per 100 Females in Fishkill?
There are 93.34 Males per 100 Females in Fishkill.
What is the Ratio of Females per 100 Males in Fishkill?
There are 107.14 Females per 100 Males in Fishkill.
What is the Median Population Age in Fishkill?
Median Population Age in Fishkill is 47.1 Years.
What is the Average Family Size in Fishkill
Average Family Size in Fishkill is 2.6 People.
What is the Average Household Size in Fishkill
Average Household Size in Fishkill is 1.9 People.
What is Per Capita Income in Fishkill?
Per Capita income in Fishkill is $53,415.
What is the Median Family Income in Fishkill?
Median Family Income in Fishkill is $105,078.
What is the Median Household income in Fishkill?
Median Household Income in Fishkill is $94,205.
What is Income or Wage Gap in Fishkill?
Income or Wage Gap in Fishkill is 12.2%.
Women in Fishkill earn 87.8 cents for every dollar earned by a man.
What is Inequality or Gini Index in Fishkill?
Inequality or Gini Index in Fishkill is 0.36.
How Large is the Labor Force in Fishkill?
There are 1,270 People in the Labor Forcein in Fishkill.
What is the Percentage of People in the Labor Force in Fishkill?
65.8% of People are in the Labor Force in Fishkill.
What is the Unemployment Rate in Fishkill?
Unemployment Rate in Fishkill is 6.7%.