Cities with the Highest Poverty Level Among Married Couples in Minnesota
RELATED REPORTS & OPTIONS
Highest Poverty | Married Couple
Minnesota
Compare Cities
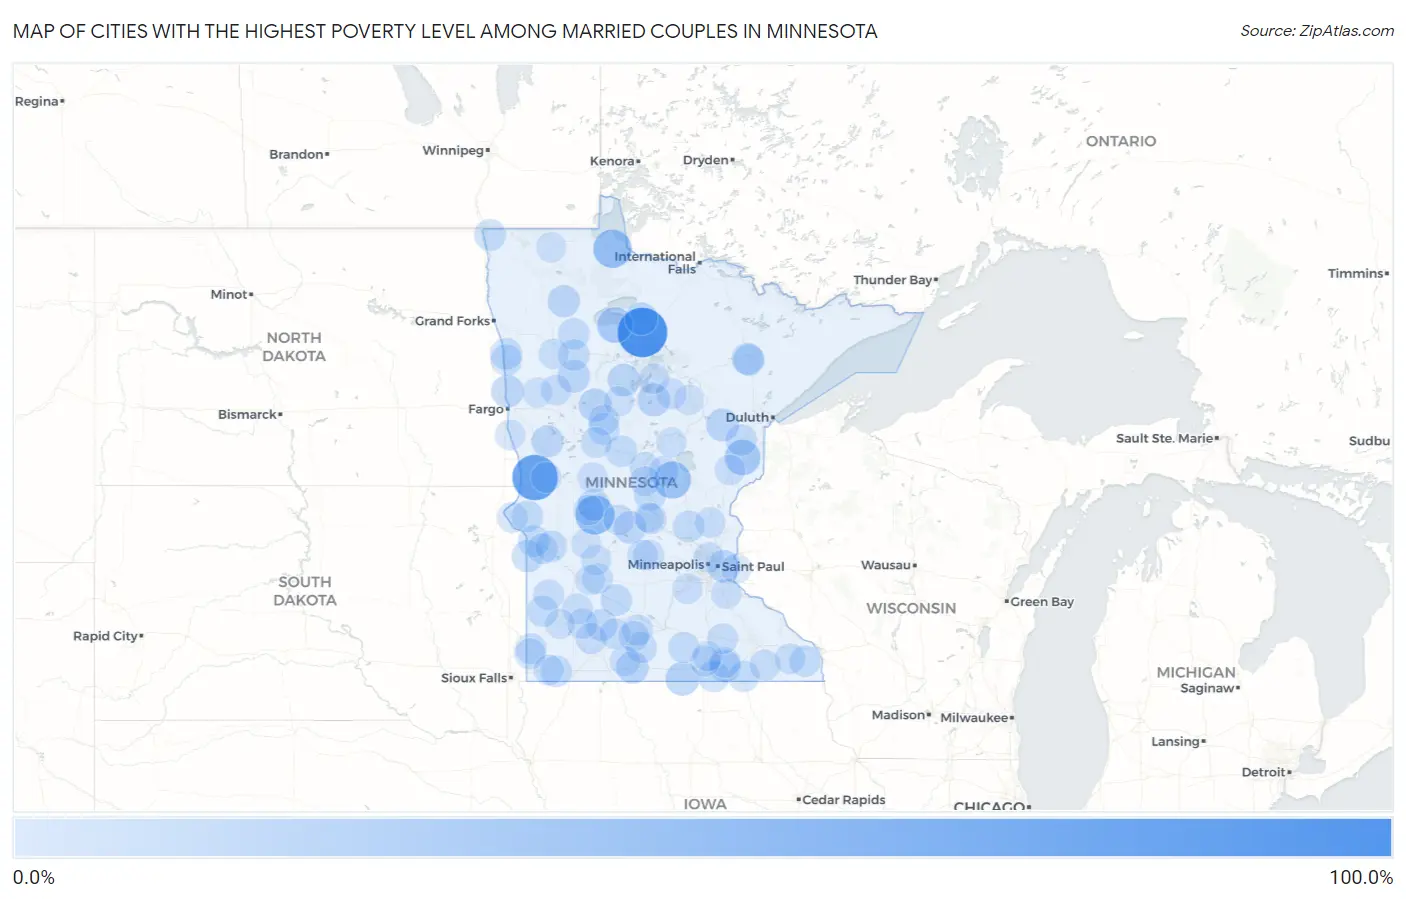
Map of Cities with the Highest Poverty Level Among Married Couples in Minnesota
0.0%
100.0%
Cities with the Highest Poverty Level Among Married Couples in Minnesota
| City | Married Couples Poverty | vs State | vs National | |
| 1. | Funkley | 100.0% | 2.6%(+97.4)#1 | 4.5%(+95.5)#77 |
| 2. | Nashua | 80.0% | 2.6%(+77.4)#2 | 4.5%(+75.5)#131 |
| 3. | Sedan | 50.0% | 2.6%(+47.4)#3 | 4.5%(+45.5)#400 |
| 4. | Williams | 46.2% | 2.6%(+43.6)#4 | 4.5%(+41.7)#463 |
| 5. | Hillman | 40.0% | 2.6%(+37.4)#5 | 4.5%(+35.5)#636 |
| 6. | Redby | 33.3% | 2.6%(+30.8)#6 | 4.5%(+28.9)#866 |
| 7. | Bruno | 33.3% | 2.6%(+30.8)#7 | 4.5%(+28.9)#893 |
| 8. | Kiester | 24.3% | 2.6%(+21.8)#8 | 4.5%(+19.9)#1,509 |
| 9. | Osage | 21.2% | 2.6%(+18.6)#9 | 4.5%(+16.8)#1,886 |
| 10. | Longville | 20.5% | 2.6%(+17.9)#10 | 4.5%(+16.1)#1,984 |
| 11. | Naytahwaush | 20.0% | 2.6%(+17.4)#11 | 4.5%(+15.5)#2,037 |
| 12. | Kelliher | 20.0% | 2.6%(+17.4)#12 | 4.5%(+15.5)#2,041 |
| 13. | Wright | 20.0% | 2.6%(+17.4)#13 | 4.5%(+15.5)#2,065 |
| 14. | Georgetown | 20.0% | 2.6%(+17.4)#14 | 4.5%(+15.5)#2,076 |
| 15. | Landfall | 19.1% | 2.6%(+16.5)#15 | 4.5%(+14.6)#2,193 |
| 16. | Welcome | 18.9% | 2.6%(+16.3)#16 | 4.5%(+14.4)#2,232 |
| 17. | Laporte | 18.8% | 2.6%(+16.2)#17 | 4.5%(+14.3)#2,266 |
| 18. | Roscoe | 18.2% | 2.6%(+15.6)#18 | 4.5%(+13.7)#2,370 |
| 19. | Goodridge | 18.2% | 2.6%(+15.6)#19 | 4.5%(+13.7)#2,373 |
| 20. | Erhard | 17.4% | 2.6%(+14.8)#20 | 4.5%(+12.9)#2,536 |
| 21. | Mapleview | 16.7% | 2.6%(+14.1)#21 | 4.5%(+12.2)#2,697 |
| 22. | Leonidas | 16.7% | 2.6%(+14.1)#22 | 4.5%(+12.2)#2,708 |
| 23. | Nassau | 16.7% | 2.6%(+14.1)#23 | 4.5%(+12.2)#2,710 |
| 24. | Sanborn | 16.5% | 2.6%(+13.9)#24 | 4.5%(+12.0)#2,730 |
| 25. | Villard | 16.4% | 2.6%(+13.8)#25 | 4.5%(+12.0)#2,742 |
| 26. | Myrtle | 15.4% | 2.6%(+12.8)#26 | 4.5%(+10.9)#3,005 |
| 27. | Zimmerman | 15.4% | 2.6%(+12.8)#27 | 4.5%(+10.9)#3,008 |
| 28. | Franklin | 15.3% | 2.6%(+12.7)#28 | 4.5%(+10.8)#3,018 |
| 29. | Royalton | 15.1% | 2.6%(+12.5)#29 | 4.5%(+10.6)#3,068 |
| 30. | Sebeka | 15.1% | 2.6%(+12.5)#30 | 4.5%(+10.6)#3,069 |
| 31. | Odessa | 15.0% | 2.6%(+12.4)#31 | 4.5%(+10.5)#3,090 |
| 32. | Nielsville | 15.0% | 2.6%(+12.4)#32 | 4.5%(+10.5)#3,091 |
| 33. | Staples | 14.7% | 2.6%(+12.2)#33 | 4.5%(+10.3)#3,157 |
| 34. | Adrian | 14.5% | 2.6%(+11.9)#34 | 4.5%(+10.1)#3,224 |
| 35. | Eveleth | 14.4% | 2.6%(+11.9)#35 | 4.5%(+9.98)#3,250 |
| 36. | Barnum | 14.4% | 2.6%(+11.8)#36 | 4.5%(+9.95)#3,256 |
| 37. | Appleton | 14.3% | 2.6%(+11.7)#37 | 4.5%(+9.82)#3,278 |
| 38. | Gully | 14.3% | 2.6%(+11.7)#38 | 4.5%(+9.82)#3,329 |
| 39. | Lengby | 14.3% | 2.6%(+11.7)#39 | 4.5%(+9.82)#3,330 |
| 40. | Humboldt | 14.3% | 2.6%(+11.7)#40 | 4.5%(+9.82)#3,333 |
| 41. | Graceville | 14.2% | 2.6%(+11.6)#41 | 4.5%(+9.72)#3,355 |
| 42. | Shelly | 13.8% | 2.6%(+11.2)#42 | 4.5%(+9.33)#3,462 |
| 43. | Lewisville | 13.5% | 2.6%(+10.9)#43 | 4.5%(+9.05)#3,553 |
| 44. | Arco | 13.3% | 2.6%(+10.8)#44 | 4.5%(+8.87)#3,637 |
| 45. | Waldorf | 12.9% | 2.6%(+10.3)#45 | 4.5%(+8.44)#3,786 |
| 46. | Houston | 12.7% | 2.6%(+10.2)#46 | 4.5%(+8.27)#3,849 |
| 47. | Ihlen | 12.5% | 2.6%(+9.93)#47 | 4.5%(+8.04)#3,966 |
| 48. | Taopi | 12.5% | 2.6%(+9.93)#48 | 4.5%(+8.04)#3,974 |
| 49. | Jasper | 12.3% | 2.6%(+9.69)#49 | 4.5%(+7.80)#4,052 |
| 50. | Waite Park | 12.2% | 2.6%(+9.58)#50 | 4.5%(+7.69)#4,095 |
| 51. | Storden | 12.1% | 2.6%(+9.50)#51 | 4.5%(+7.61)#4,144 |
| 52. | Beardsley | 12.0% | 2.6%(+9.43)#52 | 4.5%(+7.54)#4,179 |
| 53. | Taunton | 12.0% | 2.6%(+9.43)#53 | 4.5%(+7.54)#4,182 |
| 54. | Hanska | 11.9% | 2.6%(+9.37)#54 | 4.5%(+7.48)#4,204 |
| 55. | Menahga | 11.9% | 2.6%(+9.29)#55 | 4.5%(+7.40)#4,230 |
| 56. | Wykoff | 11.8% | 2.6%(+9.27)#56 | 4.5%(+7.38)#4,247 |
| 57. | Bluffton | 11.8% | 2.6%(+9.19)#57 | 4.5%(+7.30)#4,289 |
| 58. | Fort Ripley | 11.8% | 2.6%(+9.19)#58 | 4.5%(+7.30)#4,298 |
| 59. | Dassel | 11.7% | 2.6%(+9.09)#59 | 4.5%(+7.20)#4,330 |
| 60. | Lansing | 11.5% | 2.6%(+8.97)#60 | 4.5%(+7.08)#4,394 |
| 61. | Peterson | 11.4% | 2.6%(+8.79)#61 | 4.5%(+6.90)#4,459 |
| 62. | Claremont | 11.3% | 2.6%(+8.77)#62 | 4.5%(+6.88)#4,474 |
| 63. | Renville | 11.2% | 2.6%(+8.63)#63 | 4.5%(+6.74)#4,532 |
| 64. | Ogema | 11.1% | 2.6%(+8.54)#64 | 4.5%(+6.65)#4,586 |
| 65. | Spring Hill | 11.1% | 2.6%(+8.54)#65 | 4.5%(+6.65)#4,608 |
| 66. | La Salle | 11.1% | 2.6%(+8.54)#66 | 4.5%(+6.65)#4,616 |
| 67. | Louisburg | 11.1% | 2.6%(+8.54)#67 | 4.5%(+6.65)#4,622 |
| 68. | Clarks Grove | 11.0% | 2.6%(+8.47)#68 | 4.5%(+6.58)#4,636 |
| 69. | Comfrey | 11.0% | 2.6%(+8.39)#69 | 4.5%(+6.50)#4,674 |
| 70. | Milroy | 10.9% | 2.6%(+8.34)#70 | 4.5%(+6.45)#4,708 |
| 71. | Wendell | 10.8% | 2.6%(+8.24)#71 | 4.5%(+6.35)#4,757 |
| 72. | Miltona | 10.8% | 2.6%(+8.18)#72 | 4.5%(+6.29)#4,782 |
| 73. | Hilltop | 10.7% | 2.6%(+8.14)#73 | 4.5%(+6.25)#4,798 |
| 74. | Harding | 10.7% | 2.6%(+8.14)#74 | 4.5%(+6.25)#4,811 |
| 75. | Isanti | 10.7% | 2.6%(+8.09)#75 | 4.5%(+6.20)#4,841 |
| 76. | Remer | 10.6% | 2.6%(+8.07)#76 | 4.5%(+6.18)#4,856 |
| 77. | Federal Dam | 10.5% | 2.6%(+7.95)#77 | 4.5%(+6.06)#4,930 |
| 78. | Walnut Grove | 10.4% | 2.6%(+7.86)#78 | 4.5%(+5.97)#4,986 |
| 79. | Magnolia | 10.3% | 2.6%(+7.68)#79 | 4.5%(+5.79)#5,097 |
| 80. | Wolverton | 10.0% | 2.6%(+7.43)#80 | 4.5%(+5.54)#5,267 |
| 81. | New Trier | 10.0% | 2.6%(+7.43)#81 | 4.5%(+5.54)#5,278 |
| 82. | Jordan | 9.8% | 2.6%(+7.27)#82 | 4.5%(+5.38)#5,359 |
| 83. | Winger | 9.7% | 2.6%(+7.11)#83 | 4.5%(+5.22)#5,470 |
| 84. | Raymond | 9.6% | 2.6%(+7.01)#84 | 4.5%(+5.12)#5,521 |
| 85. | Little Falls | 9.5% | 2.6%(+6.97)#85 | 4.5%(+5.08)#5,542 |
| 86. | Glenwood | 9.5% | 2.6%(+6.97)#86 | 4.5%(+5.08)#5,543 |
| 87. | Darwin | 9.5% | 2.6%(+6.95)#87 | 4.5%(+5.06)#5,561 |
| 88. | Sandstone | 9.5% | 2.6%(+6.90)#88 | 4.5%(+5.01)#5,596 |
| 89. | Trimont | 9.4% | 2.6%(+6.88)#89 | 4.5%(+4.99)#5,616 |
| 90. | St Marys Point | 9.3% | 2.6%(+6.77)#90 | 4.5%(+4.88)#5,691 |
| 91. | Hill City | 9.3% | 2.6%(+6.73)#91 | 4.5%(+4.84)#5,711 |
| 92. | St Joseph | 9.3% | 2.6%(+6.71)#92 | 4.5%(+4.82)#5,723 |
| 93. | Balaton | 9.0% | 2.6%(+6.44)#93 | 4.5%(+4.55)#5,974 |
| 94. | Deerwood | 8.9% | 2.6%(+6.32)#94 | 4.5%(+4.43)#6,053 |
| 95. | Murdock | 8.9% | 2.6%(+6.32)#95 | 4.5%(+4.43)#6,057 |
| 96. | Ulen | 8.8% | 2.6%(+6.25)#96 | 4.5%(+4.36)#6,109 |
| 97. | Nevis | 8.8% | 2.6%(+6.22)#97 | 4.5%(+4.33)#6,130 |
| 98. | Geneva | 8.7% | 2.6%(+6.18)#98 | 4.5%(+4.29)#6,160 |
| 99. | Sacred Heart | 8.7% | 2.6%(+6.17)#99 | 4.5%(+4.28)#6,169 |
| 100. | Badger | 8.6% | 2.6%(+6.05)#100 | 4.5%(+4.16)#6,248 |
Common Questions
What are the Top 10 Cities with the Highest Poverty Level Among Married Couples in Minnesota?
Top 10 Cities with the Highest Poverty Level Among Married Couples in Minnesota are:
What city has the Highest Poverty Level Among Married Couples in Minnesota?
Funkley has the Highest Poverty Level Among Married Couples in Minnesota with 100.0%.
What is the Poverty Level Among Married Couples in the State of Minnesota?
Poverty Level Among Married Couples in Minnesota is 2.6%.
What is the Poverty Level Among Married Couples in the United States?
Poverty Level Among Married Couples in the United States is 4.5%.