Cities with the Highest Percentage of Immigrants from Poland in Minnesota

RELATED REPORTS & OPTIONS

Poland
Population
Families and Households
Female Fertility
Female Fertility (Unmarried)
Race (Community Size)
Race (Percentage)
Ancestry (Community Size)
AfghanAfricanAlaska NativeAlaskan AthabascanAlbanianAleutAlsatianAmericanApacheArabArapahoArgentineanArmenianAssyrian / Chaldean / SyriacAustralianAustrianBahamianBangladeshiBarbadianBasqueBelgianBelizeanBermudanBhutaneseBlackfeetBolivianBrazilianBritishBritish West IndianBulgarianBurmeseCajunCambodianCanadianCape VerdeanCarpatho RusynCelticCentral AmericanCentral American IndianCherokeeCheyenneChickasawChileanChineseChippewaChoctawColombianColvilleComancheCosta RicanCreeCreekCroatianCrowCubanCypriotCzechCzechoslovakianDanishDelawareDominicanDutchDutch West IndianEastern EuropeanEcuadorianEgyptianEnglishEstonianEthiopianEuropeanFijianFilipinoFinnishFrenchFrench American IndianFrench CanadianGermanGerman RussianGhanaianGreekGuamanian / ChamorroGuatemalanGuyaneseHaitianHmongHonduranHopiHoumaHungarianIcelanderIndian (Asian)IndonesianInupiatIranianIraqiIrishIroquoisIsraeliItalianJamaicanJapaneseJordanianKenyanKiowaKoreanLaotianLatvianLebaneseLiberianLithuanianLumbeeLuxembourgerMacedonianMalaysianMalteseMarshalleseMenomineeMexicanMexican American IndianMongolianMoroccanNative HawaiianNavajoNepaleseNew ZealanderNicaraguanNigerianNorthern EuropeanNorwegianOkinawanOsageOttawaPaiutePakistaniPalestinianPanamanianParaguayanPennsylvania GermanPeruvianPimaPolishPortuguesePotawatomiPuebloPuerto RicanPuget Sound SalishRomanianRussianSalvadoranSamoanScandinavianScotch-IrishScottishSeminoleSenegaleseSerbianShoshoneSierra LeoneanSiouxSlavicSlovakSloveneSomaliSouth AfricanSouth AmericanSouth American IndianSoviet UnionSpaniardSpanishSpanish AmericanSpanish American IndianSri LankanSubsaharan AfricanSudaneseSwedishSwissSyrianTaiwaneseThaiTlingit-HaidaTohono O'OdhamTonganTrinidadian and TobagonianTsimshianTurkishU.S. Virgin IslanderUgandanUkrainianUruguayanUteVenezuelanVietnameseWelshWest IndianYakamaYaquiYugoslavianYumanYup'ikZimbabwean
Ancestry (Percentage)
AfghanAfricanAlaska NativeAlaskan AthabascanAlbanianAleutAlsatianAmericanApacheArabArapahoArgentineanArmenianAssyrian / Chaldean / SyriacAustralianAustrianBahamianBangladeshiBarbadianBasqueBelgianBelizeanBermudanBhutaneseBlackfeetBolivianBrazilianBritishBritish West IndianBulgarianBurmeseCajunCambodianCanadianCape VerdeanCarpatho RusynCelticCentral AmericanCentral American IndianCherokeeCheyenneChickasawChileanChineseChippewaChoctawColombianColvilleComancheCosta RicanCreeCreekCroatianCrowCubanCypriotCzechCzechoslovakianDanishDelawareDominicanDutchDutch West IndianEastern EuropeanEcuadorianEgyptianEnglishEstonianEthiopianEuropeanFijianFilipinoFinnishFrenchFrench American IndianFrench CanadianGermanGerman RussianGhanaianGreekGuamanian / ChamorroGuatemalanGuyaneseHaitianHmongHonduranHopiHoumaHungarianIcelanderIndian (Asian)IndonesianInupiatIranianIraqiIrishIroquoisIsraeliItalianJamaicanJapaneseJordanianKenyanKiowaKoreanLaotianLatvianLebaneseLiberianLithuanianLumbeeLuxembourgerMacedonianMalaysianMalteseMarshalleseMenomineeMexicanMexican American IndianMongolianMoroccanNative HawaiianNavajoNepaleseNew ZealanderNicaraguanNigerianNorthern EuropeanNorwegianOkinawanOsageOttawaPaiutePakistaniPalestinianPanamanianParaguayanPennsylvania GermanPeruvianPimaPolishPortuguesePotawatomiPuebloPuerto RicanPuget Sound SalishRomanianRussianSalvadoranSamoanScandinavianScotch-IrishScottishSeminoleSenegaleseSerbianShoshoneSierra LeoneanSiouxSlavicSlovakSloveneSomaliSouth AfricanSouth AmericanSouth American IndianSoviet UnionSpaniardSpanishSpanish AmericanSpanish American IndianSri LankanSubsaharan AfricanSudaneseSwedishSwissSyrianTaiwaneseThaiTlingit-HaidaTohono O'OdhamTonganTrinidadian and TobagonianTsimshianTurkishU.S. Virgin IslanderUgandanUkrainianUruguayanUteVenezuelanVietnameseWelshWest IndianYakamaYaquiYugoslavianYumanYup'ikZimbabwean
Immigrant Origin (Total)
AfghanistanAfricaAlbaniaArgentinaArmeniaAsiaAustraliaAustriaAzoresBahamasBangladeshBarbadosBelarusBelgiumBelizeBoliviaBosnia and HerzegovinaBrazilBulgariaBurma / MyanmarCabo VerdeCambodiaCameroonCanadaCaribbeanCentral AmericaChileChinaColombiaCongoCosta RicaCroatiaCubaCzechoslovakiaDenmarkDominicaDominican RepublicEastern AfricaEastern AsiaEastern EuropeEcuadorEgyptEl SalvadorEnglandEritreaEthiopiaEuropeFijiFranceGermanyGhanaGreeceGrenadaGuatemalaGuyanaHaitiHondurasHong KongHungaryIndiaIndonesiaIranIraqIrelandIsraelItalyJamaicaJapanJordanKazakhstanKenyaKoreaKuwaitLaosLatin AmericaLatviaLebanonLiberiaLithuaniaMalaysiaMexicoMicronesiaMiddle AfricaMoldovaMoroccoNepalNetherlandsNicaraguaNigeriaNorth MacedoniaNorthern AfricaNorthern EuropeNorwayOceaniaPakistanPanamaPeruPhilippinesPolandPortugalRomaniaRussiaSaudi ArabiaScotlandSenegalSerbiaSierra LeoneSingaporeSomaliaSouth AfricaSouth AmericaSouth Central AsiaSouth Eastern AsiaSouthern EuropeSpainSri LankaSt. Vincent and the GrenadinesSudanSwedenSwitzerlandSyriaTaiwanThailandTrinidad and TobagoTurkeyUgandaUkraineUruguayUzbekistanVenezuelaVietnamWest IndiesWestern AfricaWestern AsiaWestern EuropeYemenZaireZimbabwe
Immigrant Origin (Percentage)
AfghanistanAfricaAlbaniaArgentinaArmeniaAsiaAustraliaAustriaAzoresBahamasBangladeshBarbadosBelarusBelgiumBelizeBoliviaBosnia and HerzegovinaBrazilBulgariaBurma / MyanmarCabo VerdeCambodiaCameroonCanadaCaribbeanCentral AmericaChileChinaColombiaCongoCosta RicaCroatiaCubaCzechoslovakiaDenmarkDominicaDominican RepublicEastern AfricaEastern AsiaEastern EuropeEcuadorEgyptEl SalvadorEnglandEritreaEthiopiaEuropeFijiFranceGermanyGhanaGreeceGrenadaGuatemalaGuyanaHaitiHondurasHong KongHungaryIndiaIndonesiaIranIraqIrelandIsraelItalyJamaicaJapanJordanKazakhstanKenyaKoreaKuwaitLaosLatin AmericaLatviaLebanonLiberiaLithuaniaMalaysiaMexicoMicronesiaMiddle AfricaMoldovaMoroccoNepalNetherlandsNicaraguaNigeriaNorth MacedoniaNorthern AfricaNorthern EuropeNorwayOceaniaPakistanPanamaPeruPhilippinesPolandPortugalRomaniaRussiaSaudi ArabiaScotlandSenegalSerbiaSierra LeoneSingaporeSomaliaSouth AfricaSouth AmericaSouth Central AsiaSouth Eastern AsiaSouthern EuropeSpainSri LankaSt. Vincent and the GrenadinesSudanSwedenSwitzerlandSyriaTaiwanThailandTrinidad and TobagoTurkeyUgandaUkraineUruguayUzbekistanVenezuelaVietnamWest IndiesWestern AfricaWestern AsiaWestern EuropeYemenZaireZimbabwe
Income
Income (Families)
Income (Households)
Poverty
Poverty (Families)
Unemployment
Employment Occupations
Employment Industries
Employer Class
Commute Time
Commute Means
School Enrollment
Education by Degree Field
Occupancy
Finances
Physical Characteristics
Minnesota
Compare Cities
Comparison Subject

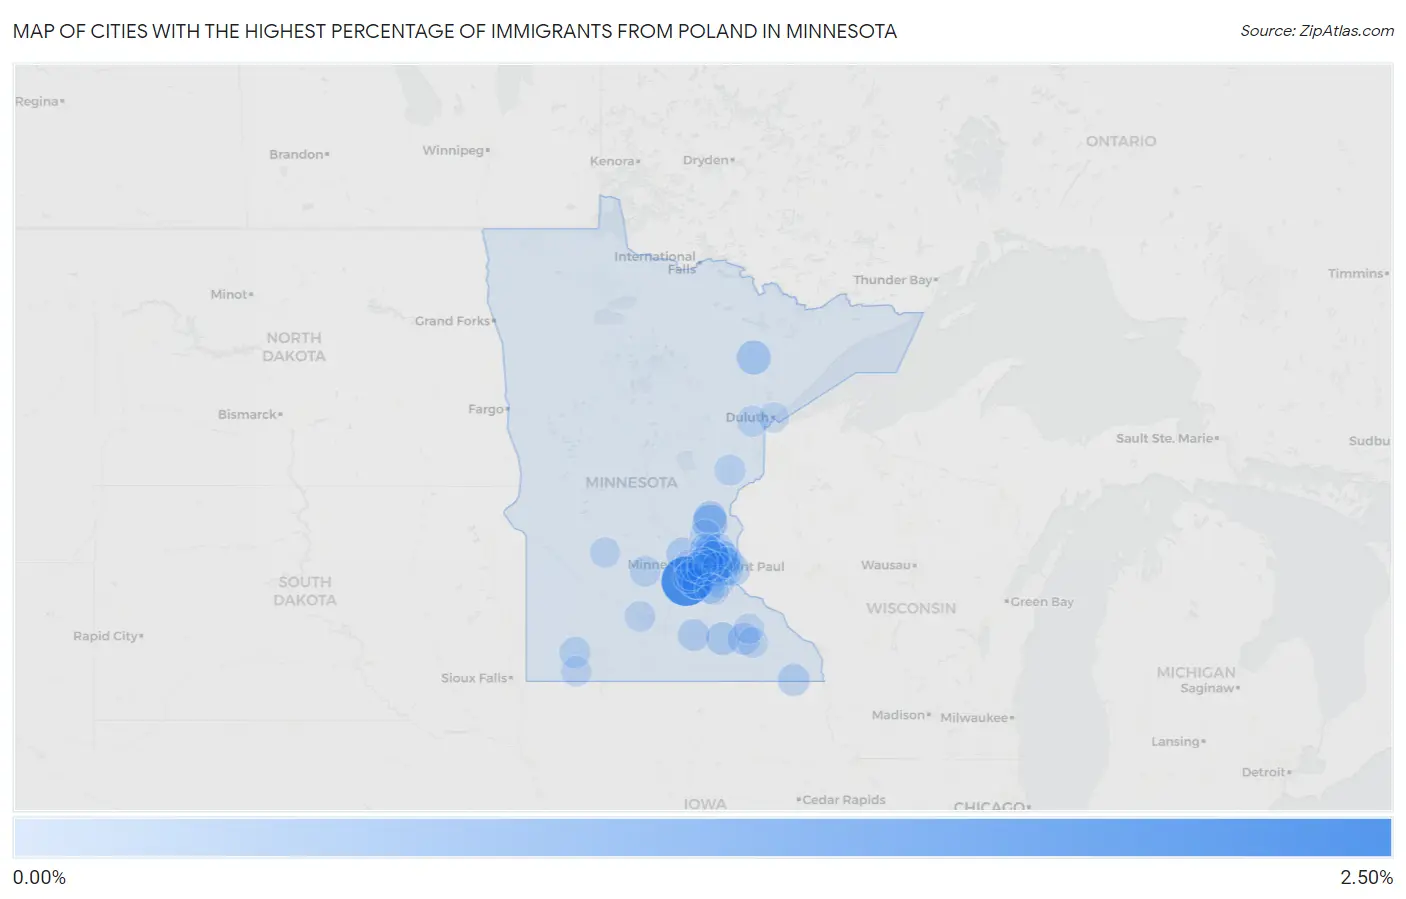
Map of Cities with the Highest Percentage of Immigrants from Poland in Minnesota

0.00%
2.50%
Cities with the Highest Percentage of Immigrants from Poland in Minnesota Map

Cities with the Highest Percentage of Immigrants from Poland in Minnesota

City Poland vs State vs National
1.Carver2.48%0.033%(+2.44)#10.12%(+2.35)#145
2.Shakopee0.67%0.033%(+0.640)#20.12%(+0.549)#605
3.Isanti0.64%0.033%(+0.609)#30.12%(+0.519)#629
4.Gilbert0.49%0.033%(+0.461)#40.12%(+0.371)#809
5.Claremont0.36%0.033%(+0.329)#50.12%(+0.239)#1,064
6.Cambridge0.33%0.033%(+0.296)#60.12%(+0.206)#1,146
7.Greenfield0.28%0.033%(+0.242)#70.12%(+0.152)#1,326
8.Afton0.27%0.033%(+0.238)#80.12%(+0.148)#1,342
9.Spring Lake Park0.26%0.033%(+0.225)#90.12%(+0.135)#1,393
10.Byron0.25%0.033%(+0.218)#100.12%(+0.128)#1,422
11.Mabel0.25%0.033%(+0.216)#110.12%(+0.126)#1,431
12.Waseca0.23%0.033%(+0.195)#120.12%(+0.105)#1,520
13.Mahtomedi0.21%0.033%(+0.178)#130.12%(+0.087)#1,603
14.Maplewood0.16%0.033%(+0.129)#140.12%(+0.038)#1,836
15.Eagan0.15%0.033%(+0.121)#150.12%(+0.030)#1,886
16.Fulda0.15%0.033%(+0.112)#160.12%(+0.022)#1,939
17.Woodbury0.14%0.033%(+0.111)#170.12%(+0.021)#1,943
18.Mounds View0.13%0.033%(+0.097)#180.12%(+0.006)#2,016
19.Mendota Heights0.13%0.033%(+0.096)#190.12%(+0.005)#2,023
20.Cloquet0.12%0.033%(+0.087)#200.12%(-0.004)#2,059
21.Blaine0.12%0.033%(+0.086)#210.12%(-0.005)#2,066
22.Sandstone0.12%0.033%(+0.084)#220.12%(-0.007)#2,081
23.Hutchinson0.12%0.033%(+0.084)#230.12%(-0.007)#2,084
24.Lake Elmo0.11%0.033%(+0.077)#240.12%(-0.014)#2,137
25.Orono0.11%0.033%(+0.077)#250.12%(-0.014)#2,141
26.New Ulm0.100%0.033%(+0.067)#260.12%(-0.024)#2,207
27.White Bear Lake0.099%0.033%(+0.066)#270.12%(-0.025)#2,215
28.Fridley0.098%0.033%(+0.065)#280.12%(-0.026)#2,228
29.Shoreview0.093%0.033%(+0.060)#290.12%(-0.030)#2,266
30.Oak Grove0.089%0.033%(+0.056)#300.12%(-0.034)#2,291
31.Lino Lakes0.084%0.033%(+0.051)#310.12%(-0.040)#2,343
32.Oakdale0.082%0.033%(+0.049)#320.12%(-0.041)#2,361
33.St Anthony City Hennepin And Ramsey Counties0.075%0.033%(+0.042)#330.12%(-0.048)#2,428
34.Worthington0.072%0.033%(+0.039)#340.12%(-0.051)#2,460
35.Arden Hills0.071%0.033%(+0.038)#350.12%(-0.052)#2,468
36.Rochester0.071%0.033%(+0.038)#360.12%(-0.052)#2,471
37.Prior Lake0.069%0.033%(+0.036)#370.12%(-0.055)#2,497
38.Rosemount0.065%0.033%(+0.032)#380.12%(-0.058)#2,530
39.Coon Rapids0.062%0.033%(+0.029)#390.12%(-0.062)#2,567
40.Duluth0.061%0.033%(+0.028)#400.12%(-0.062)#2,573
41.Farmington0.060%0.033%(+0.027)#410.12%(-0.064)#2,588
42.Oronoco0.059%0.033%(+0.026)#420.12%(-0.065)#2,594
43.Chaska0.047%0.033%(+0.014)#430.12%(-0.077)#2,729
44.Willmar0.043%0.033%(+0.010)#440.12%(-0.081)#2,787
45.Chanhassen0.043%0.033%(+0.010)#450.12%(-0.081)#2,790
46.Minnetonka0.035%0.033%(+0.003)#460.12%(-0.088)#2,878
47.Edina0.032%0.033%(-0.001)#470.12%(-0.091)#2,919
48.St Paul0.031%0.033%(-0.002)#480.12%(-0.092)#2,934
49.Minneapolis0.030%0.033%(-0.003)#490.12%(-0.094)#2,956
50.Golden Valley0.023%0.033%(-0.010)#500.12%(-0.101)#3,049
51.Lakeville0.018%0.033%(-0.015)#510.12%(-0.105)#3,110

Common Questions

What are the Top 10 Cities with the Highest Percentage of Immigrants from Poland in Minnesota?
Top 10 Cities with the Highest Percentage of Immigrants from Poland in Minnesota are:
#1
2.48%
#2
0.67%
#3
0.64%
#4
0.49%
#5
0.36%
#6
0.33%
#7
0.28%
#8
0.27%
#9
0.26%
#10
0.25%
What city has the Highest Percentage of Immigrants from Poland in Minnesota?
Carver has the Highest Percentage of Immigrants from Poland in Minnesota with 2.48%.
What is the Percentage of Immigrants from Poland in the State of Minnesota?
Percentage of Immigrants from Poland in Minnesota is 0.033%.
What is the Percentage of Immigrants from Poland in the United States?
Percentage of Immigrants from Poland in the United States is 0.12%.