Cities with the Highest Percentage of Immigrants from Western Asia in Minnesota
RELATED REPORTS & OPTIONS
Western Asia
Minnesota
Compare Cities
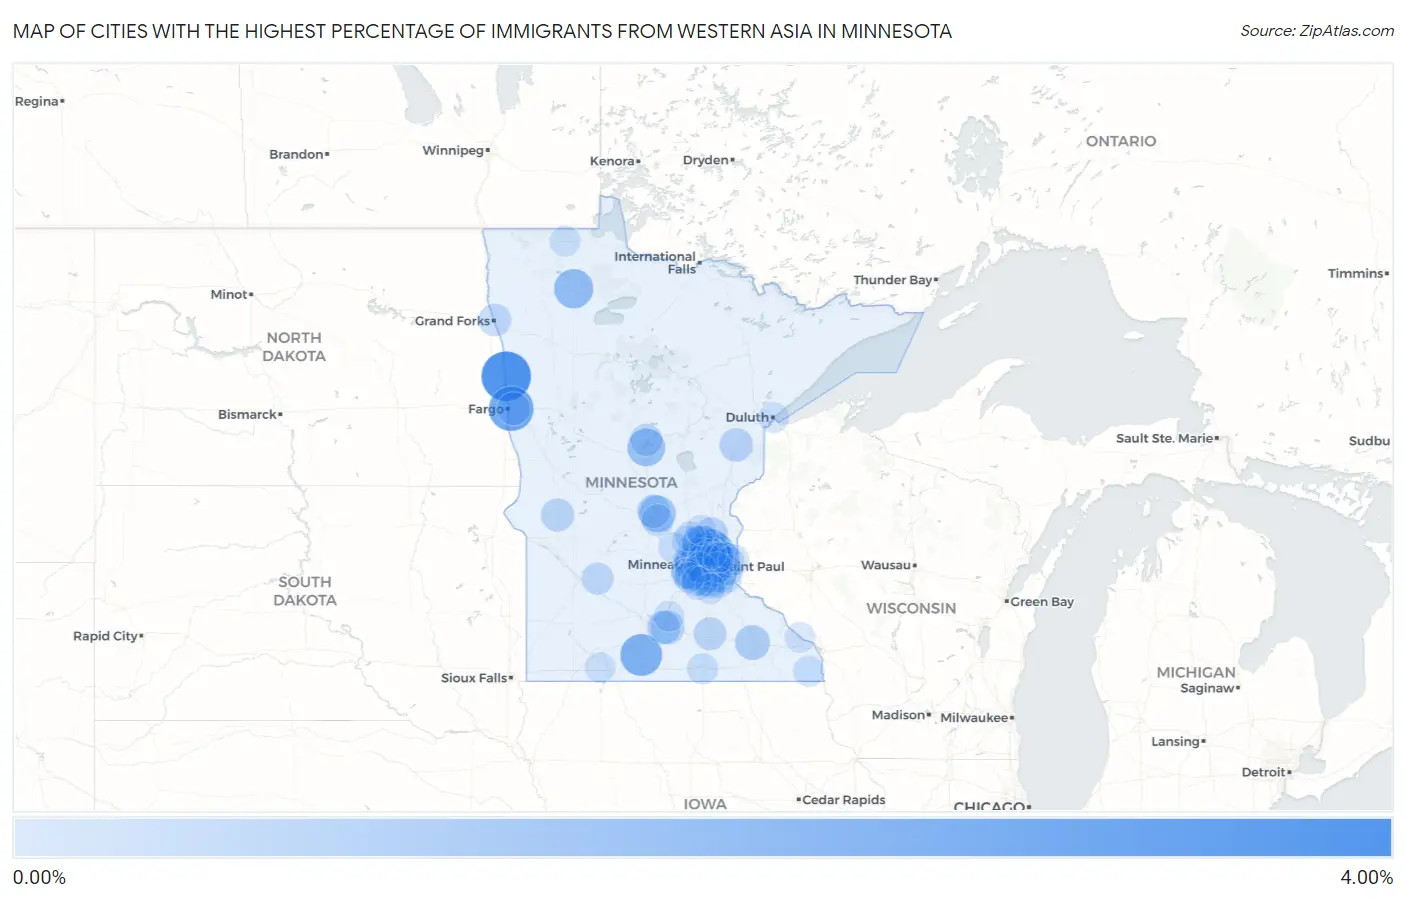
Map of Cities with the Highest Percentage of Immigrants from Western Asia in Minnesota
0.00%
4.00%
Cities with the Highest Percentage of Immigrants from Western Asia in Minnesota
| City | Western Asia | vs State | vs National | |
| 1. | Hendrum | 3.05% | 0.17%(+2.88)#-1 | 0.36%(+2.69)#0 |
| 2. | Hilltop | 2.39% | 0.17%(+2.22)#0 | 0.36%(+2.02)#1 |
| 3. | Moorhead | 2.25% | 0.17%(+2.08)#1 | 0.36%(+1.89)#2 |
| 4. | Truman | 1.81% | 0.17%(+1.64)#2 | 0.36%(+1.45)#3 |
| 5. | Grygla | 1.39% | 0.17%(+1.22)#3 | 0.36%(+1.03)#4 |
| 6. | Blaine | 1.36% | 0.17%(+1.18)#4 | 0.36%(+0.994)#5 |
| 7. | Anoka | 1.21% | 0.17%(+1.04)#5 | 0.36%(+0.849)#6 |
| 8. | Circle Pines | 1.18% | 0.17%(+1.01)#6 | 0.36%(+0.817)#7 |
| 9. | East Gull Lake | 1.17% | 0.17%(+0.996)#7 | 0.36%(+0.805)#8 |
| 10. | Shorewood | 1.04% | 0.17%(+0.863)#8 | 0.36%(+0.672)#9 |
| 11. | Sauk Rapids | 0.99% | 0.17%(+0.818)#9 | 0.36%(+0.627)#10 |
| 12. | Rochester | 0.72% | 0.17%(+0.543)#10 | 0.36%(+0.352)#11 |
| 13. | Long Lake | 0.58% | 0.17%(+0.411)#11 | 0.36%(+0.220)#12 |
| 14. | Mankato | 0.57% | 0.17%(+0.401)#12 | 0.36%(+0.210)#13 |
| 15. | Golden Valley | 0.53% | 0.17%(+0.356)#13 | 0.36%(+0.165)#14 |
| 16. | Moose Lake | 0.52% | 0.17%(+0.345)#14 | 0.36%(+0.154)#15 |
| 17. | North Mankato | 0.50% | 0.17%(+0.326)#15 | 0.36%(+0.135)#16 |
| 18. | Falcon Heights | 0.50% | 0.17%(+0.324)#16 | 0.36%(+0.133)#17 |
| 19. | Lexington | 0.49% | 0.17%(+0.317)#17 | 0.36%(+0.127)#18 |
| 20. | Fridley | 0.49% | 0.17%(+0.315)#18 | 0.36%(+0.124)#19 |
| 21. | Sartell | 0.47% | 0.17%(+0.302)#19 | 0.36%(+0.111)#20 |
| 22. | Dilworth | 0.45% | 0.17%(+0.282)#20 | 0.36%(+0.091)#21 |
| 23. | Morris | 0.45% | 0.17%(+0.279)#21 | 0.36%(+0.088)#22 |
| 24. | East Bethel | 0.45% | 0.17%(+0.273)#22 | 0.36%(+0.082)#23 |
| 25. | Lauderdale | 0.41% | 0.17%(+0.235)#23 | 0.36%(+0.044)#24 |
| 26. | Owatonna | 0.41% | 0.17%(+0.233)#24 | 0.36%(+0.042)#25 |
| 27. | Lilydale | 0.39% | 0.17%(+0.221)#25 | 0.36%(+0.031)#26 |
| 28. | Burnsville | 0.39% | 0.17%(+0.219)#26 | 0.36%(+0.028)#27 |
| 29. | Coon Rapids | 0.39% | 0.17%(+0.217)#27 | 0.36%(+0.027)#28 |
| 30. | Spring Lake Park | 0.39% | 0.17%(+0.215)#28 | 0.36%(+0.024)#29 |
| 31. | Medina | 0.39% | 0.17%(+0.213)#29 | 0.36%(+0.022)#30 |
| 32. | East Grand Forks | 0.37% | 0.17%(+0.200)#30 | 0.36%(+0.009)#31 |
| 33. | Columbia Heights | 0.37% | 0.17%(+0.194)#31 | 0.36%(+0.003)#32 |
| 34. | Minneapolis | 0.35% | 0.17%(+0.178)#32 | 0.36%(-0.013)#33 |
| 35. | Lake Shore | 0.34% | 0.17%(+0.170)#33 | 0.36%(-0.021)#34 |
| 36. | Plymouth | 0.30% | 0.17%(+0.128)#34 | 0.36%(-0.063)#35 |
| 37. | Renville | 0.29% | 0.17%(+0.114)#35 | 0.36%(-0.077)#36 |
| 38. | Minnetonka | 0.28% | 0.17%(+0.111)#36 | 0.36%(-0.080)#37 |
| 39. | Eagan | 0.27% | 0.17%(+0.092)#37 | 0.36%(-0.099)#38 |
| 40. | Andover | 0.26% | 0.17%(+0.091)#38 | 0.36%(-0.100)#39 |
| 41. | Inver Grove Heights | 0.26% | 0.17%(+0.088)#39 | 0.36%(-0.103)#40 |
| 42. | Eden Prairie | 0.25% | 0.17%(+0.076)#40 | 0.36%(-0.115)#41 |
| 43. | Bloomington | 0.24% | 0.17%(+0.070)#41 | 0.36%(-0.121)#42 |
| 44. | Prior Lake | 0.24% | 0.17%(+0.066)#42 | 0.36%(-0.125)#43 |
| 45. | Medicine Lake | 0.24% | 0.17%(+0.066)#43 | 0.36%(-0.125)#44 |
| 46. | St Cloud | 0.24% | 0.17%(+0.065)#44 | 0.36%(-0.126)#45 |
| 47. | Cottage Grove | 0.23% | 0.17%(+0.054)#45 | 0.36%(-0.137)#46 |
| 48. | White Bear Lake | 0.22% | 0.17%(+0.045)#46 | 0.36%(-0.146)#47 |
| 49. | Apple Valley | 0.22% | 0.17%(+0.045)#47 | 0.36%(-0.146)#48 |
| 50. | Roseville | 0.21% | 0.17%(+0.038)#48 | 0.36%(-0.153)#49 |
| 51. | Mendota Heights | 0.21% | 0.17%(+0.033)#49 | 0.36%(-0.158)#50 |
| 52. | Maple Grove | 0.20% | 0.17%(+0.031)#50 | 0.36%(-0.160)#51 |
| 53. | New Brighton | 0.20% | 0.17%(+0.030)#51 | 0.36%(-0.161)#52 |
| 54. | Lake Elmo | 0.19% | 0.17%(+0.021)#52 | 0.36%(-0.170)#53 |
| 55. | St Louis Park | 0.17% | 0.17%(-0.005)#53 | 0.36%(-0.196)#54 |
| 56. | Edina | 0.17% | 0.17%(-0.007)#54 | 0.36%(-0.198)#55 |
| 57. | Chanhassen | 0.15% | 0.17%(-0.018)#55 | 0.36%(-0.209)#56 |
| 58. | Brooklyn Park | 0.15% | 0.17%(-0.022)#56 | 0.36%(-0.213)#57 |
| 59. | Brooklyn Center | 0.15% | 0.17%(-0.025)#57 | 0.36%(-0.216)#58 |
| 60. | Ramsey | 0.14% | 0.17%(-0.029)#58 | 0.36%(-0.220)#59 |
| 61. | Crystal | 0.14% | 0.17%(-0.029)#59 | 0.36%(-0.220)#60 |
| 62. | Caledonia | 0.14% | 0.17%(-0.031)#60 | 0.36%(-0.222)#61 |
| 63. | Otsego | 0.14% | 0.17%(-0.036)#61 | 0.36%(-0.227)#62 |
| 64. | Albert Lea | 0.14% | 0.17%(-0.037)#62 | 0.36%(-0.228)#63 |
| 65. | Woodbury | 0.12% | 0.17%(-0.048)#63 | 0.36%(-0.239)#64 |
| 66. | Buffalo | 0.12% | 0.17%(-0.056)#64 | 0.36%(-0.247)#65 |
| 67. | Mahtomedi | 0.11% | 0.17%(-0.061)#65 | 0.36%(-0.252)#66 |
| 68. | Roseau | 0.11% | 0.17%(-0.063)#66 | 0.36%(-0.254)#67 |
| 69. | St Anthony City Hennepin And Ramsey Counties | 0.11% | 0.17%(-0.066)#67 | 0.36%(-0.257)#68 |
| 70. | Oak Park Heights | 0.10% | 0.17%(-0.068)#68 | 0.36%(-0.259)#69 |
| 71. | Victoria | 0.10% | 0.17%(-0.070)#69 | 0.36%(-0.261)#70 |
| 72. | St Paul | 0.098% | 0.17%(-0.075)#70 | 0.36%(-0.266)#71 |
| 73. | Rosemount | 0.096% | 0.17%(-0.077)#71 | 0.36%(-0.267)#72 |
| 74. | Hopkins | 0.085% | 0.17%(-0.087)#72 | 0.36%(-0.278)#73 |
| 75. | St Peter | 0.075% | 0.17%(-0.098)#73 | 0.36%(-0.289)#74 |
| 76. | Winona | 0.069% | 0.17%(-0.104)#74 | 0.36%(-0.295)#75 |
| 77. | Savage | 0.068% | 0.17%(-0.105)#75 | 0.36%(-0.296)#76 |
| 78. | Duluth | 0.065% | 0.17%(-0.108)#76 | 0.36%(-0.299)#77 |
| 79. | Lakefield | 0.061% | 0.17%(-0.111)#77 | 0.36%(-0.302)#78 |
| 80. | Lakeville | 0.057% | 0.17%(-0.116)#78 | 0.36%(-0.307)#79 |
| 81. | Chaska | 0.054% | 0.17%(-0.119)#79 | 0.36%(-0.310)#80 |
| 82. | Mounds View | 0.053% | 0.17%(-0.119)#80 | 0.36%(-0.310)#81 |
| 83. | St Francis | 0.049% | 0.17%(-0.124)#81 | 0.36%(-0.315)#82 |
| 84. | Vadnais Heights | 0.047% | 0.17%(-0.126)#82 | 0.36%(-0.317)#83 |
| 85. | Elk River | 0.023% | 0.17%(-0.150)#83 | 0.36%(-0.341)#84 |
| 86. | Shakopee | 0.0068% | 0.17%(-0.166)#84 | 0.36%(-0.357)#85 |
Common Questions
What are the Top 10 Cities with the Highest Percentage of Immigrants from Western Asia in Minnesota?
Top 10 Cities with the Highest Percentage of Immigrants from Western Asia in Minnesota are:
#1
3.05%
#2
2.39%
#3
2.25%
#4
1.81%
#5
1.39%
#6
1.36%
#7
1.21%
#8
1.18%
#9
1.17%
#10
1.04%
What city has the Highest Percentage of Immigrants from Western Asia in Minnesota?
Hendrum has the Highest Percentage of Immigrants from Western Asia in Minnesota with 3.05%.
What is the Percentage of Immigrants from Western Asia in the State of Minnesota?
Percentage of Immigrants from Western Asia in Minnesota is 0.17%.
What is the Percentage of Immigrants from Western Asia in the United States?
Percentage of Immigrants from Western Asia in the United States is 0.36%.