New Hope, MN
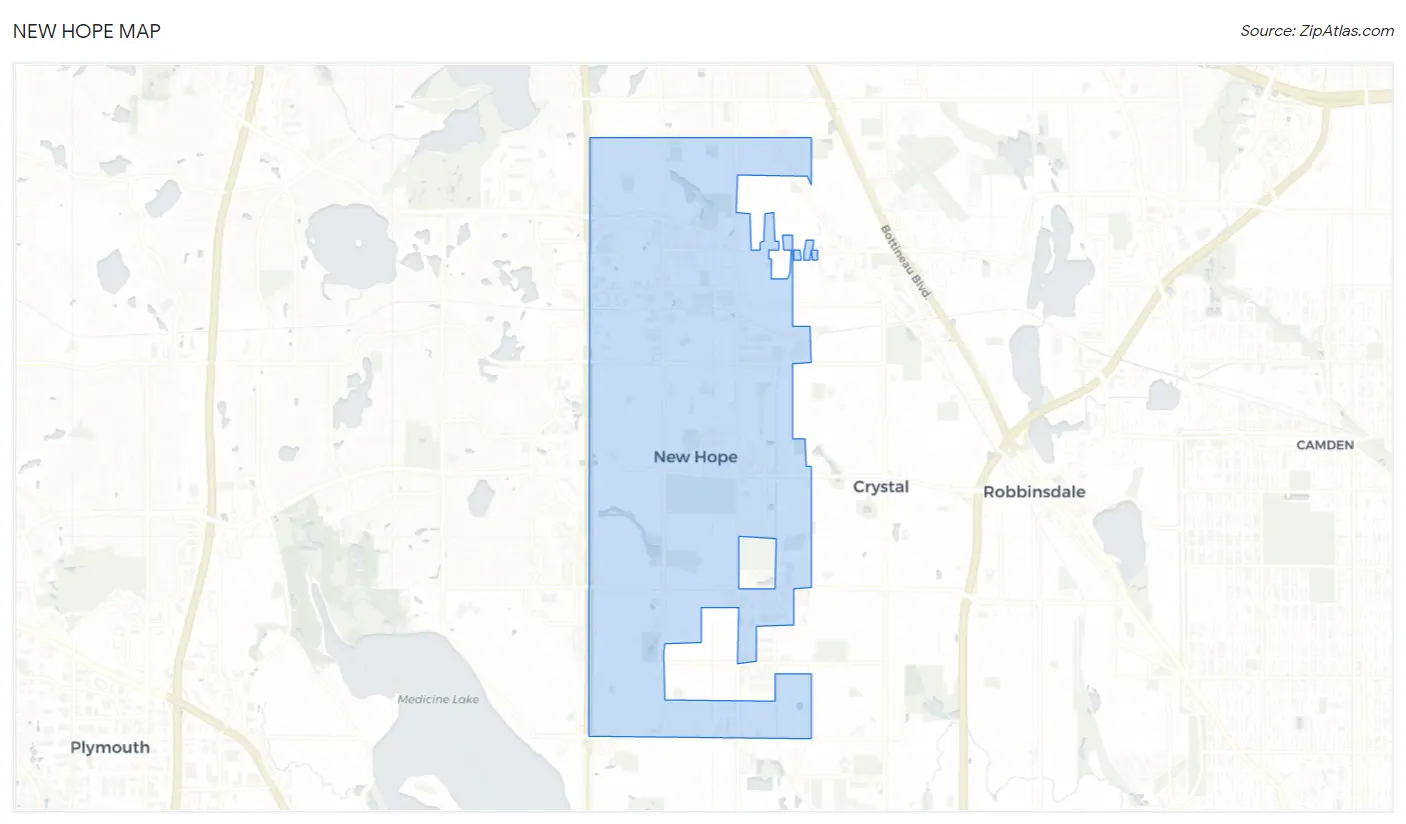
New Hope Map
New Hope Overview
21,620
TOTAL POPULATION
10,319
MALE POPULATION
11,301
FEMALE POPULATION
91.31
MALES / 100 FEMALES
109.52
FEMALES / 100 MALES
41.4
MEDIAN AGE
3.0
AVG FAMILY SIZE
2.3
AVG HOUSEHOLD SIZE
$38,623
PER CAPITA INCOME
$102,762
AVG FAMILY INCOME
$69,244
AVG HOUSEHOLD INCOME
25.0%
WAGE / INCOME GAP [ % ]
75.0¢/ $1
WAGE / INCOME GAP [ $ ]
0.42
INEQUALITY / GINI INDEX
12,104
LABOR FORCE [ PEOPLE ]
68.9%
PERCENT IN LABOR FORCE
5.1%
UNEMPLOYMENT RATE
Race in New Hope
The most populous races in New Hope are White / Caucasian (14,078 | 65.1%), Black / African American (5,303 | 24.5%), and Hispanic or Latino (1,366 | 6.3%).
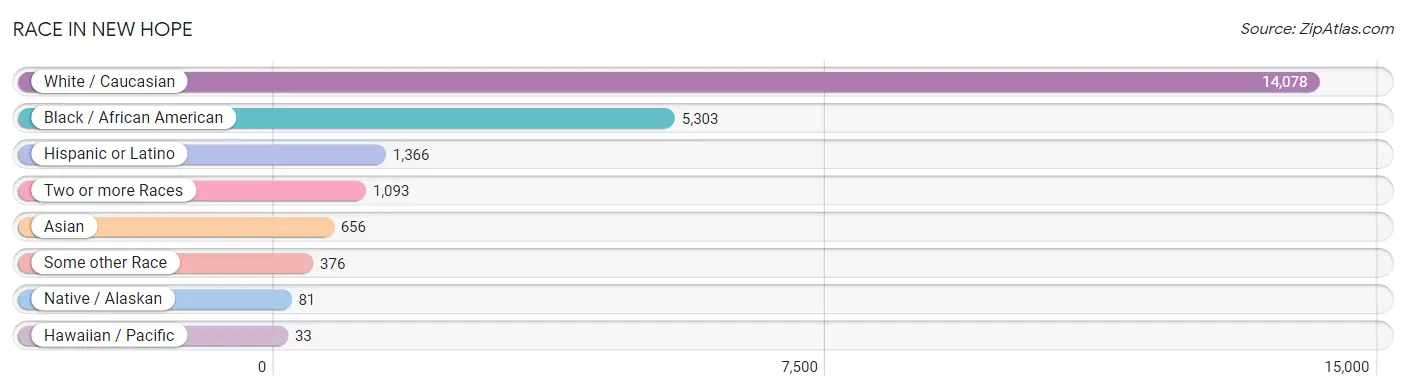
| Race | # Population | % Population |
| Asian | 656 | 3.0% |
| Black / African American | 5,303 | 24.5% |
| Hawaiian / Pacific | 33 | 0.2% |
| Hispanic or Latino | 1,366 | 6.3% |
| Native / Alaskan | 81 | 0.4% |
| White / Caucasian | 14,078 | 65.1% |
| Two or more Races | 1,093 | 5.1% |
| Some other Race | 376 | 1.7% |
| Total | 21,620 | 100.0% |
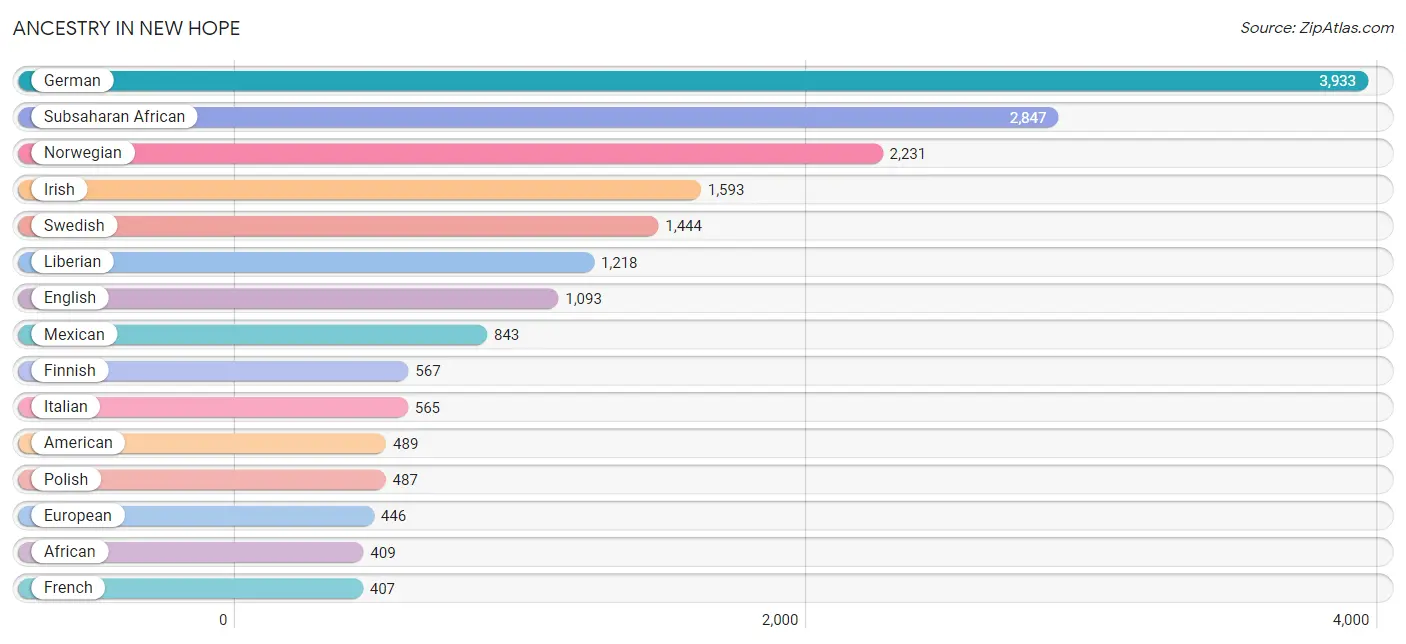
Ancestry in New Hope
The most populous ancestries reported in New Hope are German (3,933 | 18.2%), Subsaharan African (2,847 | 13.2%), Norwegian (2,231 | 10.3%), Irish (1,593 | 7.4%), and Swedish (1,444 | 6.7%), together accounting for 55.7% of all New Hope residents.
| Ancestry | # Population | % Population |
| African | 409 | 1.9% |
| American | 489 | 2.3% |
| Apache | 13 | 0.1% |
| Arab | 161 | 0.7% |
| Australian | 8 | 0.0% |
| Austrian | 26 | 0.1% |
| Bahamian | 21 | 0.1% |
| Bangladeshi | 182 | 0.8% |
| Belgian | 18 | 0.1% |
| Bhutanese | 29 | 0.1% |
| Blackfeet | 8 | 0.0% |
| British | 60 | 0.3% |
| Bulgarian | 12 | 0.1% |
| Burmese | 77 | 0.4% |
| Canadian | 75 | 0.4% |
| Central American | 124 | 0.6% |
| Central American Indian | 47 | 0.2% |
| Cherokee | 20 | 0.1% |
| Chilean | 39 | 0.2% |
| Chippewa | 78 | 0.4% |
| Colombian | 16 | 0.1% |
| Croatian | 11 | 0.1% |
| Cuban | 33 | 0.2% |
| Czech | 276 | 1.3% |
| Czechoslovakian | 43 | 0.2% |
| Danish | 378 | 1.8% |
| Dominican | 61 | 0.3% |
| Dutch | 240 | 1.1% |
| Eastern European | 181 | 0.8% |
| Egyptian | 110 | 0.5% |
| English | 1,093 | 5.1% |
| Ethiopian | 343 | 1.6% |
| European | 446 | 2.1% |
| Finnish | 567 | 2.6% |
| French | 407 | 1.9% |
| French American Indian | 23 | 0.1% |
| French Canadian | 177 | 0.8% |
| German | 3,933 | 18.2% |
| Ghanaian | 41 | 0.2% |
| Greek | 65 | 0.3% |
| Guatemalan | 96 | 0.4% |
| Honduran | 19 | 0.1% |
| Hungarian | 13 | 0.1% |
| Icelander | 7 | 0.0% |
| Indian (Asian) | 177 | 0.8% |
| Iraqi | 13 | 0.1% |
| Irish | 1,593 | 7.4% |
| Italian | 565 | 2.6% |
| Jamaican | 84 | 0.4% |
| Japanese | 12 | 0.1% |
| Kenyan | 162 | 0.7% |
| Korean | 271 | 1.3% |
| Laotian | 23 | 0.1% |
| Latvian | 20 | 0.1% |
| Lebanese | 24 | 0.1% |
| Liberian | 1,218 | 5.6% |
| Luxembourger | 9 | 0.0% |
| Malaysian | 72 | 0.3% |
| Mexican | 843 | 3.9% |
| Native Hawaiian | 127 | 0.6% |
| Nigerian | 87 | 0.4% |
| Norwegian | 2,231 | 10.3% |
| Polish | 487 | 2.2% |
| Portuguese | 55 | 0.3% |
| Puerto Rican | 113 | 0.5% |
| Romanian | 16 | 0.1% |
| Russian | 122 | 0.6% |
| Salvadoran | 9 | 0.0% |
| Samoan | 107 | 0.5% |
| Scandinavian | 273 | 1.3% |
| Scotch-Irish | 125 | 0.6% |
| Scottish | 176 | 0.8% |
| Senegalese | 32 | 0.2% |
| Serbian | 8 | 0.0% |
| Sioux | 26 | 0.1% |
| Slovak | 29 | 0.1% |
| Somali | 369 | 1.7% |
| South American | 55 | 0.3% |
| Spaniard | 20 | 0.1% |
| Sri Lankan | 309 | 1.4% |
| Subsaharan African | 2,847 | 13.2% |
| Swedish | 1,444 | 6.7% |
| Swiss | 35 | 0.2% |
| Thai | 274 | 1.3% |
| Ukrainian | 146 | 0.7% |
| Welsh | 54 | 0.3% |
| West Indian | 28 | 0.1% |
| Yugoslavian | 8 | 0.0% | View All 88 Rows |
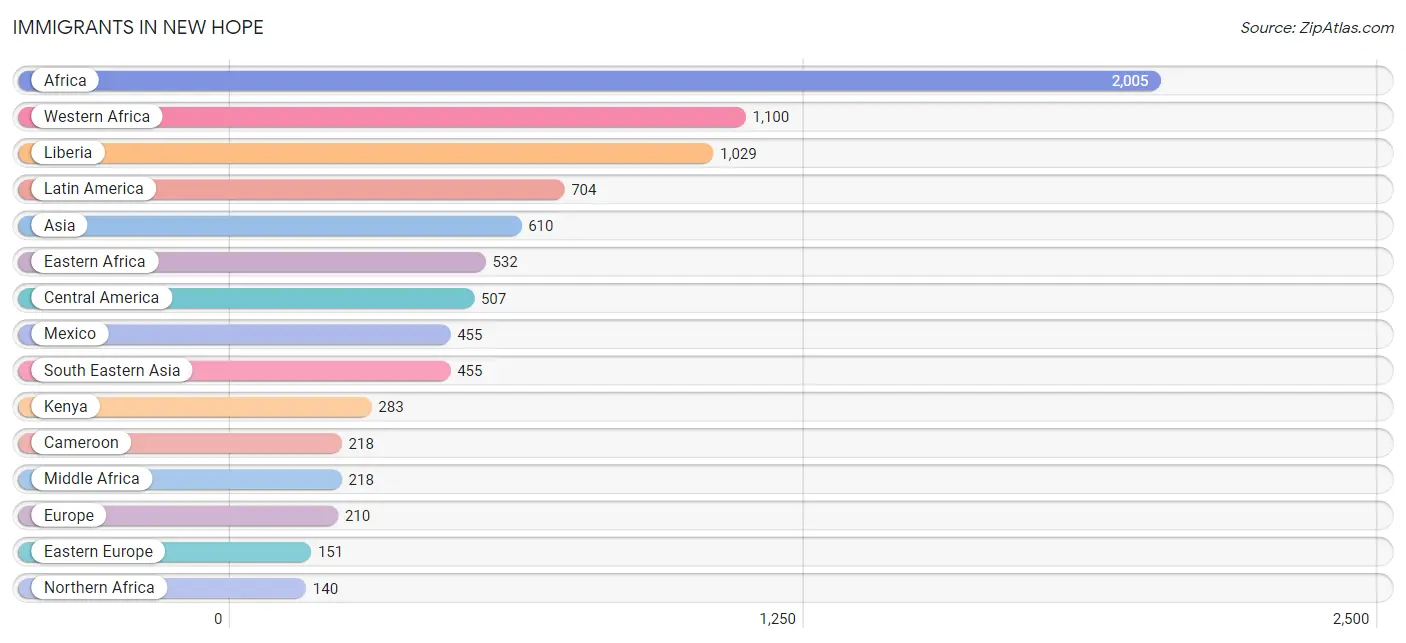
Immigrants in New Hope
The most numerous immigrant groups reported in New Hope came from Africa (2,005 | 9.3%), Western Africa (1,100 | 5.1%), Liberia (1,029 | 4.8%), Latin America (704 | 3.3%), and Asia (610 | 2.8%), together accounting for 25.2% of all New Hope residents.
| Immigration Origin | # Population | % Population |
| Africa | 2,005 | 9.3% |
| Asia | 610 | 2.8% |
| Bahamas | 21 | 0.1% |
| Belarus | 8 | 0.0% |
| Belgium | 7 | 0.0% |
| Bulgaria | 12 | 0.1% |
| Cameroon | 218 | 1.0% |
| Canada | 47 | 0.2% |
| Caribbean | 133 | 0.6% |
| Central America | 507 | 2.4% |
| Chile | 16 | 0.1% |
| China | 10 | 0.1% |
| Colombia | 16 | 0.1% |
| Czechoslovakia | 8 | 0.0% |
| Dominican Republic | 61 | 0.3% |
| Eastern Africa | 532 | 2.5% |
| Eastern Asia | 42 | 0.2% |
| Eastern Europe | 151 | 0.7% |
| Egypt | 41 | 0.2% |
| El Salvador | 8 | 0.0% |
| Ethiopia | 116 | 0.5% |
| Europe | 210 | 1.0% |
| Germany | 22 | 0.1% |
| Ghana | 48 | 0.2% |
| Guatemala | 16 | 0.1% |
| Guyana | 32 | 0.2% |
| Honduras | 28 | 0.1% |
| India | 32 | 0.2% |
| Indonesia | 14 | 0.1% |
| Jamaica | 41 | 0.2% |
| Kazakhstan | 63 | 0.3% |
| Kenya | 283 | 1.3% |
| Korea | 32 | 0.2% |
| Laos | 136 | 0.6% |
| Latin America | 704 | 3.3% |
| Liberia | 1,029 | 4.8% |
| Mexico | 455 | 2.1% |
| Middle Africa | 218 | 1.0% |
| Netherlands | 14 | 0.1% |
| Nigeria | 23 | 0.1% |
| Northern Africa | 140 | 0.6% |
| Northern Europe | 16 | 0.1% |
| Oceania | 24 | 0.1% |
| Pakistan | 18 | 0.1% |
| Philippines | 100 | 0.5% |
| Russia | 23 | 0.1% |
| Scotland | 9 | 0.0% |
| Somalia | 133 | 0.6% |
| South America | 64 | 0.3% |
| South Central Asia | 113 | 0.5% |
| South Eastern Asia | 455 | 2.1% |
| Sudan | 99 | 0.5% |
| Taiwan | 10 | 0.1% |
| Thailand | 106 | 0.5% |
| Trinidad and Tobago | 10 | 0.1% |
| Ukraine | 27 | 0.1% |
| Vietnam | 99 | 0.5% |
| Western Africa | 1,100 | 5.1% |
| Western Europe | 43 | 0.2% | View All 59 Rows |
Sex and Age in New Hope
Sex and Age in New Hope
The most populous age groups in New Hope are 30 to 34 Years (918 | 8.9%) for men and Under 5 Years (939 | 8.3%) for women.
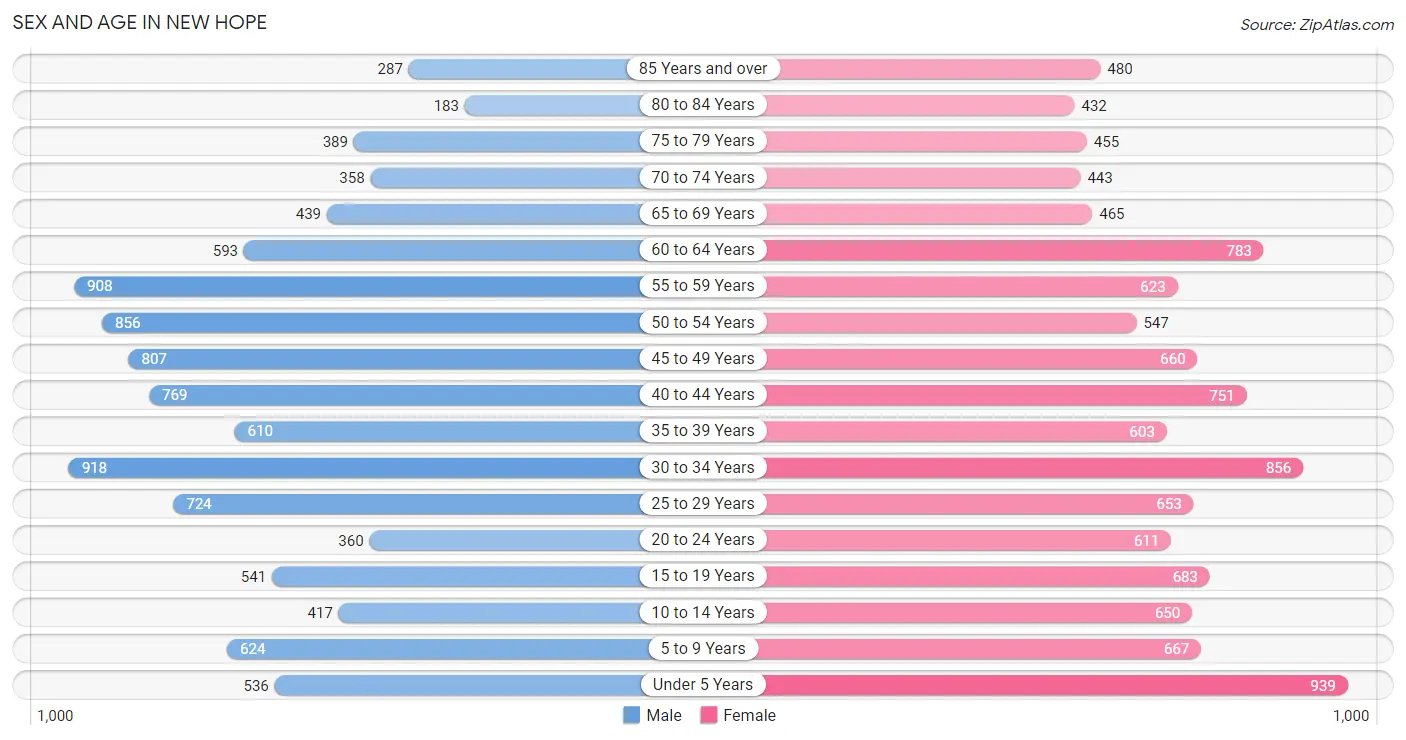
| Age Bracket | Male | Female |
| Under 5 Years | 536 (5.2%) | 939 (8.3%) |
| 5 to 9 Years | 624 (6.0%) | 667 (5.9%) |
| 10 to 14 Years | 417 (4.0%) | 650 (5.8%) |
| 15 to 19 Years | 541 (5.2%) | 683 (6.0%) |
| 20 to 24 Years | 360 (3.5%) | 611 (5.4%) |
| 25 to 29 Years | 724 (7.0%) | 653 (5.8%) |
| 30 to 34 Years | 918 (8.9%) | 856 (7.6%) |
| 35 to 39 Years | 610 (5.9%) | 603 (5.3%) |
| 40 to 44 Years | 769 (7.4%) | 751 (6.7%) |
| 45 to 49 Years | 807 (7.8%) | 660 (5.8%) |
| 50 to 54 Years | 856 (8.3%) | 547 (4.8%) |
| 55 to 59 Years | 908 (8.8%) | 623 (5.5%) |
| 60 to 64 Years | 593 (5.8%) | 783 (6.9%) |
| 65 to 69 Years | 439 (4.3%) | 465 (4.1%) |
| 70 to 74 Years | 358 (3.5%) | 443 (3.9%) |
| 75 to 79 Years | 389 (3.8%) | 455 (4.0%) |
| 80 to 84 Years | 183 (1.8%) | 432 (3.8%) |
| 85 Years and over | 287 (2.8%) | 480 (4.3%) |
| Total | 10,319 (100.0%) | 11,301 (100.0%) |
Families and Households in New Hope
Median Family Size in New Hope
The median family size in New Hope is 2.95 persons per family, with single female/mother families (1,114 | 20.8%) accounting for the largest median family size of 3 persons per family. On the other hand, single male/father families (492 | 9.2%) represent the smallest median family size with 2.62 persons per family.
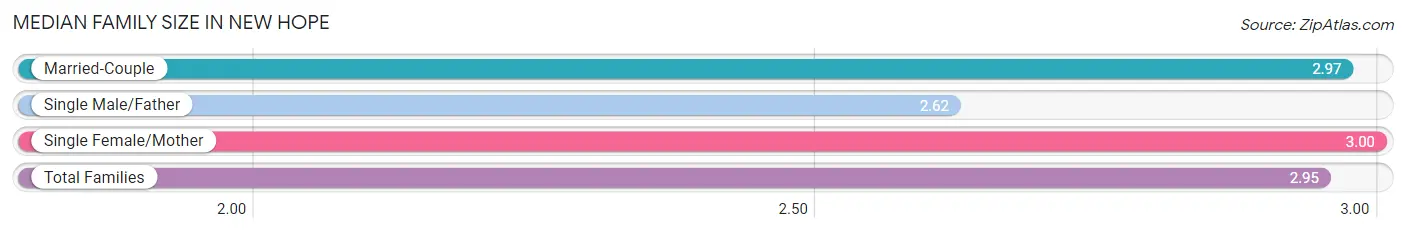
| Family Type | # Families | Family Size |
| Married-Couple | 3,737 (69.9%) | 2.97 |
| Single Male/Father | 492 (9.2%) | 2.62 |
| Single Female/Mother | 1,114 (20.8%) | 3.00 |
| Total Families | 5,343 (100.0%) | 2.95 |
Median Household Size in New Hope
The median household size in New Hope is 2.27 persons per household, with single female/mother households (1,114 | 12.2%) accounting for the largest median household size of 3.15 persons per household. non-family households (3,777 | 41.4%) represent the smallest median household size with 1.23 persons per household.
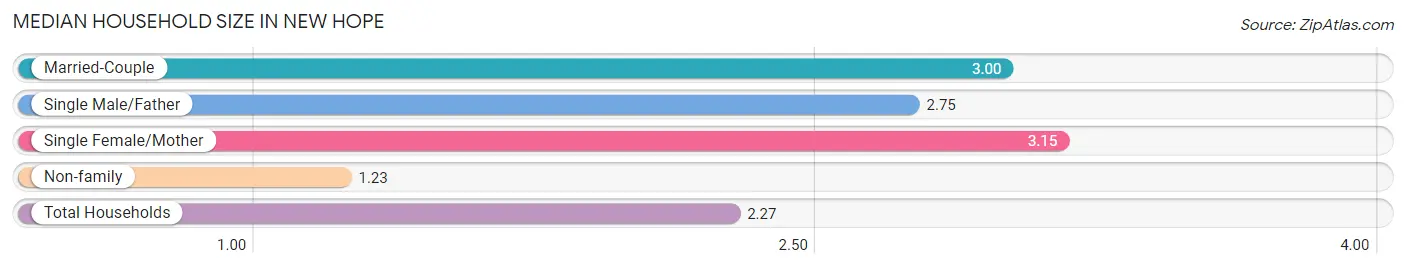
| Household Type | # Households | Household Size |
| Married-Couple | 3,737 (41.0%) | 3.00 |
| Single Male/Father | 492 (5.4%) | 2.75 |
| Single Female/Mother | 1,114 (12.2%) | 3.15 |
| Non-family | 3,777 (41.4%) | 1.23 |
| Total Households | 9,120 (100.0%) | 2.27 |
Household Size by Marriage Status in New Hope
Out of a total of 9,120 households in New Hope, 5,343 (58.6%) are family households, while 3,777 (41.4%) are nonfamily households. The most numerous type of family households are 2-person households, comprising 2,452, and the most common type of nonfamily households are 1-person households, comprising 3,000.
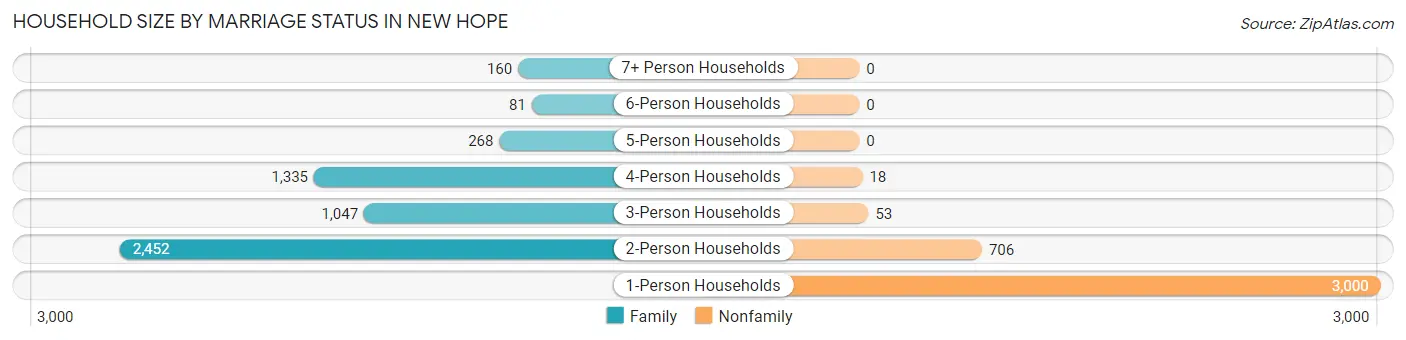
| Household Size | Family Households | Nonfamily Households |
| 1-Person Households | - | 3,000 (32.9%) |
| 2-Person Households | 2,452 (26.9%) | 706 (7.7%) |
| 3-Person Households | 1,047 (11.5%) | 53 (0.6%) |
| 4-Person Households | 1,335 (14.6%) | 18 (0.2%) |
| 5-Person Households | 268 (2.9%) | 0 (0.0%) |
| 6-Person Households | 81 (0.9%) | 0 (0.0%) |
| 7+ Person Households | 160 (1.8%) | 0 (0.0%) |
| Total | 5,343 (58.6%) | 3,777 (41.4%) |
Female Fertility in New Hope
Fertility by Age in New Hope
Average fertility rate in New Hope is 60.0 births per 1,000 women. Women in the age bracket of 20 to 34 years have the highest fertility rate with 115.0 births per 1,000 women. Women in the age bracket of 20 to 34 years acount for 82.7% of all women with births.
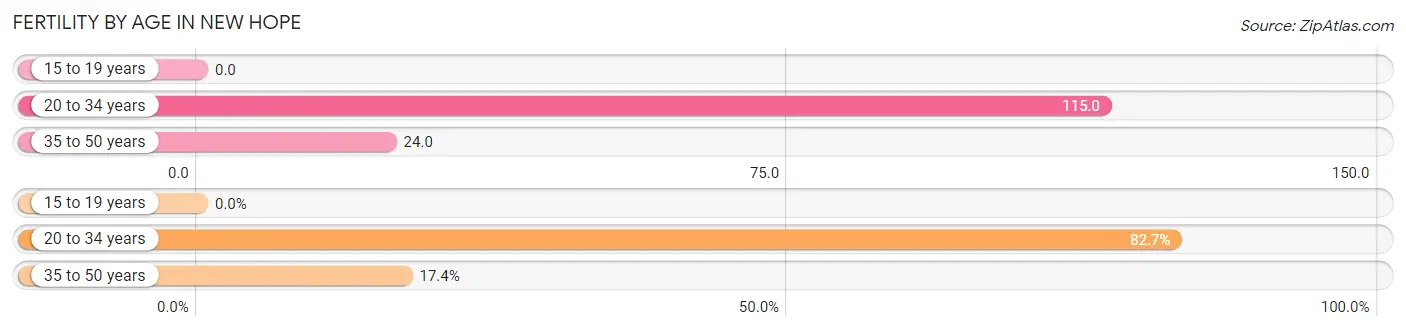
| Age Bracket | Women with Births | Births / 1,000 Women |
| 15 to 19 years | 0 (0.0%) | 0.0 |
| 20 to 34 years | 243 (82.7%) | 115.0 |
| 35 to 50 years | 51 (17.3%) | 24.0 |
| Total | 294 (100.0%) | 60.0 |
Fertility by Age by Marriage Status in New Hope
81.0% of women with births (294) in New Hope are married. The highest percentage of unmarried women with births falls into 20 to 34 years age bracket with 23.1% of them unmarried at the time of birth, while the lowest percentage of unmarried women with births belong to 35 to 50 years age bracket with 0.0% of them unmarried.
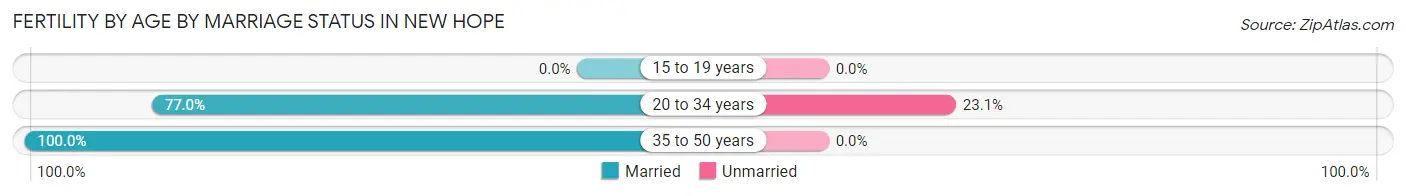
| Age Bracket | Married | Unmarried |
| 15 to 19 years | 0 (0.0%) | 0 (0.0%) |
| 20 to 34 years | 187 (76.9%) | 56 (23.1%) |
| 35 to 50 years | 51 (100.0%) | 0 (0.0%) |
| Total | 238 (80.9%) | 56 (19.1%) |
Fertility by Education in New Hope
Average fertility rate in New Hope is 60.0 births per 1,000 women. Women with the education attainment of graduate degree have the highest fertility rate of 110.0 births per 1,000 women, while women with the education attainment of college or associate's degree have the lowest fertility at 41.0 births per 1,000 women. Women with the education attainment of bachelor's degree represent 28.6% of all women with births.
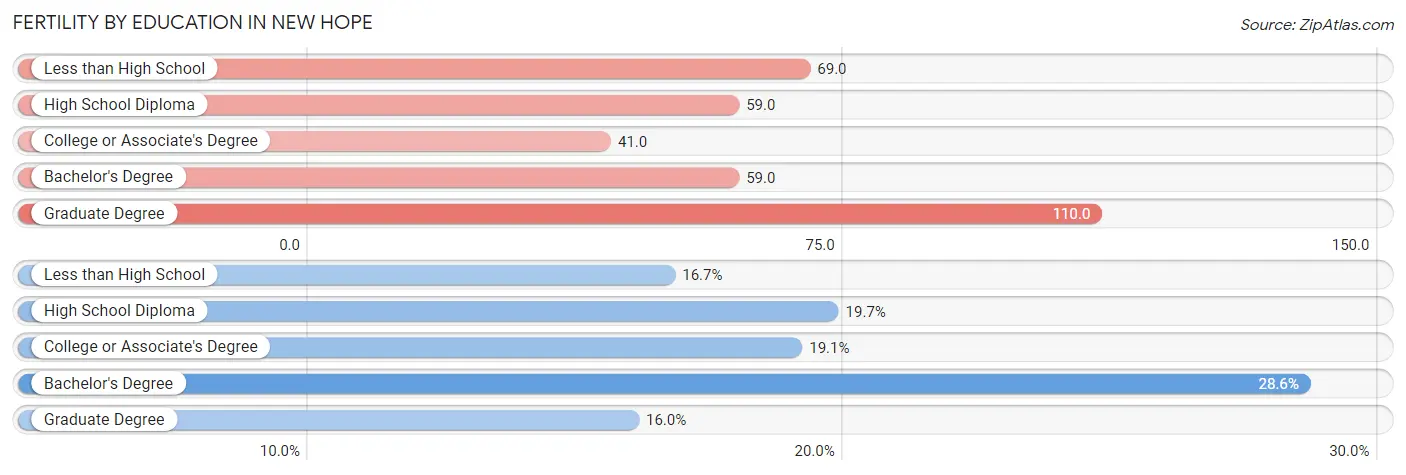
| Educational Attainment | Women with Births | Births / 1,000 Women |
| Less than High School | 49 (16.7%) | 69.0 |
| High School Diploma | 58 (19.7%) | 59.0 |
| College or Associate's Degree | 56 (19.1%) | 41.0 |
| Bachelor's Degree | 84 (28.6%) | 59.0 |
| Graduate Degree | 47 (16.0%) | 110.0 |
| Total | 294 (100.0%) | 60.0 |
Fertility by Education by Marriage Status in New Hope
19.1% of women with births in New Hope are unmarried. Women with the educational attainment of high school diploma are most likely to be married with 100.0% of them married at childbirth, while women with the educational attainment of less than high school are least likely to be married with 81.6% of them unmarried at childbirth.
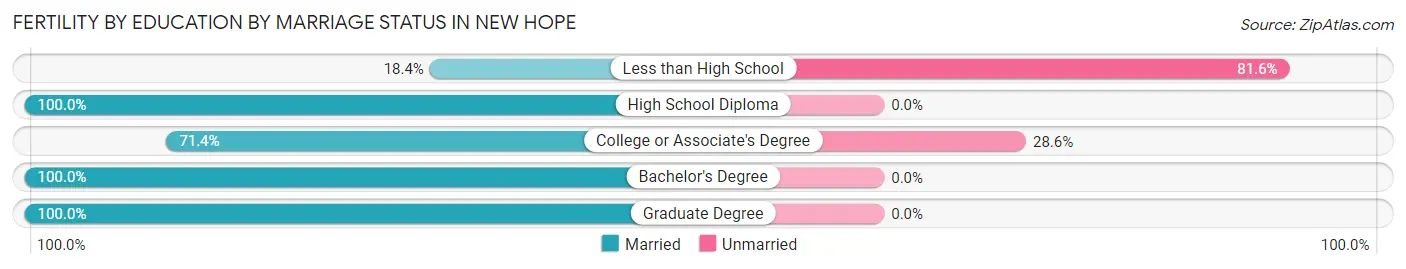
| Educational Attainment | Married | Unmarried |
| Less than High School | 9 (18.4%) | 40 (81.6%) |
| High School Diploma | 58 (100.0%) | 0 (0.0%) |
| College or Associate's Degree | 40 (71.4%) | 16 (28.6%) |
| Bachelor's Degree | 84 (100.0%) | 0 (0.0%) |
| Graduate Degree | 47 (100.0%) | 0 (0.0%) |
| Total | 238 (80.9%) | 56 (19.1%) |
Income in New Hope
Income Overview in New Hope
Per Capita Income in New Hope is $38,623, while median incomes of families and households are $102,762 and $69,244 respectively.
| Characteristic | Number | Measure |
| Per Capita Income | 21,620 | $38,623 |
| Median Family Income | 5,343 | $102,762 |
| Mean Family Income | 5,343 | $112,426 |
| Median Household Income | 9,120 | $69,244 |
| Mean Household Income | 9,120 | $89,899 |
| Income Deficit | 5,343 | $0 |
| Wage / Income Gap (%) | 21,620 | 24.96% |
| Wage / Income Gap ($) | 21,620 | 75.04¢ per $1 |
| Gini / Inequality Index | 21,620 | 0.42 |
Earnings by Sex in New Hope
Average Earnings in New Hope are $43,598, $50,000 for men and $37,521 for women, a difference of 25.0%.
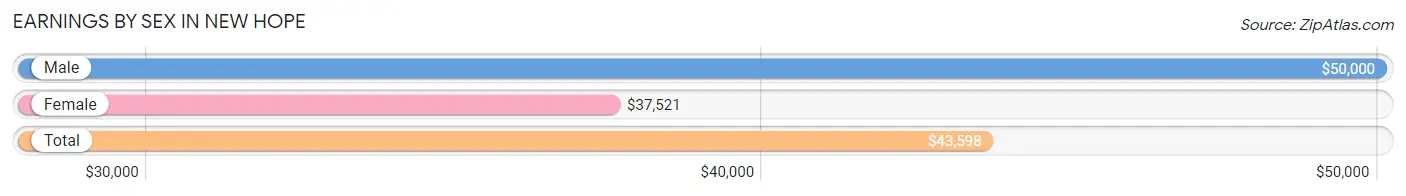
| Sex | Number | Average Earnings |
| Male | 6,424 (50.9%) | $50,000 |
| Female | 6,184 (49.0%) | $37,521 |
| Total | 12,608 (100.0%) | $43,598 |
Earnings by Sex by Income Bracket in New Hope
The most common earnings brackets in New Hope are $100,000+ for men (1,239 | 19.3%) and $55,000 to $64,999 for women (600 | 9.7%).
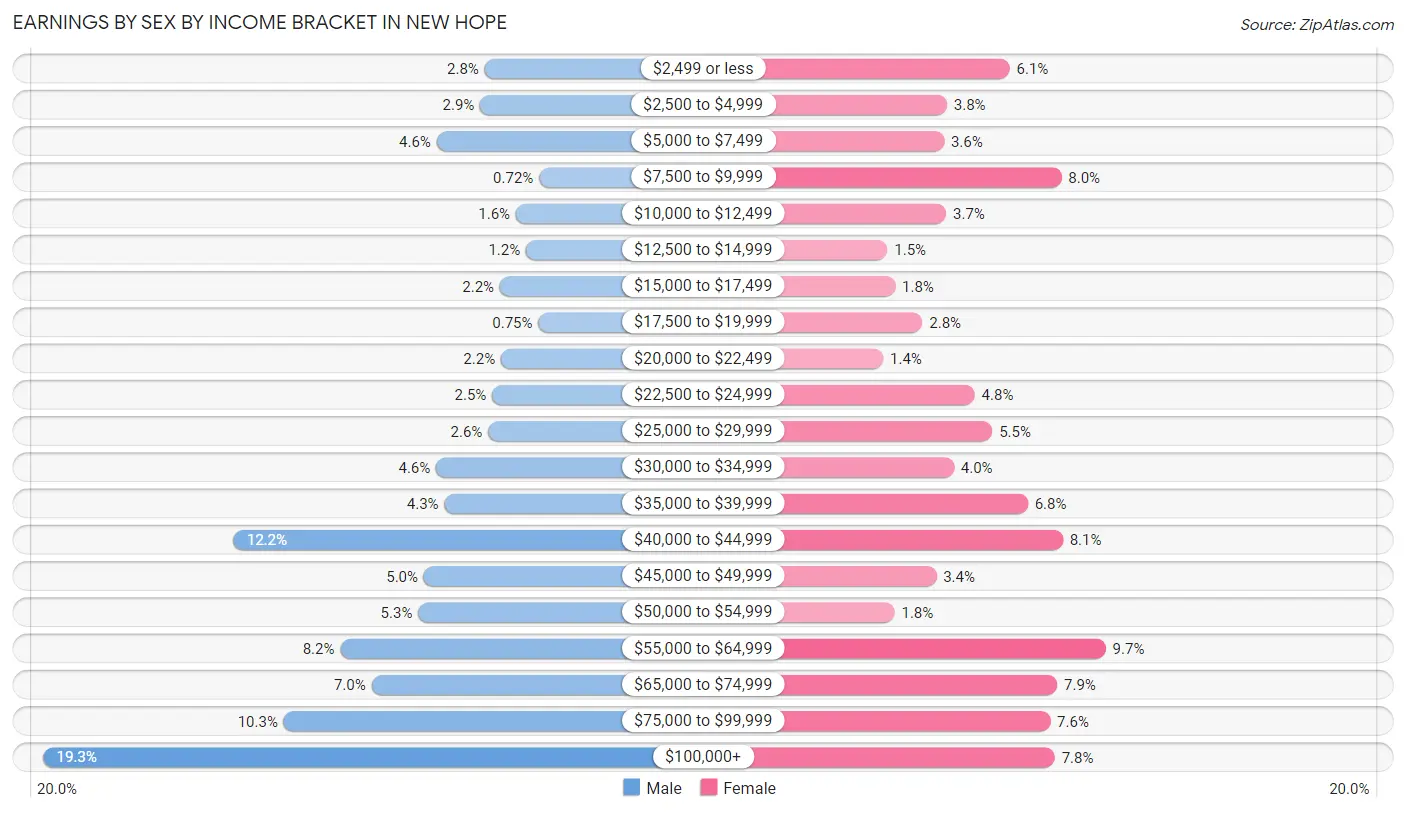
| Income | Male | Female |
| $2,499 or less | 177 (2.8%) | 377 (6.1%) |
| $2,500 to $4,999 | 188 (2.9%) | 232 (3.7%) |
| $5,000 to $7,499 | 293 (4.6%) | 225 (3.6%) |
| $7,500 to $9,999 | 46 (0.7%) | 497 (8.0%) |
| $10,000 to $12,499 | 102 (1.6%) | 230 (3.7%) |
| $12,500 to $14,999 | 78 (1.2%) | 94 (1.5%) |
| $15,000 to $17,499 | 141 (2.2%) | 112 (1.8%) |
| $17,500 to $19,999 | 48 (0.7%) | 175 (2.8%) |
| $20,000 to $22,499 | 138 (2.1%) | 84 (1.4%) |
| $22,500 to $24,999 | 159 (2.5%) | 296 (4.8%) |
| $25,000 to $29,999 | 169 (2.6%) | 337 (5.4%) |
| $30,000 to $34,999 | 294 (4.6%) | 248 (4.0%) |
| $35,000 to $39,999 | 274 (4.3%) | 419 (6.8%) |
| $40,000 to $44,999 | 781 (12.2%) | 500 (8.1%) |
| $45,000 to $49,999 | 324 (5.0%) | 207 (3.4%) |
| $50,000 to $54,999 | 337 (5.2%) | 111 (1.8%) |
| $55,000 to $64,999 | 525 (8.2%) | 600 (9.7%) |
| $65,000 to $74,999 | 450 (7.0%) | 487 (7.9%) |
| $75,000 to $99,999 | 661 (10.3%) | 471 (7.6%) |
| $100,000+ | 1,239 (19.3%) | 482 (7.8%) |
| Total | 6,424 (100.0%) | 6,184 (100.0%) |
Earnings by Sex by Educational Attainment in New Hope
Average earnings in New Hope are $52,310 for men and $41,818 for women, a difference of 20.1%. Men with an educational attainment of bachelor's degree enjoy the highest average annual earnings of $73,891, while those with less than high school education earn the least with $37,768. Women with an educational attainment of graduate degree earn the most with the average annual earnings of $63,438, while those with less than high school education have the smallest earnings of $23,000.
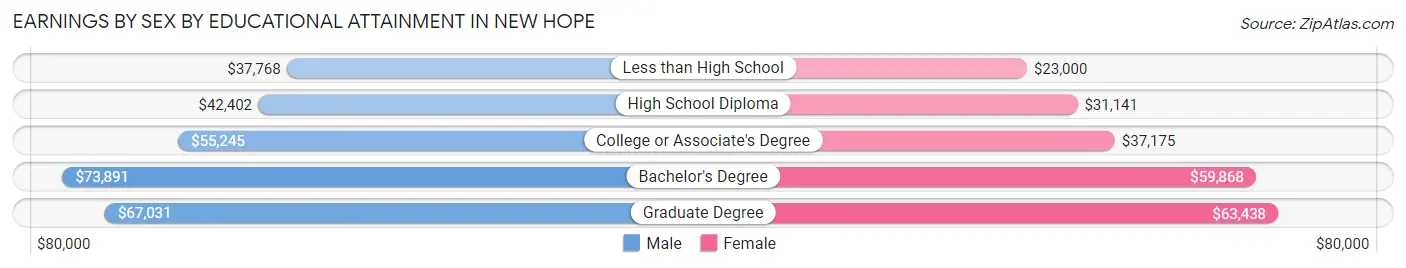
| Educational Attainment | Male Income | Female Income |
| Less than High School | $37,768 | $23,000 |
| High School Diploma | $42,402 | $31,141 |
| College or Associate's Degree | $55,245 | $37,175 |
| Bachelor's Degree | $73,891 | $59,868 |
| Graduate Degree | $67,031 | $63,438 |
| Total | $52,310 | $41,818 |
Family Income in New Hope
Family Income Brackets in New Hope
According to the New Hope family income data, there are 1,443 families falling into the $100,000 to $149,999 income range, which is the most common income bracket and makes up 27.0% of all families. Conversely, the $10,000 to $14,999 income bracket is the least frequent group with only 37 families (0.7%) belonging to this category.
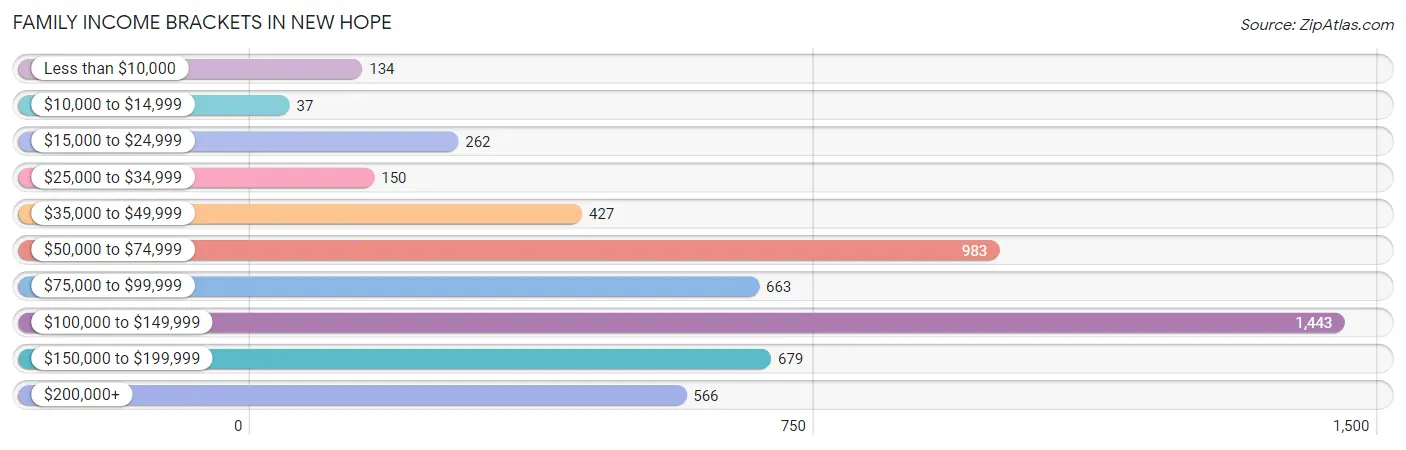
| Income Bracket | # Families | % Families |
| Less than $10,000 | 134 | 2.5% |
| $10,000 to $14,999 | 37 | 0.7% |
| $15,000 to $24,999 | 262 | 4.9% |
| $25,000 to $34,999 | 150 | 2.8% |
| $35,000 to $49,999 | 427 | 8.0% |
| $50,000 to $74,999 | 983 | 18.4% |
| $75,000 to $99,999 | 663 | 12.4% |
| $100,000 to $149,999 | 1,443 | 27.0% |
| $150,000 to $199,999 | 679 | 12.7% |
| $200,000+ | 566 | 10.6% |
Family Income by Famaliy Size in New Hope
4-person families (1,265 | 23.7%) account for the highest median family income in New Hope with $145,981 per family, while 2-person families (2,602 | 48.7%) have the highest median income of $40,964 per family member.
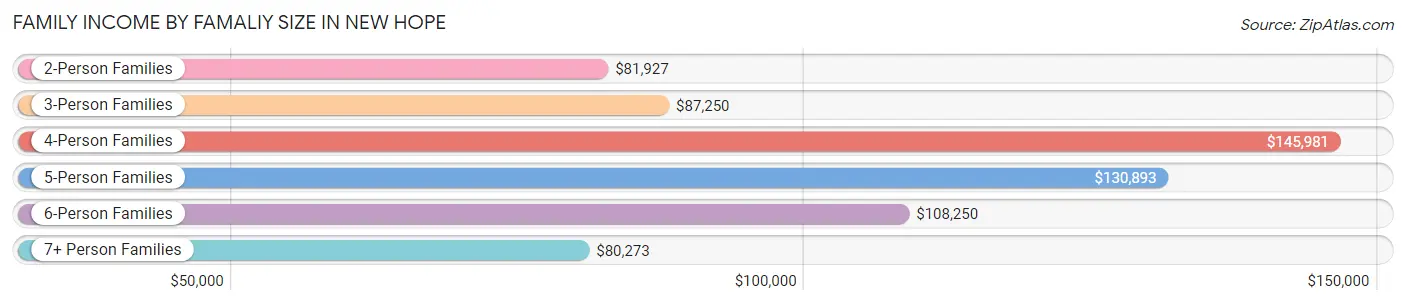
| Income Bracket | # Families | Median Income |
| 2-Person Families | 2,602 (48.7%) | $81,927 |
| 3-Person Families | 991 (18.5%) | $87,250 |
| 4-Person Families | 1,265 (23.7%) | $145,981 |
| 5-Person Families | 244 (4.6%) | $130,893 |
| 6-Person Families | 92 (1.7%) | $108,250 |
| 7+ Person Families | 149 (2.8%) | $80,273 |
| Total | 5,343 (100.0%) | $102,762 |
Family Income by Number of Earners in New Hope
The median family income in New Hope is $102,762, with families comprising 3+ earners (683) having the highest median family income of $156,250, while families with 1 earner (1,240) have the lowest median family income of $55,982, accounting for 12.8% and 23.2% of families, respectively.
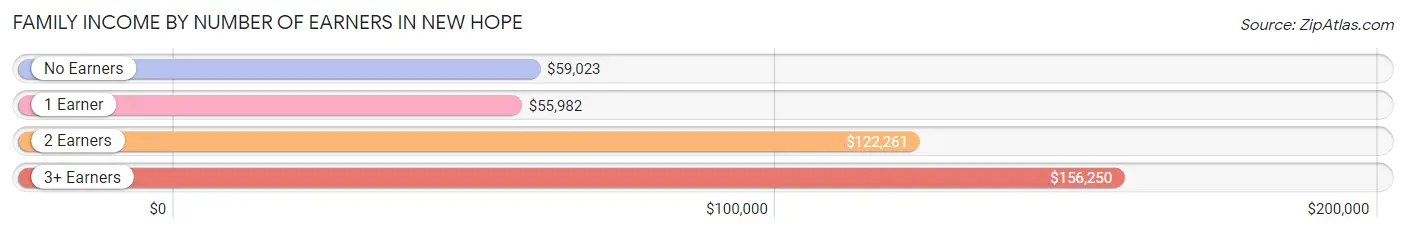
| Number of Earners | # Families | Median Income |
| No Earners | 625 (11.7%) | $59,023 |
| 1 Earner | 1,240 (23.2%) | $55,982 |
| 2 Earners | 2,795 (52.3%) | $122,261 |
| 3+ Earners | 683 (12.8%) | $156,250 |
| Total | 5,343 (100.0%) | $102,762 |
Household Income in New Hope
Household Income Brackets in New Hope
With 1,970 households falling in the category, the $100,000 to $149,999 income range is the most frequent in New Hope, accounting for 21.6% of all households. In contrast, only 365 households (4.0%) fall into the $10,000 to $14,999 income bracket, making it the least populous group.
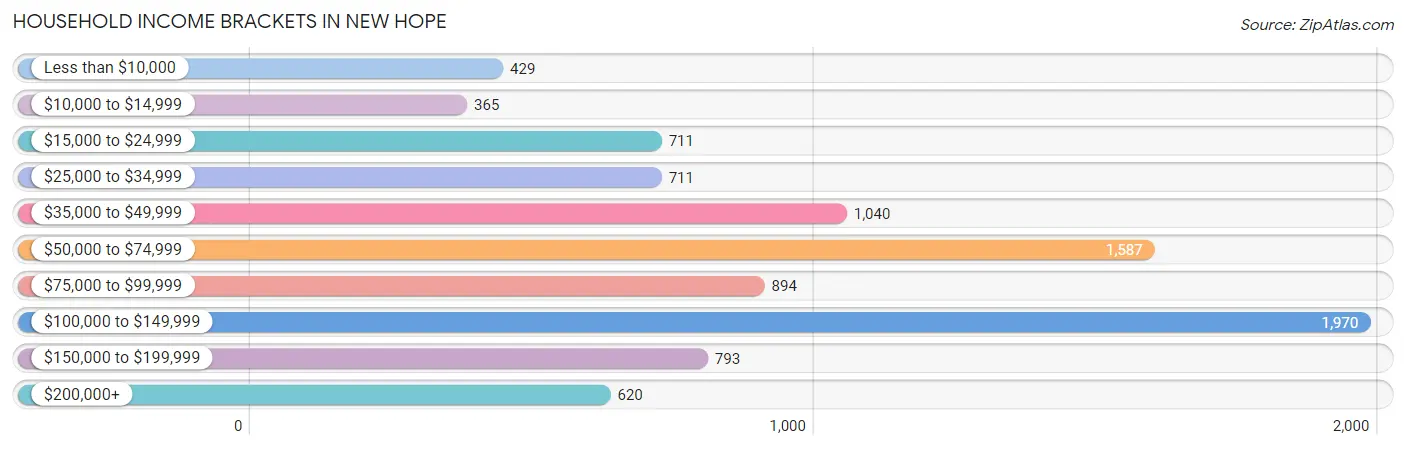
| Income Bracket | # Households | % Households |
| Less than $10,000 | 429 | 4.7% |
| $10,000 to $14,999 | 365 | 4.0% |
| $15,000 to $24,999 | 711 | 7.8% |
| $25,000 to $34,999 | 711 | 7.8% |
| $35,000 to $49,999 | 1,040 | 11.4% |
| $50,000 to $74,999 | 1,587 | 17.4% |
| $75,000 to $99,999 | 894 | 9.8% |
| $100,000 to $149,999 | 1,970 | 21.6% |
| $150,000 to $199,999 | 793 | 8.7% |
| $200,000+ | 620 | 6.8% |
Household Income by Householder Age in New Hope
The median household income in New Hope is $69,244, with the highest median household income of $91,250 found in the 25 to 44 years age bracket for the primary householder. A total of 3,172 households (34.8%) fall into this category. Meanwhile, the 15 to 24 years age bracket for the primary householder has the lowest median household income of $0, with 250 households (2.7%) in this group.
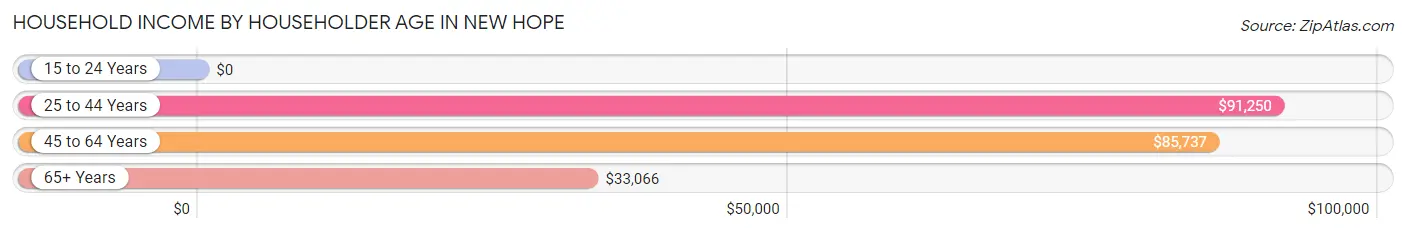
| Income Bracket | # Households | Median Income |
| 15 to 24 Years | 250 (2.7%) | $0 |
| 25 to 44 Years | 3,172 (34.8%) | $91,250 |
| 45 to 64 Years | 3,327 (36.5%) | $85,737 |
| 65+ Years | 2,371 (26.0%) | $33,066 |
| Total | 9,120 (100.0%) | $69,244 |
Poverty in New Hope
Income Below Poverty by Sex and Age in New Hope
With 10.2% poverty level for males and 11.2% for females among the residents of New Hope, 75 year old and over males and under 5 year old females are the most vulnerable to poverty, with 235 males (31.4%) and 217 females (23.1%) in their respective age groups living below the poverty level.
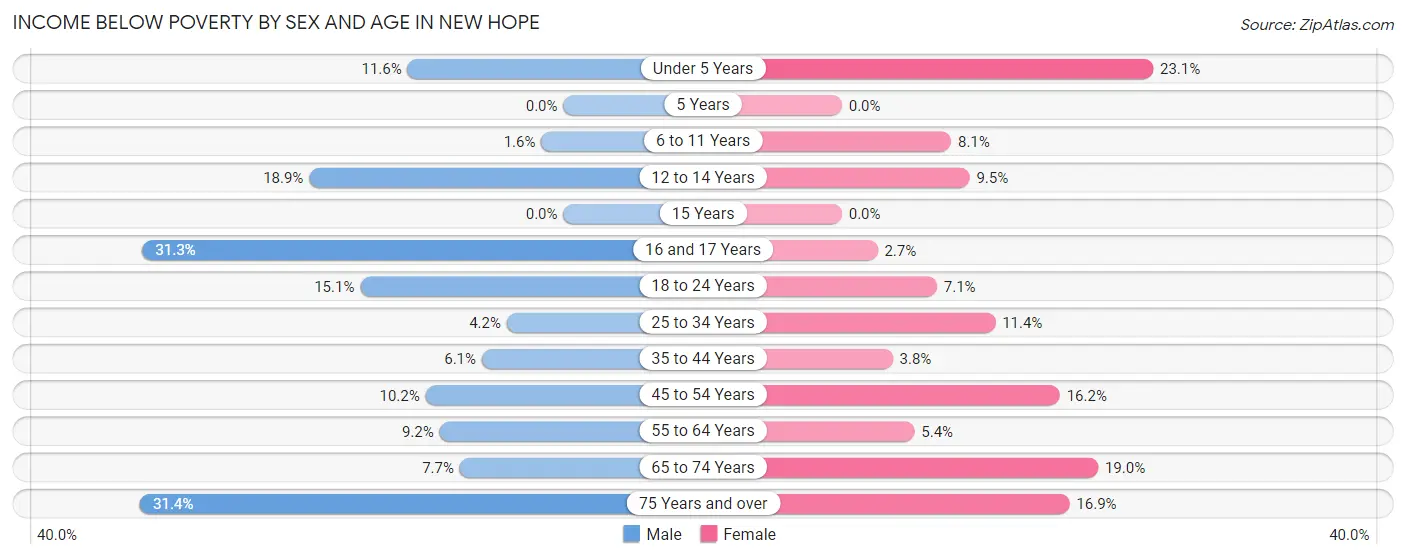
| Age Bracket | Male | Female |
| Under 5 Years | 62 (11.6%) | 217 (23.1%) |
| 5 Years | 0 (0.0%) | 0 (0.0%) |
| 6 to 11 Years | 10 (1.6%) | 69 (8.1%) |
| 12 to 14 Years | 60 (18.9%) | 38 (9.5%) |
| 15 Years | 0 (0.0%) | 0 (0.0%) |
| 16 and 17 Years | 75 (31.2%) | 9 (2.6%) |
| 18 to 24 Years | 76 (15.1%) | 63 (7.1%) |
| 25 to 34 Years | 69 (4.2%) | 170 (11.4%) |
| 35 to 44 Years | 83 (6.0%) | 51 (3.8%) |
| 45 to 54 Years | 167 (10.2%) | 193 (16.2%) |
| 55 to 64 Years | 133 (9.2%) | 75 (5.4%) |
| 65 to 74 Years | 56 (7.7%) | 159 (19.0%) |
| 75 Years and over | 235 (31.4%) | 172 (16.9%) |
| Total | 1,026 (10.2%) | 1,216 (11.2%) |
Income Above Poverty by Sex and Age in New Hope
According to the poverty statistics in New Hope, males aged 5 years and females aged 5 years are the age groups that are most secure financially, with 100.0% of males and 100.0% of females in these age groups living above the poverty line.
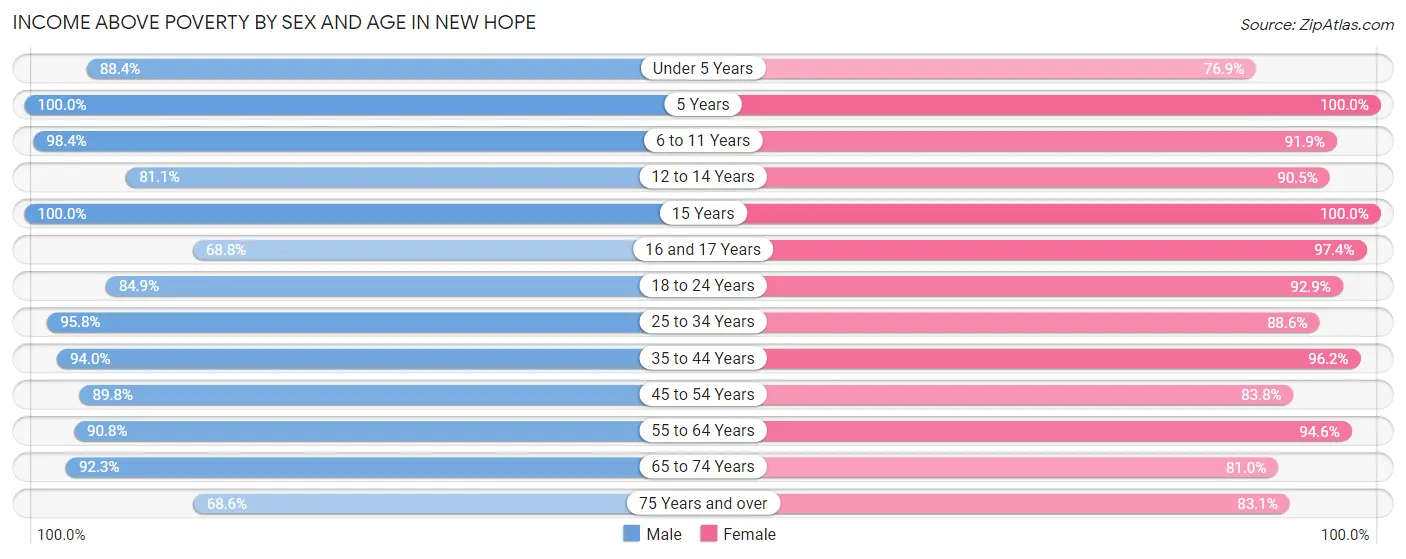
| Age Bracket | Male | Female |
| Under 5 Years | 474 (88.4%) | 722 (76.9%) |
| 5 Years | 115 (100.0%) | 65 (100.0%) |
| 6 to 11 Years | 598 (98.4%) | 782 (91.9%) |
| 12 to 14 Years | 258 (81.1%) | 363 (90.5%) |
| 15 Years | 157 (100.0%) | 62 (100.0%) |
| 16 and 17 Years | 165 (68.8%) | 331 (97.4%) |
| 18 to 24 Years | 428 (84.9%) | 829 (92.9%) |
| 25 to 34 Years | 1,573 (95.8%) | 1,323 (88.6%) |
| 35 to 44 Years | 1,288 (94.0%) | 1,303 (96.2%) |
| 45 to 54 Years | 1,465 (89.8%) | 1,000 (83.8%) |
| 55 to 64 Years | 1,315 (90.8%) | 1,317 (94.6%) |
| 65 to 74 Years | 672 (92.3%) | 677 (81.0%) |
| 75 Years and over | 513 (68.6%) | 846 (83.1%) |
| Total | 9,021 (89.8%) | 9,620 (88.8%) |
Income Below Poverty Among Married-Couple Families in New Hope
The poverty statistics for married-couple families in New Hope show that 6.2% or 233 of the total 3,737 families live below the poverty line. Families with 3 or 4 children have the highest poverty rate of 9.1%, comprising of 27 families. On the other hand, families with 1 or 2 children have the lowest poverty rate of 5.1%, which includes 67 families.
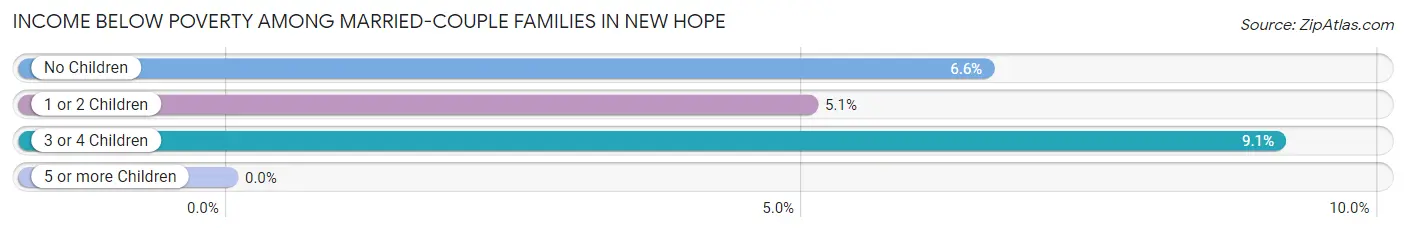
| Children | Above Poverty | Below Poverty |
| No Children | 1,975 (93.4%) | 139 (6.6%) |
| 1 or 2 Children | 1,260 (95.0%) | 67 (5.1%) |
| 3 or 4 Children | 269 (90.9%) | 27 (9.1%) |
| 5 or more Children | 0 (0.0%) | 0 (0.0%) |
| Total | 3,504 (93.8%) | 233 (6.2%) |
Income Below Poverty Among Single-Parent Households in New Hope
According to the poverty data in New Hope, 8.5% or 42 single-father households and 5.1% or 57 single-mother households are living below the poverty line. Among single-father households, those with 1 or 2 children have the highest poverty rate, with 26 households (9.0%) experiencing poverty. Likewise, among single-mother households, those with 3 or 4 children have the highest poverty rate, with 39 households (29.5%) falling below the poverty line.
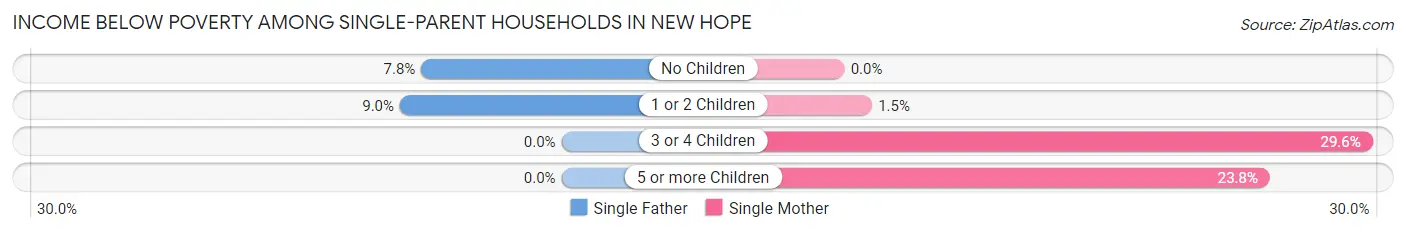
| Children | Single Father | Single Mother |
| No Children | 16 (7.8%) | 0 (0.0%) |
| 1 or 2 Children | 26 (9.0%) | 8 (1.5%) |
| 3 or 4 Children | 0 (0.0%) | 39 (29.5%) |
| 5 or more Children | 0 (0.0%) | 10 (23.8%) |
| Total | 42 (8.5%) | 57 (5.1%) |
Income Below Poverty Among Married-Couple vs Single-Parent Households in New Hope
The poverty data for New Hope shows that 233 of the married-couple family households (6.2%) and 99 of the single-parent households (6.2%) are living below the poverty level. Within the married-couple family households, those with 3 or 4 children have the highest poverty rate, with 27 households (9.1%) falling below the poverty line. Among the single-parent households, those with 3 or 4 children have the highest poverty rate, with 39 household (29.5%) living below poverty.
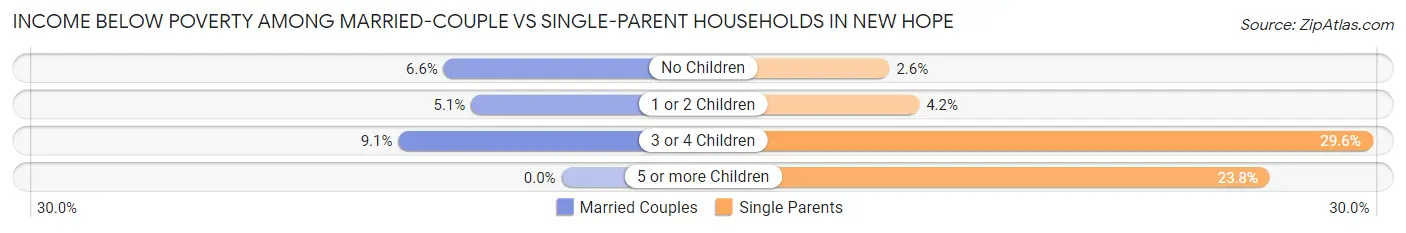
| Children | Married-Couple Families | Single-Parent Households |
| No Children | 139 (6.6%) | 16 (2.6%) |
| 1 or 2 Children | 67 (5.1%) | 34 (4.2%) |
| 3 or 4 Children | 27 (9.1%) | 39 (29.5%) |
| 5 or more Children | 0 (0.0%) | 10 (23.8%) |
| Total | 233 (6.2%) | 99 (6.2%) |
Employment Characteristics in New Hope
Employment by Class of Employer in New Hope
Among the 11,067 employed individuals in New Hope, private company employees (8,047 | 72.7%), not-for-profit organizations (1,341 | 12.1%), and local government employees (693 | 6.3%) make up the most common classes of employment.
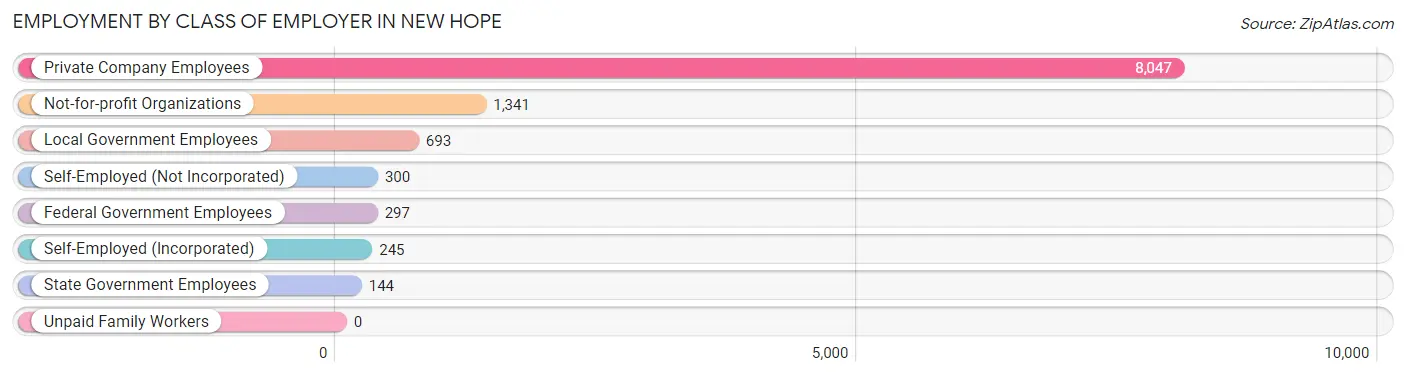
| Employer Class | # Employees | % Employees |
| Private Company Employees | 8,047 | 72.7% |
| Self-Employed (Incorporated) | 245 | 2.2% |
| Self-Employed (Not Incorporated) | 300 | 2.7% |
| Not-for-profit Organizations | 1,341 | 12.1% |
| Local Government Employees | 693 | 6.3% |
| State Government Employees | 144 | 1.3% |
| Federal Government Employees | 297 | 2.7% |
| Unpaid Family Workers | 0 | 0.0% |
| Total | 11,067 | 100.0% |
Employment Status by Age in New Hope
According to the labor force statistics for New Hope, out of the total population over 16 years of age (17,568), 68.9% or 12,104 individuals are in the labor force, with 5.1% or 617 of them unemployed. The age group with the highest labor force participation rate is 35 to 44 years, with 97.5% or 2,665 individuals in the labor force. Within the labor force, the 20 to 24 years age range has the highest percentage of unemployed individuals, with 25.1% or 187 of them being unemployed.
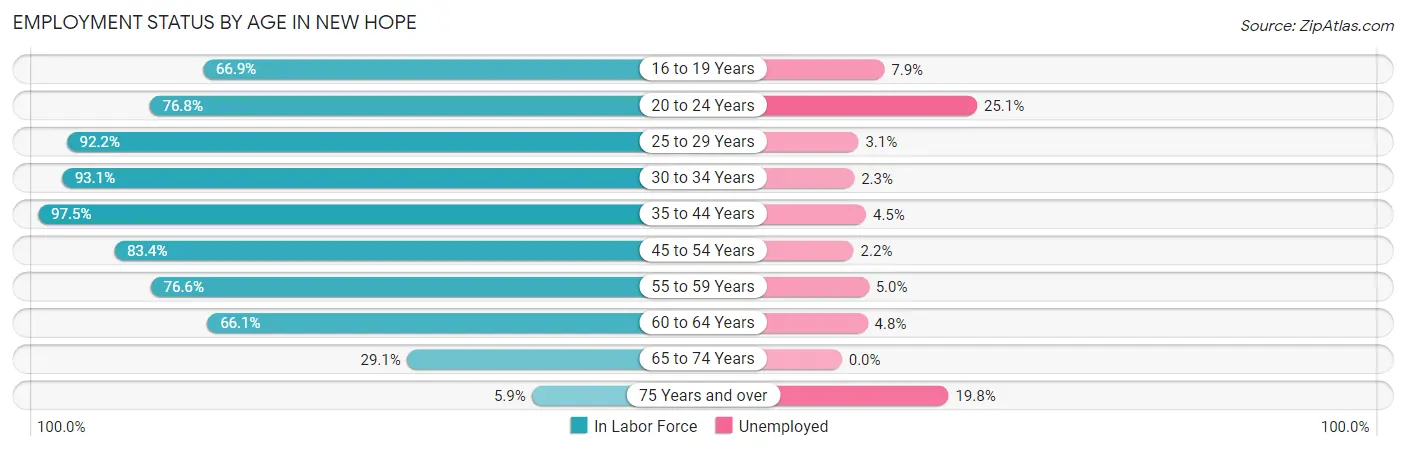
| Age Bracket | In Labor Force | Unemployed |
| 16 to 19 Years | 672 (66.9%) | 53 (7.9%) |
| 20 to 24 Years | 746 (76.8%) | 187 (25.1%) |
| 25 to 29 Years | 1,270 (92.2%) | 39 (3.1%) |
| 30 to 34 Years | 1,652 (93.1%) | 38 (2.3%) |
| 35 to 44 Years | 2,665 (97.5%) | 120 (4.5%) |
| 45 to 54 Years | 2,394 (83.4%) | 53 (2.2%) |
| 55 to 59 Years | 1,173 (76.6%) | 59 (5.0%) |
| 60 to 64 Years | 910 (66.1%) | 44 (4.8%) |
| 65 to 74 Years | 496 (29.1%) | 0 (0.0%) |
| 75 Years and over | 131 (5.9%) | 26 (19.8%) |
| Total | 12,104 (68.9%) | 617 (5.1%) |
Employment Status by Educational Attainment in New Hope
According to labor force statistics for New Hope, 86.3% of individuals (10,063) out of the total population between 25 and 64 years of age (11,661) are in the labor force, with 3.5% or 352 of them being unemployed. The group with the highest labor force participation rate are those with the educational attainment of bachelor's degree or higher, with 94.6% or 4,212 individuals in the labor force. Within the labor force, individuals with bachelor's degree or higher education have the highest percentage of unemployment, with 5.0% or 211 of them being unemployed.
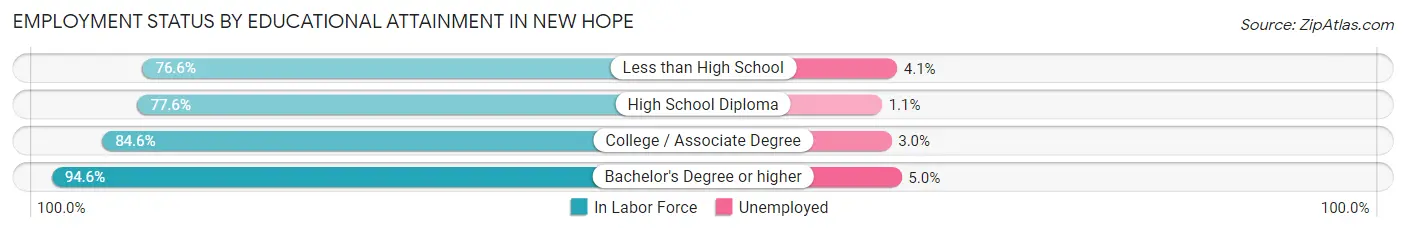
| Educational Attainment | In Labor Force | Unemployed |
| Less than High School | 564 (76.6%) | 30 (4.1%) |
| High School Diploma | 2,113 (77.6%) | 30 (1.1%) |
| College / Associate Degree | 3,172 (84.6%) | 112 (3.0%) |
| Bachelor's Degree or higher | 4,212 (94.6%) | 223 (5.0%) |
| Total | 10,063 (86.3%) | 408 (3.5%) |
Employment Occupations by Sex in New Hope
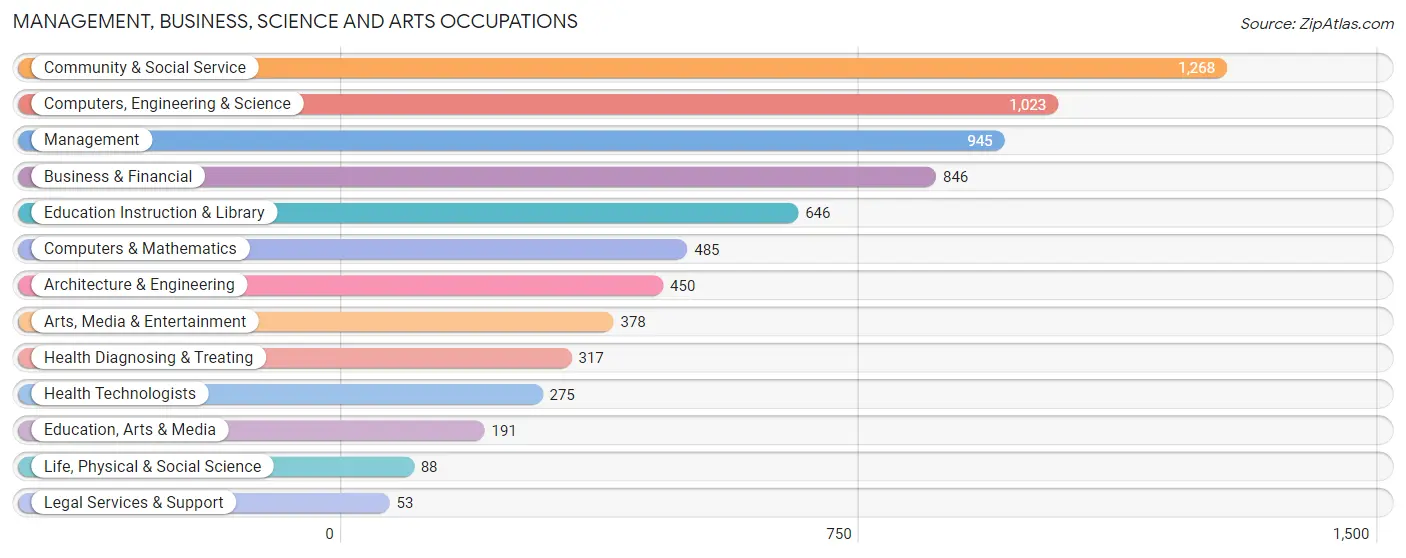
Management, Business, Science and Arts Occupations
The most common Management, Business, Science and Arts occupations in New Hope are Community & Social Service (1,268 | 11.1%), Computers, Engineering & Science (1,023 | 8.9%), Management (945 | 8.2%), Business & Financial (846 | 7.4%), and Education Instruction & Library (646 | 5.6%).
Management, Business, Science and Arts Occupations by Sex
Within the Management, Business, Science and Arts occupations in New Hope, the most male-oriented occupations are Architecture & Engineering (96.9%), Computers, Engineering & Science (82.9%), and Computers & Mathematics (80.2%), while the most female-oriented occupations are Health Technologists (97.1%), Health Diagnosing & Treating (89.6%), and Legal Services & Support (86.8%).
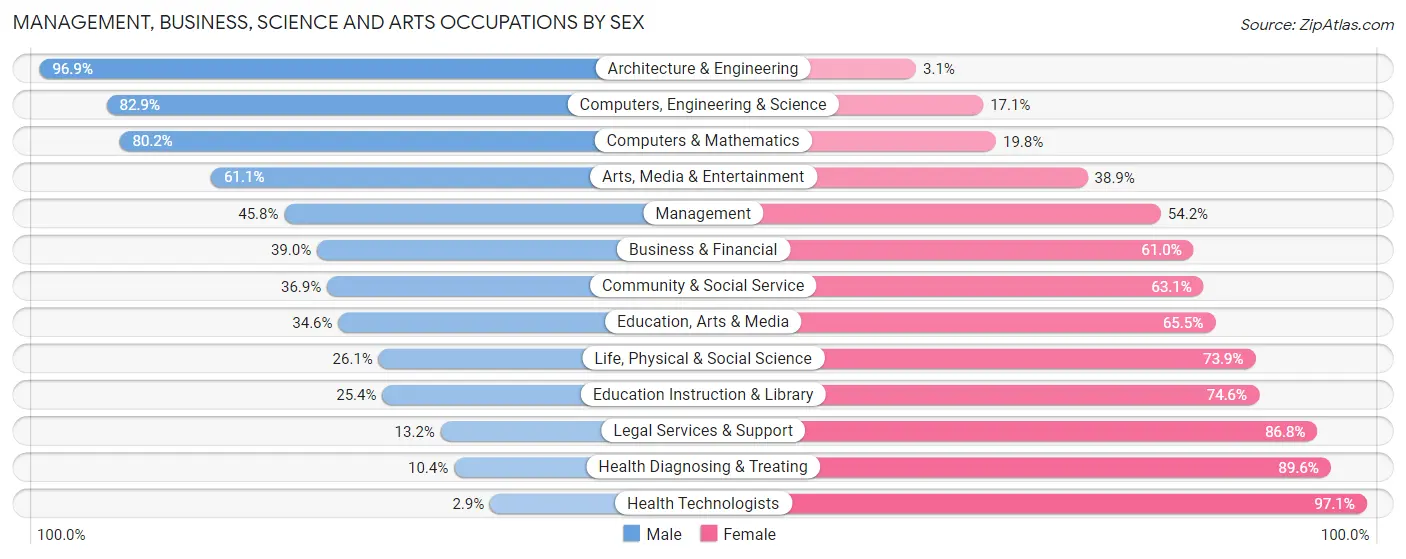
| Occupation | Male | Female |
| Management | 433 (45.8%) | 512 (54.2%) |
| Business & Financial | 330 (39.0%) | 516 (61.0%) |
| Computers, Engineering & Science | 848 (82.9%) | 175 (17.1%) |
| Computers & Mathematics | 389 (80.2%) | 96 (19.8%) |
| Architecture & Engineering | 436 (96.9%) | 14 (3.1%) |
| Life, Physical & Social Science | 23 (26.1%) | 65 (73.9%) |
| Community & Social Service | 468 (36.9%) | 800 (63.1%) |
| Education, Arts & Media | 66 (34.5%) | 125 (65.4%) |
| Legal Services & Support | 7 (13.2%) | 46 (86.8%) |
| Education Instruction & Library | 164 (25.4%) | 482 (74.6%) |
| Arts, Media & Entertainment | 231 (61.1%) | 147 (38.9%) |
| Health Diagnosing & Treating | 33 (10.4%) | 284 (89.6%) |
| Health Technologists | 8 (2.9%) | 267 (97.1%) |
| Total (Category) | 2,112 (48.0%) | 2,287 (52.0%) |
| Total (Overall) | 5,917 (51.6%) | 5,555 (48.4%) |
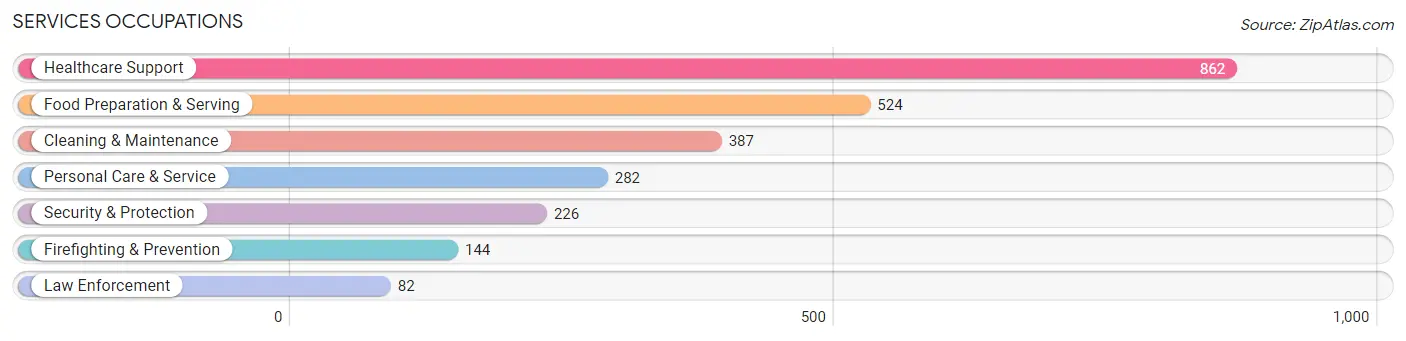
Services Occupations
The most common Services occupations in New Hope are Healthcare Support (862 | 7.5%), Food Preparation & Serving (524 | 4.6%), Cleaning & Maintenance (387 | 3.4%), Personal Care & Service (282 | 2.5%), and Security & Protection (226 | 2.0%).
Services Occupations by Sex
Within the Services occupations in New Hope, the most male-oriented occupations are Law Enforcement (84.2%), Security & Protection (81.9%), and Firefighting & Prevention (80.6%), while the most female-oriented occupations are Healthcare Support (71.7%), Personal Care & Service (71.6%), and Cleaning & Maintenance (60.2%).
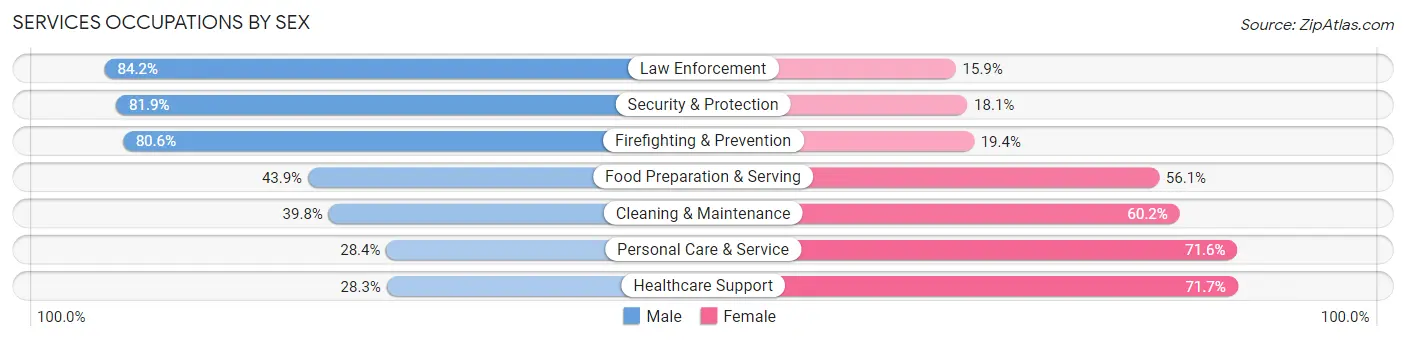
| Occupation | Male | Female |
| Healthcare Support | 244 (28.3%) | 618 (71.7%) |
| Security & Protection | 185 (81.9%) | 41 (18.1%) |
| Firefighting & Prevention | 116 (80.6%) | 28 (19.4%) |
| Law Enforcement | 69 (84.2%) | 13 (15.9%) |
| Food Preparation & Serving | 230 (43.9%) | 294 (56.1%) |
| Cleaning & Maintenance | 154 (39.8%) | 233 (60.2%) |
| Personal Care & Service | 80 (28.4%) | 202 (71.6%) |
| Total (Category) | 893 (39.2%) | 1,388 (60.9%) |
| Total (Overall) | 5,917 (51.6%) | 5,555 (48.4%) |
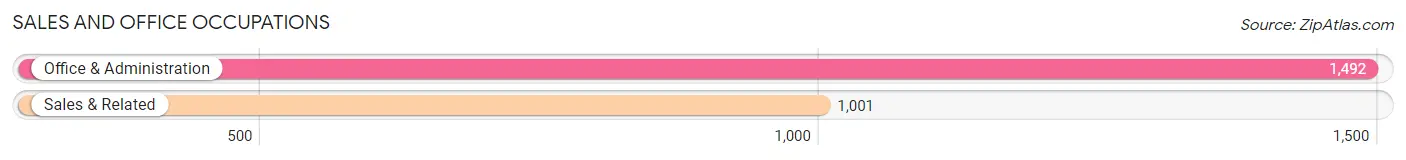
Sales and Office Occupations
The most common Sales and Office occupations in New Hope are Office & Administration (1,492 | 13.0%), and Sales & Related (1,001 | 8.7%).
Sales and Office Occupations by Sex
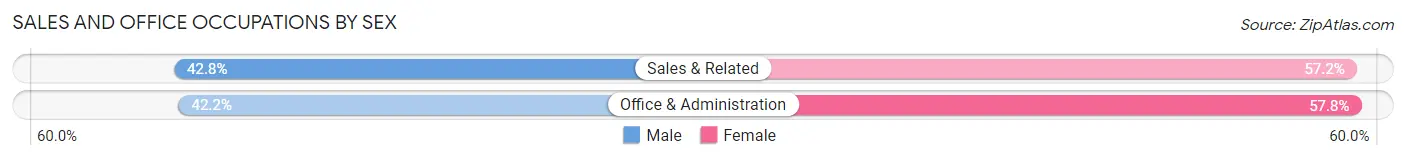
| Occupation | Male | Female |
| Sales & Related | 428 (42.8%) | 573 (57.2%) |
| Office & Administration | 630 (42.2%) | 862 (57.8%) |
| Total (Category) | 1,058 (42.4%) | 1,435 (57.6%) |
| Total (Overall) | 5,917 (51.6%) | 5,555 (48.4%) |
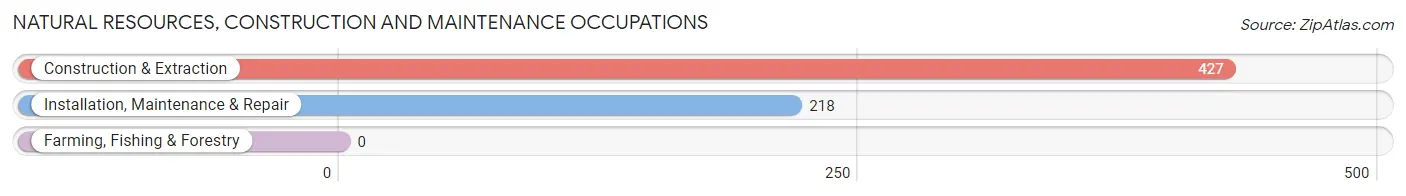
Natural Resources, Construction and Maintenance Occupations
The most common Natural Resources, Construction and Maintenance occupations in New Hope are Construction & Extraction (427 | 3.7%), and Installation, Maintenance & Repair (218 | 1.9%).
Natural Resources, Construction and Maintenance Occupations by Sex
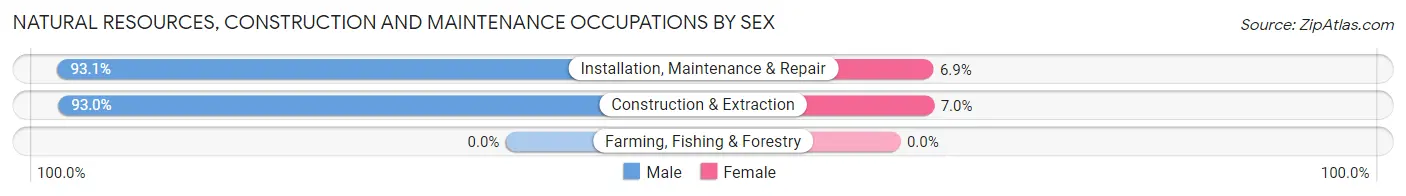
| Occupation | Male | Female |
| Farming, Fishing & Forestry | 0 (0.0%) | 0 (0.0%) |
| Construction & Extraction | 397 (93.0%) | 30 (7.0%) |
| Installation, Maintenance & Repair | 203 (93.1%) | 15 (6.9%) |
| Total (Category) | 600 (93.0%) | 45 (7.0%) |
| Total (Overall) | 5,917 (51.6%) | 5,555 (48.4%) |
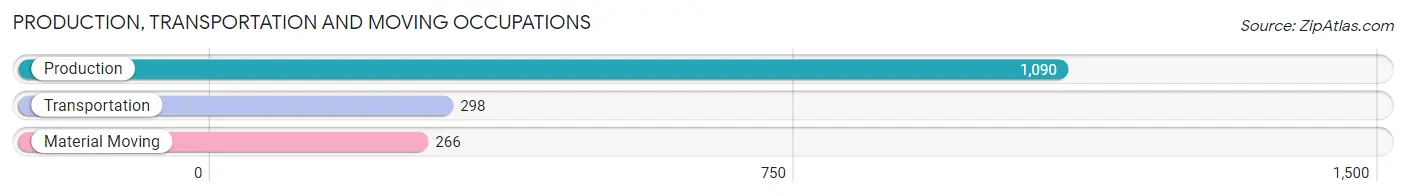
Production, Transportation and Moving Occupations
The most common Production, Transportation and Moving occupations in New Hope are Production (1,090 | 9.5%), Transportation (298 | 2.6%), and Material Moving (266 | 2.3%).
Production, Transportation and Moving Occupations by Sex
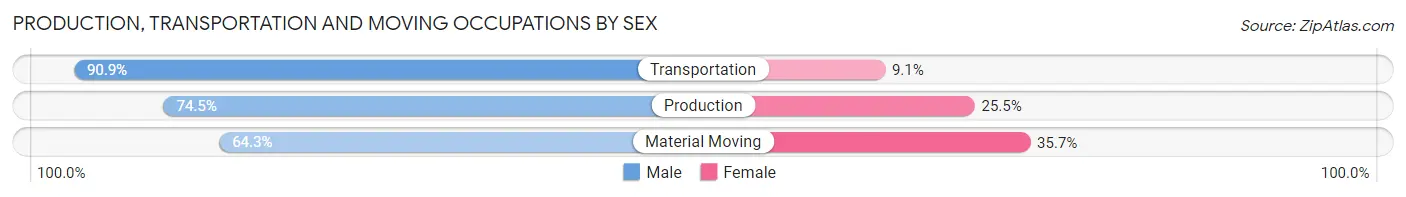
| Occupation | Male | Female |
| Production | 812 (74.5%) | 278 (25.5%) |
| Transportation | 271 (90.9%) | 27 (9.1%) |
| Material Moving | 171 (64.3%) | 95 (35.7%) |
| Total (Category) | 1,254 (75.8%) | 400 (24.2%) |
| Total (Overall) | 5,917 (51.6%) | 5,555 (48.4%) |
Employment Industries by Sex in New Hope
Employment Industries in New Hope
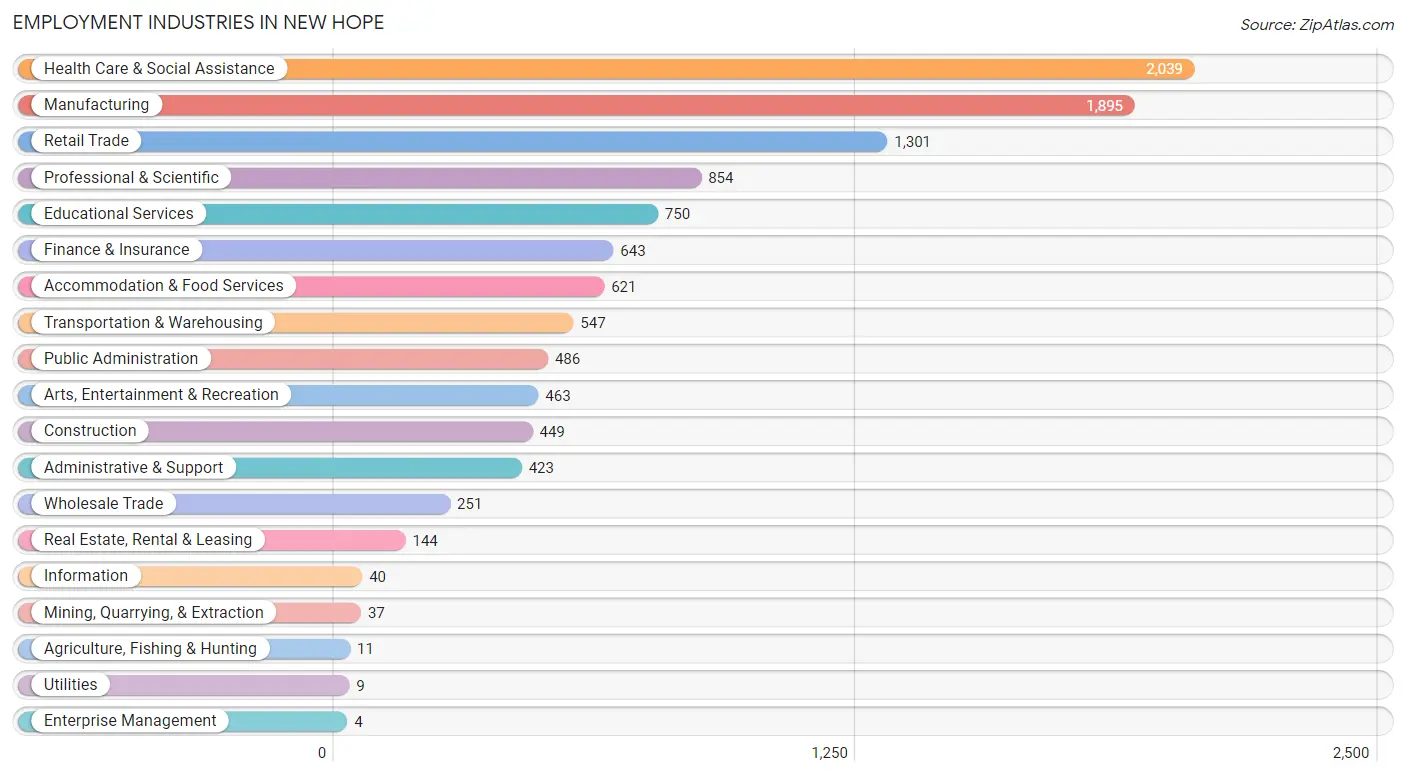
The major employment industries in New Hope include Health Care & Social Assistance (2,039 | 17.8%), Manufacturing (1,895 | 16.5%), Retail Trade (1,301 | 11.3%), Professional & Scientific (854 | 7.4%), and Educational Services (750 | 6.5%).
Employment Industries by Sex in New Hope
The New Hope industries that see more men than women are Agriculture, Fishing & Hunting (100.0%), Mining, Quarrying, & Extraction (100.0%), and Utilities (100.0%), whereas the industries that tend to have a higher number of women are Health Care & Social Assistance (76.7%), Educational Services (69.9%), and Accommodation & Food Services (64.9%).
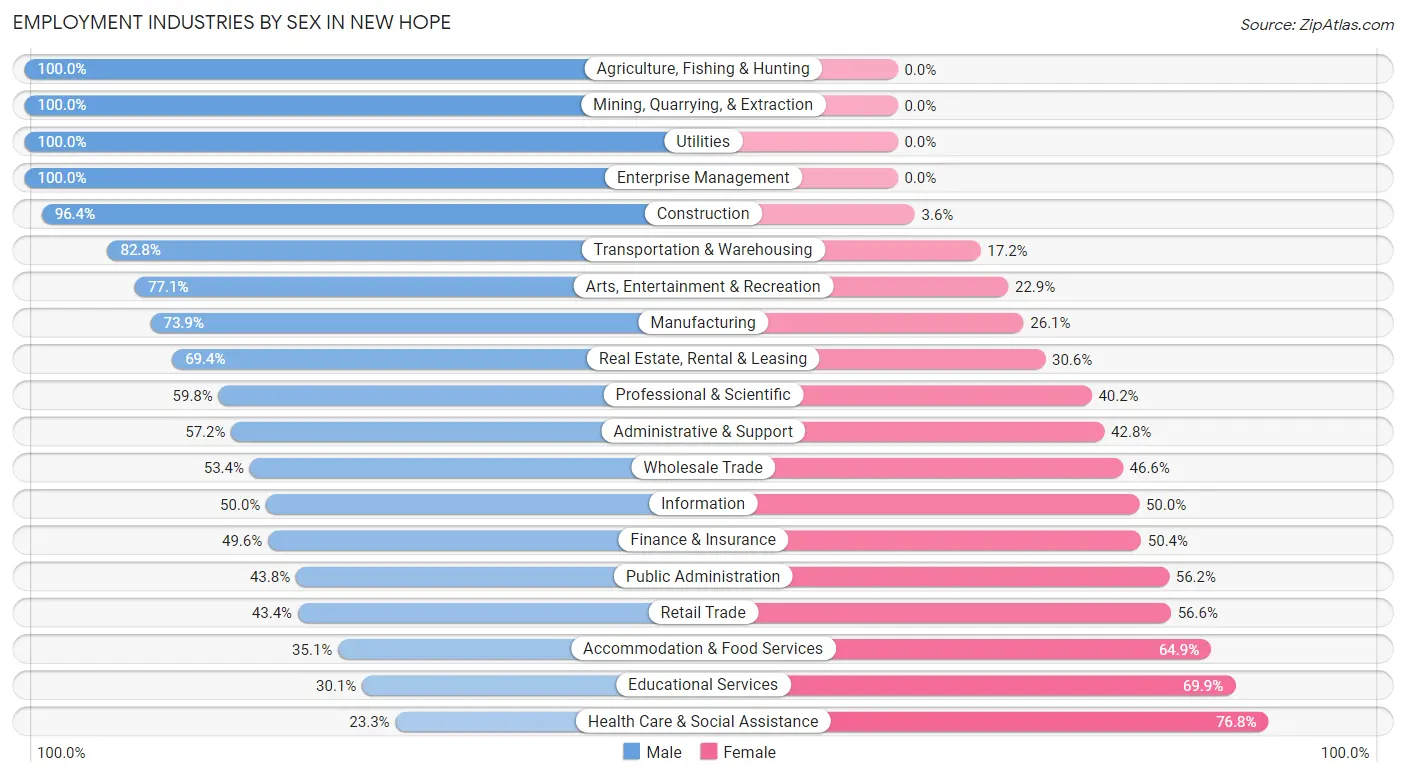
| Industry | Male | Female |
| Agriculture, Fishing & Hunting | 11 (100.0%) | 0 (0.0%) |
| Mining, Quarrying, & Extraction | 37 (100.0%) | 0 (0.0%) |
| Construction | 433 (96.4%) | 16 (3.6%) |
| Manufacturing | 1,401 (73.9%) | 494 (26.1%) |
| Wholesale Trade | 134 (53.4%) | 117 (46.6%) |
| Retail Trade | 565 (43.4%) | 736 (56.6%) |
| Transportation & Warehousing | 453 (82.8%) | 94 (17.2%) |
| Utilities | 9 (100.0%) | 0 (0.0%) |
| Information | 20 (50.0%) | 20 (50.0%) |
| Finance & Insurance | 319 (49.6%) | 324 (50.4%) |
| Real Estate, Rental & Leasing | 100 (69.4%) | 44 (30.6%) |
| Professional & Scientific | 511 (59.8%) | 343 (40.2%) |
| Enterprise Management | 4 (100.0%) | 0 (0.0%) |
| Administrative & Support | 242 (57.2%) | 181 (42.8%) |
| Educational Services | 226 (30.1%) | 524 (69.9%) |
| Health Care & Social Assistance | 474 (23.3%) | 1,565 (76.7%) |
| Arts, Entertainment & Recreation | 357 (77.1%) | 106 (22.9%) |
| Accommodation & Food Services | 218 (35.1%) | 403 (64.9%) |
| Public Administration | 213 (43.8%) | 273 (56.2%) |
| Total | 5,917 (51.6%) | 5,555 (48.4%) |
Education in New Hope
School Enrollment in New Hope
The most common levels of schooling among the 4,433 students in New Hope are elementary school (1,089 | 24.6%), high school (1,014 | 22.9%), and middle school (885 | 20.0%).
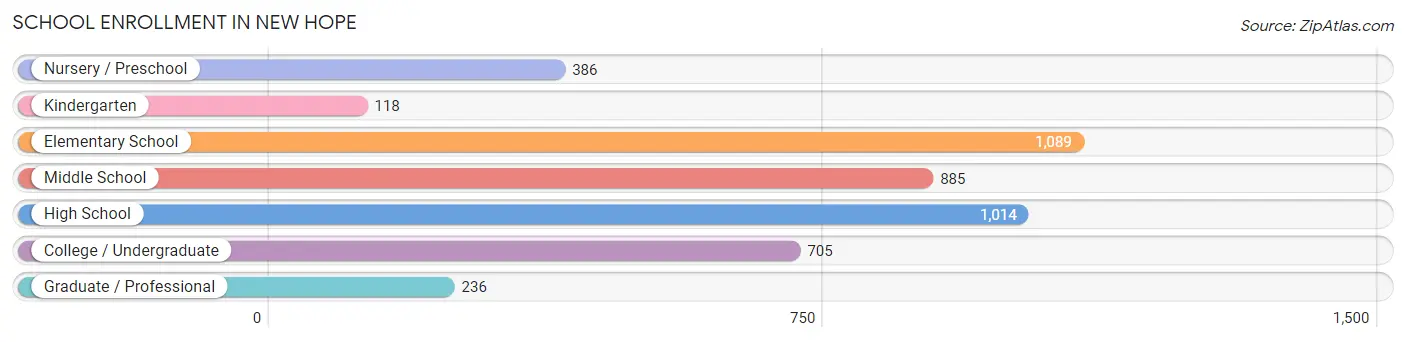
| School Level | # Students | % Students |
| Nursery / Preschool | 386 | 8.7% |
| Kindergarten | 118 | 2.7% |
| Elementary School | 1,089 | 24.6% |
| Middle School | 885 | 20.0% |
| High School | 1,014 | 22.9% |
| College / Undergraduate | 705 | 15.9% |
| Graduate / Professional | 236 | 5.3% |
| Total | 4,433 | 100.0% |
School Enrollment by Age by Funding Source in New Hope
Out of a total of 4,433 students who are enrolled in schools in New Hope, 683 (15.4%) attend a private institution, while the remaining 3,750 (84.6%) are enrolled in public schools. The age group of 25 to 34 year olds has the highest likelihood of being enrolled in private schools, with 104 (41.4% in the age bracket) enrolled. Conversely, the age group of 5 to 9 year old has the lowest likelihood of being enrolled in a private school, with 1,126 (93.6% in the age bracket) attending a public institution.
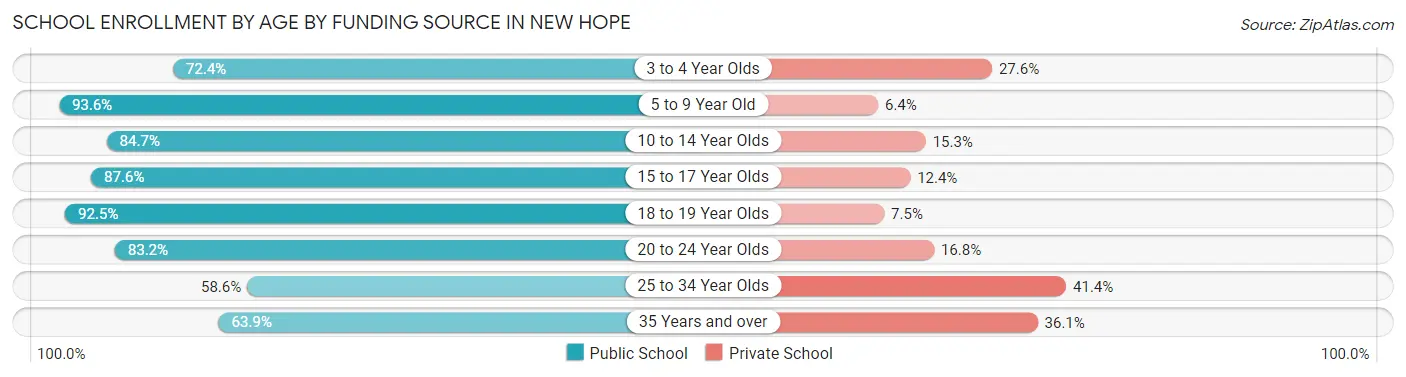
| Age Bracket | Public School | Private School |
| 3 to 4 Year Olds | 220 (72.4%) | 84 (27.6%) |
| 5 to 9 Year Old | 1,126 (93.6%) | 77 (6.4%) |
| 10 to 14 Year Olds | 904 (84.7%) | 163 (15.3%) |
| 15 to 17 Year Olds | 693 (87.6%) | 98 (12.4%) |
| 18 to 19 Year Olds | 380 (92.5%) | 31 (7.5%) |
| 20 to 24 Year Olds | 89 (83.2%) | 18 (16.8%) |
| 25 to 34 Year Olds | 147 (58.6%) | 104 (41.4%) |
| 35 Years and over | 191 (63.9%) | 108 (36.1%) |
| Total | 3,750 (84.6%) | 683 (15.4%) |
Educational Attainment by Field of Study in New Hope
Business (1,295 | 20.5%), education (687 | 10.9%), bio, nature & agricultural (557 | 8.8%), communications (528 | 8.4%), and engineering (487 | 7.7%) are the most common fields of study among 6,324 individuals in New Hope who have obtained a bachelor's degree or higher.
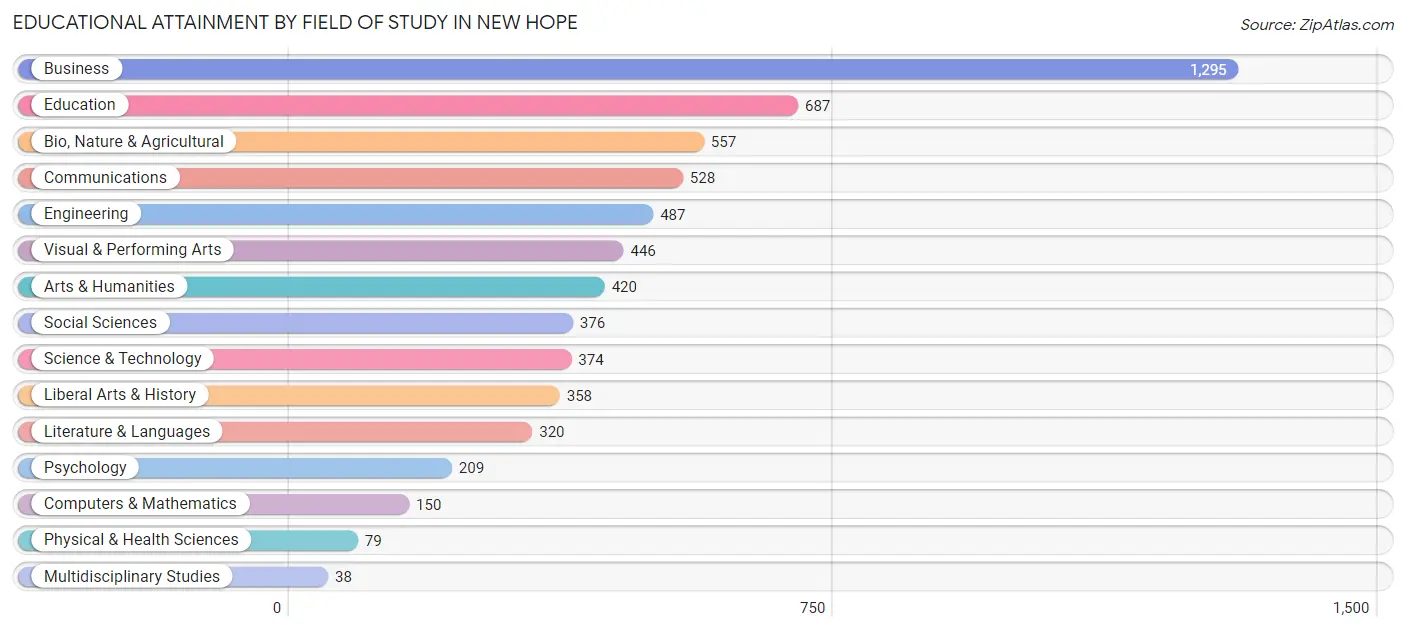
| Field of Study | # Graduates | % Graduates |
| Computers & Mathematics | 150 | 2.4% |
| Bio, Nature & Agricultural | 557 | 8.8% |
| Physical & Health Sciences | 79 | 1.3% |
| Psychology | 209 | 3.3% |
| Social Sciences | 376 | 5.9% |
| Engineering | 487 | 7.7% |
| Multidisciplinary Studies | 38 | 0.6% |
| Science & Technology | 374 | 5.9% |
| Business | 1,295 | 20.5% |
| Education | 687 | 10.9% |
| Literature & Languages | 320 | 5.1% |
| Liberal Arts & History | 358 | 5.7% |
| Visual & Performing Arts | 446 | 7.0% |
| Communications | 528 | 8.4% |
| Arts & Humanities | 420 | 6.6% |
| Total | 6,324 | 100.0% |
Transportation & Commute in New Hope
Vehicle Availability by Sex in New Hope
The most prevalent vehicle ownership categories in New Hope are males with 2 vehicles (2,857, accounting for 49.7%) and females with 2 vehicles (2,624, making up 54.3%).
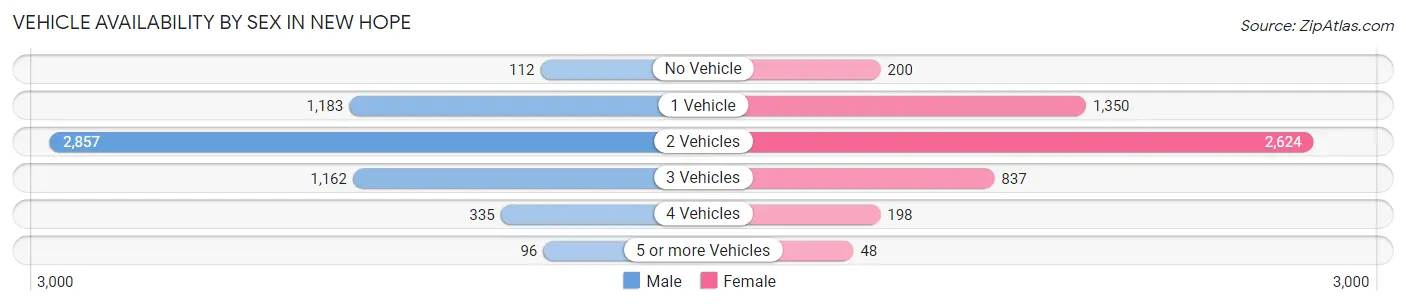
| Vehicles Available | Male | Female |
| No Vehicle | 112 (1.9%) | 200 (3.8%) |
| 1 Vehicle | 1,183 (20.6%) | 1,350 (25.7%) |
| 2 Vehicles | 2,857 (49.7%) | 2,624 (49.9%) |
| 3 Vehicles | 1,162 (20.2%) | 837 (15.9%) |
| 4 Vehicles | 335 (5.8%) | 198 (3.8%) |
| 5 or more Vehicles | 96 (1.7%) | 48 (0.9%) |
| Total | 5,745 (100.0%) | 5,257 (100.0%) |
Commute Time in New Hope
The most frequently occuring commute durations in New Hope are 20 to 24 minutes (2,065 commuters, 21.1%), 15 to 19 minutes (1,667 commuters, 17.0%), and 10 to 14 minutes (1,594 commuters, 16.3%).
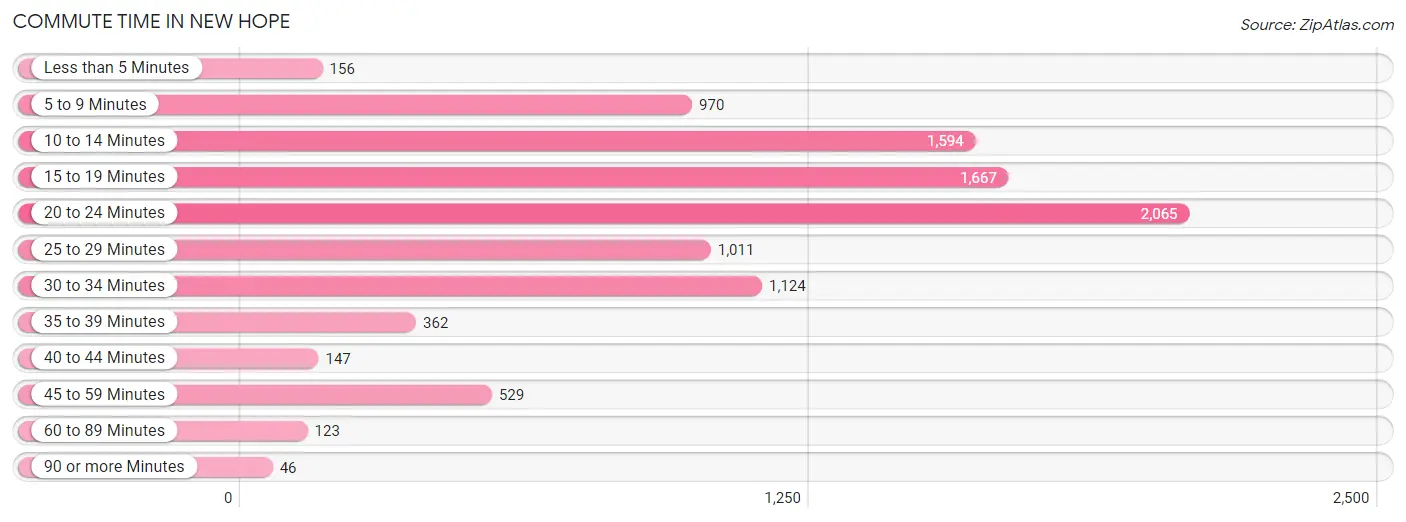
| Commute Time | # Commuters | % Commuters |
| Less than 5 Minutes | 156 | 1.6% |
| 5 to 9 Minutes | 970 | 9.9% |
| 10 to 14 Minutes | 1,594 | 16.3% |
| 15 to 19 Minutes | 1,667 | 17.0% |
| 20 to 24 Minutes | 2,065 | 21.1% |
| 25 to 29 Minutes | 1,011 | 10.3% |
| 30 to 34 Minutes | 1,124 | 11.5% |
| 35 to 39 Minutes | 362 | 3.7% |
| 40 to 44 Minutes | 147 | 1.5% |
| 45 to 59 Minutes | 529 | 5.4% |
| 60 to 89 Minutes | 123 | 1.3% |
| 90 or more Minutes | 46 | 0.5% |
Commute Time by Sex in New Hope
The most common commute times in New Hope are 20 to 24 minutes (1,095 commuters, 20.8%) for males and 20 to 24 minutes (970 commuters, 21.4%) for females.
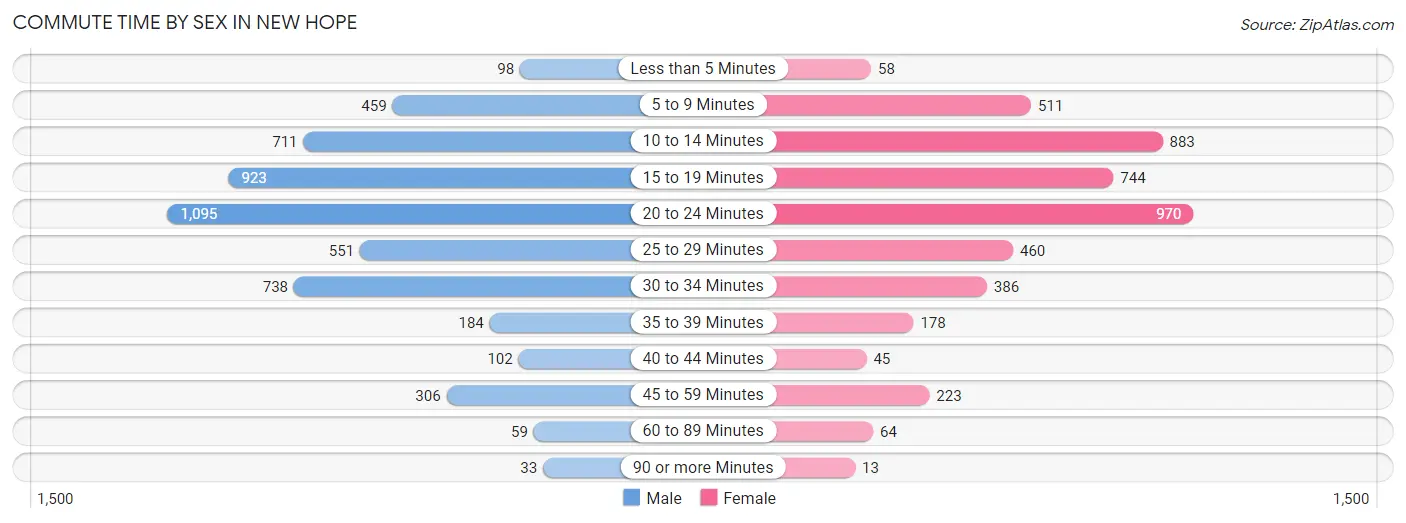
| Commute Time | Male | Female |
| Less than 5 Minutes | 98 (1.9%) | 58 (1.3%) |
| 5 to 9 Minutes | 459 (8.7%) | 511 (11.3%) |
| 10 to 14 Minutes | 711 (13.5%) | 883 (19.5%) |
| 15 to 19 Minutes | 923 (17.5%) | 744 (16.4%) |
| 20 to 24 Minutes | 1,095 (20.8%) | 970 (21.4%) |
| 25 to 29 Minutes | 551 (10.5%) | 460 (10.1%) |
| 30 to 34 Minutes | 738 (14.0%) | 386 (8.5%) |
| 35 to 39 Minutes | 184 (3.5%) | 178 (3.9%) |
| 40 to 44 Minutes | 102 (1.9%) | 45 (1.0%) |
| 45 to 59 Minutes | 306 (5.8%) | 223 (4.9%) |
| 60 to 89 Minutes | 59 (1.1%) | 64 (1.4%) |
| 90 or more Minutes | 33 (0.6%) | 13 (0.3%) |
Time of Departure to Work by Sex in New Hope
The most frequent times of departure to work in New Hope are 7:00 AM to 7:29 AM (720, 13.7%) for males and 6:30 AM to 6:59 AM (740, 16.3%) for females.
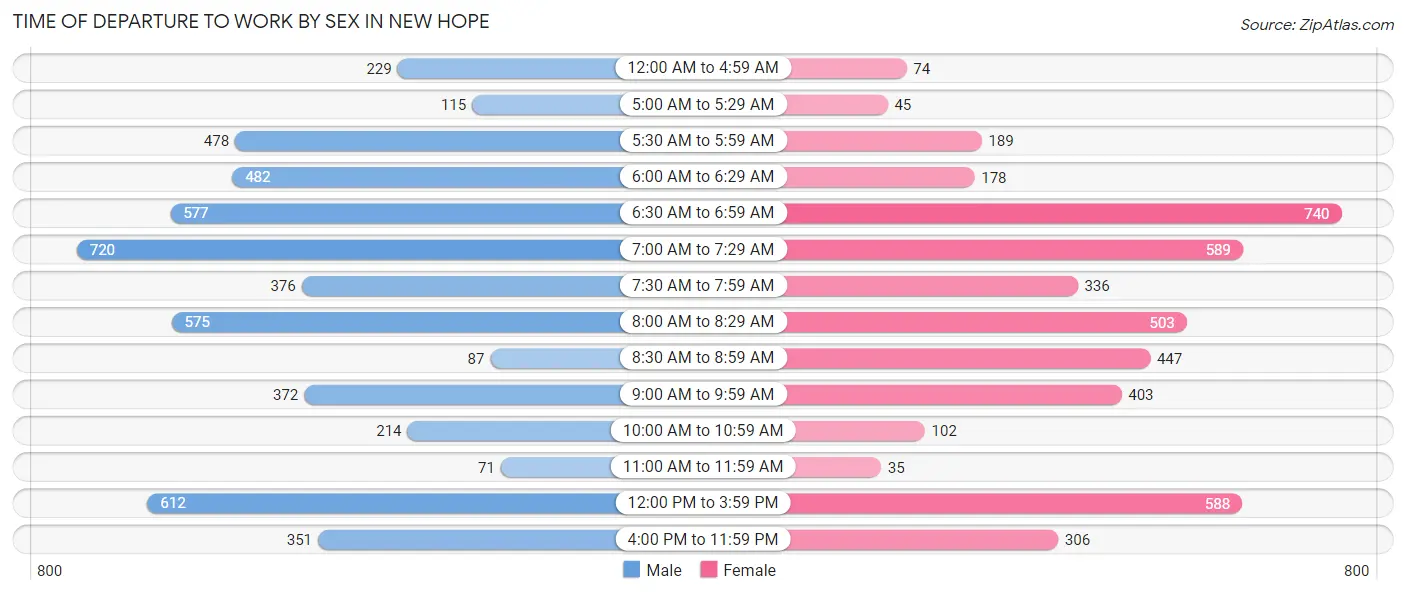
| Time of Departure | Male | Female |
| 12:00 AM to 4:59 AM | 229 (4.3%) | 74 (1.6%) |
| 5:00 AM to 5:29 AM | 115 (2.2%) | 45 (1.0%) |
| 5:30 AM to 5:59 AM | 478 (9.1%) | 189 (4.2%) |
| 6:00 AM to 6:29 AM | 482 (9.2%) | 178 (3.9%) |
| 6:30 AM to 6:59 AM | 577 (11.0%) | 740 (16.3%) |
| 7:00 AM to 7:29 AM | 720 (13.7%) | 589 (13.0%) |
| 7:30 AM to 7:59 AM | 376 (7.1%) | 336 (7.4%) |
| 8:00 AM to 8:29 AM | 575 (10.9%) | 503 (11.1%) |
| 8:30 AM to 8:59 AM | 87 (1.7%) | 447 (9.9%) |
| 9:00 AM to 9:59 AM | 372 (7.1%) | 403 (8.9%) |
| 10:00 AM to 10:59 AM | 214 (4.1%) | 102 (2.2%) |
| 11:00 AM to 11:59 AM | 71 (1.3%) | 35 (0.8%) |
| 12:00 PM to 3:59 PM | 612 (11.6%) | 588 (13.0%) |
| 4:00 PM to 11:59 PM | 351 (6.7%) | 306 (6.8%) |
| Total | 5,259 (100.0%) | 4,535 (100.0%) |
Housing Occupancy in New Hope
Occupancy by Ownership in New Hope
Of the total 9,120 dwellings in New Hope, owner-occupied units account for 4,868 (53.4%), while renter-occupied units make up 4,252 (46.6%).
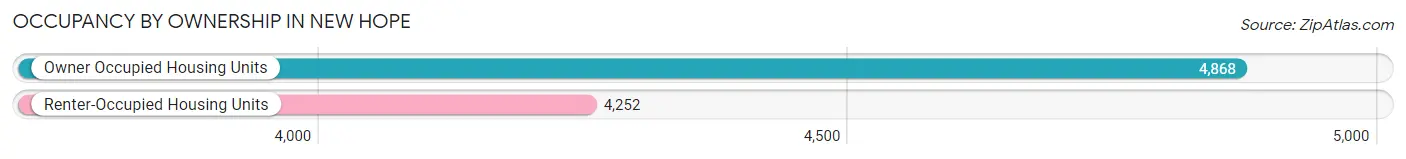
| Occupancy | # Housing Units | % Housing Units |
| Owner Occupied Housing Units | 4,868 | 53.4% |
| Renter-Occupied Housing Units | 4,252 | 46.6% |
| Total Occupied Housing Units | 9,120 | 100.0% |
Occupancy by Household Size in New Hope
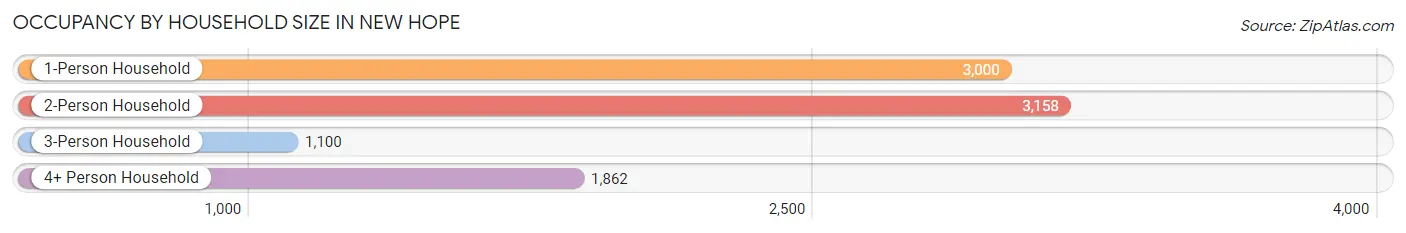
| Household Size | # Housing Units | % Housing Units |
| 1-Person Household | 3,000 | 32.9% |
| 2-Person Household | 3,158 | 34.6% |
| 3-Person Household | 1,100 | 12.1% |
| 4+ Person Household | 1,862 | 20.4% |
| Total Housing Units | 9,120 | 100.0% |
Occupancy by Ownership by Household Size in New Hope
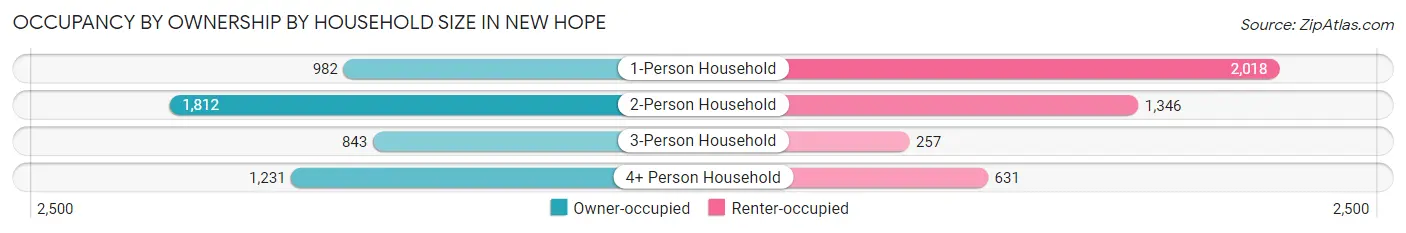
| Household Size | Owner-occupied | Renter-occupied |
| 1-Person Household | 982 (32.7%) | 2,018 (67.3%) |
| 2-Person Household | 1,812 (57.4%) | 1,346 (42.6%) |
| 3-Person Household | 843 (76.6%) | 257 (23.4%) |
| 4+ Person Household | 1,231 (66.1%) | 631 (33.9%) |
| Total Housing Units | 4,868 (53.4%) | 4,252 (46.6%) |
Occupancy by Educational Attainment in New Hope
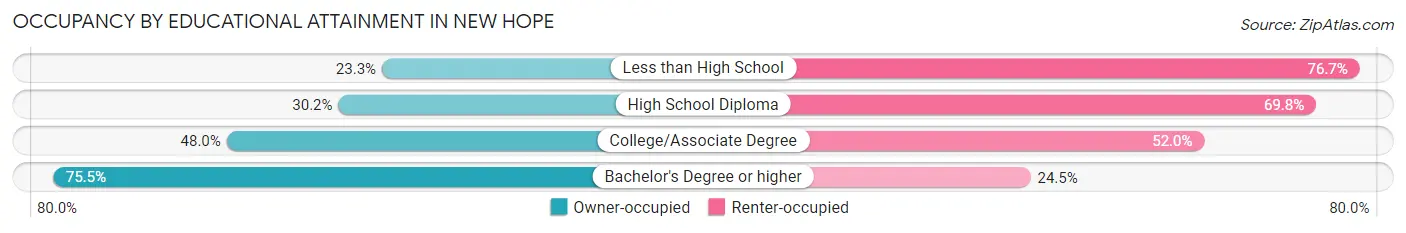
| Household Size | Owner-occupied | Renter-occupied |
| Less than High School | 91 (23.3%) | 299 (76.7%) |
| High School Diploma | 607 (30.2%) | 1,401 (69.8%) |
| College/Associate Degree | 1,578 (48.0%) | 1,712 (52.0%) |
| Bachelor's Degree or higher | 2,592 (75.5%) | 840 (24.5%) |
Occupancy by Age of Householder in New Hope
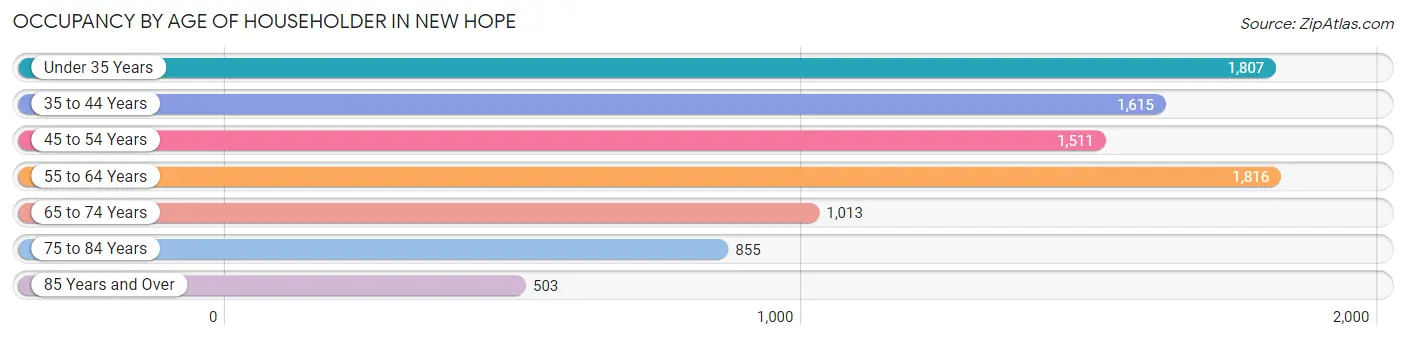
| Age Bracket | # Households | % Households |
| Under 35 Years | 1,807 | 19.8% |
| 35 to 44 Years | 1,615 | 17.7% |
| 45 to 54 Years | 1,511 | 16.6% |
| 55 to 64 Years | 1,816 | 19.9% |
| 65 to 74 Years | 1,013 | 11.1% |
| 75 to 84 Years | 855 | 9.4% |
| 85 Years and Over | 503 | 5.5% |
| Total | 9,120 | 100.0% |
Housing Finances in New Hope
Median Income by Occupancy in New Hope
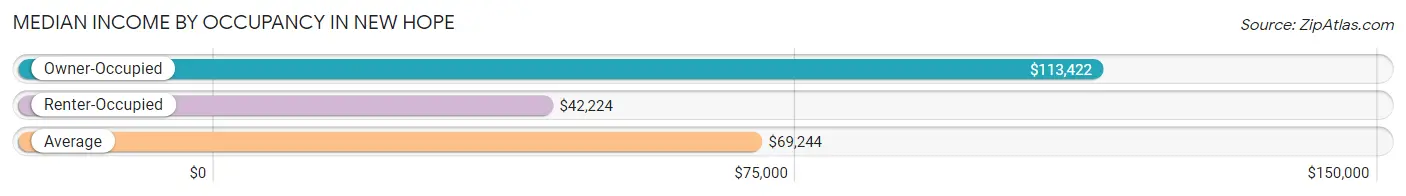
| Occupancy Type | # Households | Median Income |
| Owner-Occupied | 4,868 (53.4%) | $113,422 |
| Renter-Occupied | 4,252 (46.6%) | $42,224 |
| Average | 9,120 (100.0%) | $69,244 |
Occupancy by Householder Income Bracket in New Hope
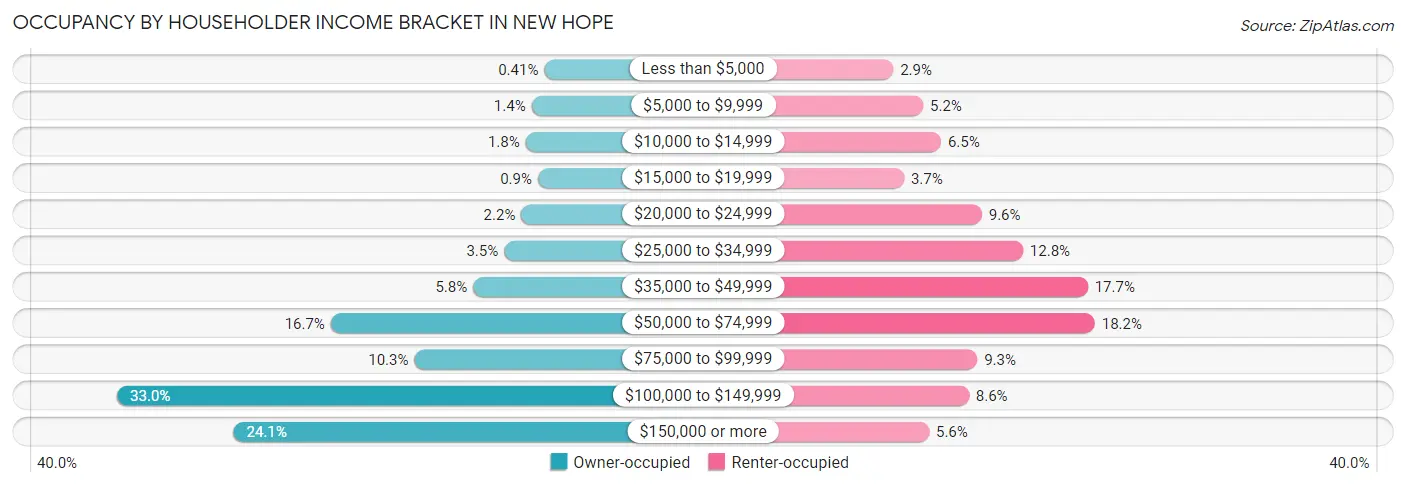
| Income Bracket | Owner-occupied | Renter-occupied |
| Less than $5,000 | 20 (0.4%) | 122 (2.9%) |
| $5,000 to $9,999 | 67 (1.4%) | 219 (5.1%) |
| $10,000 to $14,999 | 89 (1.8%) | 277 (6.5%) |
| $15,000 to $19,999 | 44 (0.9%) | 157 (3.7%) |
| $20,000 to $24,999 | 105 (2.2%) | 409 (9.6%) |
| $25,000 to $34,999 | 169 (3.5%) | 542 (12.8%) |
| $35,000 to $49,999 | 284 (5.8%) | 752 (17.7%) |
| $50,000 to $74,999 | 812 (16.7%) | 775 (18.2%) |
| $75,000 to $99,999 | 502 (10.3%) | 394 (9.3%) |
| $100,000 to $149,999 | 1,604 (33.0%) | 367 (8.6%) |
| $150,000 or more | 1,172 (24.1%) | 238 (5.6%) |
| Total | 4,868 (100.0%) | 4,252 (100.0%) |
Monthly Housing Cost Tiers in New Hope
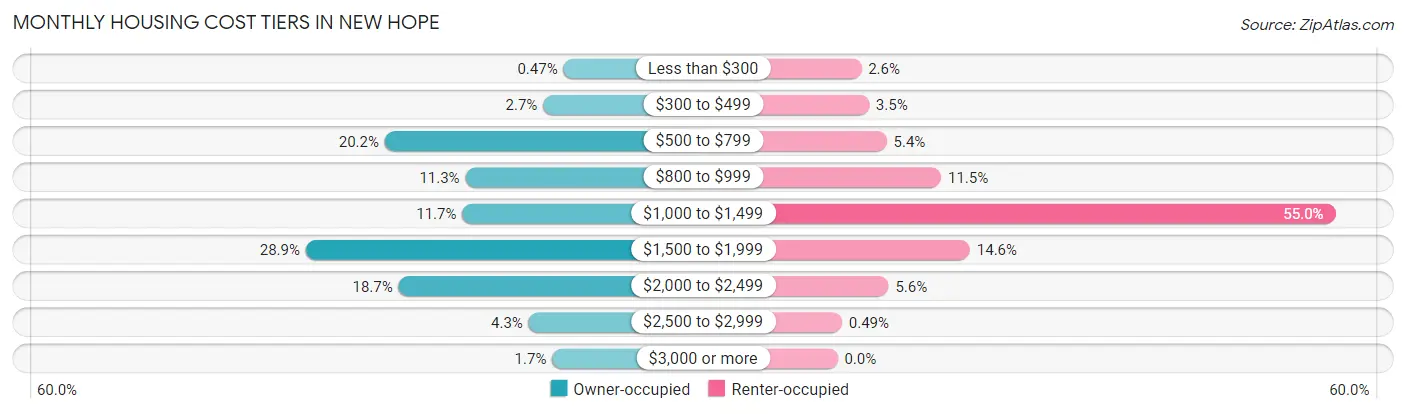
| Monthly Cost | Owner-occupied | Renter-occupied |
| Less than $300 | 23 (0.5%) | 112 (2.6%) |
| $300 to $499 | 132 (2.7%) | 148 (3.5%) |
| $500 to $799 | 984 (20.2%) | 231 (5.4%) |
| $800 to $999 | 550 (11.3%) | 487 (11.5%) |
| $1,000 to $1,499 | 567 (11.7%) | 2,339 (55.0%) |
| $1,500 to $1,999 | 1,409 (28.9%) | 622 (14.6%) |
| $2,000 to $2,499 | 910 (18.7%) | 240 (5.6%) |
| $2,500 to $2,999 | 210 (4.3%) | 21 (0.5%) |
| $3,000 or more | 83 (1.7%) | 0 (0.0%) |
| Total | 4,868 (100.0%) | 4,252 (100.0%) |
Physical Housing Characteristics in New Hope
Housing Structures in New Hope
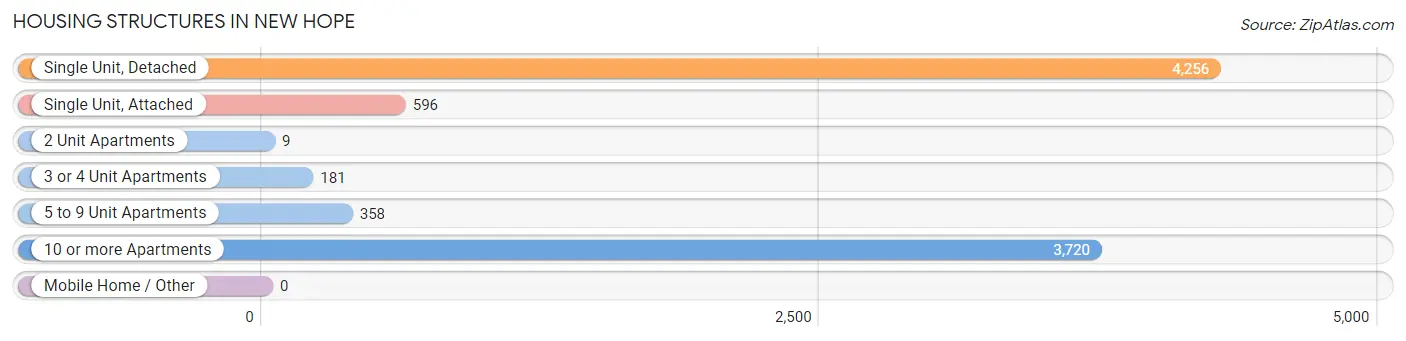
| Structure Type | # Housing Units | % Housing Units |
| Single Unit, Detached | 4,256 | 46.7% |
| Single Unit, Attached | 596 | 6.5% |
| 2 Unit Apartments | 9 | 0.1% |
| 3 or 4 Unit Apartments | 181 | 2.0% |
| 5 to 9 Unit Apartments | 358 | 3.9% |
| 10 or more Apartments | 3,720 | 40.8% |
| Mobile Home / Other | 0 | 0.0% |
| Total | 9,120 | 100.0% |
Housing Structures by Occupancy in New Hope
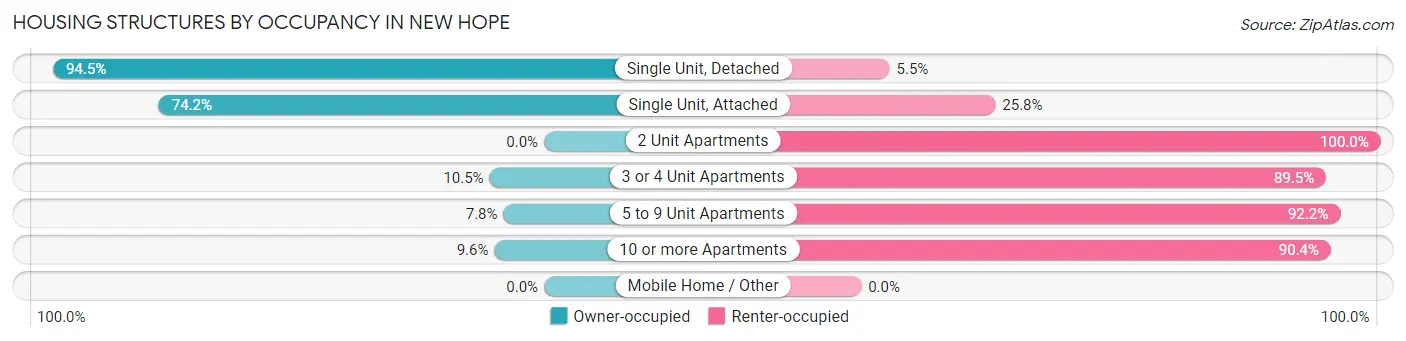
| Structure Type | Owner-occupied | Renter-occupied |
| Single Unit, Detached | 4,023 (94.5%) | 233 (5.5%) |
| Single Unit, Attached | 442 (74.2%) | 154 (25.8%) |
| 2 Unit Apartments | 0 (0.0%) | 9 (100.0%) |
| 3 or 4 Unit Apartments | 19 (10.5%) | 162 (89.5%) |
| 5 to 9 Unit Apartments | 28 (7.8%) | 330 (92.2%) |
| 10 or more Apartments | 356 (9.6%) | 3,364 (90.4%) |
| Mobile Home / Other | 0 (0.0%) | 0 (0.0%) |
| Total | 4,868 (53.4%) | 4,252 (46.6%) |
Housing Structures by Number of Rooms in New Hope
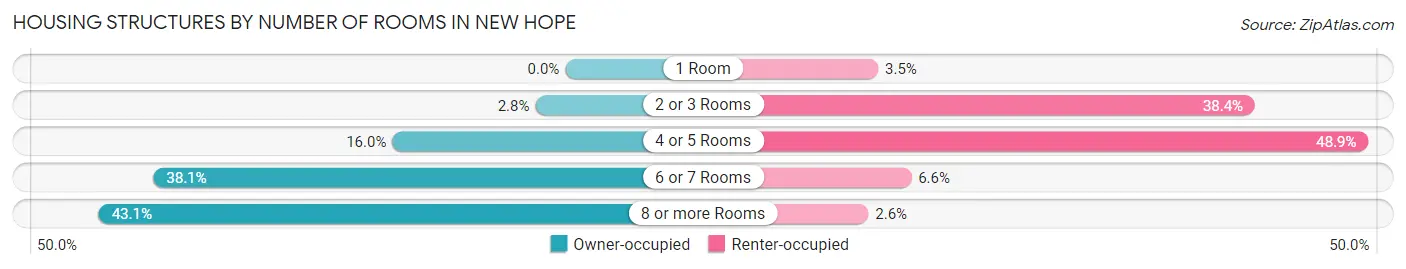
| Number of Rooms | Owner-occupied | Renter-occupied |
| 1 Room | 0 (0.0%) | 150 (3.5%) |
| 2 or 3 Rooms | 135 (2.8%) | 1,632 (38.4%) |
| 4 or 5 Rooms | 779 (16.0%) | 2,078 (48.9%) |
| 6 or 7 Rooms | 1,854 (38.1%) | 280 (6.6%) |
| 8 or more Rooms | 2,100 (43.1%) | 112 (2.6%) |
| Total | 4,868 (100.0%) | 4,252 (100.0%) |
Housing Structure by Heating Type in New Hope
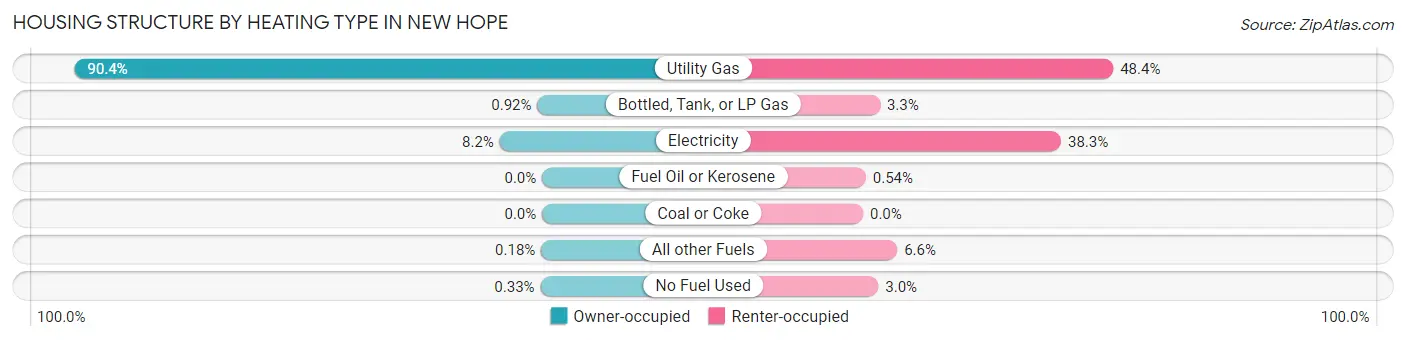
| Heating Type | Owner-occupied | Renter-occupied |
| Utility Gas | 4,399 (90.4%) | 2,056 (48.3%) |
| Bottled, Tank, or LP Gas | 45 (0.9%) | 139 (3.3%) |
| Electricity | 399 (8.2%) | 1,627 (38.3%) |
| Fuel Oil or Kerosene | 0 (0.0%) | 23 (0.5%) |
| Coal or Coke | 0 (0.0%) | 0 (0.0%) |
| All other Fuels | 9 (0.2%) | 281 (6.6%) |
| No Fuel Used | 16 (0.3%) | 126 (3.0%) |
| Total | 4,868 (100.0%) | 4,252 (100.0%) |
Household Vehicle Usage in New Hope
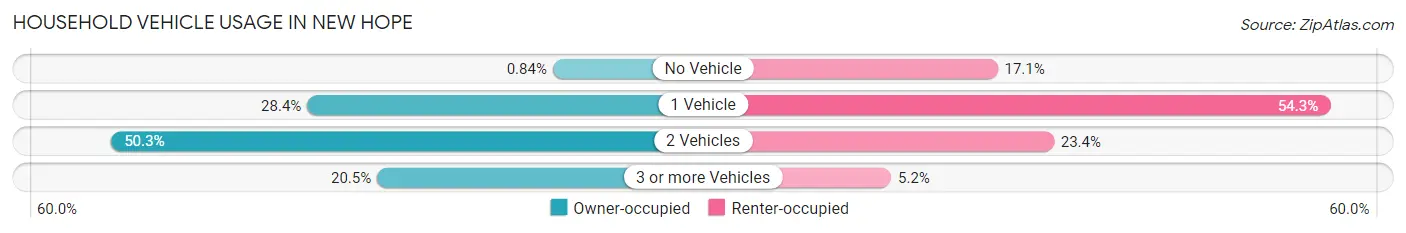
| Vehicles per Household | Owner-occupied | Renter-occupied |
| No Vehicle | 41 (0.8%) | 727 (17.1%) |
| 1 Vehicle | 1,380 (28.3%) | 2,310 (54.3%) |
| 2 Vehicles | 2,448 (50.3%) | 995 (23.4%) |
| 3 or more Vehicles | 999 (20.5%) | 220 (5.2%) |
| Total | 4,868 (100.0%) | 4,252 (100.0%) |
Real Estate & Mortgages in New Hope
Real Estate and Mortgage Overview in New Hope
| Characteristic | Without Mortgage | With Mortgage |
| Housing Units | 1,639 | 3,229 |
| Median Property Value | $289,500 | $296,800 |
| Median Household Income | $87,034 | $962 |
| Monthly Housing Costs | $697 | $83 |
| Real Estate Taxes | $4,118 | $50 |
Property Value by Mortgage Status in New Hope
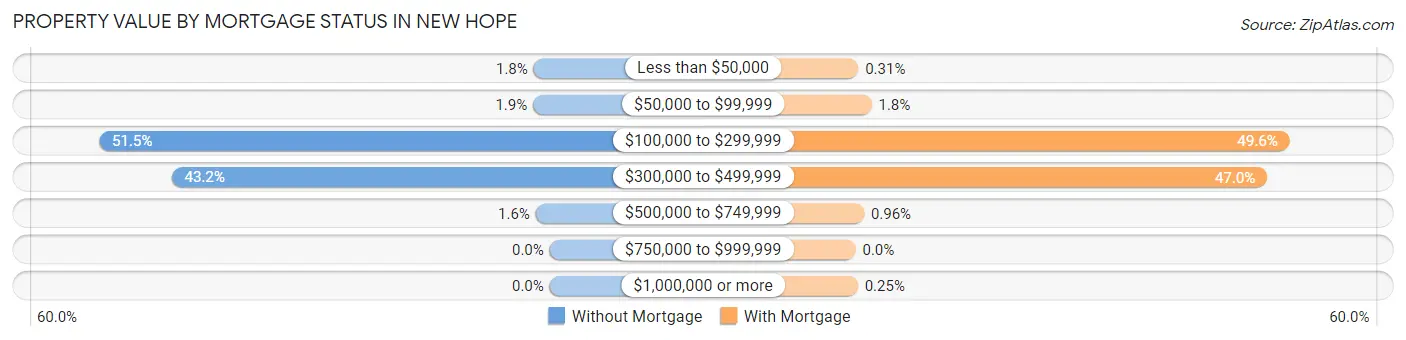
| Property Value | Without Mortgage | With Mortgage |
| Less than $50,000 | 30 (1.8%) | 10 (0.3%) |
| $50,000 to $99,999 | 31 (1.9%) | 59 (1.8%) |
| $100,000 to $299,999 | 844 (51.5%) | 1,602 (49.6%) |
| $300,000 to $499,999 | 708 (43.2%) | 1,519 (47.0%) |
| $500,000 to $749,999 | 26 (1.6%) | 31 (1.0%) |
| $750,000 to $999,999 | 0 (0.0%) | 0 (0.0%) |
| $1,000,000 or more | 0 (0.0%) | 8 (0.3%) |
| Total | 1,639 (100.0%) | 3,229 (100.0%) |
Household Income by Mortgage Status in New Hope
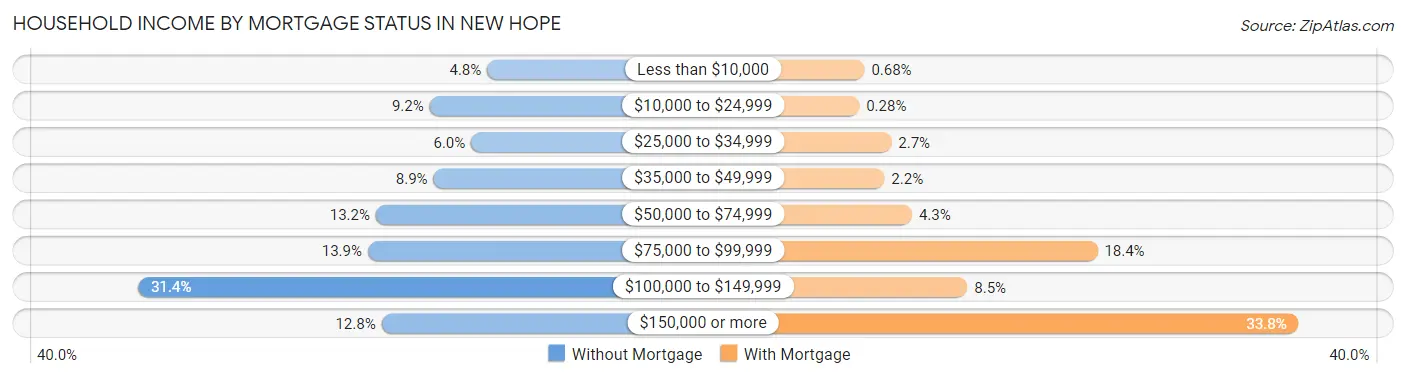
| Household Income | Without Mortgage | With Mortgage |
| Less than $10,000 | 78 (4.8%) | 22 (0.7%) |
| $10,000 to $24,999 | 150 (9.1%) | 9 (0.3%) |
| $25,000 to $34,999 | 98 (6.0%) | 88 (2.7%) |
| $35,000 to $49,999 | 145 (8.8%) | 71 (2.2%) |
| $50,000 to $74,999 | 217 (13.2%) | 139 (4.3%) |
| $75,000 to $99,999 | 227 (13.9%) | 595 (18.4%) |
| $100,000 to $149,999 | 514 (31.4%) | 275 (8.5%) |
| $150,000 or more | 210 (12.8%) | 1,090 (33.8%) |
| Total | 1,639 (100.0%) | 3,229 (100.0%) |
Property Value to Household Income Ratio in New Hope
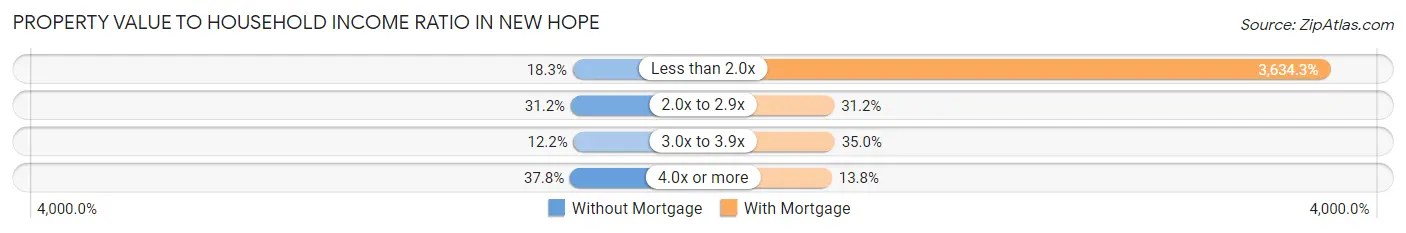
| Value-to-Income Ratio | Without Mortgage | With Mortgage |
| Less than 2.0x | 300 (18.3%) | 117,351 (3,634.3%) |
| 2.0x to 2.9x | 512 (31.2%) | 1,006 (31.2%) |
| 3.0x to 3.9x | 200 (12.2%) | 1,129 (35.0%) |
| 4.0x or more | 619 (37.8%) | 445 (13.8%) |
| Total | 1,639 (100.0%) | 3,229 (100.0%) |
Real Estate Taxes by Mortgage Status in New Hope
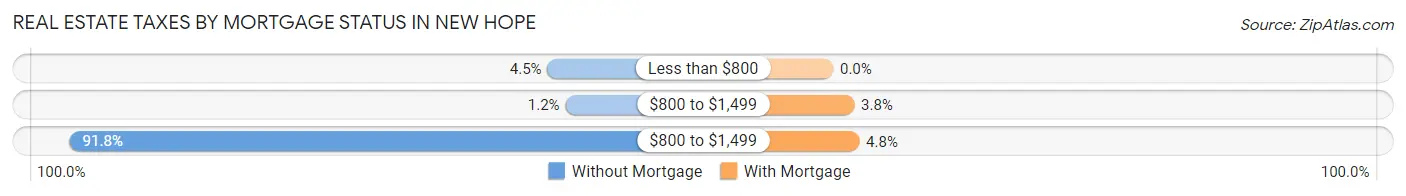
| Property Taxes | Without Mortgage | With Mortgage |
| Less than $800 | 74 (4.5%) | 0 (0.0%) |
| $800 to $1,499 | 20 (1.2%) | 124 (3.8%) |
| $800 to $1,499 | 1,504 (91.8%) | 154 (4.8%) |
| Total | 1,639 (100.0%) | 3,229 (100.0%) |
Health & Disability in New Hope
Health Insurance Coverage by Age in New Hope
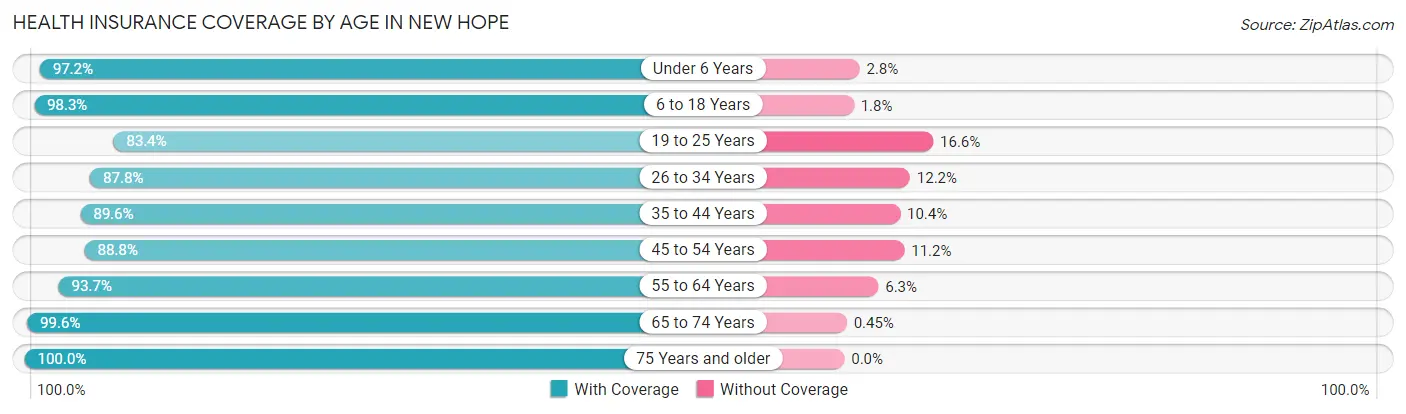
| Age Bracket | With Coverage | Without Coverage |
| Under 6 Years | 1,608 (97.2%) | 47 (2.8%) |
| 6 to 18 Years | 3,146 (98.3%) | 56 (1.8%) |
| 19 to 25 Years | 1,199 (83.4%) | 238 (16.6%) |
| 26 to 34 Years | 2,518 (87.8%) | 351 (12.2%) |
| 35 to 44 Years | 2,442 (89.6%) | 283 (10.4%) |
| 45 to 54 Years | 2,509 (88.8%) | 316 (11.2%) |
| 55 to 64 Years | 2,646 (93.7%) | 179 (6.3%) |
| 65 to 74 Years | 1,557 (99.6%) | 7 (0.4%) |
| 75 Years and older | 1,766 (100.0%) | 0 (0.0%) |
| Total | 19,391 (92.9%) | 1,477 (7.1%) |
Health Insurance Coverage by Citizenship Status in New Hope
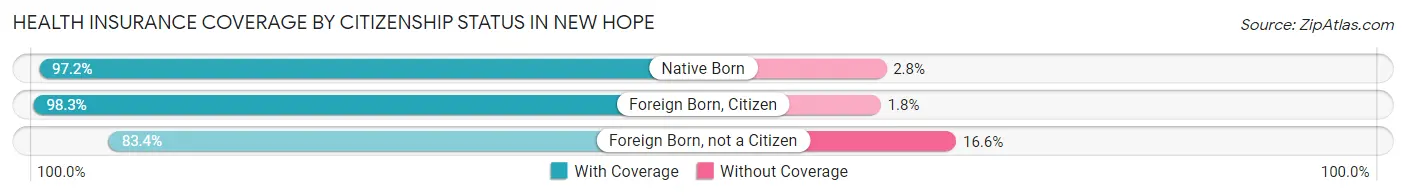
| Citizenship Status | With Coverage | Without Coverage |
| Native Born | 1,608 (97.2%) | 47 (2.8%) |
| Foreign Born, Citizen | 3,146 (98.3%) | 56 (1.8%) |
| Foreign Born, not a Citizen | 1,199 (83.4%) | 238 (16.6%) |
Health Insurance Coverage by Household Income in New Hope
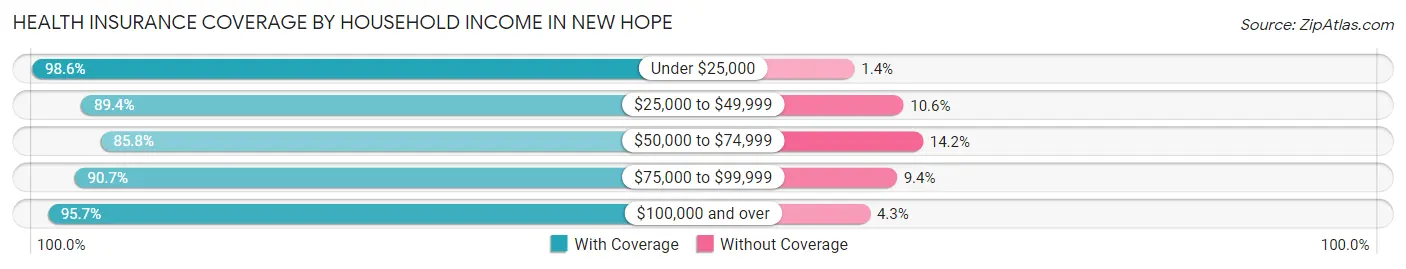
| Household Income | With Coverage | Without Coverage |
| Under $25,000 | 2,221 (98.6%) | 32 (1.4%) |
| $25,000 to $49,999 | 2,628 (89.4%) | 311 (10.6%) |
| $50,000 to $74,999 | 3,119 (85.8%) | 518 (14.2%) |
| $75,000 to $99,999 | 1,822 (90.6%) | 188 (9.3%) |
| $100,000 and over | 9,432 (95.7%) | 428 (4.3%) |
Public vs Private Health Insurance Coverage by Age in New Hope
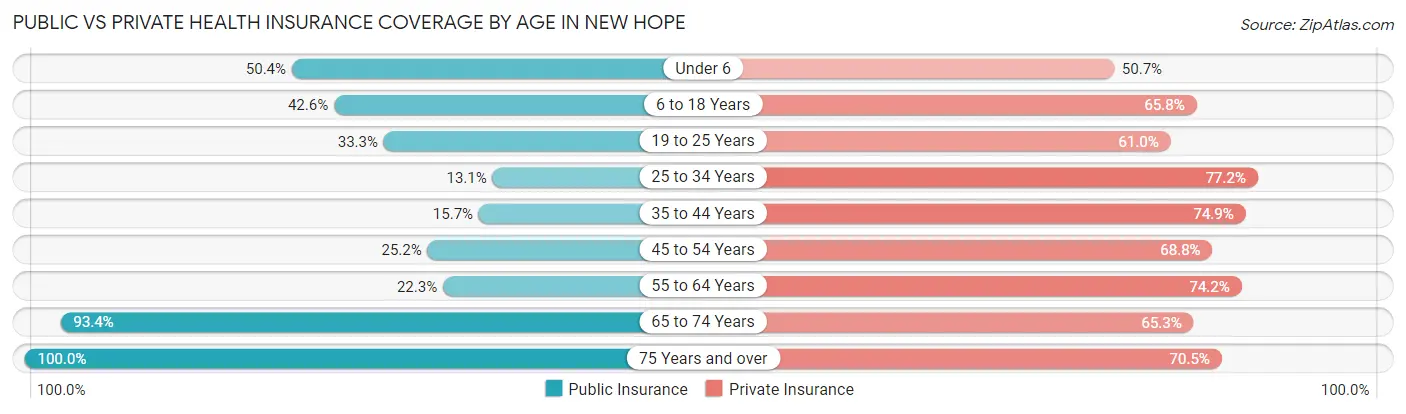
| Age Bracket | Public Insurance | Private Insurance |
| Under 6 | 834 (50.4%) | 839 (50.7%) |
| 6 to 18 Years | 1,363 (42.6%) | 2,108 (65.8%) |
| 19 to 25 Years | 479 (33.3%) | 877 (61.0%) |
| 25 to 34 Years | 377 (13.1%) | 2,215 (77.2%) |
| 35 to 44 Years | 427 (15.7%) | 2,042 (74.9%) |
| 45 to 54 Years | 712 (25.2%) | 1,943 (68.8%) |
| 55 to 64 Years | 631 (22.3%) | 2,096 (74.2%) |
| 65 to 74 Years | 1,460 (93.3%) | 1,021 (65.3%) |
| 75 Years and over | 1,766 (100.0%) | 1,245 (70.5%) |
| Total | 8,049 (38.6%) | 14,386 (68.9%) |
Disability Status by Sex by Age in New Hope
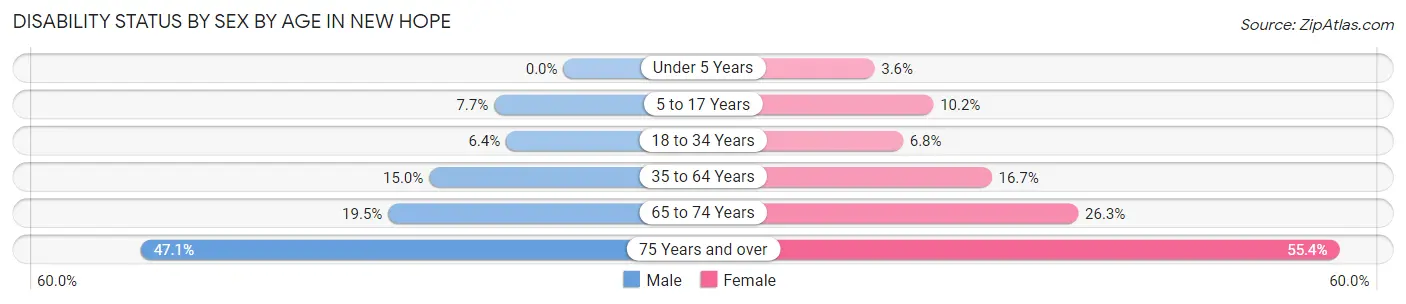
| Age Bracket | Male | Female |
| Under 5 Years | 0 (0.0%) | 34 (3.6%) |
| 5 to 17 Years | 111 (7.7%) | 175 (10.2%) |
| 18 to 34 Years | 137 (6.4%) | 162 (6.8%) |
| 35 to 64 Years | 663 (14.9%) | 657 (16.7%) |
| 65 to 74 Years | 142 (19.5%) | 220 (26.3%) |
| 75 Years and over | 352 (47.1%) | 564 (55.4%) |
Disability Class by Sex by Age in New Hope
Disability Class: Hearing Difficulty
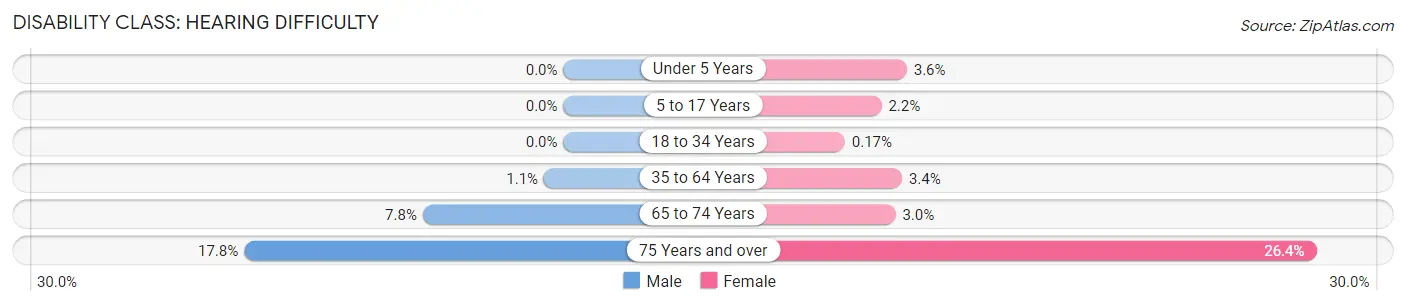
| Age Bracket | Male | Female |
| Under 5 Years | 0 (0.0%) | 34 (3.6%) |
| 5 to 17 Years | 0 (0.0%) | 38 (2.2%) |
| 18 to 34 Years | 0 (0.0%) | 4 (0.2%) |
| 35 to 64 Years | 48 (1.1%) | 132 (3.4%) |
| 65 to 74 Years | 57 (7.8%) | 25 (3.0%) |
| 75 Years and over | 133 (17.8%) | 269 (26.4%) |
Disability Class: Vision Difficulty
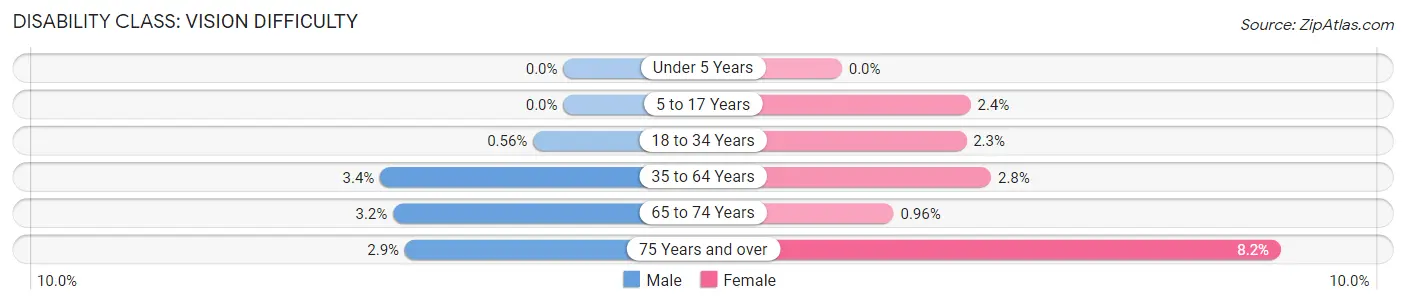
| Age Bracket | Male | Female |
| Under 5 Years | 0 (0.0%) | 0 (0.0%) |
| 5 to 17 Years | 0 (0.0%) | 41 (2.4%) |
| 18 to 34 Years | 12 (0.6%) | 55 (2.3%) |
| 35 to 64 Years | 151 (3.4%) | 109 (2.8%) |
| 65 to 74 Years | 23 (3.2%) | 8 (1.0%) |
| 75 Years and over | 22 (2.9%) | 83 (8.2%) |
Disability Class: Cognitive Difficulty
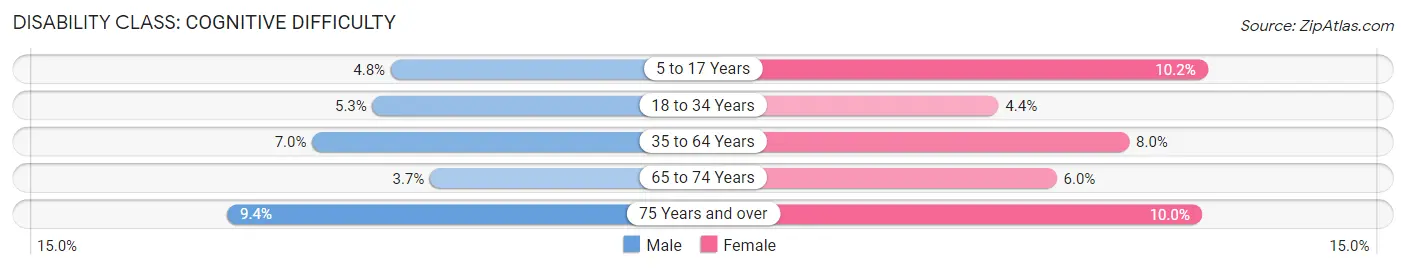
| Age Bracket | Male | Female |
| 5 to 17 Years | 69 (4.8%) | 175 (10.2%) |
| 18 to 34 Years | 114 (5.3%) | 104 (4.4%) |
| 35 to 64 Years | 310 (7.0%) | 315 (8.0%) |
| 65 to 74 Years | 27 (3.7%) | 50 (6.0%) |
| 75 Years and over | 70 (9.4%) | 102 (10.0%) |
Disability Class: Ambulatory Difficulty
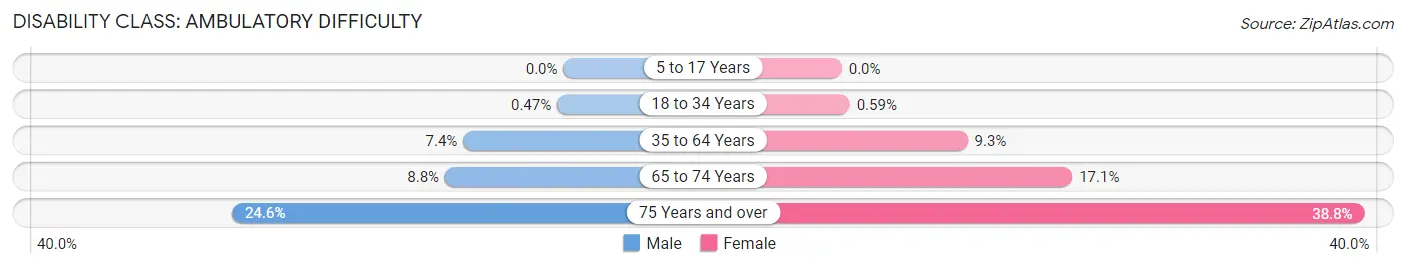
| Age Bracket | Male | Female |
| 5 to 17 Years | 0 (0.0%) | 0 (0.0%) |
| 18 to 34 Years | 10 (0.5%) | 14 (0.6%) |
| 35 to 64 Years | 330 (7.4%) | 368 (9.3%) |
| 65 to 74 Years | 64 (8.8%) | 143 (17.1%) |
| 75 Years and over | 184 (24.6%) | 395 (38.8%) |
Disability Class: Self-Care Difficulty
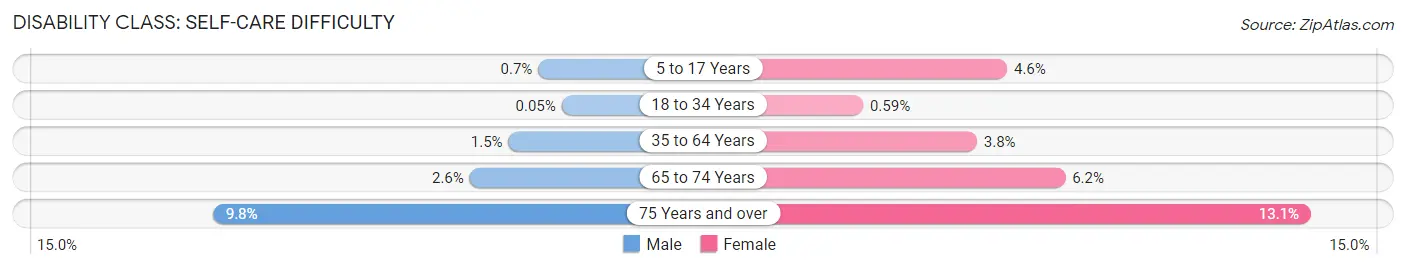
| Age Bracket | Male | Female |
| 5 to 17 Years | 10 (0.7%) | 79 (4.6%) |
| 18 to 34 Years | 1 (0.1%) | 14 (0.6%) |
| 35 to 64 Years | 68 (1.5%) | 148 (3.8%) |
| 65 to 74 Years | 19 (2.6%) | 52 (6.2%) |
| 75 Years and over | 73 (9.8%) | 133 (13.1%) |
Technology Access in New Hope
Computing Device Access in New Hope
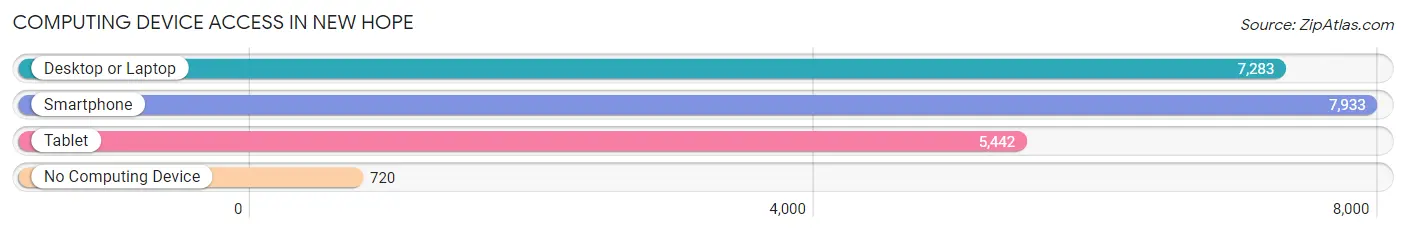
| Device Type | # Households | % Households |
| Desktop or Laptop | 7,283 | 79.9% |
| Smartphone | 7,933 | 87.0% |
| Tablet | 5,442 | 59.7% |
| No Computing Device | 720 | 7.9% |
| Total | 9,120 | 100.0% |
Internet Access in New Hope
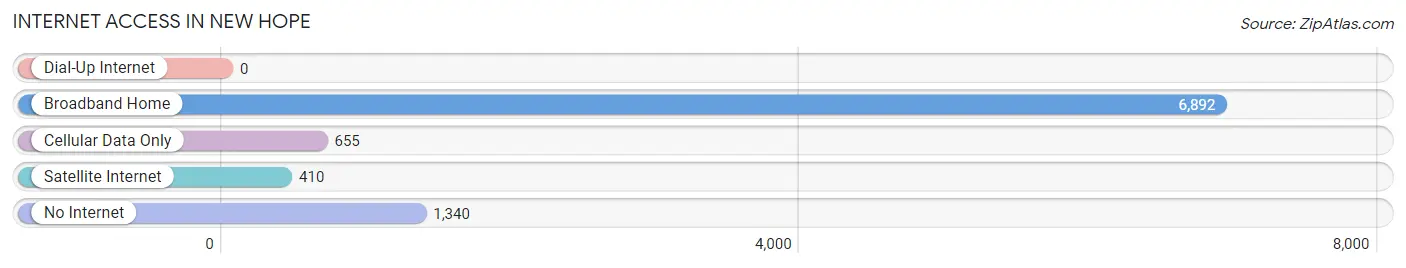
| Internet Type | # Households | % Households |
| Dial-Up Internet | 0 | 0.0% |
| Broadband Home | 6,892 | 75.6% |
| Cellular Data Only | 655 | 7.2% |
| Satellite Internet | 410 | 4.5% |
| No Internet | 1,340 | 14.7% |
| Total | 9,120 | 100.0% |
New Hope Summary
New Hope, Minnesota is a city located in Hennepin County, Minnesota, United States. The population was 20,339 at the 2010 census. It is a suburb of Minneapolis and is located on the west bank of the Mississippi River.
History
New Hope was first settled in 1852 by a group of settlers from New England. The town was originally called “Hope”, but the name was changed to “New Hope” in 1856 to avoid confusion with another town in the area. The town was incorporated in 1956 and has since grown to become a thriving suburb of Minneapolis.
Geography
New Hope is located at the intersection of Interstate 394 and Highway 169. It is situated on the west bank of the Mississippi River, just north of Minneapolis. The city covers an area of 8.2 square miles and has a population density of 2,500 people per square mile.
The city is divided into two distinct sections: the north side and the south side. The north side is primarily residential, while the south side is more commercial and industrial. The city is also home to several parks, including the New Hope Nature Center, which features a variety of wildlife and nature trails.
Economy
New Hope’s economy is largely based on retail and services. The city is home to several large shopping centers, including the Shoppes at Arbor Lakes, which features over 100 stores and restaurants. The city is also home to several corporate headquarters, including the headquarters of Target Corporation.
The city’s largest employer is the Minneapolis Public Schools, which employs over 4,000 people. Other major employers include the University of Minnesota, Fairview Health Services, and the City of Minneapolis.
Demographics
As of the 2010 census, the population of New Hope was 20,339. The racial makeup of the city was 79.2% White, 8.3% African American, 0.3% Native American, 5.2% Asian, and 4.7% from other races. The median household income was $60,945, and the median family income was $76,945.
New Hope is a diverse city, with a large immigrant population. The city is home to a large Somali population, as well as a large Hmong population. The city also has a large Jewish population, with over 10,000 Jews living in the city.
Conclusion
New Hope, Minnesota is a thriving suburb of Minneapolis located on the west bank of the Mississippi River. The city has a diverse population and a strong economy based on retail and services. The city is home to several large shopping centers, corporate headquarters, and the Minneapolis Public Schools. New Hope is a vibrant and diverse city that is sure to continue to grow and thrive in the years to come.
Common Questions
What is the Total Population of New Hope?
Total Population of New Hope is 21,620.
What is the Total Male Population of New Hope?
Total Male Population of New Hope is 10,319.
What is the Total Female Population of New Hope?
Total Female Population of New Hope is 11,301.
What is the Ratio of Males per 100 Females in New Hope?
There are 91.31 Males per 100 Females in New Hope.
What is the Ratio of Females per 100 Males in New Hope?
There are 109.52 Females per 100 Males in New Hope.
What is the Median Population Age in New Hope?
Median Population Age in New Hope is 41.4 Years.
What is the Average Family Size in New Hope
Average Family Size in New Hope is 3.0 People.
What is the Average Household Size in New Hope
Average Household Size in New Hope is 2.3 People.
What is Per Capita Income in New Hope?
Per Capita income in New Hope is $38,623.
What is the Median Family Income in New Hope?
Median Family Income in New Hope is $102,762.
What is the Median Household income in New Hope?
Median Household Income in New Hope is $69,244.
What is Income or Wage Gap in New Hope?
Income or Wage Gap in New Hope is 25.0%.
Women in New Hope earn 75.0 cents for every dollar earned by a man.
What is Inequality or Gini Index in New Hope?
Inequality or Gini Index in New Hope is 0.42.
How Large is the Labor Force in New Hope?
There are 12,104 People in the Labor Forcein in New Hope.
What is the Percentage of People in the Labor Force in New Hope?
68.9% of People are in the Labor Force in New Hope.
What is the Unemployment Rate in New Hope?
Unemployment Rate in New Hope is 5.1%.