Cities with the Highest Percentage of Population Employed in Office & Administration in Minnesota
RELATED REPORTS & OPTIONS
Office & Administration
Minnesota
Compare Cities
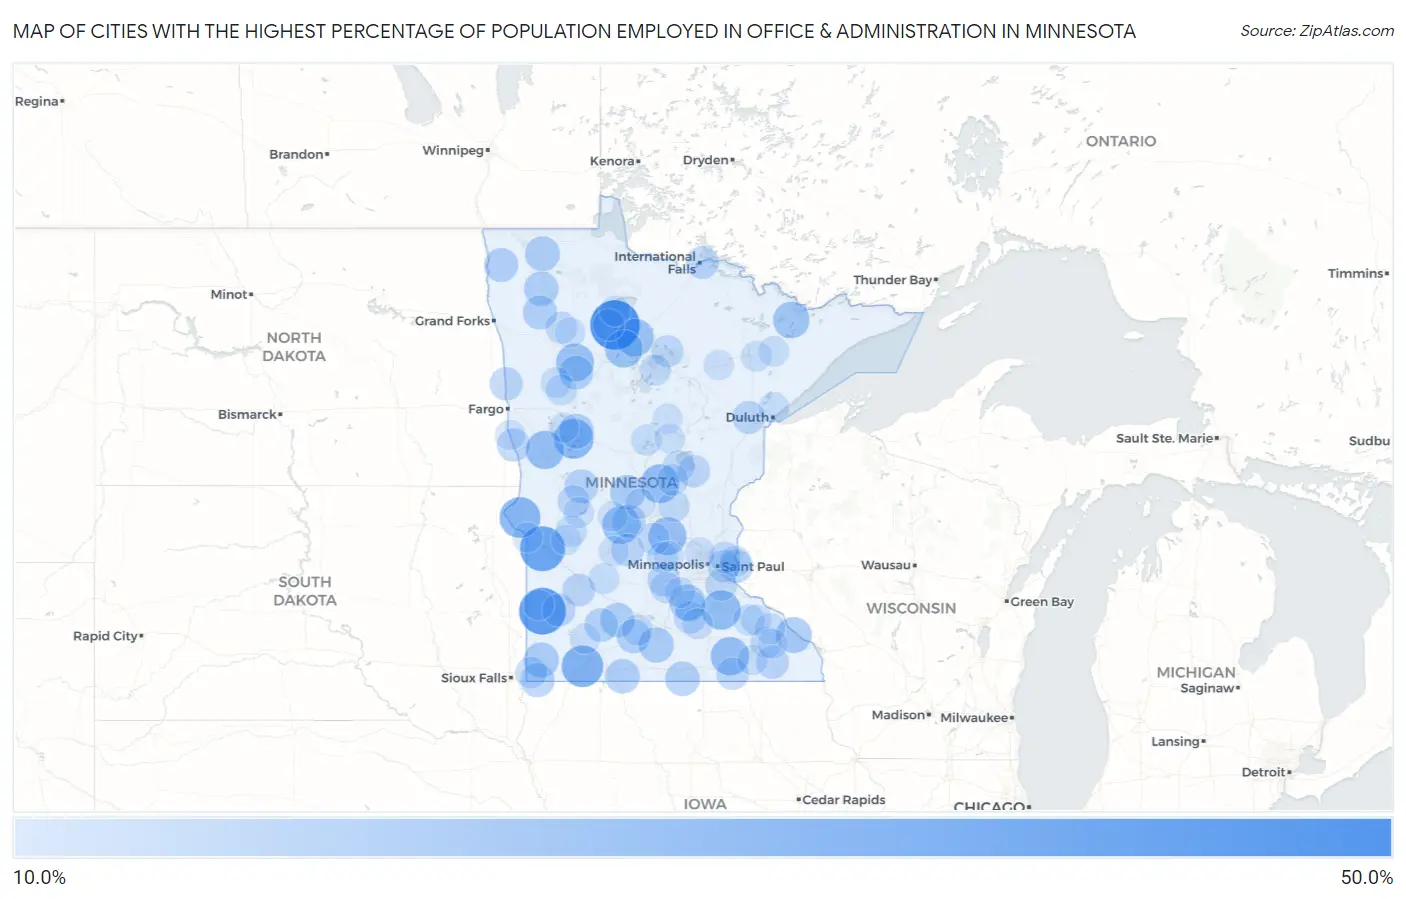
Map of Cities with the Highest Percentage of Population Employed in Office & Administration in Minnesota
0.0%
50.0%
Cities with the Highest Percentage of Population Employed in Office & Administration in Minnesota
| City | % Employed | vs State | vs National | |
| 1. | Redby | 48.0% | 10.3%(+37.7)#1 | 10.9%(+37.1)#248 |
| 2. | Arco | 43.3% | 10.3%(+33.0)#2 | 10.9%(+32.5)#327 |
| 3. | Louisburg | 40.0% | 10.3%(+29.7)#3 | 10.9%(+29.1)#424 |
| 4. | Brewster | 34.6% | 10.3%(+24.3)#4 | 10.9%(+23.8)#591 |
| 5. | Barry | 33.3% | 10.3%(+23.0)#5 | 10.9%(+22.5)#680 |
| 6. | Richville | 31.6% | 10.3%(+21.3)#6 | 10.9%(+20.7)#759 |
| 7. | Dennison | 30.6% | 10.3%(+20.3)#7 | 10.9%(+19.8)#808 |
| 8. | Genola | 29.8% | 10.3%(+19.5)#8 | 10.9%(+18.9)#861 |
| 9. | Waltham | 29.5% | 10.3%(+19.2)#9 | 10.9%(+18.6)#879 |
| 10. | Elizabeth | 29.2% | 10.3%(+18.9)#10 | 10.9%(+18.3)#901 |
| 11. | Silver Creek | 28.8% | 10.3%(+18.5)#11 | 10.9%(+17.9)#939 |
| 12. | Lake Henry | 28.6% | 10.3%(+18.3)#12 | 10.9%(+17.7)#956 |
| 13. | Pine Bend | 28.6% | 10.3%(+18.3)#13 | 10.9%(+17.7)#964 |
| 14. | Blackduck | 28.0% | 10.3%(+17.7)#14 | 10.9%(+17.1)#1,001 |
| 15. | Turtle River | 28.0% | 10.3%(+17.7)#15 | 10.9%(+17.1)#1,003 |
| 16. | Winton | 26.3% | 10.3%(+16.0)#16 | 10.9%(+15.5)#1,174 |
| 17. | Heidelberg | 25.5% | 10.3%(+15.2)#17 | 10.9%(+14.6)#1,258 |
| 18. | Minnesota City | 25.0% | 10.3%(+14.7)#18 | 10.9%(+14.1)#1,309 |
| 19. | Vernon Center | 24.0% | 10.3%(+13.7)#19 | 10.9%(+13.2)#1,457 |
| 20. | Hardwick | 23.9% | 10.3%(+13.6)#20 | 10.9%(+13.1)#1,476 |
| 21. | Burtrum | 23.8% | 10.3%(+13.5)#21 | 10.9%(+13.0)#1,492 |
| 22. | Perham | 23.6% | 10.3%(+13.3)#22 | 10.9%(+12.8)#1,527 |
| 23. | Greenbush | 23.4% | 10.3%(+13.1)#23 | 10.9%(+12.6)#1,565 |
| 24. | Kiester | 23.1% | 10.3%(+12.8)#24 | 10.9%(+12.3)#1,610 |
| 25. | Dunnell | 23.1% | 10.3%(+12.8)#25 | 10.9%(+12.2)#1,618 |
| 26. | Holt | 23.1% | 10.3%(+12.8)#26 | 10.9%(+12.2)#1,624 |
| 27. | Cobden | 23.1% | 10.3%(+12.8)#27 | 10.9%(+12.2)#1,625 |
| 28. | Steen | 22.6% | 10.3%(+12.3)#28 | 10.9%(+11.8)#1,702 |
| 29. | La Salle | 22.4% | 10.3%(+12.1)#29 | 10.9%(+11.6)#1,759 |
| 30. | St Hilaire | 22.4% | 10.3%(+12.1)#30 | 10.9%(+11.6)#1,762 |
| 31. | West Roy Lake | 22.2% | 10.3%(+11.9)#31 | 10.9%(+11.4)#1,807 |
| 32. | Donaldson | 22.2% | 10.3%(+11.9)#32 | 10.9%(+11.4)#1,808 |
| 33. | Garfield | 22.0% | 10.3%(+11.7)#33 | 10.9%(+11.2)#1,838 |
| 34. | Sanborn | 21.7% | 10.3%(+11.4)#34 | 10.9%(+10.8)#1,919 |
| 35. | St Martin | 21.5% | 10.3%(+11.2)#35 | 10.9%(+10.7)#1,962 |
| 36. | Lakeland | 21.4% | 10.3%(+11.1)#36 | 10.9%(+10.5)#2,007 |
| 37. | Perley | 21.1% | 10.3%(+10.7)#37 | 10.9%(+10.2)#2,088 |
| 38. | Kent | 21.1% | 10.3%(+10.7)#38 | 10.9%(+10.2)#2,093 |
| 39. | Ranier | 20.6% | 10.3%(+10.3)#39 | 10.9%(+9.78)#2,206 |
| 40. | Lynd | 20.6% | 10.3%(+10.3)#40 | 10.9%(+9.71)#2,233 |
| 41. | Plato | 20.5% | 10.3%(+10.2)#41 | 10.9%(+9.66)#2,245 |
| 42. | Mahnomen | 20.5% | 10.3%(+10.2)#42 | 10.9%(+9.66)#2,246 |
| 43. | Fountain | 20.4% | 10.3%(+10.1)#43 | 10.9%(+9.56)#2,273 |
| 44. | Wood Lake | 20.2% | 10.3%(+9.91)#44 | 10.9%(+9.36)#2,337 |
| 45. | Grove City | 20.1% | 10.3%(+9.85)#45 | 10.9%(+9.29)#2,354 |
| 46. | Wahkon | 20.0% | 10.3%(+9.70)#46 | 10.9%(+9.14)#2,405 |
| 47. | Rose Creek | 19.6% | 10.3%(+9.25)#47 | 10.9%(+8.70)#2,590 |
| 48. | Landfall | 19.5% | 10.3%(+9.20)#48 | 10.9%(+8.64)#2,613 |
| 49. | Kilkenny | 19.4% | 10.3%(+9.05)#49 | 10.9%(+8.50)#2,662 |
| 50. | High Forest | 19.2% | 10.3%(+8.93)#50 | 10.9%(+8.37)#2,708 |
| 51. | Inger | 19.2% | 10.3%(+8.93)#51 | 10.9%(+8.37)#2,711 |
| 52. | Farwell | 19.0% | 10.3%(+8.74)#52 | 10.9%(+8.19)#2,793 |
| 53. | Vineland | 18.9% | 10.3%(+8.63)#53 | 10.9%(+8.08)#2,833 |
| 54. | Coates | 18.9% | 10.3%(+8.62)#54 | 10.9%(+8.06)#2,848 |
| 55. | Oklee | 18.9% | 10.3%(+8.57)#55 | 10.9%(+8.02)#2,865 |
| 56. | South Haven | 18.9% | 10.3%(+8.56)#56 | 10.9%(+8.01)#2,874 |
| 57. | Red Lake | 18.7% | 10.3%(+8.36)#57 | 10.9%(+7.80)#2,988 |
| 58. | Beaver Creek | 18.6% | 10.3%(+8.32)#58 | 10.9%(+7.76)#3,010 |
| 59. | Green Isle | 18.6% | 10.3%(+8.27)#59 | 10.9%(+7.72)#3,039 |
| 60. | Ronneby | 18.5% | 10.3%(+8.22)#60 | 10.9%(+7.66)#3,073 |
| 61. | Willernie | 18.5% | 10.3%(+8.17)#61 | 10.9%(+7.61)#3,097 |
| 62. | Montgomery | 18.4% | 10.3%(+8.07)#62 | 10.9%(+7.51)#3,147 |
| 63. | Eyota | 18.2% | 10.3%(+7.93)#63 | 10.9%(+7.38)#3,201 |
| 64. | Clontarf | 18.2% | 10.3%(+7.88)#64 | 10.9%(+7.33)#3,247 |
| 65. | Hillman | 18.2% | 10.3%(+7.88)#65 | 10.9%(+7.33)#3,258 |
| 66. | Howard Lake | 18.1% | 10.3%(+7.78)#66 | 10.9%(+7.23)#3,297 |
| 67. | Bayport | 17.9% | 10.3%(+7.63)#67 | 10.9%(+7.08)#3,382 |
| 68. | Waubun | 17.9% | 10.3%(+7.58)#68 | 10.9%(+7.02)#3,413 |
| 69. | Hanska | 17.7% | 10.3%(+7.38)#69 | 10.9%(+6.83)#3,517 |
| 70. | Bena | 17.6% | 10.3%(+7.34)#70 | 10.9%(+6.79)#3,540 |
| 71. | Mazeppa | 17.6% | 10.3%(+7.33)#71 | 10.9%(+6.78)#3,557 |
| 72. | Danube | 17.5% | 10.3%(+7.19)#72 | 10.9%(+6.63)#3,644 |
| 73. | White Earth | 17.5% | 10.3%(+7.17)#73 | 10.9%(+6.62)#3,652 |
| 74. | Lake Shore | 17.4% | 10.3%(+7.15)#74 | 10.9%(+6.59)#3,672 |
| 75. | Mckinley | 17.3% | 10.3%(+7.00)#75 | 10.9%(+6.45)#3,764 |
| 76. | Hoyt Lakes | 17.2% | 10.3%(+6.94)#76 | 10.9%(+6.38)#3,804 |
| 77. | Rice Lake | 17.2% | 10.3%(+6.92)#77 | 10.9%(+6.36)#3,823 |
| 78. | Plainview | 17.2% | 10.3%(+6.90)#78 | 10.9%(+6.35)#3,837 |
| 79. | Starbuck | 17.2% | 10.3%(+6.89)#79 | 10.9%(+6.34)#3,841 |
| 80. | Belle Plaine | 17.2% | 10.3%(+6.88)#80 | 10.9%(+6.32)#3,853 |
| 81. | Zumbro Falls | 17.2% | 10.3%(+6.87)#81 | 10.9%(+6.32)#3,859 |
| 82. | Ivanhoe | 17.2% | 10.3%(+6.85)#82 | 10.9%(+6.30)#3,872 |
| 83. | Morristown | 17.1% | 10.3%(+6.84)#83 | 10.9%(+6.29)#3,882 |
| 84. | Ponemah | 17.1% | 10.3%(+6.77)#84 | 10.9%(+6.22)#3,922 |
| 85. | Racine | 16.8% | 10.3%(+6.49)#85 | 10.9%(+5.94)#4,107 |
| 86. | Holdingford | 16.7% | 10.3%(+6.44)#86 | 10.9%(+5.89)#4,137 |
| 87. | Osseo | 16.7% | 10.3%(+6.43)#87 | 10.9%(+5.88)#4,148 |
| 88. | Keewatin | 16.7% | 10.3%(+6.40)#88 | 10.9%(+5.84)#4,164 |
| 89. | Trail | 16.7% | 10.3%(+6.36)#89 | 10.9%(+5.81)#4,233 |
| 90. | Kandiyohi | 16.6% | 10.3%(+6.30)#90 | 10.9%(+5.75)#4,263 |
| 91. | Westbrook | 16.6% | 10.3%(+6.28)#91 | 10.9%(+5.73)#4,280 |
| 92. | Danvers | 16.4% | 10.3%(+6.14)#92 | 10.9%(+5.58)#4,385 |
| 93. | Wolverton | 16.4% | 10.3%(+6.14)#93 | 10.9%(+5.58)#4,386 |
| 94. | Waverly | 16.3% | 10.3%(+6.03)#94 | 10.9%(+5.48)#4,477 |
| 95. | Emily | 16.3% | 10.3%(+5.98)#95 | 10.9%(+5.42)#4,524 |
| 96. | Vergas | 16.2% | 10.3%(+5.91)#96 | 10.9%(+5.36)#4,585 |
| 97. | Dover | 16.2% | 10.3%(+5.91)#97 | 10.9%(+5.35)#4,589 |
| 98. | Elrosa | 16.2% | 10.3%(+5.89)#98 | 10.9%(+5.33)#4,608 |
| 99. | Ortonville | 16.2% | 10.3%(+5.88)#99 | 10.9%(+5.33)#4,614 |
| 100. | Cuyuna | 16.1% | 10.3%(+5.77)#100 | 10.9%(+5.22)#4,710 |
Common Questions
What are the Top 10 Cities with the Highest Percentage of Population Employed in Office & Administration in Minnesota?
Top 10 Cities with the Highest Percentage of Population Employed in Office & Administration in Minnesota are:
What city has the Highest Percentage of Population Employed in Office & Administration in Minnesota?
Redby has the Highest Percentage of Population Employed in Office & Administration in Minnesota with 48.0%.
What is the Percentage of Population Employed in Office & Administration in the State of Minnesota?
Percentage of Population Employed in Office & Administration in Minnesota is 10.3%.
What is the Percentage of Population Employed in Office & Administration in the United States?
Percentage of Population Employed in Office & Administration in the United States is 10.9%.