Cities with the Lowest Costs of Housing as Percentage of Income in Minnesota
RELATED REPORTS & OPTIONS
Lowest Housing Costs / Income
Minnesota
Compare Cities
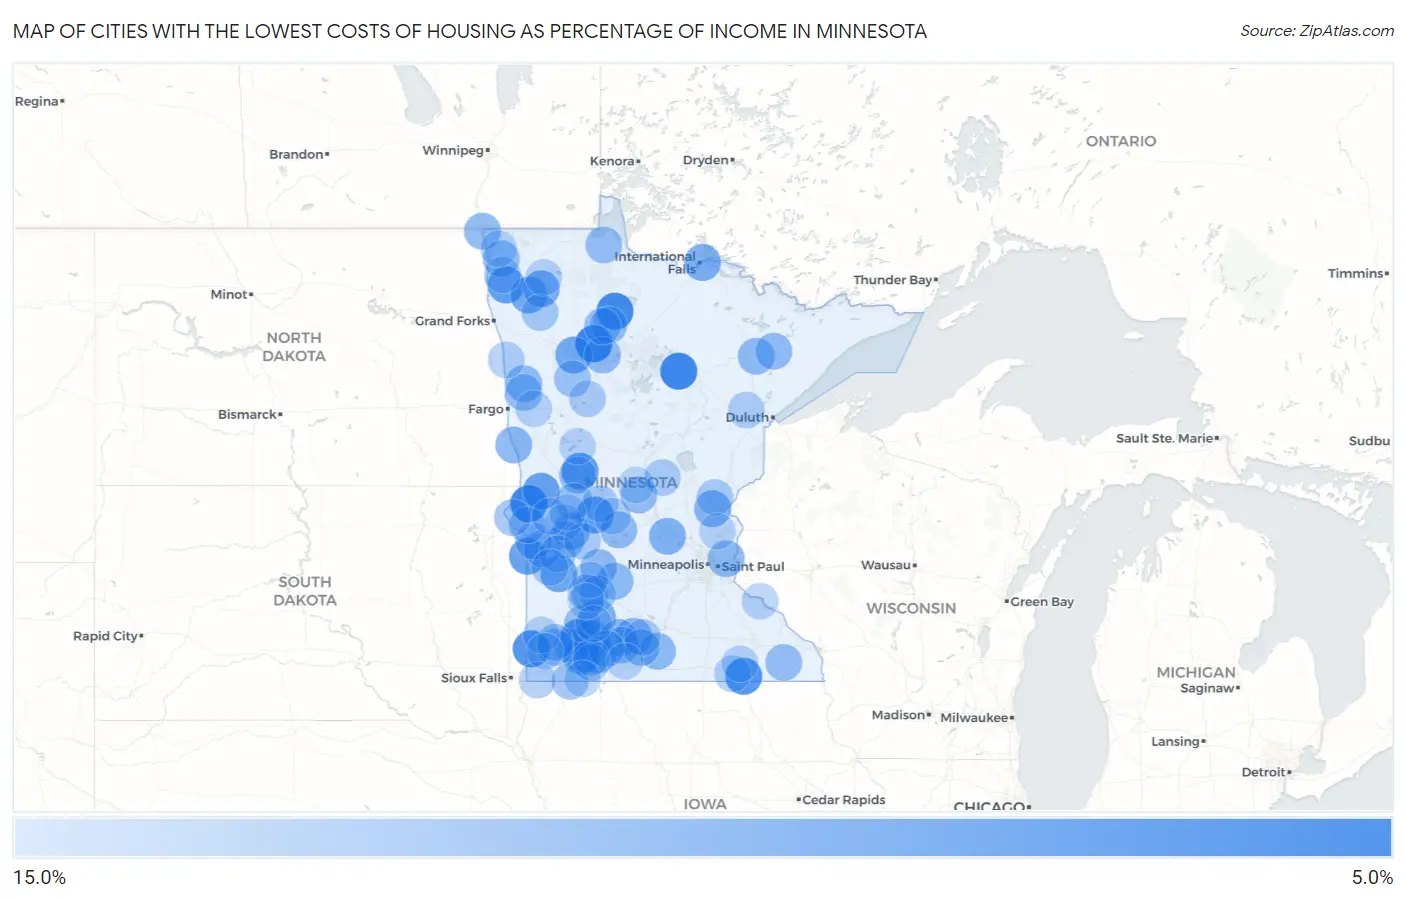
Map of Cities with the Lowest Costs of Housing as Percentage of Income in Minnesota
15.0%
0.0%
Cities with the Lowest Costs of Housing as Percentage of Income in Minnesota
| City | Housing Costs / Income | vs State | vs National | |
| 1. | Leonard | 6.3% | 18.4%(-12.1)#1 | 20.4%(-14.1)#213 |
| 2. | Zemple | 6.5% | 18.4%(-11.9)#2 | 20.4%(-13.9)#247 |
| 3. | Dumont | 6.5% | 18.4%(-11.9)#3 | 20.4%(-13.8)#250 |
| 4. | Ponemah | 6.8% | 18.4%(-11.6)#4 | 20.4%(-13.6)#298 |
| 5. | Ihlen | 7.5% | 18.4%(-11.0)#5 | 20.4%(-12.9)#424 |
| 6. | Taopi | 7.6% | 18.4%(-10.8)#6 | 20.4%(-12.8)#460 |
| 7. | Dovray | 7.8% | 18.4%(-10.6)#7 | 20.4%(-12.5)#530 |
| 8. | Urbank | 8.0% | 18.4%(-10.4)#8 | 20.4%(-12.3)#584 |
| 9. | Sedan | 8.1% | 18.4%(-10.3)#9 | 20.4%(-12.3)#602 |
| 10. | Nassau | 8.3% | 18.4%(-10.1)#10 | 20.4%(-12.1)#651 |
| 11. | Argyle | 8.4% | 18.4%(-10.1)#11 | 20.4%(-12.0)#680 |
| 12. | Norcross | 8.6% | 18.4%(-9.82)#12 | 20.4%(-11.8)#766 |
| 13. | Boyd | 8.8% | 18.4%(-9.59)#13 | 20.4%(-11.5)#832 |
| 14. | Lengby | 9.1% | 18.4%(-9.34)#14 | 20.4%(-11.3)#934 |
| 15. | Storden | 9.1% | 18.4%(-9.29)#15 | 20.4%(-11.2)#953 |
| 16. | Viking | 9.2% | 18.4%(-9.26)#16 | 20.4%(-11.2)#962 |
| 17. | Holt | 9.3% | 18.4%(-9.17)#17 | 20.4%(-11.1)#1,002 |
| 18. | Ranier | 9.5% | 18.4%(-8.89)#18 | 20.4%(-10.8)#1,156 |
| 19. | Wanda | 9.6% | 18.4%(-8.84)#19 | 20.4%(-10.8)#1,176 |
| 20. | Wilder | 9.7% | 18.4%(-8.73)#20 | 20.4%(-10.7)#1,236 |
| 21. | Dundee | 9.7% | 18.4%(-8.72)#21 | 20.4%(-10.7)#1,247 |
| 22. | Silver Creek | 9.8% | 18.4%(-8.65)#22 | 20.4%(-10.6)#1,283 |
| 23. | Stanchfield | 9.9% | 18.4%(-8.49)#23 | 20.4%(-10.4)#1,375 |
| 24. | Kinbrae | 10.1% | 18.4%(-8.37)#24 | 20.4%(-10.3)#1,447 |
| 25. | La Salle | 10.2% | 18.4%(-8.25)#25 | 20.4%(-10.2)#1,511 |
| 26. | Clontarf | 10.2% | 18.4%(-8.20)#26 | 20.4%(-10.1)#1,545 |
| 27. | Kent | 10.2% | 18.4%(-8.19)#27 | 20.4%(-10.1)#1,552 |
| 28. | Darfur | 10.3% | 18.4%(-8.11)#28 | 20.4%(-10.1)#1,596 |
| 29. | St Vincent | 10.3% | 18.4%(-8.10)#29 | 20.4%(-10.0)#1,598 |
| 30. | Pine Springs | 10.4% | 18.4%(-8.06)#30 | 20.4%(-10.0)#1,625 |
| 31. | Amboy | 10.4% | 18.4%(-8.04)#31 | 20.4%(-9.99)#1,643 |
| 32. | Bird Island | 10.4% | 18.4%(-8.02)#32 | 20.4%(-9.97)#1,653 |
| 33. | Kennedy | 10.4% | 18.4%(-8.02)#33 | 20.4%(-9.97)#1,656 |
| 34. | Red Lake | 10.5% | 18.4%(-7.98)#34 | 20.4%(-9.92)#1,692 |
| 35. | Borup | 10.5% | 18.4%(-7.96)#35 | 20.4%(-9.90)#1,706 |
| 36. | Regal | 10.5% | 18.4%(-7.95)#36 | 20.4%(-9.89)#1,716 |
| 37. | Butterfield | 10.5% | 18.4%(-7.93)#37 | 20.4%(-9.87)#1,726 |
| 38. | Prinsburg | 10.5% | 18.4%(-7.90)#38 | 20.4%(-9.84)#1,751 |
| 39. | Mckinley | 10.6% | 18.4%(-7.88)#39 | 20.4%(-9.82)#1,764 |
| 40. | Hoyt Lakes | 10.6% | 18.4%(-7.87)#40 | 20.4%(-9.82)#1,765 |
| 41. | Avoca | 10.6% | 18.4%(-7.87)#41 | 20.4%(-9.82)#1,771 |
| 42. | Louisburg | 10.6% | 18.4%(-7.86)#42 | 20.4%(-9.81)#1,777 |
| 43. | Lewisville | 10.6% | 18.4%(-7.85)#43 | 20.4%(-9.79)#1,786 |
| 44. | Solway | 10.7% | 18.4%(-7.78)#44 | 20.4%(-9.72)#1,845 |
| 45. | Elmdale | 10.7% | 18.4%(-7.76)#45 | 20.4%(-9.70)#1,852 |
| 46. | Danvers | 10.7% | 18.4%(-7.74)#46 | 20.4%(-9.68)#1,862 |
| 47. | Walnut Grove | 10.7% | 18.4%(-7.69)#47 | 20.4%(-9.64)#1,895 |
| 48. | Chandler | 10.8% | 18.4%(-7.63)#48 | 20.4%(-9.57)#1,940 |
| 49. | Millerville | 10.8% | 18.4%(-7.59)#49 | 20.4%(-9.53)#1,974 |
| 50. | Odessa | 10.9% | 18.4%(-7.55)#50 | 20.4%(-9.50)#2,002 |
| 51. | Whalan | 10.9% | 18.4%(-7.55)#51 | 20.4%(-9.49)#2,008 |
| 52. | Roosevelt | 10.9% | 18.4%(-7.55)#52 | 20.4%(-9.49)#2,009 |
| 53. | Farwell | 10.9% | 18.4%(-7.49)#53 | 20.4%(-9.43)#2,047 |
| 54. | Felton | 11.0% | 18.4%(-7.48)#54 | 20.4%(-9.42)#2,054 |
| 55. | Clinton | 11.0% | 18.4%(-7.46)#55 | 20.4%(-9.41)#2,069 |
| 56. | Belview | 11.0% | 18.4%(-7.43)#56 | 20.4%(-9.38)#2,096 |
| 57. | Lake Wilson | 11.0% | 18.4%(-7.41)#57 | 20.4%(-9.36)#2,110 |
| 58. | Little Rock | 11.1% | 18.4%(-7.35)#58 | 20.4%(-9.29)#2,157 |
| 59. | Bingham Lake | 11.1% | 18.4%(-7.30)#59 | 20.4%(-9.25)#2,188 |
| 60. | Twin Lakes | 11.1% | 18.4%(-7.30)#60 | 20.4%(-9.24)#2,195 |
| 61. | Bigelow | 11.2% | 18.4%(-7.26)#61 | 20.4%(-9.20)#2,219 |
| 62. | Echo | 11.3% | 18.4%(-7.18)#62 | 20.4%(-9.12)#2,290 |
| 63. | Beardsley | 11.3% | 18.4%(-7.14)#63 | 20.4%(-9.08)#2,326 |
| 64. | Hancock | 11.4% | 18.4%(-7.08)#64 | 20.4%(-9.02)#2,380 |
| 65. | Westport | 11.4% | 18.4%(-7.01)#65 | 20.4%(-8.95)#2,440 |
| 66. | Milan | 11.5% | 18.4%(-6.95)#66 | 20.4%(-8.89)#2,502 |
| 67. | St Hilaire | 11.5% | 18.4%(-6.90)#67 | 20.4%(-8.84)#2,543 |
| 68. | Delhi | 11.5% | 18.4%(-6.89)#68 | 20.4%(-8.84)#2,550 |
| 69. | Grasston | 11.6% | 18.4%(-6.82)#69 | 20.4%(-8.76)#2,620 |
| 70. | Lastrup | 11.7% | 18.4%(-6.78)#70 | 20.4%(-8.72)#2,655 |
| 71. | Okabena | 11.7% | 18.4%(-6.71)#71 | 20.4%(-8.65)#2,734 |
| 72. | Alberta | 11.7% | 18.4%(-6.70)#72 | 20.4%(-8.65)#2,739 |
| 73. | De Graff | 11.7% | 18.4%(-6.69)#73 | 20.4%(-8.64)#2,748 |
| 74. | Dawson | 11.7% | 18.4%(-6.69)#74 | 20.4%(-8.63)#2,759 |
| 75. | Steen | 11.8% | 18.4%(-6.62)#75 | 20.4%(-8.56)#2,839 |
| 76. | Stephen | 11.8% | 18.4%(-6.60)#76 | 20.4%(-8.54)#2,858 |
| 77. | Pine Point | 11.9% | 18.4%(-6.57)#77 | 20.4%(-8.51)#2,901 |
| 78. | Madelia | 11.9% | 18.4%(-6.53)#78 | 20.4%(-8.48)#2,932 |
| 79. | Heron Lake | 11.9% | 18.4%(-6.51)#79 | 20.4%(-8.46)#2,951 |
| 80. | Shelly | 11.9% | 18.4%(-6.51)#80 | 20.4%(-8.45)#2,960 |
| 81. | Brookston | 11.9% | 18.4%(-6.49)#81 | 20.4%(-8.43)#2,975 |
| 82. | Knife River | 12.0% | 18.4%(-6.44)#82 | 20.4%(-8.39)#3,016 |
| 83. | Rose Creek | 12.0% | 18.4%(-6.44)#83 | 20.4%(-8.38)#3,023 |
| 84. | Lamberton | 12.1% | 18.4%(-6.37)#84 | 20.4%(-8.31)#3,091 |
| 85. | Elrosa | 12.1% | 18.4%(-6.36)#85 | 20.4%(-8.31)#3,095 |
| 86. | Round Lake | 12.1% | 18.4%(-6.31)#86 | 20.4%(-8.26)#3,142 |
| 87. | Dexter | 12.1% | 18.4%(-6.30)#87 | 20.4%(-8.24)#3,159 |
| 88. | Sacred Heart | 12.1% | 18.4%(-6.29)#88 | 20.4%(-8.23)#3,173 |
| 89. | Hallock | 12.2% | 18.4%(-6.28)#89 | 20.4%(-8.22)#3,188 |
| 90. | Frontenac | 12.2% | 18.4%(-6.27)#90 | 20.4%(-8.21)#3,203 |
| 91. | Holland | 12.2% | 18.4%(-6.26)#91 | 20.4%(-8.21)#3,208 |
| 92. | Middle River | 12.2% | 18.4%(-6.22)#92 | 20.4%(-8.16)#3,261 |
| 93. | Ottertail | 12.3% | 18.4%(-6.18)#93 | 20.4%(-8.12)#3,297 |
| 94. | Cyrus | 12.3% | 18.4%(-6.18)#94 | 20.4%(-8.12)#3,299 |
| 95. | Hawley | 12.3% | 18.4%(-6.16)#95 | 20.4%(-8.11)#3,319 |
| 96. | Martin Lake | 12.3% | 18.4%(-6.13)#96 | 20.4%(-8.08)#3,356 |
| 97. | Trimont | 12.3% | 18.4%(-6.12)#97 | 20.4%(-8.06)#3,370 |
| 98. | Vesta | 12.4% | 18.4%(-5.99)#98 | 20.4%(-7.94)#3,512 |
| 99. | Edgerton | 12.5% | 18.4%(-5.98)#99 | 20.4%(-7.92)#3,525 |
| 100. | Flensburg | 12.5% | 18.4%(-5.95)#100 | 20.4%(-7.90)#3,556 |
Common Questions
What are the Top 10 Cities with the Lowest Costs of Housing as Percentage of Income in Minnesota?
Top 10 Cities with the Lowest Costs of Housing as Percentage of Income in Minnesota are:
What city has the Lowest Costs of Housing as Percentage of Income in Minnesota?
Leonard has the Lowest Costs of Housing as Percentage of Income in Minnesota with 6.3%.
What is the Average Housing Costs as Percentage of Income in the State of Minnesota?
Average Housing Costs as Percentage of Income in Minnesota is 18.4%.
What is the Average Housing Costs as Percentage of Income in the United States?
Average Housing Costs as Percentage of Income in the United States is 20.4%.