Cities with the Highest Percentage of Immigrants from Liberia in Minnesota
RELATED REPORTS & OPTIONS
Liberia
Minnesota
Compare Cities
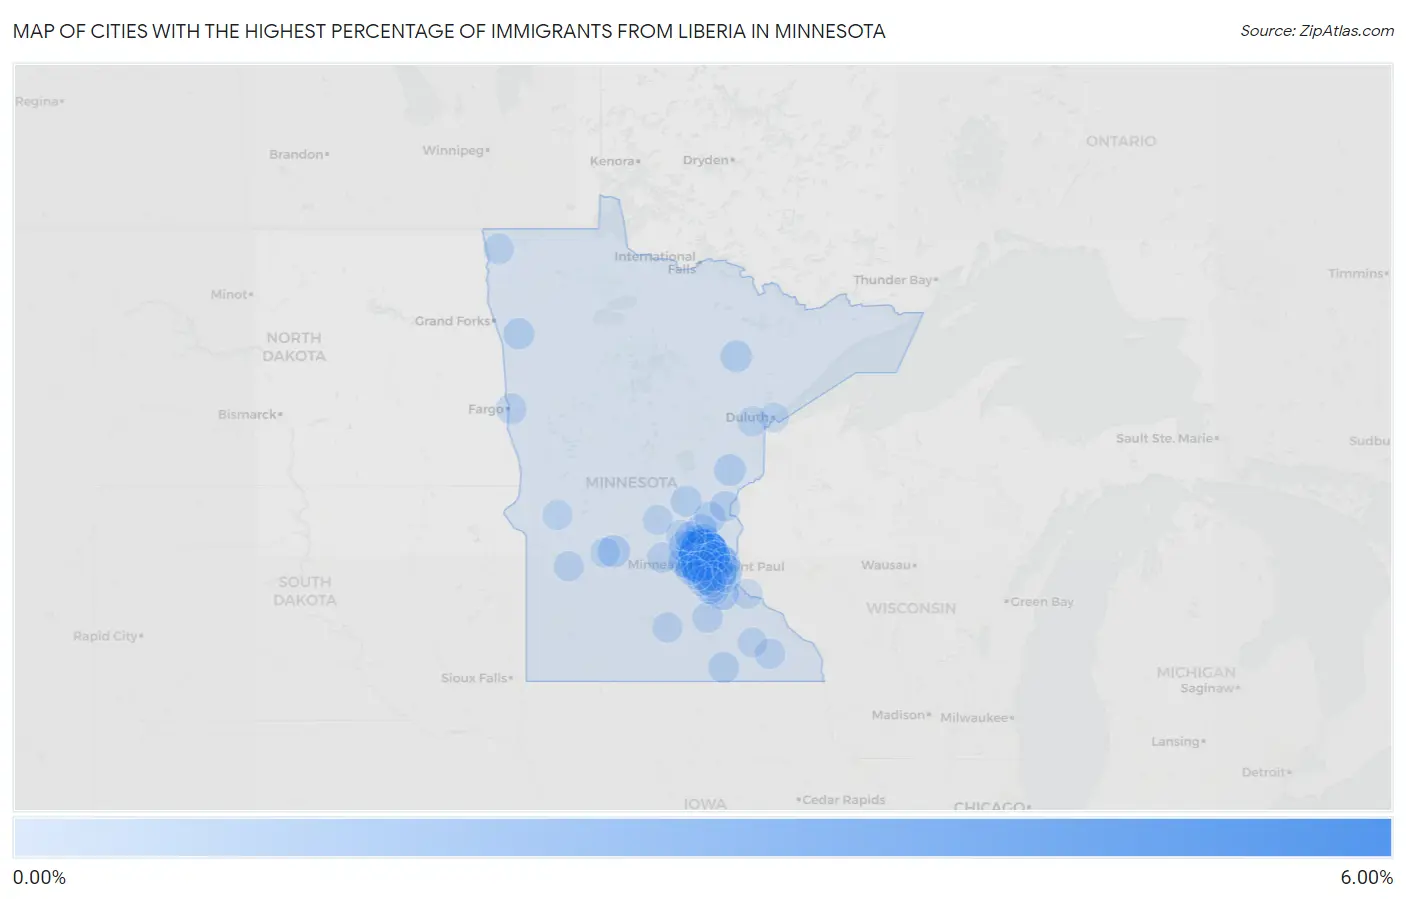
Map of Cities with the Highest Percentage of Immigrants from Liberia in Minnesota
0.00%
6.00%
Cities with the Highest Percentage of Immigrants from Liberia in Minnesota
| City | Liberia | vs State | vs National | |
| 1. | Brooklyn Center | 5.35% | 0.24%(+5.11)#-1 | 0.030%(+5.32)#0 |
| 2. | Brooklyn Park | 5.14% | 0.24%(+4.90)#36 | 0.030%(+5.11)#1,897 |
| 3. | New Hope | 4.76% | 0.24%(+4.52)#37 | 0.030%(+4.73)#1,898 |
| 4. | Champlin | 2.37% | 0.24%(+2.13)#38 | 0.030%(+2.34)#1,899 |
| 5. | Little Canada | 1.29% | 0.24%(+1.05)#39 | 0.030%(+1.26)#1,900 |
| 6. | Crystal | 1.25% | 0.24%(+1.01)#40 | 0.030%(+1.22)#1,901 |
| 7. | Andover | 1.03% | 0.24%(+0.789)#41 | 0.030%(+1.000)#1,902 |
| 8. | Maple Grove | 1.01% | 0.24%(+0.772)#42 | 0.030%(+0.983)#1,903 |
| 9. | Osseo | 0.80% | 0.24%(+0.557)#43 | 0.030%(+0.768)#1,904 |
| 10. | Long Lake | 0.76% | 0.24%(+0.519)#44 | 0.030%(+0.730)#1,905 |
| 11. | Hopkins | 0.72% | 0.24%(+0.479)#45 | 0.030%(+0.690)#1,906 |
| 12. | Coon Rapids | 0.69% | 0.24%(+0.447)#46 | 0.030%(+0.658)#1,907 |
| 13. | New Brighton | 0.68% | 0.24%(+0.442)#47 | 0.030%(+0.653)#1,908 |
| 14. | Hampton | 0.68% | 0.24%(+0.436)#48 | 0.030%(+0.647)#1,909 |
| 15. | Maple Plain | 0.67% | 0.24%(+0.434)#49 | 0.030%(+0.644)#1,910 |
| 16. | Kandiyohi | 0.64% | 0.24%(+0.396)#50 | 0.030%(+0.607)#1,911 |
| 17. | Fridley | 0.60% | 0.24%(+0.362)#51 | 0.030%(+0.572)#1,912 |
| 18. | Ramsey | 0.52% | 0.24%(+0.282)#52 | 0.030%(+0.492)#1,913 |
| 19. | St Michael | 0.51% | 0.24%(+0.274)#53 | 0.030%(+0.485)#1,914 |
| 20. | Mounds View | 0.50% | 0.24%(+0.263)#54 | 0.030%(+0.474)#1,915 |
| 21. | Buhl | 0.49% | 0.24%(+0.246)#55 | 0.030%(+0.457)#1,916 |
| 22. | Sandstone | 0.47% | 0.24%(+0.227)#56 | 0.030%(+0.438)#1,917 |
| 23. | Anoka | 0.46% | 0.24%(+0.223)#57 | 0.030%(+0.434)#1,918 |
| 24. | St Francis | 0.45% | 0.24%(+0.211)#58 | 0.030%(+0.422)#1,919 |
| 25. | Cambridge | 0.43% | 0.24%(+0.191)#59 | 0.030%(+0.402)#1,920 |
| 26. | Blaine | 0.37% | 0.24%(+0.125)#60 | 0.030%(+0.336)#1,921 |
| 27. | Plymouth | 0.33% | 0.24%(+0.092)#61 | 0.030%(+0.303)#1,922 |
| 28. | Robbinsdale | 0.33% | 0.24%(+0.092)#62 | 0.030%(+0.302)#1,923 |
| 29. | Crookston | 0.32% | 0.24%(+0.081)#63 | 0.030%(+0.291)#1,924 |
| 30. | Austin | 0.30% | 0.24%(+0.062)#64 | 0.030%(+0.272)#1,925 |
| 31. | Inver Grove Heights | 0.27% | 0.24%(+0.034)#65 | 0.030%(+0.245)#1,926 |
| 32. | Milaca | 0.26% | 0.24%(+0.023)#66 | 0.030%(+0.234)#1,927 |
| 33. | Golden Valley | 0.24% | 0.24%(-0.001)#67 | 0.030%(+0.210)#1,928 |
| 34. | Howard Lake | 0.22% | 0.24%(-0.024)#68 | 0.030%(+0.186)#1,929 |
| 35. | Bloomington | 0.21% | 0.24%(-0.029)#69 | 0.030%(+0.182)#1,930 |
| 36. | South St Paul | 0.21% | 0.24%(-0.032)#70 | 0.030%(+0.179)#1,931 |
| 37. | Farmington | 0.20% | 0.24%(-0.036)#71 | 0.030%(+0.175)#1,932 |
| 38. | Columbia Heights | 0.19% | 0.24%(-0.053)#72 | 0.030%(+0.158)#1,933 |
| 39. | Faribault | 0.18% | 0.24%(-0.056)#73 | 0.030%(+0.155)#1,934 |
| 40. | St Anthony City Hennepin And Ramsey Counties | 0.18% | 0.24%(-0.058)#74 | 0.030%(+0.152)#1,935 |
| 41. | Minnetonka | 0.17% | 0.24%(-0.067)#75 | 0.030%(+0.144)#1,936 |
| 42. | Moorhead | 0.17% | 0.24%(-0.067)#76 | 0.030%(+0.144)#1,937 |
| 43. | St Paul | 0.16% | 0.24%(-0.081)#77 | 0.030%(+0.129)#1,938 |
| 44. | Rush City | 0.15% | 0.24%(-0.086)#78 | 0.030%(+0.125)#1,939 |
| 45. | Oakdale | 0.14% | 0.24%(-0.098)#79 | 0.030%(+0.113)#1,940 |
| 46. | Minneapolis | 0.14% | 0.24%(-0.099)#80 | 0.030%(+0.112)#1,941 |
| 47. | Lakeville | 0.13% | 0.24%(-0.113)#81 | 0.030%(+0.098)#1,942 |
| 48. | Hallock | 0.12% | 0.24%(-0.116)#82 | 0.030%(+0.095)#1,943 |
| 49. | Rogers | 0.12% | 0.24%(-0.120)#83 | 0.030%(+0.091)#1,944 |
| 50. | Cottage Grove | 0.11% | 0.24%(-0.128)#84 | 0.030%(+0.082)#1,945 |
| 51. | Chatfield | 0.11% | 0.24%(-0.132)#85 | 0.030%(+0.079)#1,946 |
| 52. | Mankato | 0.11% | 0.24%(-0.132)#86 | 0.030%(+0.078)#1,947 |
| 53. | Shoreview | 0.10% | 0.24%(-0.136)#87 | 0.030%(+0.075)#1,948 |
| 54. | Montevideo | 0.075% | 0.24%(-0.166)#88 | 0.030%(+0.045)#1,949 |
| 55. | Cloquet | 0.064% | 0.24%(-0.177)#89 | 0.030%(+0.034)#1,950 |
| 56. | Savage | 0.062% | 0.24%(-0.179)#90 | 0.030%(+0.032)#1,951 |
| 57. | Burnsville | 0.058% | 0.24%(-0.183)#91 | 0.030%(+0.028)#1,952 |
| 58. | Big Lake | 0.051% | 0.24%(-0.190)#92 | 0.030%(+0.021)#1,953 |
| 59. | Elk River | 0.050% | 0.24%(-0.190)#93 | 0.030%(+0.020)#1,954 |
| 60. | Eagan | 0.048% | 0.24%(-0.192)#94 | 0.030%(+0.019)#1,979 |
| 61. | Woodbury | 0.042% | 0.24%(-0.198)#95 | 0.030%(+0.013)#2,070 |
| 62. | Morris | 0.039% | 0.24%(-0.201)#96 | 0.030%(+0.010)#2,071 |
| 63. | Apple Valley | 0.032% | 0.24%(-0.208)#97 | 0.030%(+0.003)#2,072 |
| 64. | St Louis Park | 0.030% | 0.24%(-0.210)#98 | 0.030%(+0.001)#2,073 |
| 65. | Eden Prairie | 0.030% | 0.24%(-0.211)#99 | 0.030%(+0.000)#2,074 |
| 66. | Rochester | 0.028% | 0.24%(-0.212)#100 | 0.030%(-0.002)#2,075 |
| 67. | St Cloud | 0.017% | 0.24%(-0.223)#101 | 0.030%(-0.012)#2,095 |
| 68. | Duluth | 0.016% | 0.24%(-0.224)#102 | 0.030%(-0.014)#2,096 |
| 69. | Shorewood | 0.013% | 0.24%(-0.228)#103 | 0.030%(-0.017)#2,097 |
| 70. | Red Wing | 0.0060% | 0.24%(-0.234)#104 | 0.030%(-0.024)#2,098 |
| 71. | Willmar | 0.0048% | 0.24%(-0.236)#105 | 0.030%(-0.025)#2,099 |
Common Questions
What are the Top 10 Cities with the Highest Percentage of Immigrants from Liberia in Minnesota?
Top 10 Cities with the Highest Percentage of Immigrants from Liberia in Minnesota are:
#1
5.35%
#2
5.14%
#3
4.76%
#4
2.37%
#5
1.29%
#6
1.25%
#7
1.03%
#8
1.01%
#9
0.80%
#10
0.76%
What city has the Highest Percentage of Immigrants from Liberia in Minnesota?
Brooklyn Center has the Highest Percentage of Immigrants from Liberia in Minnesota with 5.35%.
What is the Percentage of Immigrants from Liberia in the State of Minnesota?
Percentage of Immigrants from Liberia in Minnesota is 0.24%.
What is the Percentage of Immigrants from Liberia in the United States?
Percentage of Immigrants from Liberia in the United States is 0.030%.