Marshall, MN
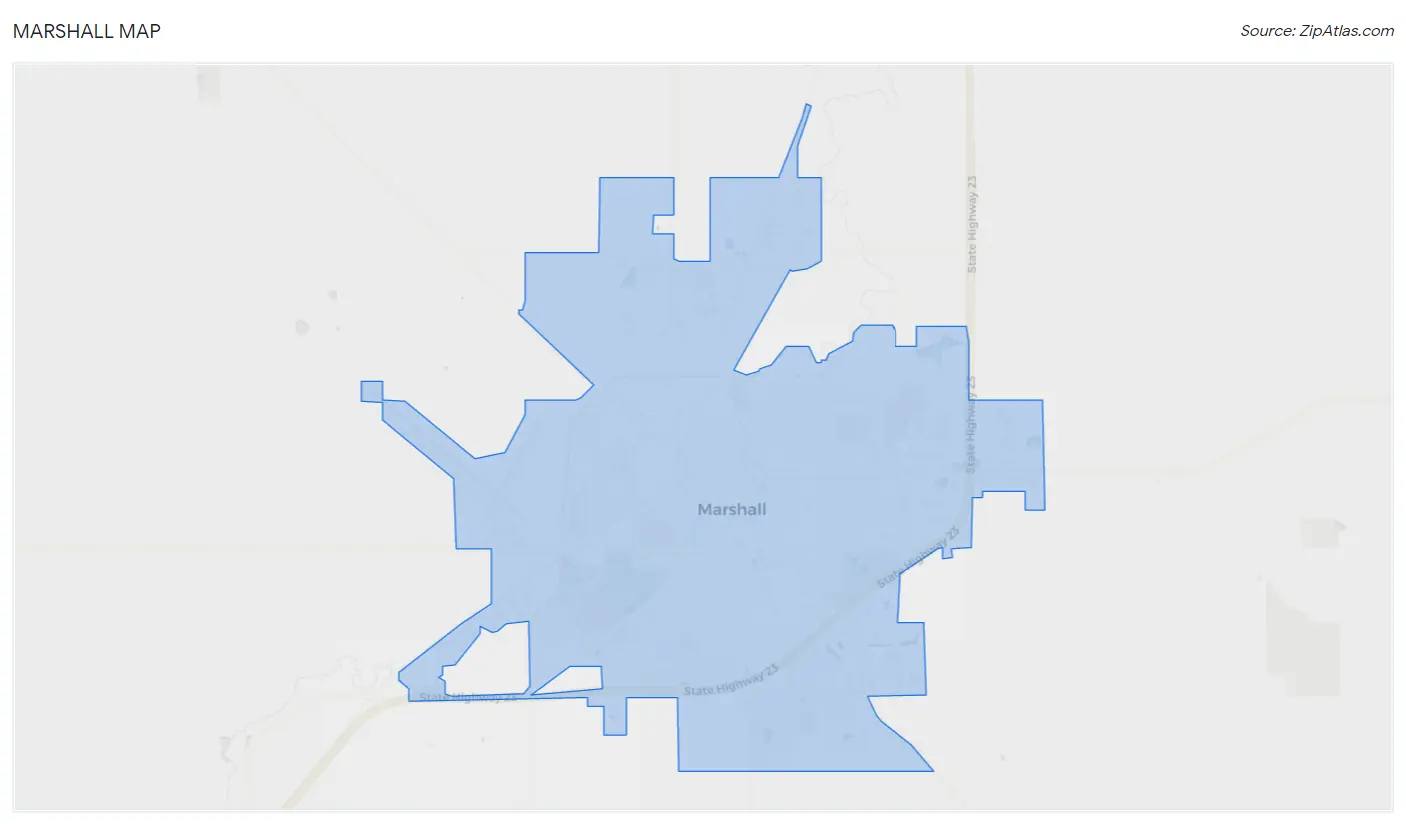
Marshall Map
Marshall Overview
13,647
TOTAL POPULATION
6,458
MALE POPULATION
7,189
FEMALE POPULATION
89.83
MALES / 100 FEMALES
111.32
FEMALES / 100 MALES
34.7
MEDIAN AGE
3.0
AVG FAMILY SIZE
2.4
AVG HOUSEHOLD SIZE
$33,428
PER CAPITA INCOME
$74,125
AVG FAMILY INCOME
$60,532
AVG HOUSEHOLD INCOME
33.5%
WAGE / INCOME GAP [ % ]
66.5¢/ $1
WAGE / INCOME GAP [ $ ]
0.49
INEQUALITY / GINI INDEX
6,907
LABOR FORCE [ PEOPLE ]
64.9%
PERCENT IN LABOR FORCE
3.1%
UNEMPLOYMENT RATE
Marshall Zip Codes
Marshall Area Codes
Race in Marshall
The most populous races in Marshall are White / Caucasian (10,701 | 78.4%), Hispanic or Latino (1,229 | 9.0%), and Asian (897 | 6.6%).
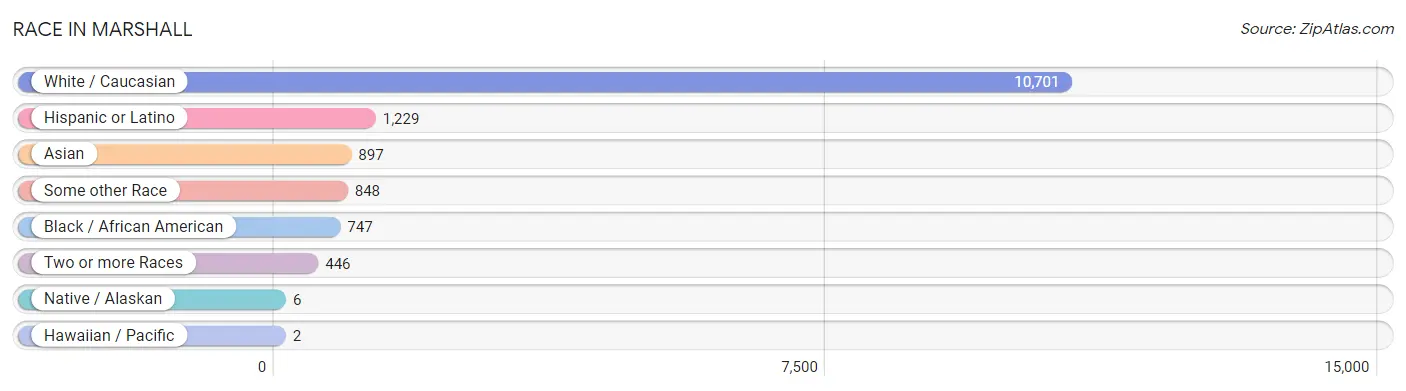
| Race | # Population | % Population |
| Asian | 897 | 6.6% |
| Black / African American | 747 | 5.5% |
| Hawaiian / Pacific | 2 | 0.0% |
| Hispanic or Latino | 1,229 | 9.0% |
| Native / Alaskan | 6 | 0.0% |
| White / Caucasian | 10,701 | 78.4% |
| Two or more Races | 446 | 3.3% |
| Some other Race | 848 | 6.2% |
| Total | 13,647 | 100.0% |
Ancestry in Marshall
The most populous ancestries reported in Marshall are German (4,482 | 32.8%), Norwegian (1,729 | 12.7%), Irish (905 | 6.6%), Belgian (841 | 6.2%), and French (815 | 6.0%), together accounting for 64.3% of all Marshall residents.
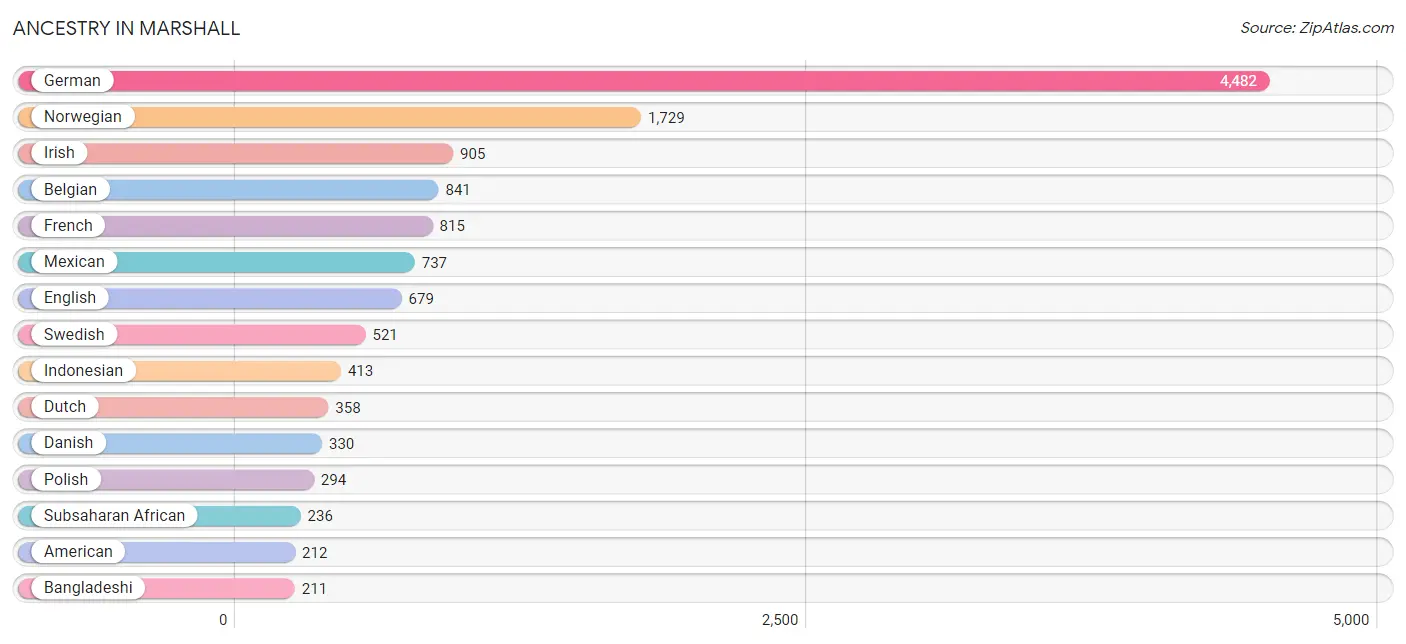
| Ancestry | # Population | % Population |
| African | 97 | 0.7% |
| American | 212 | 1.5% |
| Australian | 5 | 0.0% |
| Austrian | 4 | 0.0% |
| Bangladeshi | 211 | 1.5% |
| Belgian | 841 | 6.2% |
| Burmese | 34 | 0.3% |
| Central American | 136 | 1.0% |
| Chippewa | 52 | 0.4% |
| Croatian | 15 | 0.1% |
| Czech | 81 | 0.6% |
| Czechoslovakian | 17 | 0.1% |
| Danish | 330 | 2.4% |
| Dutch | 358 | 2.6% |
| Eastern European | 18 | 0.1% |
| English | 679 | 5.0% |
| Ethiopian | 3 | 0.0% |
| European | 82 | 0.6% |
| Filipino | 9 | 0.1% |
| Finnish | 13 | 0.1% |
| French | 815 | 6.0% |
| French Canadian | 62 | 0.4% |
| German | 4,482 | 32.8% |
| Guatemalan | 3 | 0.0% |
| Haitian | 3 | 0.0% |
| Hungarian | 37 | 0.3% |
| Icelander | 8 | 0.1% |
| Indian (Asian) | 33 | 0.2% |
| Indonesian | 413 | 3.0% |
| Irish | 905 | 6.6% |
| Italian | 92 | 0.7% |
| Jamaican | 7 | 0.1% |
| Kenyan | 8 | 0.1% |
| Korean | 13 | 0.1% |
| Lithuanian | 13 | 0.1% |
| Luxembourger | 8 | 0.1% |
| Mexican | 737 | 5.4% |
| Navajo | 26 | 0.2% |
| Nigerian | 12 | 0.1% |
| Norwegian | 1,729 | 12.7% |
| Pakistani | 83 | 0.6% |
| Polish | 294 | 2.1% |
| Puerto Rican | 75 | 0.5% |
| Russian | 60 | 0.4% |
| Salvadoran | 133 | 1.0% |
| Scandinavian | 191 | 1.4% |
| Scotch-Irish | 11 | 0.1% |
| Scottish | 49 | 0.4% |
| Somali | 143 | 1.1% |
| Subsaharan African | 236 | 1.7% |
| Swedish | 521 | 3.8% |
| Swiss | 6 | 0.0% |
| Thai | 114 | 0.8% |
| Welsh | 40 | 0.3% | View All 54 Rows |
Immigrants in Marshall
The most numerous immigrant groups reported in Marshall came from Asia (574 | 4.2%), South Eastern Asia (502 | 3.7%), Latin America (490 | 3.6%), Central America (459 | 3.4%), and Africa (345 | 2.5%), together accounting for 17.4% of all Marshall residents.
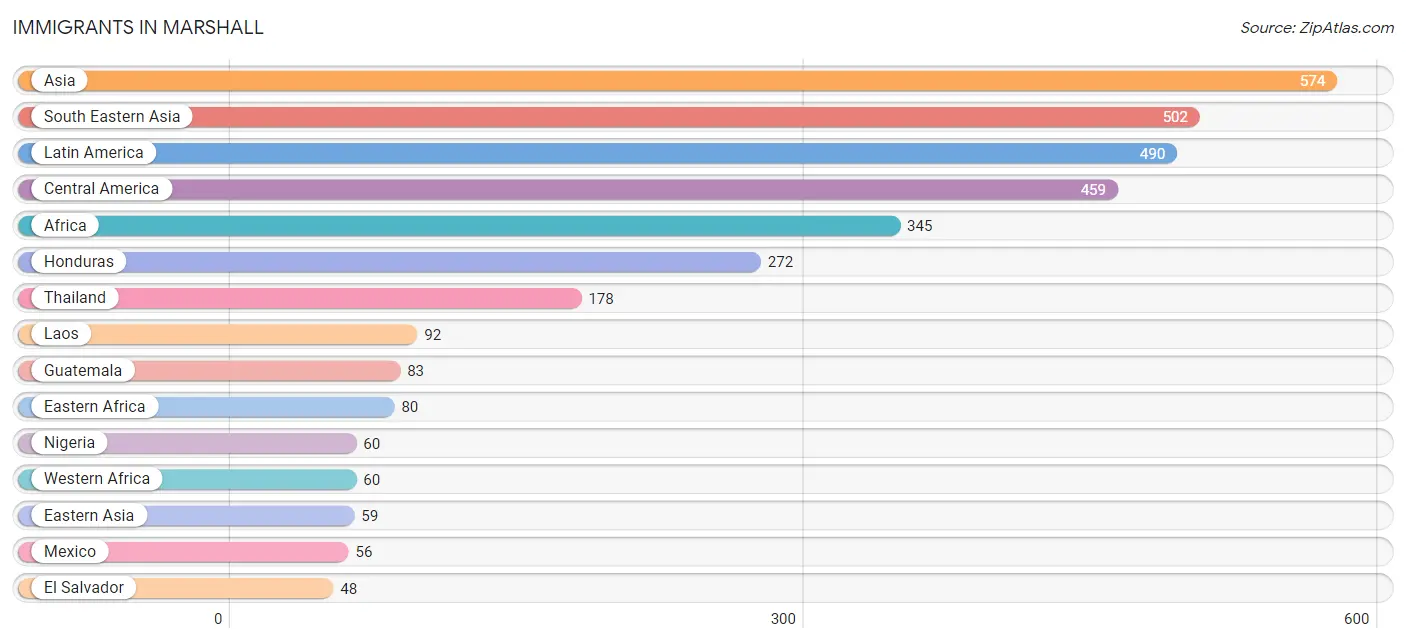
| Immigration Origin | # Population | % Population |
| Africa | 345 | 2.5% |
| Asia | 574 | 4.2% |
| Brazil | 24 | 0.2% |
| Canada | 19 | 0.1% |
| Caribbean | 7 | 0.1% |
| Central America | 459 | 3.4% |
| China | 35 | 0.3% |
| Eastern Africa | 80 | 0.6% |
| Eastern Asia | 59 | 0.4% |
| Eastern Europe | 1 | 0.0% |
| El Salvador | 48 | 0.4% |
| England | 11 | 0.1% |
| Ethiopia | 3 | 0.0% |
| Europe | 44 | 0.3% |
| France | 24 | 0.2% |
| Guatemala | 83 | 0.6% |
| Honduras | 272 | 2.0% |
| Hong Kong | 11 | 0.1% |
| Italy | 8 | 0.1% |
| Jamaica | 7 | 0.1% |
| Kenya | 40 | 0.3% |
| Korea | 24 | 0.2% |
| Laos | 92 | 0.7% |
| Latin America | 490 | 3.6% |
| Lithuania | 1 | 0.0% |
| Mexico | 56 | 0.4% |
| Nigeria | 60 | 0.4% |
| Northern Europe | 11 | 0.1% |
| Pakistan | 13 | 0.1% |
| Philippines | 13 | 0.1% |
| Somalia | 37 | 0.3% |
| South America | 24 | 0.2% |
| South Central Asia | 13 | 0.1% |
| South Eastern Asia | 502 | 3.7% |
| Southern Europe | 8 | 0.1% |
| Taiwan | 9 | 0.1% |
| Thailand | 178 | 1.3% |
| Western Africa | 60 | 0.4% |
| Western Europe | 24 | 0.2% | View All 39 Rows |
Sex and Age in Marshall
Sex and Age in Marshall
The most populous age groups in Marshall are 30 to 34 Years (575 | 8.9%) for men and Under 5 Years (648 | 9.0%) for women.
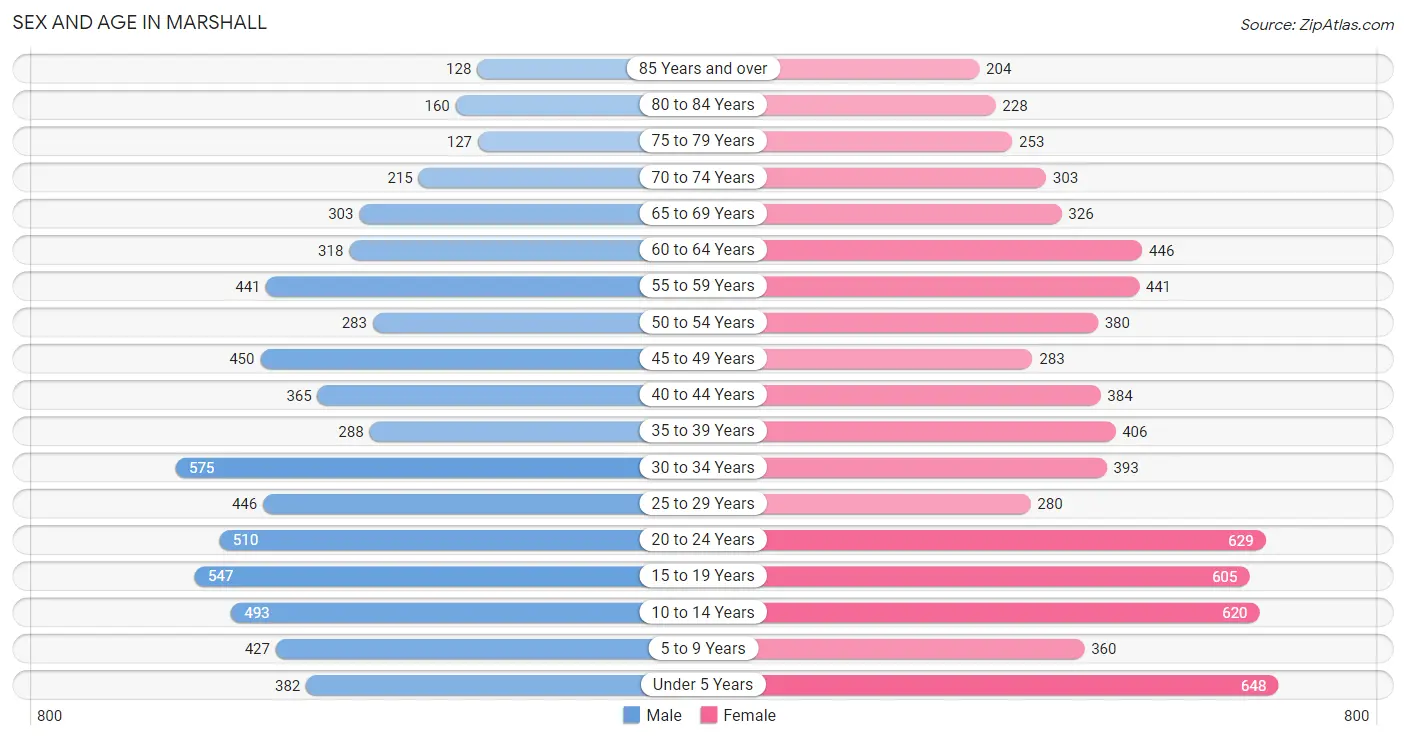
| Age Bracket | Male | Female |
| Under 5 Years | 382 (5.9%) | 648 (9.0%) |
| 5 to 9 Years | 427 (6.6%) | 360 (5.0%) |
| 10 to 14 Years | 493 (7.6%) | 620 (8.6%) |
| 15 to 19 Years | 547 (8.5%) | 605 (8.4%) |
| 20 to 24 Years | 510 (7.9%) | 629 (8.7%) |
| 25 to 29 Years | 446 (6.9%) | 280 (3.9%) |
| 30 to 34 Years | 575 (8.9%) | 393 (5.5%) |
| 35 to 39 Years | 288 (4.5%) | 406 (5.7%) |
| 40 to 44 Years | 365 (5.7%) | 384 (5.3%) |
| 45 to 49 Years | 450 (7.0%) | 283 (3.9%) |
| 50 to 54 Years | 283 (4.4%) | 380 (5.3%) |
| 55 to 59 Years | 441 (6.8%) | 441 (6.1%) |
| 60 to 64 Years | 318 (4.9%) | 446 (6.2%) |
| 65 to 69 Years | 303 (4.7%) | 326 (4.5%) |
| 70 to 74 Years | 215 (3.3%) | 303 (4.2%) |
| 75 to 79 Years | 127 (2.0%) | 253 (3.5%) |
| 80 to 84 Years | 160 (2.5%) | 228 (3.2%) |
| 85 Years and over | 128 (2.0%) | 204 (2.8%) |
| Total | 6,458 (100.0%) | 7,189 (100.0%) |
Families and Households in Marshall
Median Family Size in Marshall
The median family size in Marshall is 3.02 persons per family, with single male/father families (240 | 7.3%) accounting for the largest median family size of 3.31 persons per family. On the other hand, single female/mother families (659 | 20.2%) represent the smallest median family size with 2.49 persons per family.
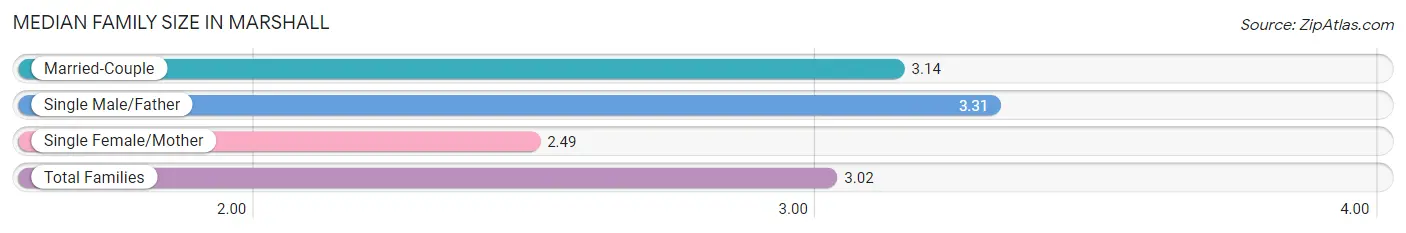
| Family Type | # Families | Family Size |
| Married-Couple | 2,370 (72.5%) | 3.14 |
| Single Male/Father | 240 (7.3%) | 3.31 |
| Single Female/Mother | 659 (20.2%) | 2.49 |
| Total Families | 3,269 (100.0%) | 3.02 |
Median Household Size in Marshall
The median household size in Marshall is 2.38 persons per household, with single male/father households (240 | 4.5%) accounting for the largest median household size of 3.4 persons per household. non-family households (2,082 | 38.9%) represent the smallest median household size with 1.21 persons per household.
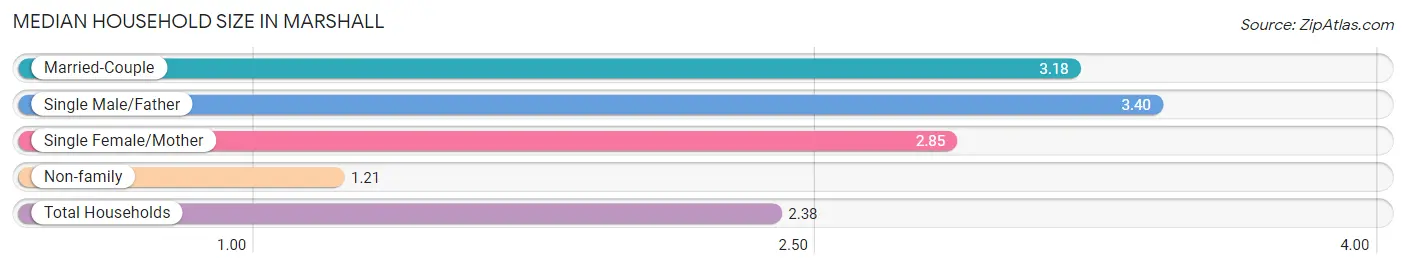
| Household Type | # Households | Household Size |
| Married-Couple | 2,370 (44.3%) | 3.18 |
| Single Male/Father | 240 (4.5%) | 3.40 |
| Single Female/Mother | 659 (12.3%) | 2.85 |
| Non-family | 2,082 (38.9%) | 1.21 |
| Total Households | 5,351 (100.0%) | 2.38 |
Household Size by Marriage Status in Marshall
Out of a total of 5,351 households in Marshall, 3,269 (61.1%) are family households, while 2,082 (38.9%) are nonfamily households. The most numerous type of family households are 2-person households, comprising 1,527, and the most common type of nonfamily households are 1-person households, comprising 1,802.
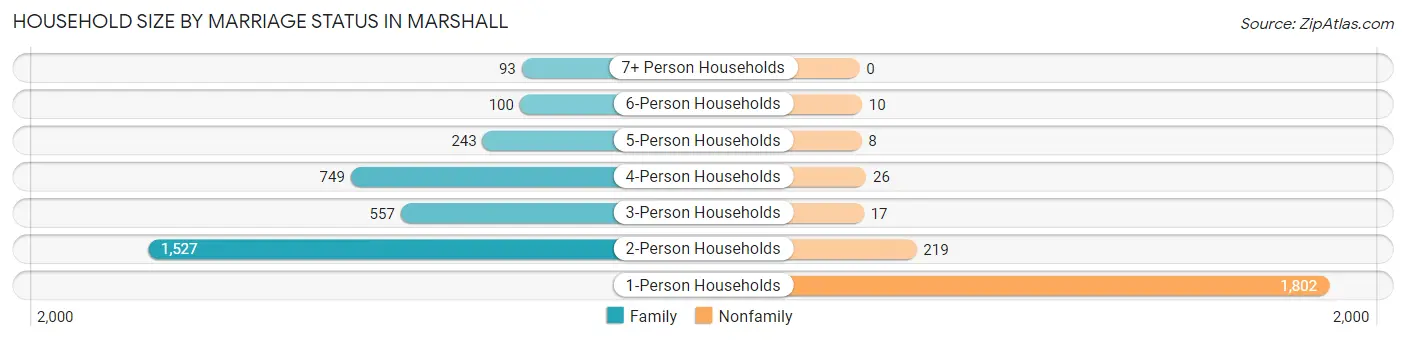
| Household Size | Family Households | Nonfamily Households |
| 1-Person Households | - | 1,802 (33.7%) |
| 2-Person Households | 1,527 (28.5%) | 219 (4.1%) |
| 3-Person Households | 557 (10.4%) | 17 (0.3%) |
| 4-Person Households | 749 (14.0%) | 26 (0.5%) |
| 5-Person Households | 243 (4.5%) | 8 (0.2%) |
| 6-Person Households | 100 (1.9%) | 10 (0.2%) |
| 7+ Person Households | 93 (1.7%) | 0 (0.0%) |
| Total | 3,269 (61.1%) | 2,082 (38.9%) |
Female Fertility in Marshall
Fertility by Age in Marshall
Average fertility rate in Marshall is 46.0 births per 1,000 women. Women in the age bracket of 20 to 34 years have the highest fertility rate with 81.0 births per 1,000 women. Women in the age bracket of 20 to 34 years acount for 76.3% of all women with births.
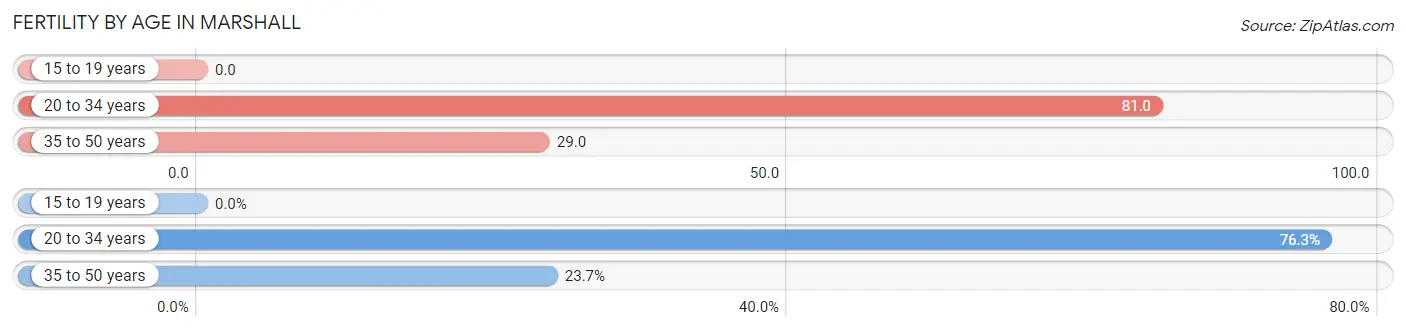
| Age Bracket | Women with Births | Births / 1,000 Women |
| 15 to 19 years | 0 (0.0%) | 0.0 |
| 20 to 34 years | 106 (76.3%) | 81.0 |
| 35 to 50 years | 33 (23.7%) | 29.0 |
| Total | 139 (100.0%) | 46.0 |
Fertility by Age by Marriage Status in Marshall
93.5% of women with births (139) in Marshall are married. The highest percentage of unmarried women with births falls into 20 to 34 years age bracket with 8.5% of them unmarried at the time of birth, while the lowest percentage of unmarried women with births belong to 35 to 50 years age bracket with 0.0% of them unmarried.
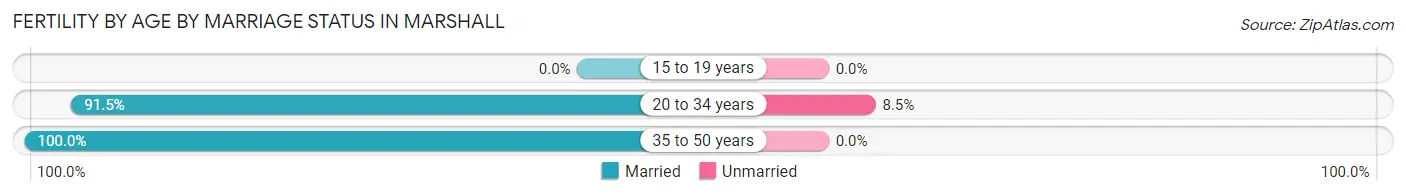
| Age Bracket | Married | Unmarried |
| 15 to 19 years | 0 (0.0%) | 0 (0.0%) |
| 20 to 34 years | 97 (91.5%) | 9 (8.5%) |
| 35 to 50 years | 33 (100.0%) | 0 (0.0%) |
| Total | 130 (93.5%) | 9 (6.5%) |
Fertility by Education in Marshall
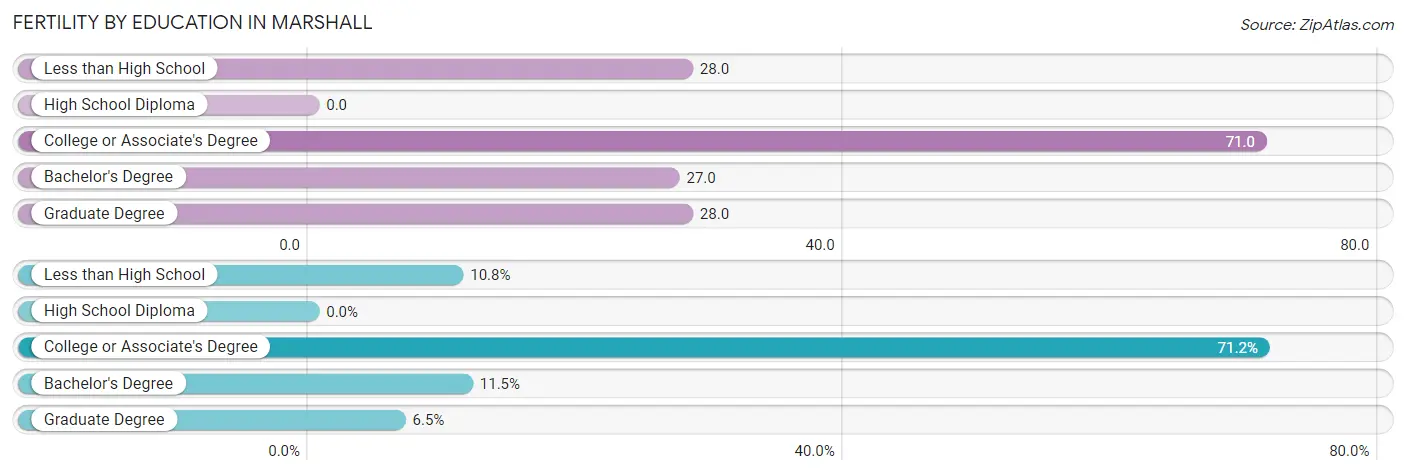
| Educational Attainment | Women with Births | Births / 1,000 Women |
| Less than High School | 15 (10.8%) | 28.0 |
| High School Diploma | 0 (0.0%) | 0.0 |
| College or Associate's Degree | 99 (71.2%) | 71.0 |
| Bachelor's Degree | 16 (11.5%) | 27.0 |
| Graduate Degree | 9 (6.5%) | 28.0 |
| Total | 139 (100.0%) | 46.0 |
Fertility by Education by Marriage Status in Marshall
6.5% of women with births in Marshall are unmarried. Women with the educational attainment of less than high school are most likely to be married with 100.0% of them married at childbirth, while women with the educational attainment of college or associate's degree are least likely to be married with 9.1% of them unmarried at childbirth.
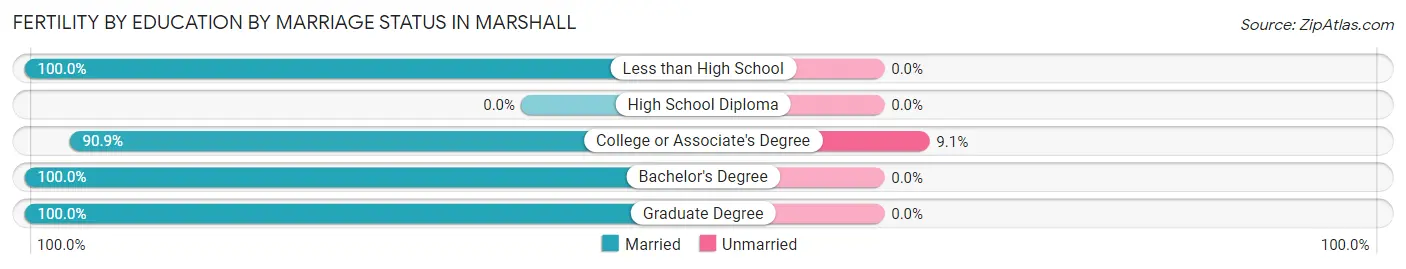
| Educational Attainment | Married | Unmarried |
| Less than High School | 15 (100.0%) | 0 (0.0%) |
| High School Diploma | 0 (0.0%) | 0 (0.0%) |
| College or Associate's Degree | 90 (90.9%) | 9 (9.1%) |
| Bachelor's Degree | 16 (100.0%) | 0 (0.0%) |
| Graduate Degree | 9 (100.0%) | 0 (0.0%) |
| Total | 130 (93.5%) | 9 (6.5%) |
Income in Marshall
Income Overview in Marshall
Per Capita Income in Marshall is $33,428, while median incomes of families and households are $74,125 and $60,532 respectively.
| Characteristic | Number | Measure |
| Per Capita Income | 13,647 | $33,428 |
| Median Family Income | 3,269 | $74,125 |
| Mean Family Income | 3,269 | $104,132 |
| Median Household Income | 5,351 | $60,532 |
| Mean Household Income | 5,351 | $84,010 |
| Income Deficit | 3,269 | $0 |
| Wage / Income Gap (%) | 13,647 | 33.50% |
| Wage / Income Gap ($) | 13,647 | 66.50¢ per $1 |
| Gini / Inequality Index | 13,647 | 0.49 |
Earnings by Sex in Marshall
Average Earnings in Marshall are $36,814, $44,051 for men and $29,295 for women, a difference of 33.5%.
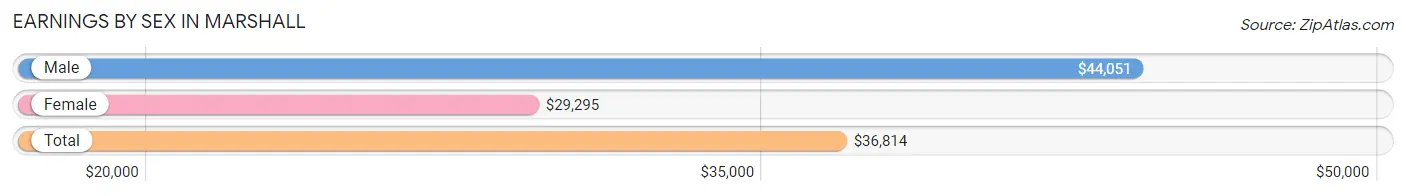
| Sex | Number | Average Earnings |
| Male | 3,732 (50.0%) | $44,051 |
| Female | 3,725 (49.9%) | $29,295 |
| Total | 7,457 (100.0%) | $36,814 |
Earnings by Sex by Income Bracket in Marshall
The most common earnings brackets in Marshall are $75,000 to $99,999 for men (537 | 14.4%) and $2,499 or less for women (348 | 9.3%).
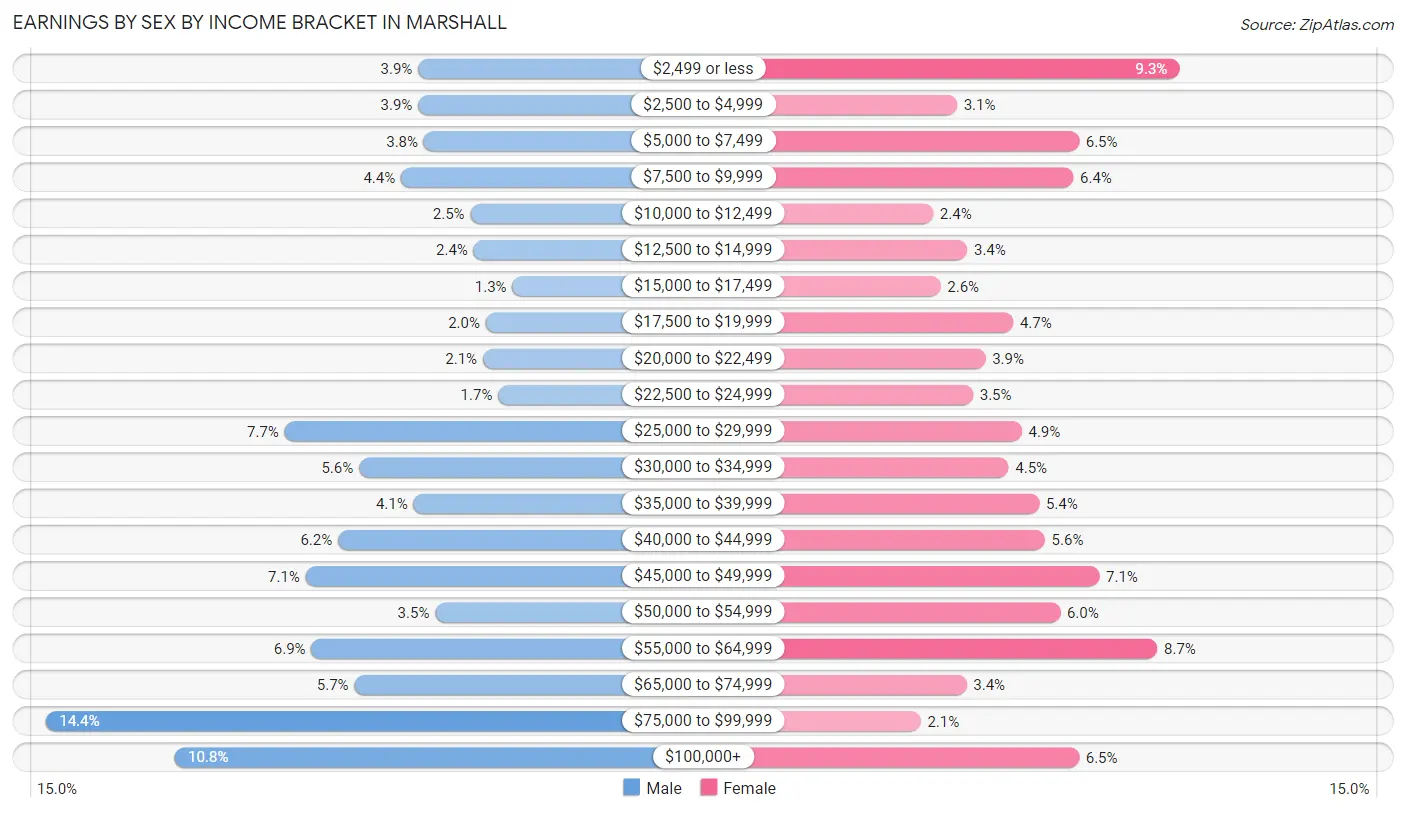
| Income | Male | Female |
| $2,499 or less | 147 (3.9%) | 348 (9.3%) |
| $2,500 to $4,999 | 147 (3.9%) | 115 (3.1%) |
| $5,000 to $7,499 | 141 (3.8%) | 243 (6.5%) |
| $7,500 to $9,999 | 165 (4.4%) | 237 (6.4%) |
| $10,000 to $12,499 | 92 (2.5%) | 90 (2.4%) |
| $12,500 to $14,999 | 89 (2.4%) | 126 (3.4%) |
| $15,000 to $17,499 | 48 (1.3%) | 98 (2.6%) |
| $17,500 to $19,999 | 76 (2.0%) | 174 (4.7%) |
| $20,000 to $22,499 | 79 (2.1%) | 145 (3.9%) |
| $22,500 to $24,999 | 63 (1.7%) | 132 (3.5%) |
| $25,000 to $29,999 | 287 (7.7%) | 183 (4.9%) |
| $30,000 to $34,999 | 209 (5.6%) | 169 (4.5%) |
| $35,000 to $39,999 | 152 (4.1%) | 201 (5.4%) |
| $40,000 to $44,999 | 231 (6.2%) | 207 (5.6%) |
| $45,000 to $49,999 | 265 (7.1%) | 264 (7.1%) |
| $50,000 to $54,999 | 129 (3.5%) | 223 (6.0%) |
| $55,000 to $64,999 | 259 (6.9%) | 325 (8.7%) |
| $65,000 to $74,999 | 214 (5.7%) | 125 (3.4%) |
| $75,000 to $99,999 | 537 (14.4%) | 77 (2.1%) |
| $100,000+ | 402 (10.8%) | 243 (6.5%) |
| Total | 3,732 (100.0%) | 3,725 (100.0%) |
Earnings by Sex by Educational Attainment in Marshall
Average earnings in Marshall are $49,671 for men and $40,485 for women, a difference of 18.5%. Men with an educational attainment of graduate degree enjoy the highest average annual earnings of $94,476, while those with high school diploma education earn the least with $35,929. Women with an educational attainment of graduate degree earn the most with the average annual earnings of $57,555, while those with high school diploma education have the smallest earnings of $18,691.
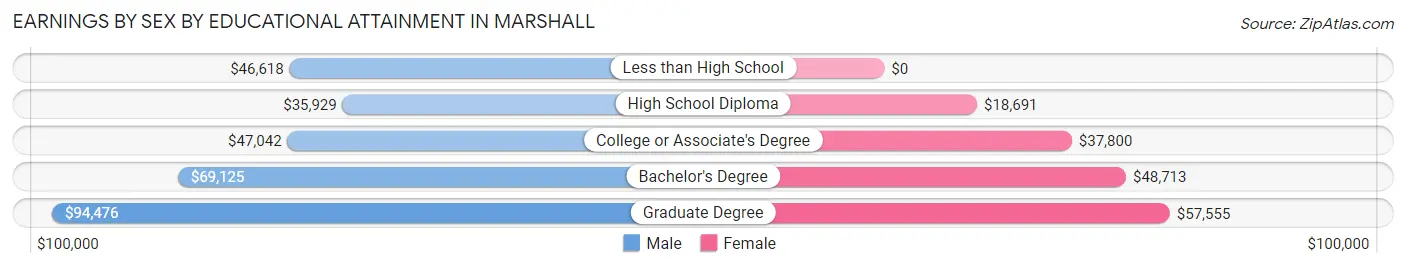
| Educational Attainment | Male Income | Female Income |
| Less than High School | $46,618 | $0 |
| High School Diploma | $35,929 | $18,691 |
| College or Associate's Degree | $47,042 | $37,800 |
| Bachelor's Degree | $69,125 | $48,713 |
| Graduate Degree | $94,476 | $57,555 |
| Total | $49,671 | $40,485 |
Family Income in Marshall
Family Income Brackets in Marshall
According to the Marshall family income data, there are 680 families falling into the $100,000 to $149,999 income range, which is the most common income bracket and makes up 20.8% of all families. Conversely, the $10,000 to $14,999 income bracket is the least frequent group with only 82 families (2.5%) belonging to this category.
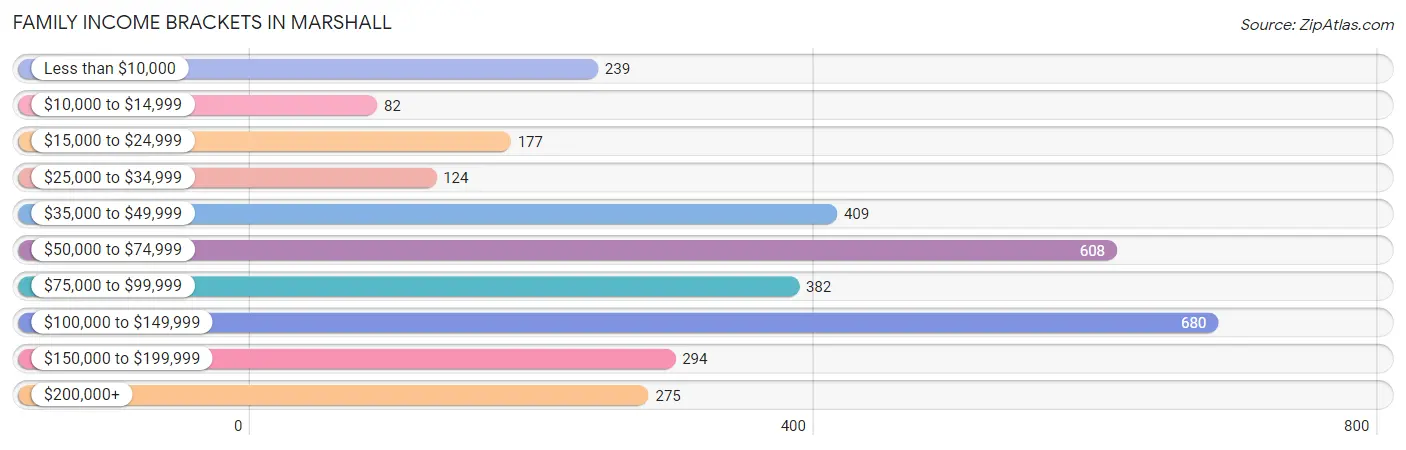
| Income Bracket | # Families | % Families |
| Less than $10,000 | 239 | 7.3% |
| $10,000 to $14,999 | 82 | 2.5% |
| $15,000 to $24,999 | 177 | 5.4% |
| $25,000 to $34,999 | 124 | 3.8% |
| $35,000 to $49,999 | 409 | 12.5% |
| $50,000 to $74,999 | 608 | 18.6% |
| $75,000 to $99,999 | 382 | 11.7% |
| $100,000 to $149,999 | 680 | 20.8% |
| $150,000 to $199,999 | 294 | 9.0% |
| $200,000+ | 275 | 8.4% |
Family Income by Famaliy Size in Marshall
4-person families (574 | 17.6%) account for the highest median family income in Marshall with $126,838 per family, while 4-person families (574 | 17.6%) have the highest median income of $31,710 per family member.
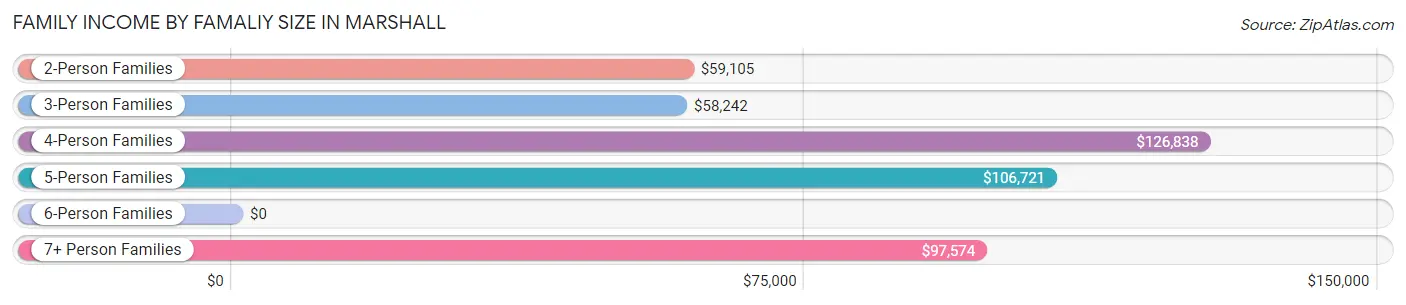
| Income Bracket | # Families | Median Income |
| 2-Person Families | 1,613 (49.3%) | $59,105 |
| 3-Person Families | 689 (21.1%) | $58,242 |
| 4-Person Families | 574 (17.6%) | $126,838 |
| 5-Person Families | 234 (7.2%) | $106,721 |
| 6-Person Families | 66 (2.0%) | $0 |
| 7+ Person Families | 93 (2.8%) | $97,574 |
| Total | 3,269 (100.0%) | $74,125 |
Family Income by Number of Earners in Marshall
The median family income in Marshall is $74,125, with families comprising 3+ earners (429) having the highest median family income of $118,708, while families with no earners (429) have the lowest median family income of $39,583, accounting for 13.1% and 13.1% of families, respectively.
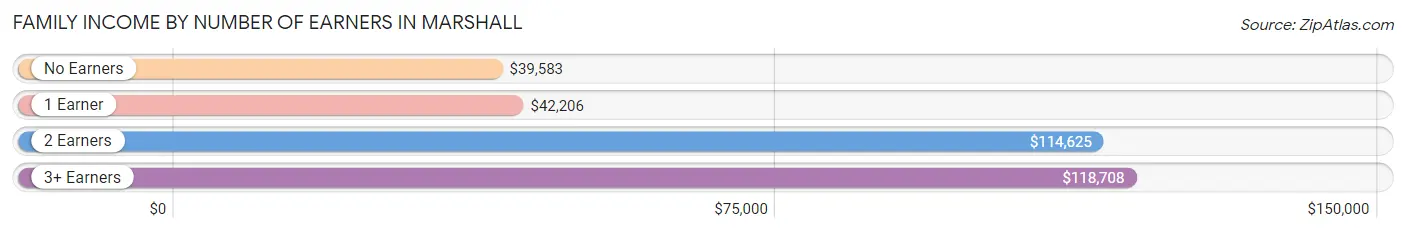
| Number of Earners | # Families | Median Income |
| No Earners | 429 (13.1%) | $39,583 |
| 1 Earner | 988 (30.2%) | $42,206 |
| 2 Earners | 1,423 (43.5%) | $114,625 |
| 3+ Earners | 429 (13.1%) | $118,708 |
| Total | 3,269 (100.0%) | $74,125 |
Household Income in Marshall
Household Income Brackets in Marshall
With 1,027 households falling in the category, the $50,000 to $74,999 income range is the most frequent in Marshall, accounting for 19.2% of all households. In contrast, only 284 households (5.3%) fall into the $200,000+ income bracket, making it the least populous group.
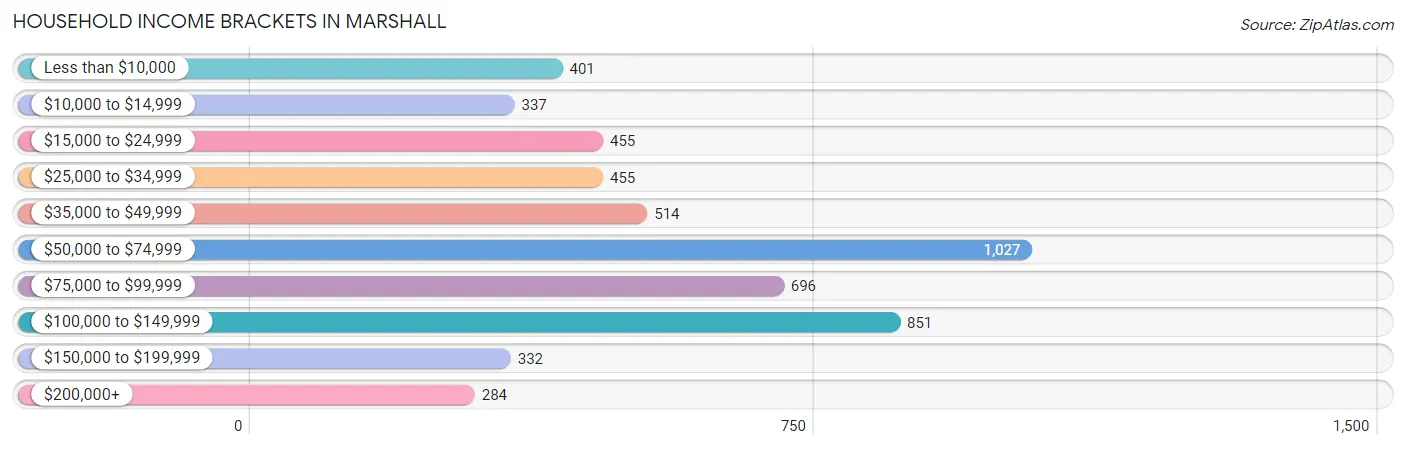
| Income Bracket | # Households | % Households |
| Less than $10,000 | 401 | 7.5% |
| $10,000 to $14,999 | 337 | 6.3% |
| $15,000 to $24,999 | 455 | 8.5% |
| $25,000 to $34,999 | 455 | 8.5% |
| $35,000 to $49,999 | 514 | 9.6% |
| $50,000 to $74,999 | 1,027 | 19.2% |
| $75,000 to $99,999 | 696 | 13.0% |
| $100,000 to $149,999 | 851 | 15.9% |
| $150,000 to $199,999 | 332 | 6.2% |
| $200,000+ | 284 | 5.3% |
Household Income by Householder Age in Marshall
The median household income in Marshall is $60,532, with the highest median household income of $90,455 found in the 45 to 64 years age bracket for the primary householder. A total of 1,596 households (29.8%) fall into this category. Meanwhile, the 15 to 24 years age bracket for the primary householder has the lowest median household income of $22,668, with 387 households (7.2%) in this group.
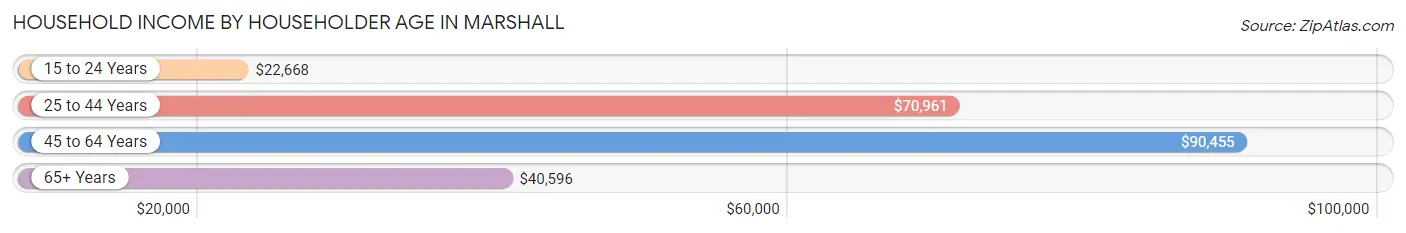
| Income Bracket | # Households | Median Income |
| 15 to 24 Years | 387 (7.2%) | $22,668 |
| 25 to 44 Years | 1,895 (35.4%) | $70,961 |
| 45 to 64 Years | 1,596 (29.8%) | $90,455 |
| 65+ Years | 1,473 (27.5%) | $40,596 |
| Total | 5,351 (100.0%) | $60,532 |
Poverty in Marshall
Income Below Poverty by Sex and Age in Marshall
With 12.0% poverty level for males and 20.5% for females among the residents of Marshall, 16 and 17 year old males and 18 to 24 year old females are the most vulnerable to poverty, with 55 males (26.2%) and 305 females (54.0%) in their respective age groups living below the poverty level.
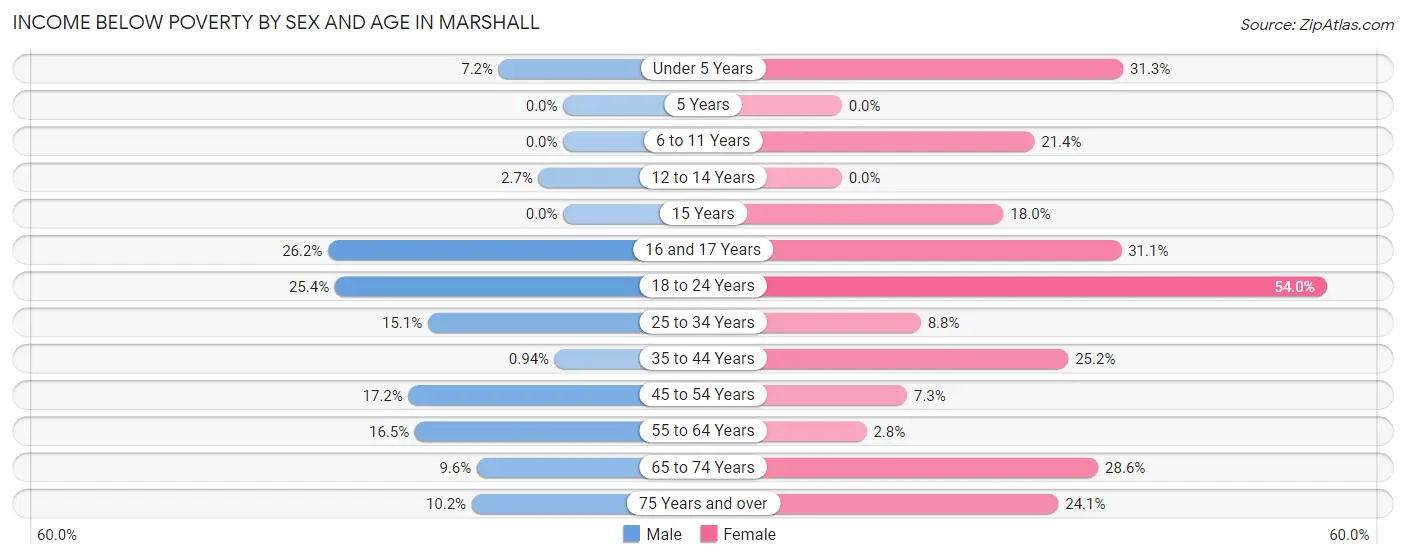
| Age Bracket | Male | Female |
| Under 5 Years | 25 (7.2%) | 203 (31.3%) |
| 5 Years | 0 (0.0%) | 0 (0.0%) |
| 6 to 11 Years | 0 (0.0%) | 119 (21.4%) |
| 12 to 14 Years | 8 (2.7%) | 0 (0.0%) |
| 15 Years | 0 (0.0%) | 9 (18.0%) |
| 16 and 17 Years | 55 (26.2%) | 89 (31.1%) |
| 18 to 24 Years | 148 (25.4%) | 305 (54.0%) |
| 25 to 34 Years | 151 (15.1%) | 59 (8.8%) |
| 35 to 44 Years | 6 (0.9%) | 199 (25.2%) |
| 45 to 54 Years | 126 (17.2%) | 48 (7.2%) |
| 55 to 64 Years | 125 (16.5%) | 24 (2.8%) |
| 65 to 74 Years | 49 (9.6%) | 175 (28.5%) |
| 75 Years and over | 40 (10.2%) | 156 (24.1%) |
| Total | 733 (12.0%) | 1,386 (20.5%) |
Income Above Poverty by Sex and Age in Marshall
According to the poverty statistics in Marshall, males aged 5 years and females aged 5 years are the age groups that are most secure financially, with 100.0% of males and 100.0% of females in these age groups living above the poverty line.
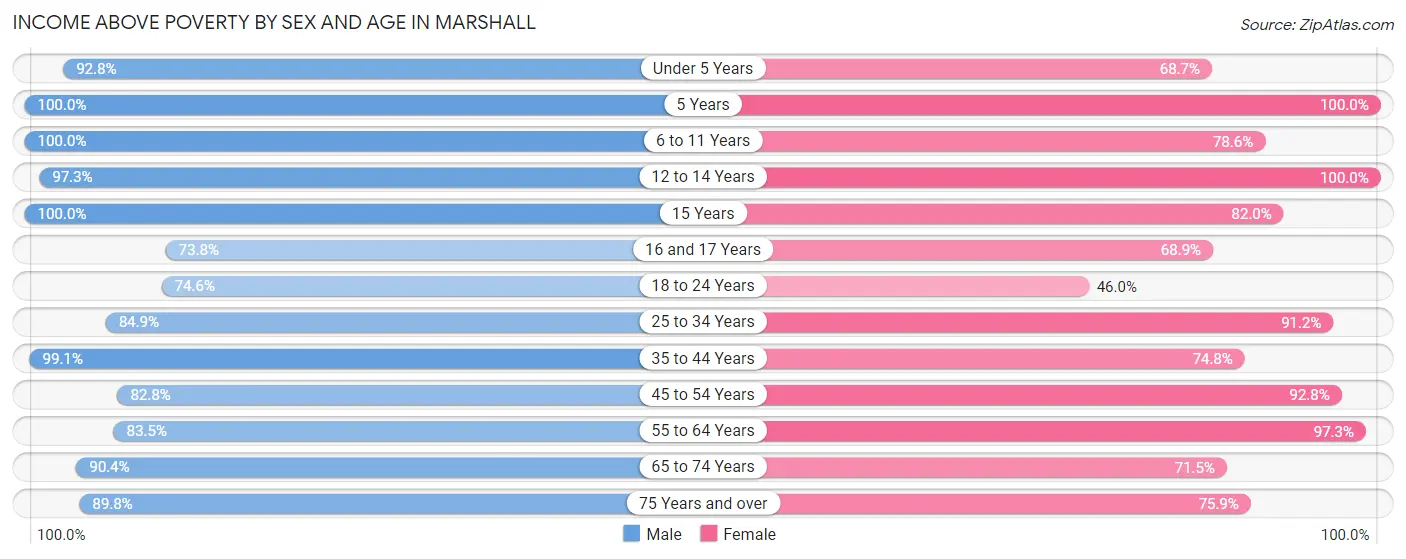
| Age Bracket | Male | Female |
| Under 5 Years | 323 (92.8%) | 445 (68.7%) |
| 5 Years | 91 (100.0%) | 14 (100.0%) |
| 6 to 11 Years | 536 (100.0%) | 436 (78.6%) |
| 12 to 14 Years | 284 (97.3%) | 398 (100.0%) |
| 15 Years | 25 (100.0%) | 41 (82.0%) |
| 16 and 17 Years | 155 (73.8%) | 197 (68.9%) |
| 18 to 24 Years | 434 (74.6%) | 260 (46.0%) |
| 25 to 34 Years | 851 (84.9%) | 612 (91.2%) |
| 35 to 44 Years | 632 (99.1%) | 590 (74.8%) |
| 45 to 54 Years | 605 (82.8%) | 614 (92.7%) |
| 55 to 64 Years | 632 (83.5%) | 848 (97.3%) |
| 65 to 74 Years | 461 (90.4%) | 438 (71.5%) |
| 75 Years and over | 353 (89.8%) | 491 (75.9%) |
| Total | 5,382 (88.0%) | 5,384 (79.5%) |
Income Below Poverty Among Married-Couple Families in Marshall
The poverty statistics for married-couple families in Marshall show that 5.8% or 138 of the total 2,370 families live below the poverty line. Families with 1 or 2 children have the highest poverty rate of 10.1%, comprising of 74 families. On the other hand, families with 5 or more children have the lowest poverty rate of 0.0%, which includes 0 families.
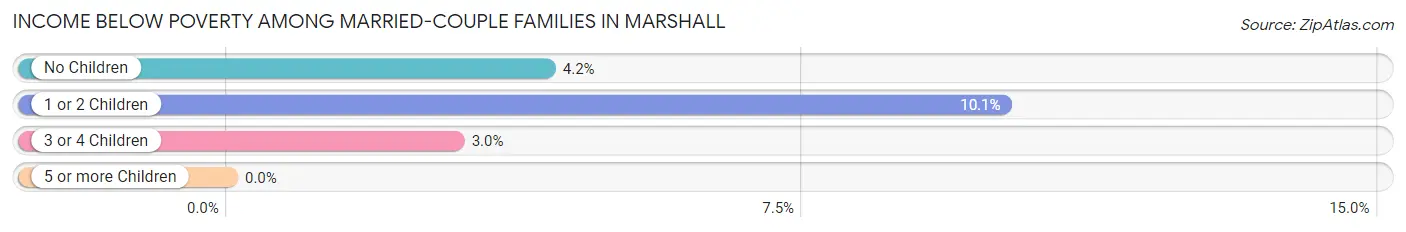
| Children | Above Poverty | Below Poverty |
| No Children | 1,295 (95.9%) | 56 (4.2%) |
| 1 or 2 Children | 658 (89.9%) | 74 (10.1%) |
| 3 or 4 Children | 262 (97.0%) | 8 (3.0%) |
| 5 or more Children | 17 (100.0%) | 0 (0.0%) |
| Total | 2,232 (94.2%) | 138 (5.8%) |
Income Below Poverty Among Single-Parent Households in Marshall
According to the poverty data in Marshall, 28.3% or 68 single-father households and 41.3% or 272 single-mother households are living below the poverty line. Among single-father households, those with 1 or 2 children have the highest poverty rate, with 37 households (60.7%) experiencing poverty. Likewise, among single-mother households, those with no children have the highest poverty rate, with 69 households (54.3%) falling below the poverty line.
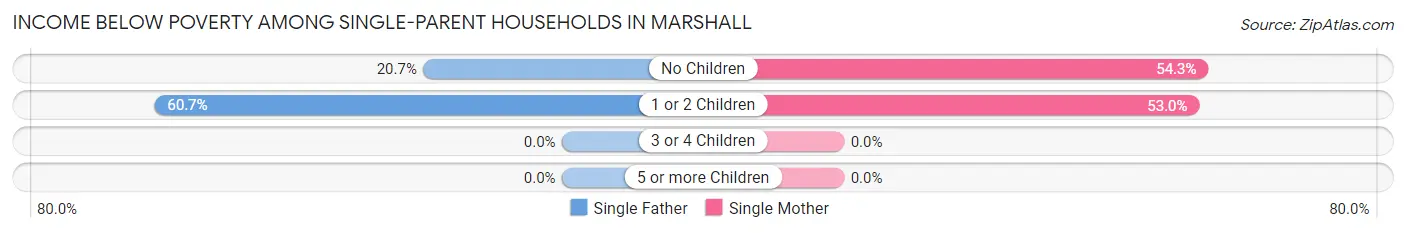
| Children | Single Father | Single Mother |
| No Children | 31 (20.7%) | 69 (54.3%) |
| 1 or 2 Children | 37 (60.7%) | 203 (53.0%) |
| 3 or 4 Children | 0 (0.0%) | 0 (0.0%) |
| 5 or more Children | 0 (0.0%) | 0 (0.0%) |
| Total | 68 (28.3%) | 272 (41.3%) |
Income Below Poverty Among Married-Couple vs Single-Parent Households in Marshall
The poverty data for Marshall shows that 138 of the married-couple family households (5.8%) and 340 of the single-parent households (37.8%) are living below the poverty level. Within the married-couple family households, those with 1 or 2 children have the highest poverty rate, with 74 households (10.1%) falling below the poverty line. Among the single-parent households, those with 1 or 2 children have the highest poverty rate, with 240 household (54.0%) living below poverty.
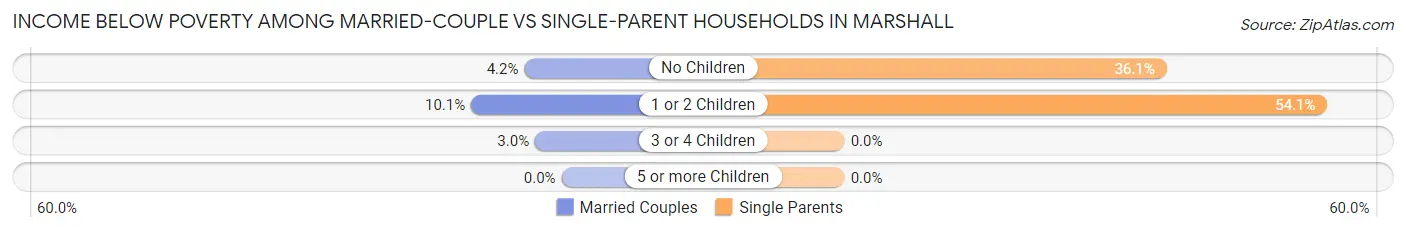
| Children | Married-Couple Families | Single-Parent Households |
| No Children | 56 (4.2%) | 100 (36.1%) |
| 1 or 2 Children | 74 (10.1%) | 240 (54.0%) |
| 3 or 4 Children | 8 (3.0%) | 0 (0.0%) |
| 5 or more Children | 0 (0.0%) | 0 (0.0%) |
| Total | 138 (5.8%) | 340 (37.8%) |
Employment Characteristics in Marshall
Employment by Class of Employer in Marshall
Among the 6,636 employed individuals in Marshall, private company employees (4,349 | 65.5%), not-for-profit organizations (849 | 12.8%), and local government employees (548 | 8.3%) make up the most common classes of employment.
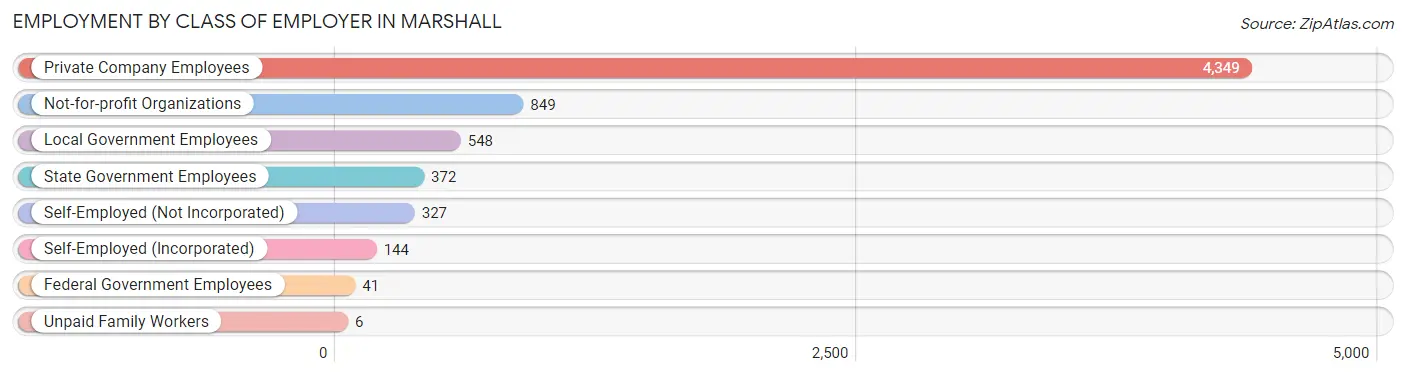
| Employer Class | # Employees | % Employees |
| Private Company Employees | 4,349 | 65.5% |
| Self-Employed (Incorporated) | 144 | 2.2% |
| Self-Employed (Not Incorporated) | 327 | 4.9% |
| Not-for-profit Organizations | 849 | 12.8% |
| Local Government Employees | 548 | 8.3% |
| State Government Employees | 372 | 5.6% |
| Federal Government Employees | 41 | 0.6% |
| Unpaid Family Workers | 6 | 0.1% |
| Total | 6,636 | 100.0% |
Employment Status by Age in Marshall
According to the labor force statistics for Marshall, out of the total population over 16 years of age (10,642), 64.9% or 6,907 individuals are in the labor force, with 3.1% or 214 of them unemployed. The age group with the highest labor force participation rate is 25 to 29 years, with 94.4% or 685 individuals in the labor force. Within the labor force, the 60 to 64 years age range has the highest percentage of unemployed individuals, with 13.7% or 68 of them being unemployed.
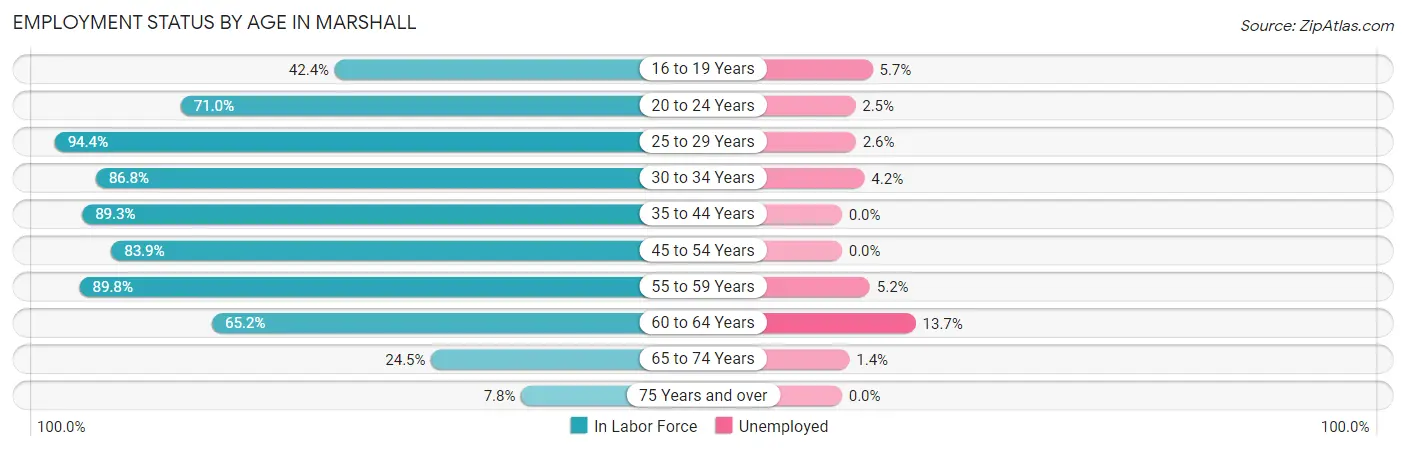
| Age Bracket | In Labor Force | Unemployed |
| 16 to 19 Years | 457 (42.4%) | 26 (5.7%) |
| 20 to 24 Years | 809 (71.0%) | 20 (2.5%) |
| 25 to 29 Years | 685 (94.4%) | 18 (2.6%) |
| 30 to 34 Years | 840 (86.8%) | 35 (4.2%) |
| 35 to 44 Years | 1,289 (89.3%) | 0 (0.0%) |
| 45 to 54 Years | 1,171 (83.9%) | 0 (0.0%) |
| 55 to 59 Years | 792 (89.8%) | 41 (5.2%) |
| 60 to 64 Years | 498 (65.2%) | 68 (13.7%) |
| 65 to 74 Years | 281 (24.5%) | 4 (1.4%) |
| 75 Years and over | 86 (7.8%) | 0 (0.0%) |
| Total | 6,907 (64.9%) | 214 (3.1%) |
Employment Status by Educational Attainment in Marshall
According to labor force statistics for Marshall, 85.4% of individuals (5,277) out of the total population between 25 and 64 years of age (6,179) are in the labor force, with 3.1% or 164 of them being unemployed. The group with the highest labor force participation rate are those with the educational attainment of bachelor's degree or higher, with 92.9% or 1,968 individuals in the labor force. Within the labor force, individuals with high school diploma education have the highest percentage of unemployment, with 5.9% or 46 of them being unemployed.
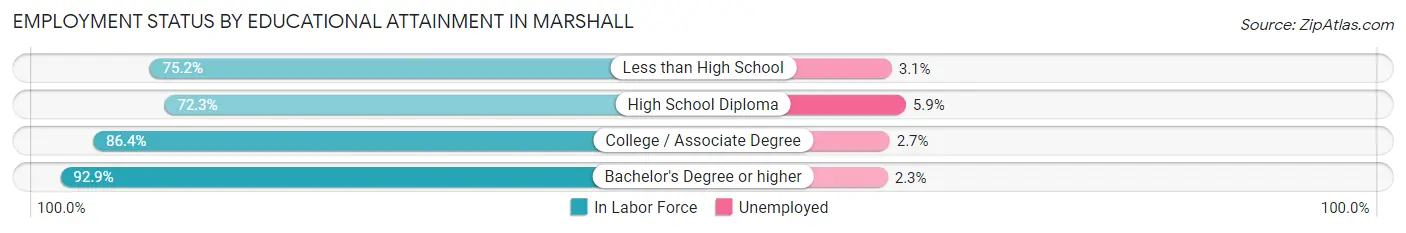
| Educational Attainment | In Labor Force | Unemployed |
| Less than High School | 354 (75.2%) | 15 (3.1%) |
| High School Diploma | 774 (72.3%) | 63 (5.9%) |
| College / Associate Degree | 2,177 (86.4%) | 68 (2.7%) |
| Bachelor's Degree or higher | 1,968 (92.9%) | 49 (2.3%) |
| Total | 5,277 (85.4%) | 192 (3.1%) |
Employment Occupations by Sex in Marshall
Management, Business, Science and Arts Occupations
The most common Management, Business, Science and Arts occupations in Marshall are Community & Social Service (694 | 10.4%), Management (551 | 8.2%), Education Instruction & Library (471 | 7.0%), Computers, Engineering & Science (438 | 6.5%), and Business & Financial (417 | 6.2%).
Management, Business, Science and Arts Occupations by Sex
Within the Management, Business, Science and Arts occupations in Marshall, the most male-oriented occupations are Legal Services & Support (100.0%), Computers & Mathematics (85.5%), and Life, Physical & Social Science (81.1%), while the most female-oriented occupations are Education, Arts & Media (100.0%), Health Technologists (93.9%), and Health Diagnosing & Treating (86.9%).
| Occupation | Male | Female |
| Management | 391 (71.0%) | 160 (29.0%) |
| Business & Financial | 130 (31.2%) | 287 (68.8%) |
| Computers, Engineering & Science | 353 (80.6%) | 85 (19.4%) |
| Computers & Mathematics | 183 (85.5%) | 31 (14.5%) |
| Architecture & Engineering | 127 (74.3%) | 44 (25.7%) |
| Life, Physical & Social Science | 43 (81.1%) | 10 (18.9%) |
| Community & Social Service | 191 (27.5%) | 503 (72.5%) |
| Education, Arts & Media | 0 (0.0%) | 76 (100.0%) |
| Legal Services & Support | 20 (100.0%) | 0 (0.0%) |
| Education Instruction & Library | 91 (19.3%) | 380 (80.7%) |
| Arts, Media & Entertainment | 80 (63.0%) | 47 (37.0%) |
| Health Diagnosing & Treating | 48 (13.1%) | 319 (86.9%) |
| Health Technologists | 11 (6.1%) | 170 (93.9%) |
| Total (Category) | 1,113 (45.1%) | 1,354 (54.9%) |
| Total (Overall) | 3,365 (50.3%) | 3,330 (49.7%) |
Services Occupations
The most common Services occupations in Marshall are Healthcare Support (430 | 6.4%), Cleaning & Maintenance (333 | 5.0%), Food Preparation & Serving (299 | 4.5%), Personal Care & Service (178 | 2.7%), and Security & Protection (81 | 1.2%).
Services Occupations by Sex
Within the Services occupations in Marshall, the most male-oriented occupations are Firefighting & Prevention (100.0%), Security & Protection (91.4%), and Law Enforcement (86.0%), while the most female-oriented occupations are Personal Care & Service (91.6%), Food Preparation & Serving (85.0%), and Healthcare Support (58.4%).
| Occupation | Male | Female |
| Healthcare Support | 179 (41.6%) | 251 (58.4%) |
| Security & Protection | 74 (91.4%) | 7 (8.6%) |
| Firefighting & Prevention | 31 (100.0%) | 0 (0.0%) |
| Law Enforcement | 43 (86.0%) | 7 (14.0%) |
| Food Preparation & Serving | 45 (15.0%) | 254 (85.0%) |
| Cleaning & Maintenance | 196 (58.9%) | 137 (41.1%) |
| Personal Care & Service | 15 (8.4%) | 163 (91.6%) |
| Total (Category) | 509 (38.5%) | 812 (61.5%) |
| Total (Overall) | 3,365 (50.3%) | 3,330 (49.7%) |
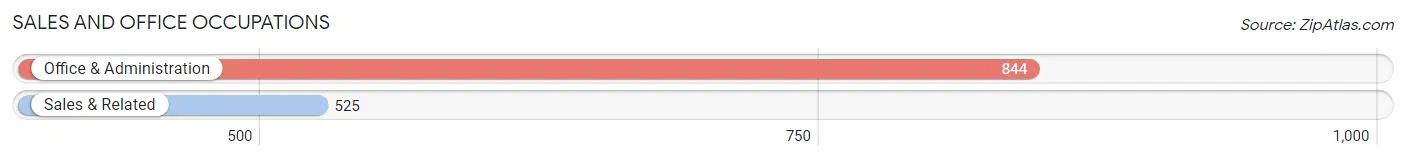
Sales and Office Occupations
The most common Sales and Office occupations in Marshall are Office & Administration (844 | 12.6%), and Sales & Related (525 | 7.8%).
Sales and Office Occupations by Sex
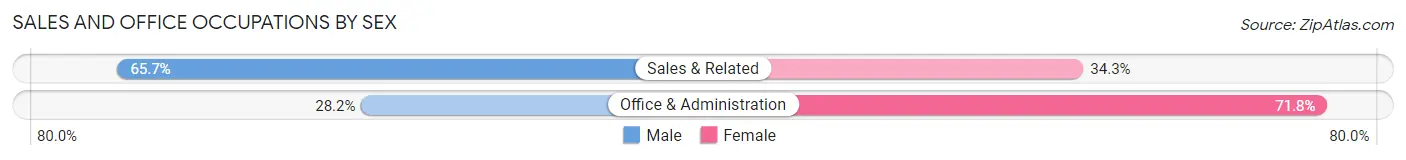
| Occupation | Male | Female |
| Sales & Related | 345 (65.7%) | 180 (34.3%) |
| Office & Administration | 238 (28.2%) | 606 (71.8%) |
| Total (Category) | 583 (42.6%) | 786 (57.4%) |
| Total (Overall) | 3,365 (50.3%) | 3,330 (49.7%) |
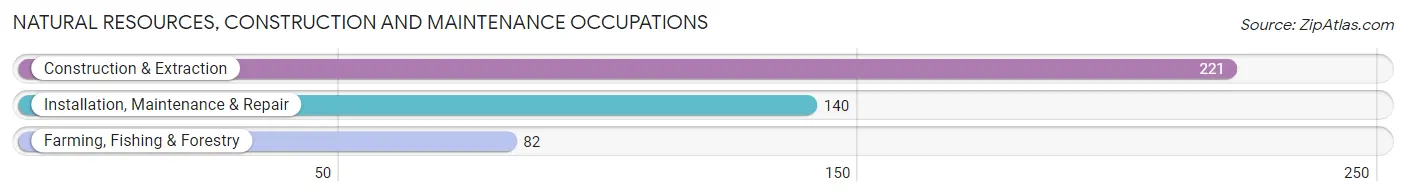
Natural Resources, Construction and Maintenance Occupations
The most common Natural Resources, Construction and Maintenance occupations in Marshall are Construction & Extraction (221 | 3.3%), Installation, Maintenance & Repair (140 | 2.1%), and Farming, Fishing & Forestry (82 | 1.2%).
Natural Resources, Construction and Maintenance Occupations by Sex
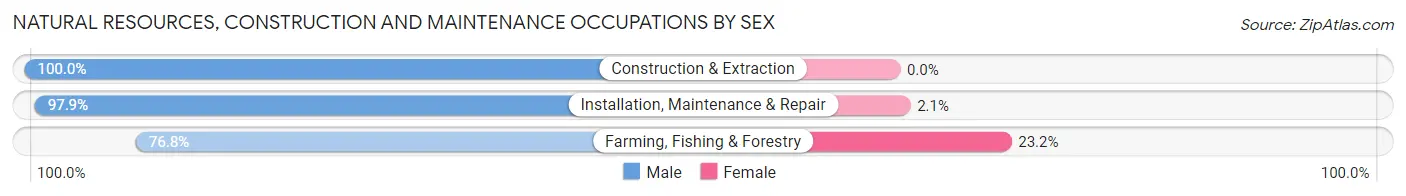
| Occupation | Male | Female |
| Farming, Fishing & Forestry | 63 (76.8%) | 19 (23.2%) |
| Construction & Extraction | 221 (100.0%) | 0 (0.0%) |
| Installation, Maintenance & Repair | 137 (97.9%) | 3 (2.1%) |
| Total (Category) | 421 (95.0%) | 22 (5.0%) |
| Total (Overall) | 3,365 (50.3%) | 3,330 (49.7%) |
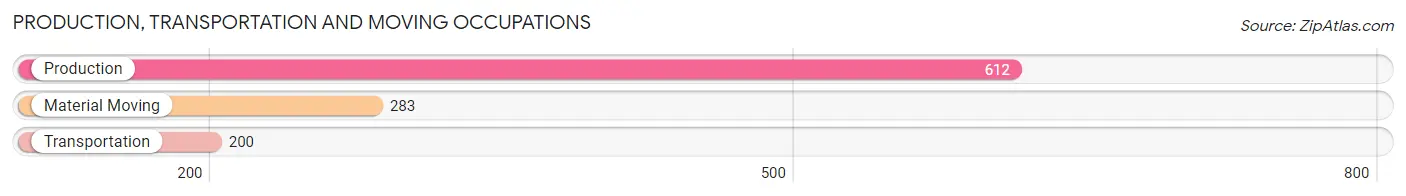
Production, Transportation and Moving Occupations
The most common Production, Transportation and Moving occupations in Marshall are Production (612 | 9.1%), Material Moving (283 | 4.2%), and Transportation (200 | 3.0%).
Production, Transportation and Moving Occupations by Sex
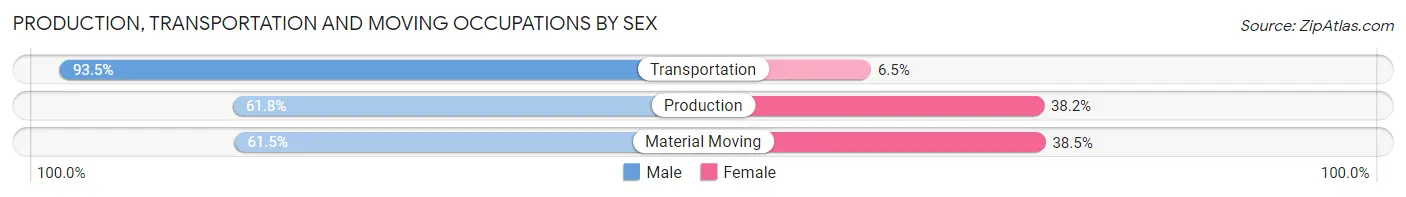
| Occupation | Male | Female |
| Production | 378 (61.8%) | 234 (38.2%) |
| Transportation | 187 (93.5%) | 13 (6.5%) |
| Material Moving | 174 (61.5%) | 109 (38.5%) |
| Total (Category) | 739 (67.5%) | 356 (32.5%) |
| Total (Overall) | 3,365 (50.3%) | 3,330 (49.7%) |
Employment Industries by Sex in Marshall
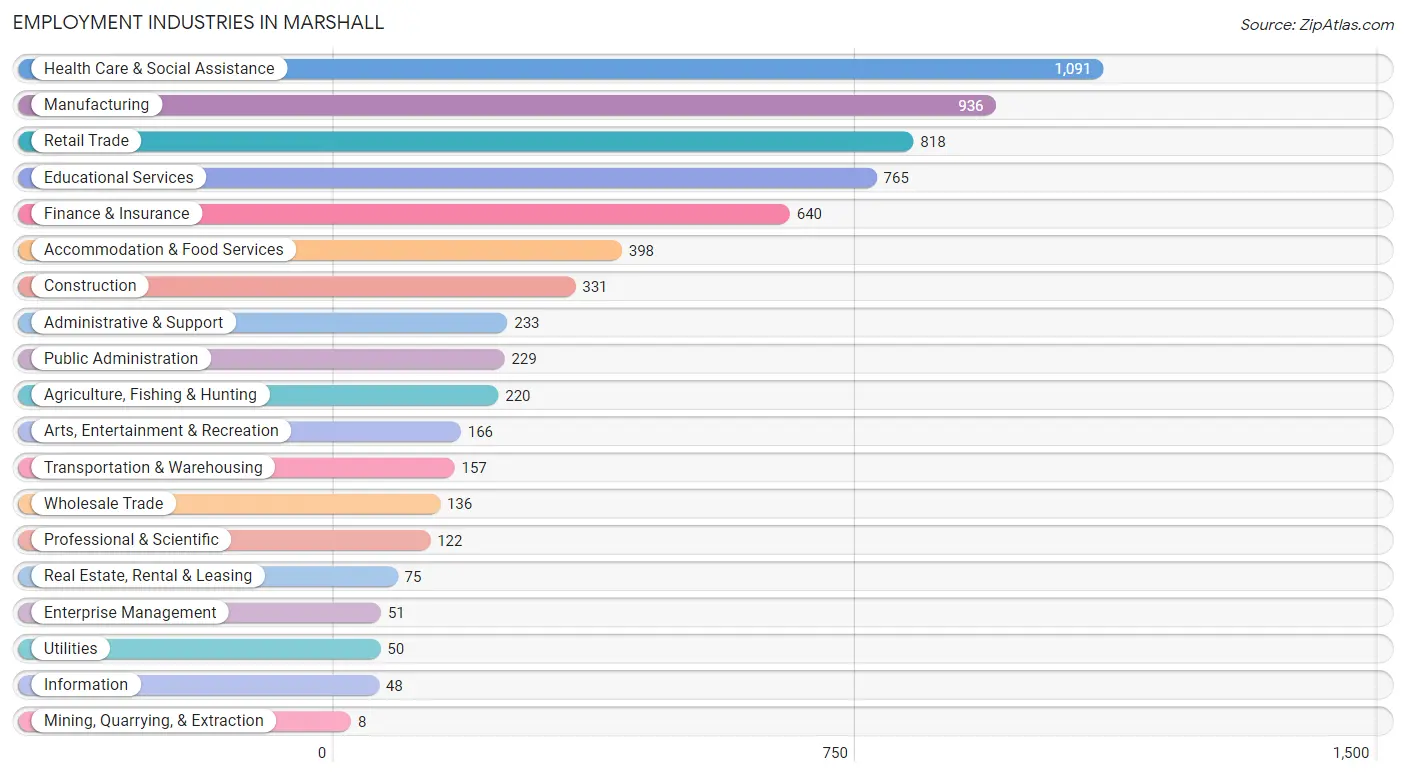
Employment Industries in Marshall
The major employment industries in Marshall include Health Care & Social Assistance (1,091 | 16.3%), Manufacturing (936 | 14.0%), Retail Trade (818 | 12.2%), Educational Services (765 | 11.4%), and Finance & Insurance (640 | 9.6%).
Employment Industries by Sex in Marshall
The Marshall industries that see more men than women are Mining, Quarrying, & Extraction (100.0%), Arts, Entertainment & Recreation (95.8%), and Construction (93.7%), whereas the industries that tend to have a higher number of women are Enterprise Management (100.0%), Health Care & Social Assistance (80.8%), and Educational Services (75.7%).
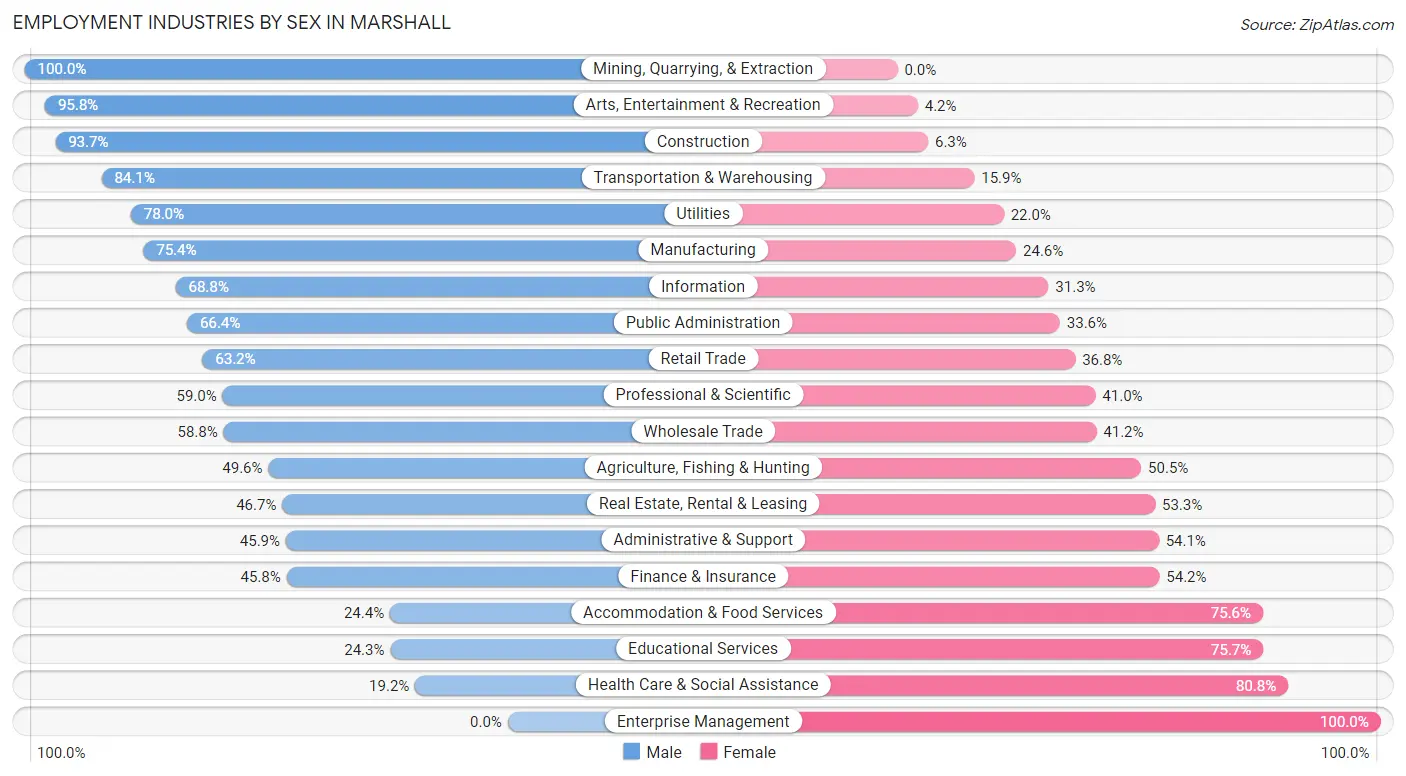
| Industry | Male | Female |
| Agriculture, Fishing & Hunting | 109 (49.5%) | 111 (50.4%) |
| Mining, Quarrying, & Extraction | 8 (100.0%) | 0 (0.0%) |
| Construction | 310 (93.7%) | 21 (6.3%) |
| Manufacturing | 706 (75.4%) | 230 (24.6%) |
| Wholesale Trade | 80 (58.8%) | 56 (41.2%) |
| Retail Trade | 517 (63.2%) | 301 (36.8%) |
| Transportation & Warehousing | 132 (84.1%) | 25 (15.9%) |
| Utilities | 39 (78.0%) | 11 (22.0%) |
| Information | 33 (68.8%) | 15 (31.2%) |
| Finance & Insurance | 293 (45.8%) | 347 (54.2%) |
| Real Estate, Rental & Leasing | 35 (46.7%) | 40 (53.3%) |
| Professional & Scientific | 72 (59.0%) | 50 (41.0%) |
| Enterprise Management | 0 (0.0%) | 51 (100.0%) |
| Administrative & Support | 107 (45.9%) | 126 (54.1%) |
| Educational Services | 186 (24.3%) | 579 (75.7%) |
| Health Care & Social Assistance | 209 (19.2%) | 882 (80.8%) |
| Arts, Entertainment & Recreation | 159 (95.8%) | 7 (4.2%) |
| Accommodation & Food Services | 97 (24.4%) | 301 (75.6%) |
| Public Administration | 152 (66.4%) | 77 (33.6%) |
| Total | 3,365 (50.3%) | 3,330 (49.7%) |
Education in Marshall
School Enrollment in Marshall
The most common levels of schooling among the 4,210 students in Marshall are high school (1,084 | 25.8%), college / undergraduate (1,081 | 25.7%), and middle school (776 | 18.4%).
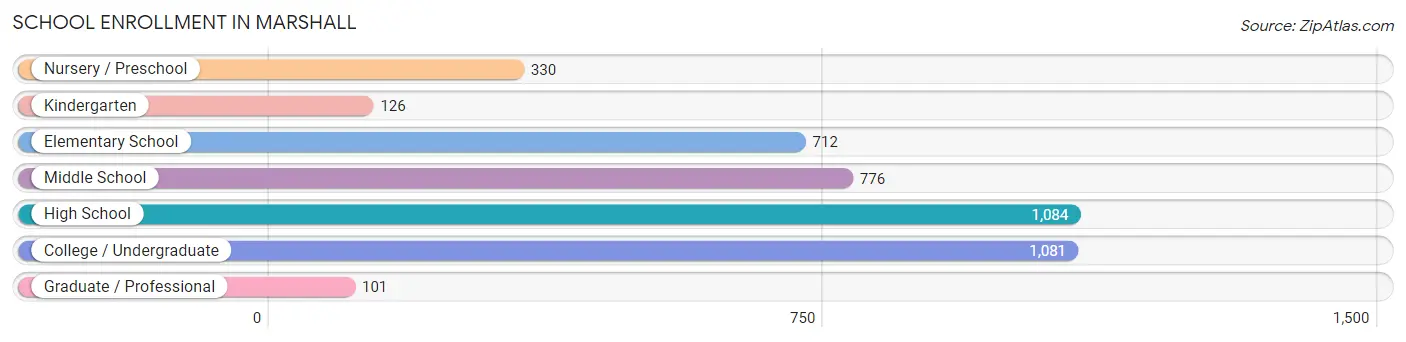
| School Level | # Students | % Students |
| Nursery / Preschool | 330 | 7.8% |
| Kindergarten | 126 | 3.0% |
| Elementary School | 712 | 16.9% |
| Middle School | 776 | 18.4% |
| High School | 1,084 | 25.8% |
| College / Undergraduate | 1,081 | 25.7% |
| Graduate / Professional | 101 | 2.4% |
| Total | 4,210 | 100.0% |
School Enrollment by Age by Funding Source in Marshall
Out of a total of 4,210 students who are enrolled in schools in Marshall, 467 (11.1%) attend a private institution, while the remaining 3,743 (88.9%) are enrolled in public schools. The age group of 3 to 4 year olds has the highest likelihood of being enrolled in private schools, with 123 (38.8% in the age bracket) enrolled. Conversely, the age group of 15 to 17 year olds has the lowest likelihood of being enrolled in a private school, with 575 (100.0% in the age bracket) attending a public institution.
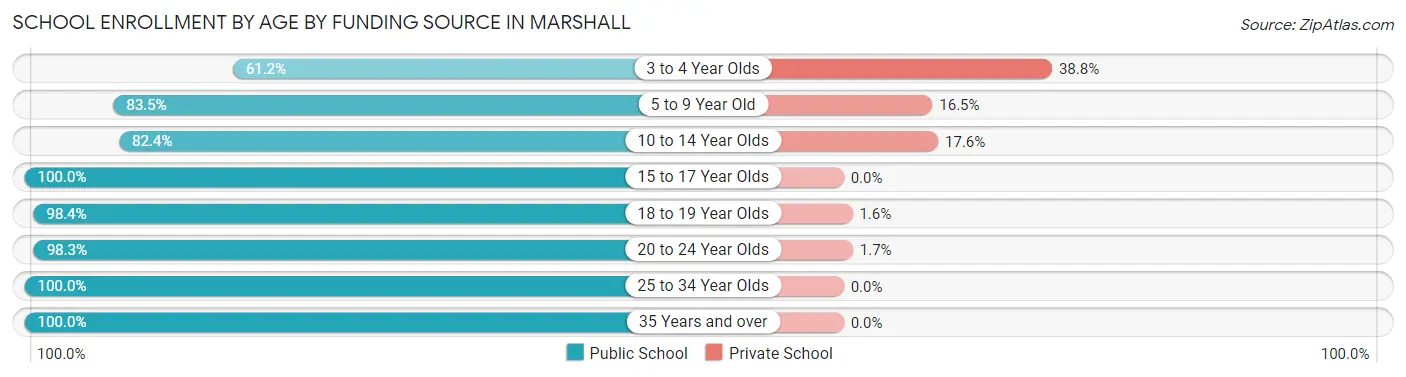
| Age Bracket | Public School | Private School |
| 3 to 4 Year Olds | 194 (61.2%) | 123 (38.8%) |
| 5 to 9 Year Old | 657 (83.5%) | 130 (16.5%) |
| 10 to 14 Year Olds | 909 (82.4%) | 194 (17.6%) |
| 15 to 17 Year Olds | 575 (100.0%) | 0 (0.0%) |
| 18 to 19 Year Olds | 541 (98.4%) | 9 (1.6%) |
| 20 to 24 Year Olds | 633 (98.3%) | 11 (1.7%) |
| 25 to 34 Year Olds | 171 (100.0%) | 0 (0.0%) |
| 35 Years and over | 63 (100.0%) | 0 (0.0%) |
| Total | 3,743 (88.9%) | 467 (11.1%) |
Educational Attainment by Field of Study in Marshall
Education (601 | 21.8%), business (499 | 18.1%), bio, nature & agricultural (240 | 8.7%), science & technology (182 | 6.6%), and psychology (178 | 6.5%) are the most common fields of study among 2,761 individuals in Marshall who have obtained a bachelor's degree or higher.
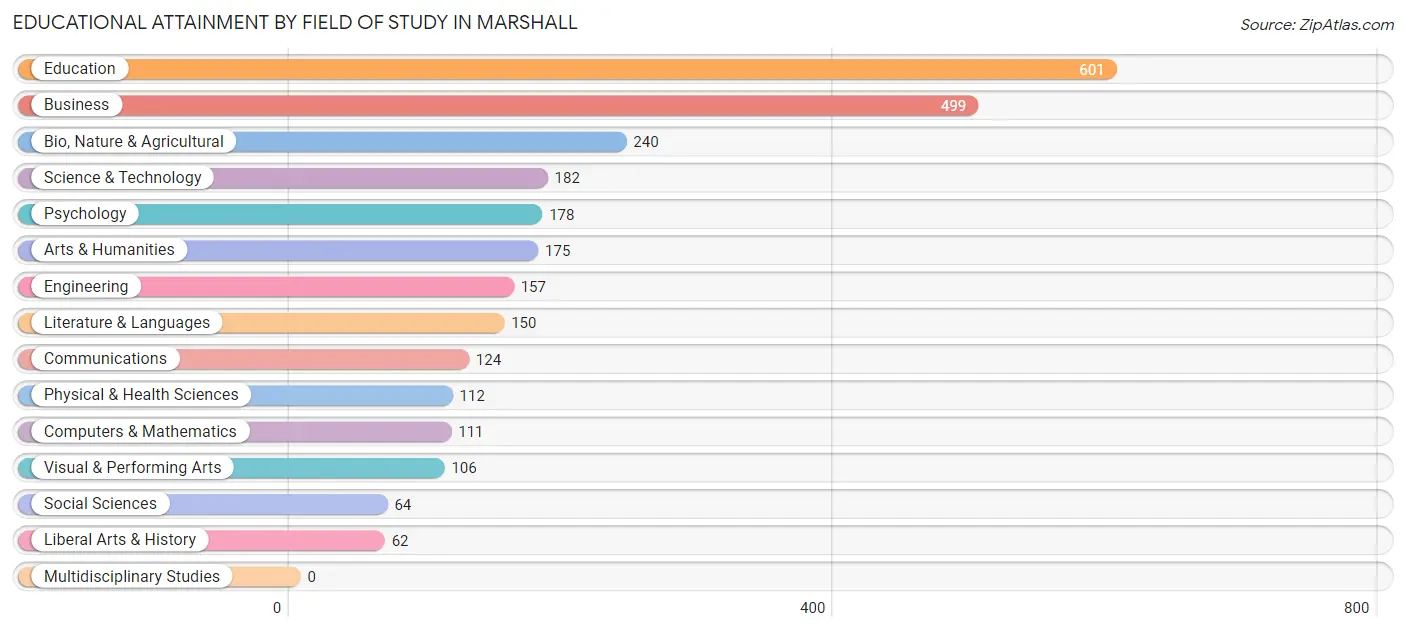
| Field of Study | # Graduates | % Graduates |
| Computers & Mathematics | 111 | 4.0% |
| Bio, Nature & Agricultural | 240 | 8.7% |
| Physical & Health Sciences | 112 | 4.1% |
| Psychology | 178 | 6.5% |
| Social Sciences | 64 | 2.3% |
| Engineering | 157 | 5.7% |
| Multidisciplinary Studies | 0 | 0.0% |
| Science & Technology | 182 | 6.6% |
| Business | 499 | 18.1% |
| Education | 601 | 21.8% |
| Literature & Languages | 150 | 5.4% |
| Liberal Arts & History | 62 | 2.2% |
| Visual & Performing Arts | 106 | 3.8% |
| Communications | 124 | 4.5% |
| Arts & Humanities | 175 | 6.3% |
| Total | 2,761 | 100.0% |
Transportation & Commute in Marshall
Vehicle Availability by Sex in Marshall
The most prevalent vehicle ownership categories in Marshall are males with 2 vehicles (1,357, accounting for 42.0%) and females with 2 vehicles (1,257, making up 45.0%).
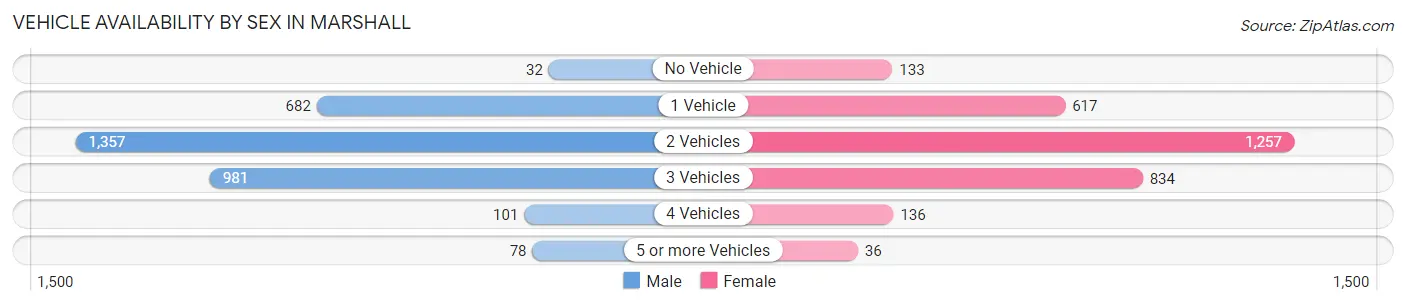
| Vehicles Available | Male | Female |
| No Vehicle | 32 (1.0%) | 133 (4.4%) |
| 1 Vehicle | 682 (21.1%) | 617 (20.5%) |
| 2 Vehicles | 1,357 (42.0%) | 1,257 (41.7%) |
| 3 Vehicles | 981 (30.4%) | 834 (27.7%) |
| 4 Vehicles | 101 (3.1%) | 136 (4.5%) |
| 5 or more Vehicles | 78 (2.4%) | 36 (1.2%) |
| Total | 3,231 (100.0%) | 3,013 (100.0%) |
Commute Time in Marshall
The most frequently occuring commute durations in Marshall are 5 to 9 minutes (2,810 commuters, 45.9%), 10 to 14 minutes (1,156 commuters, 18.9%), and less than 5 minutes (911 commuters, 14.9%).
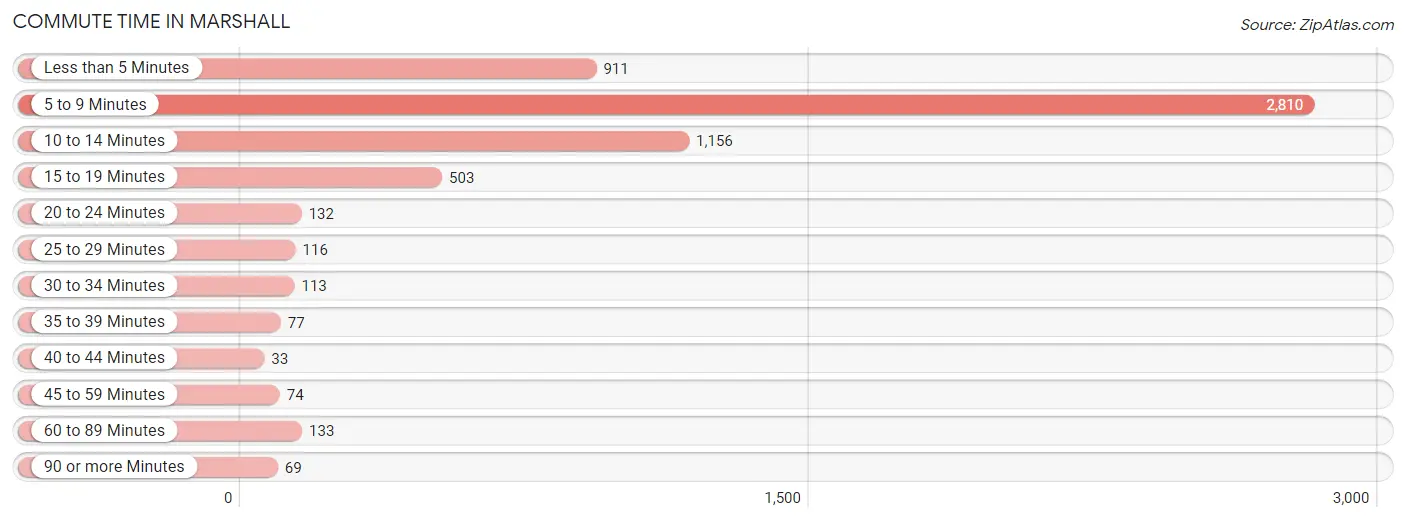
| Commute Time | # Commuters | % Commuters |
| Less than 5 Minutes | 911 | 14.9% |
| 5 to 9 Minutes | 2,810 | 45.9% |
| 10 to 14 Minutes | 1,156 | 18.9% |
| 15 to 19 Minutes | 503 | 8.2% |
| 20 to 24 Minutes | 132 | 2.1% |
| 25 to 29 Minutes | 116 | 1.9% |
| 30 to 34 Minutes | 113 | 1.8% |
| 35 to 39 Minutes | 77 | 1.3% |
| 40 to 44 Minutes | 33 | 0.5% |
| 45 to 59 Minutes | 74 | 1.2% |
| 60 to 89 Minutes | 133 | 2.2% |
| 90 or more Minutes | 69 | 1.1% |
Commute Time by Sex in Marshall
The most common commute times in Marshall are 5 to 9 minutes (1,463 commuters, 46.7%) for males and 5 to 9 minutes (1,347 commuters, 45.0%) for females.
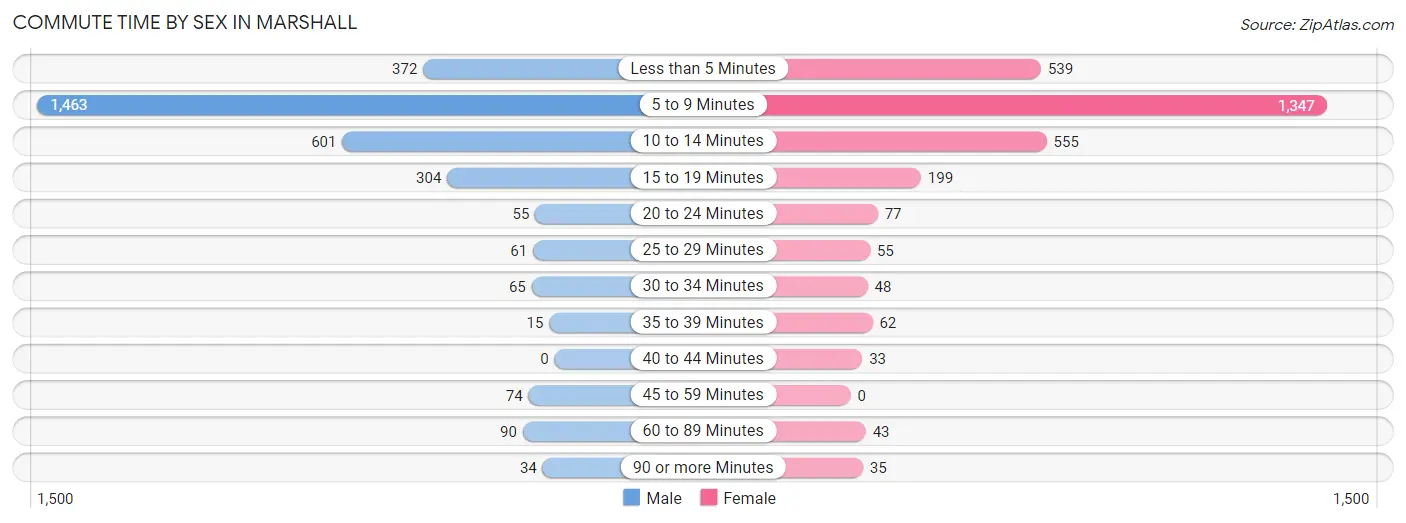
| Commute Time | Male | Female |
| Less than 5 Minutes | 372 (11.9%) | 539 (18.0%) |
| 5 to 9 Minutes | 1,463 (46.7%) | 1,347 (45.0%) |
| 10 to 14 Minutes | 601 (19.2%) | 555 (18.5%) |
| 15 to 19 Minutes | 304 (9.7%) | 199 (6.7%) |
| 20 to 24 Minutes | 55 (1.8%) | 77 (2.6%) |
| 25 to 29 Minutes | 61 (1.9%) | 55 (1.8%) |
| 30 to 34 Minutes | 65 (2.1%) | 48 (1.6%) |
| 35 to 39 Minutes | 15 (0.5%) | 62 (2.1%) |
| 40 to 44 Minutes | 0 (0.0%) | 33 (1.1%) |
| 45 to 59 Minutes | 74 (2.4%) | 0 (0.0%) |
| 60 to 89 Minutes | 90 (2.9%) | 43 (1.4%) |
| 90 or more Minutes | 34 (1.1%) | 35 (1.2%) |
Time of Departure to Work by Sex in Marshall
The most frequent times of departure to work in Marshall are 7:30 AM to 7:59 AM (667, 21.3%) for males and 7:30 AM to 7:59 AM (726, 24.3%) for females.
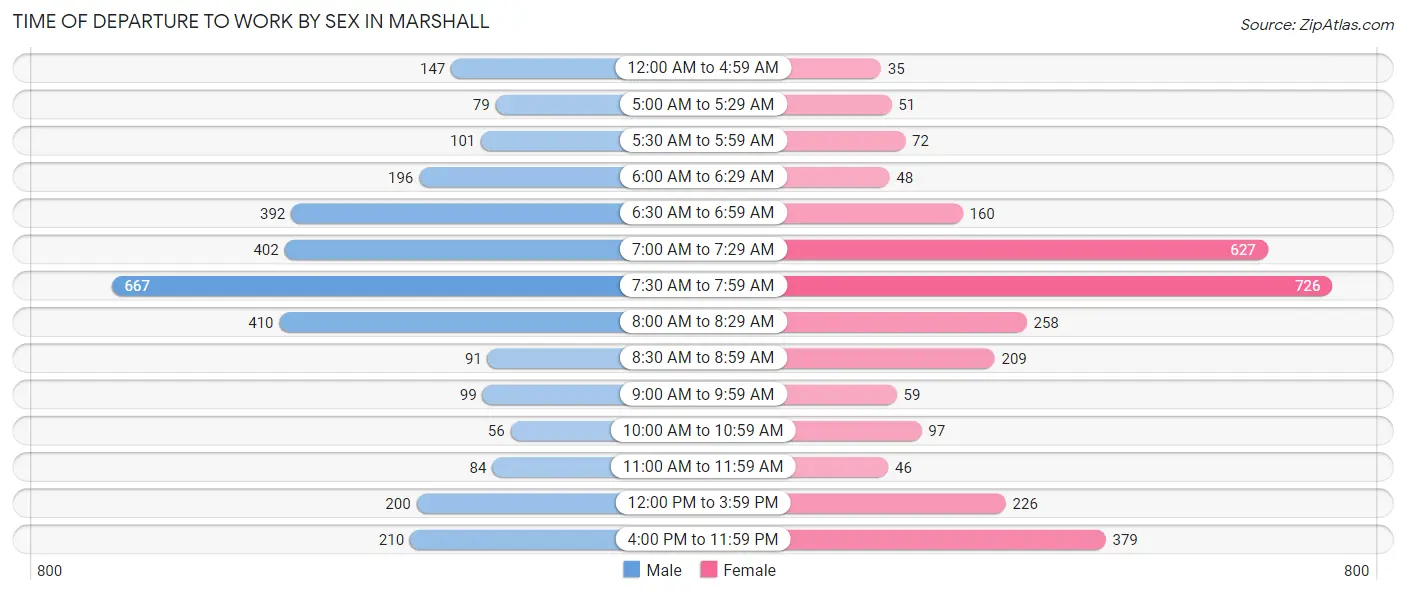
| Time of Departure | Male | Female |
| 12:00 AM to 4:59 AM | 147 (4.7%) | 35 (1.2%) |
| 5:00 AM to 5:29 AM | 79 (2.5%) | 51 (1.7%) |
| 5:30 AM to 5:59 AM | 101 (3.2%) | 72 (2.4%) |
| 6:00 AM to 6:29 AM | 196 (6.2%) | 48 (1.6%) |
| 6:30 AM to 6:59 AM | 392 (12.5%) | 160 (5.3%) |
| 7:00 AM to 7:29 AM | 402 (12.8%) | 627 (20.9%) |
| 7:30 AM to 7:59 AM | 667 (21.3%) | 726 (24.3%) |
| 8:00 AM to 8:29 AM | 410 (13.1%) | 258 (8.6%) |
| 8:30 AM to 8:59 AM | 91 (2.9%) | 209 (7.0%) |
| 9:00 AM to 9:59 AM | 99 (3.2%) | 59 (2.0%) |
| 10:00 AM to 10:59 AM | 56 (1.8%) | 97 (3.2%) |
| 11:00 AM to 11:59 AM | 84 (2.7%) | 46 (1.5%) |
| 12:00 PM to 3:59 PM | 200 (6.4%) | 226 (7.5%) |
| 4:00 PM to 11:59 PM | 210 (6.7%) | 379 (12.7%) |
| Total | 3,134 (100.0%) | 2,993 (100.0%) |
Housing Occupancy in Marshall
Occupancy by Ownership in Marshall
Of the total 5,351 dwellings in Marshall, owner-occupied units account for 3,133 (58.6%), while renter-occupied units make up 2,218 (41.4%).
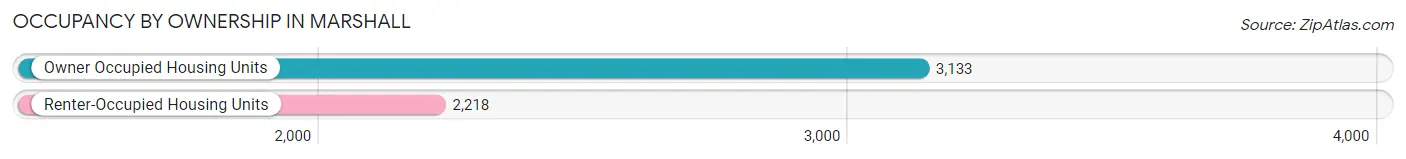
| Occupancy | # Housing Units | % Housing Units |
| Owner Occupied Housing Units | 3,133 | 58.6% |
| Renter-Occupied Housing Units | 2,218 | 41.4% |
| Total Occupied Housing Units | 5,351 | 100.0% |
Occupancy by Household Size in Marshall
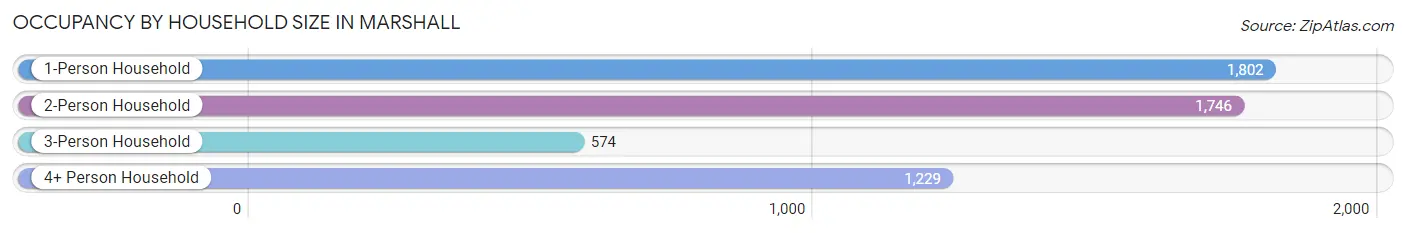
| Household Size | # Housing Units | % Housing Units |
| 1-Person Household | 1,802 | 33.7% |
| 2-Person Household | 1,746 | 32.6% |
| 3-Person Household | 574 | 10.7% |
| 4+ Person Household | 1,229 | 23.0% |
| Total Housing Units | 5,351 | 100.0% |
Occupancy by Ownership by Household Size in Marshall
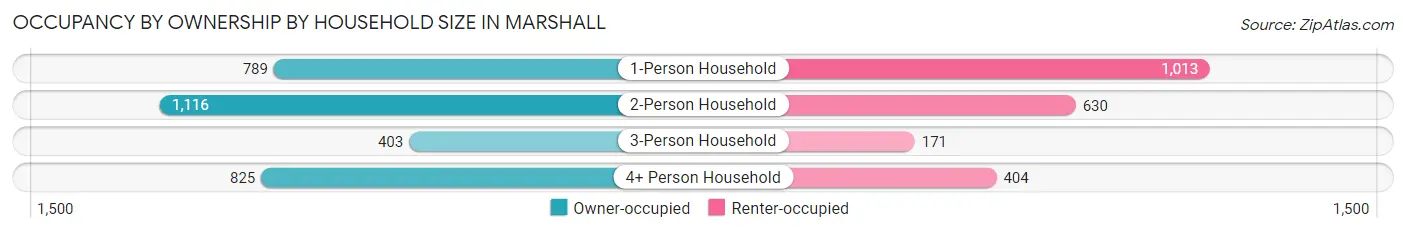
| Household Size | Owner-occupied | Renter-occupied |
| 1-Person Household | 789 (43.8%) | 1,013 (56.2%) |
| 2-Person Household | 1,116 (63.9%) | 630 (36.1%) |
| 3-Person Household | 403 (70.2%) | 171 (29.8%) |
| 4+ Person Household | 825 (67.1%) | 404 (32.9%) |
| Total Housing Units | 3,133 (58.6%) | 2,218 (41.4%) |
Occupancy by Educational Attainment in Marshall
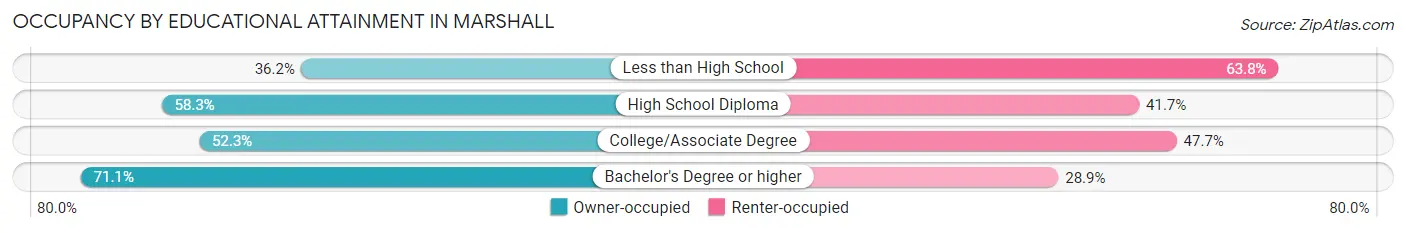
| Household Size | Owner-occupied | Renter-occupied |
| Less than High School | 122 (36.2%) | 215 (63.8%) |
| High School Diploma | 752 (58.3%) | 538 (41.7%) |
| College/Associate Degree | 1,085 (52.3%) | 988 (47.7%) |
| Bachelor's Degree or higher | 1,174 (71.1%) | 477 (28.9%) |
Occupancy by Age of Householder in Marshall
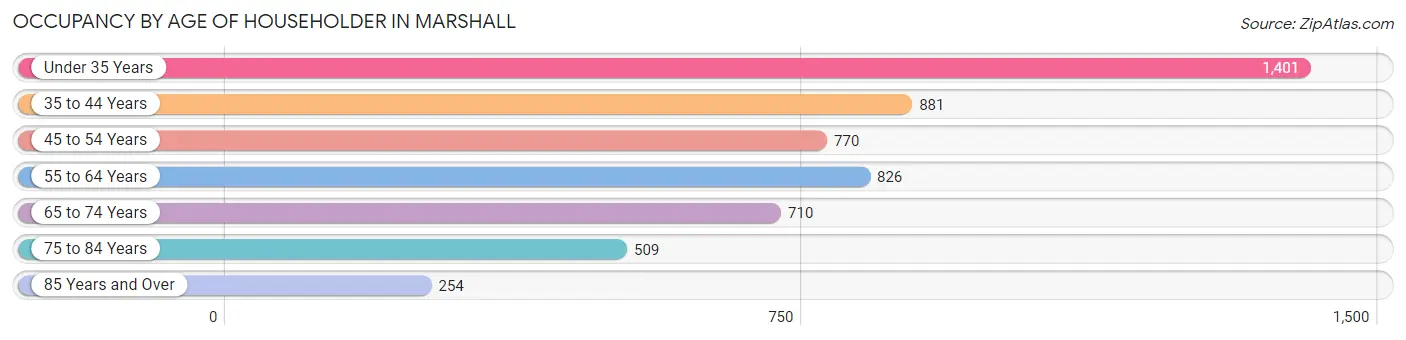
| Age Bracket | # Households | % Households |
| Under 35 Years | 1,401 | 26.2% |
| 35 to 44 Years | 881 | 16.5% |
| 45 to 54 Years | 770 | 14.4% |
| 55 to 64 Years | 826 | 15.4% |
| 65 to 74 Years | 710 | 13.3% |
| 75 to 84 Years | 509 | 9.5% |
| 85 Years and Over | 254 | 4.8% |
| Total | 5,351 | 100.0% |
Housing Finances in Marshall
Median Income by Occupancy in Marshall
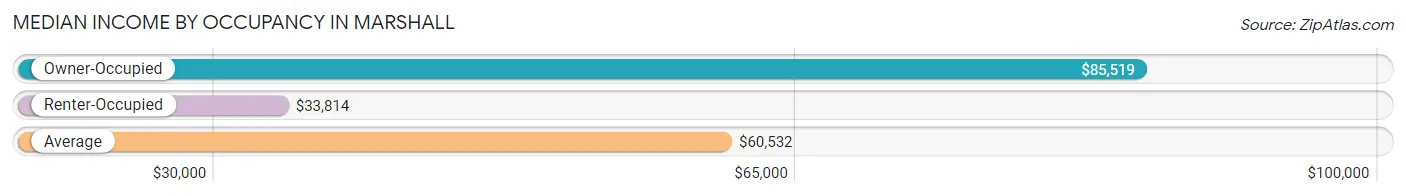
| Occupancy Type | # Households | Median Income |
| Owner-Occupied | 3,133 (58.6%) | $85,519 |
| Renter-Occupied | 2,218 (41.4%) | $33,814 |
| Average | 5,351 (100.0%) | $60,532 |
Occupancy by Householder Income Bracket in Marshall
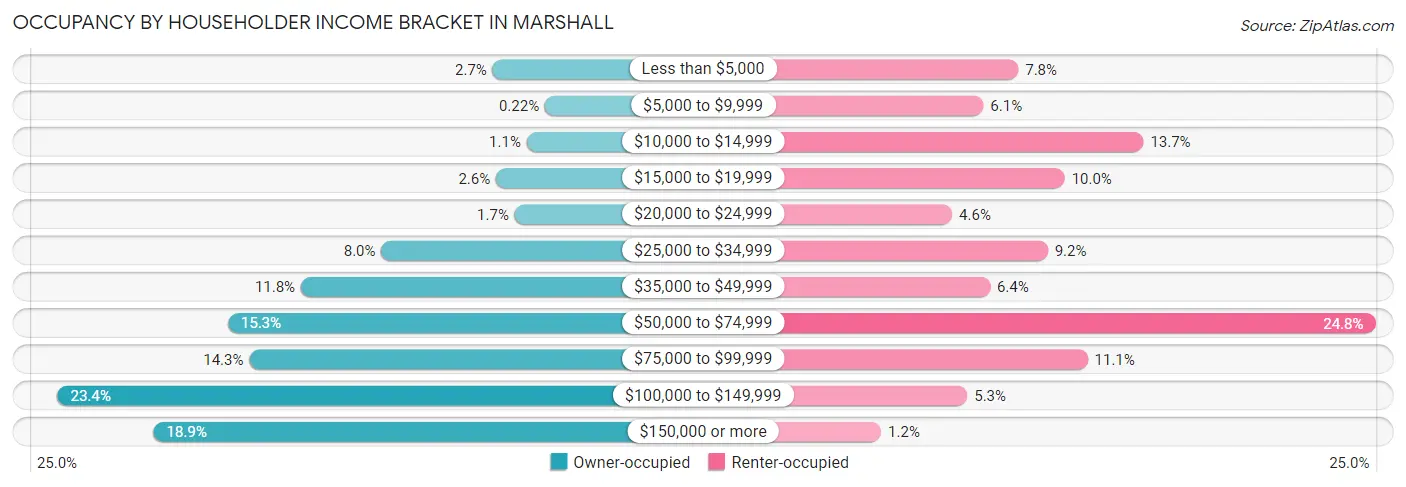
| Income Bracket | Owner-occupied | Renter-occupied |
| Less than $5,000 | 85 (2.7%) | 172 (7.7%) |
| $5,000 to $9,999 | 7 (0.2%) | 135 (6.1%) |
| $10,000 to $14,999 | 34 (1.1%) | 304 (13.7%) |
| $15,000 to $19,999 | 80 (2.5%) | 221 (10.0%) |
| $20,000 to $24,999 | 52 (1.7%) | 102 (4.6%) |
| $25,000 to $34,999 | 251 (8.0%) | 203 (9.1%) |
| $35,000 to $49,999 | 371 (11.8%) | 142 (6.4%) |
| $50,000 to $74,999 | 480 (15.3%) | 549 (24.7%) |
| $75,000 to $99,999 | 448 (14.3%) | 245 (11.1%) |
| $100,000 to $149,999 | 734 (23.4%) | 118 (5.3%) |
| $150,000 or more | 591 (18.9%) | 27 (1.2%) |
| Total | 3,133 (100.0%) | 2,218 (100.0%) |
Monthly Housing Cost Tiers in Marshall
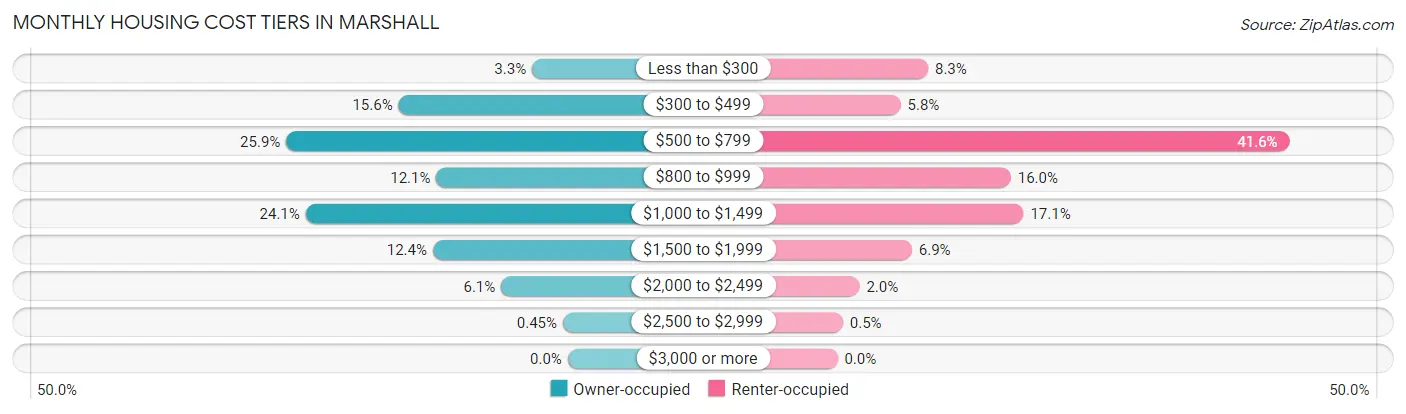
| Monthly Cost | Owner-occupied | Renter-occupied |
| Less than $300 | 103 (3.3%) | 185 (8.3%) |
| $300 to $499 | 488 (15.6%) | 129 (5.8%) |
| $500 to $799 | 812 (25.9%) | 923 (41.6%) |
| $800 to $999 | 379 (12.1%) | 354 (16.0%) |
| $1,000 to $1,499 | 756 (24.1%) | 380 (17.1%) |
| $1,500 to $1,999 | 389 (12.4%) | 152 (6.9%) |
| $2,000 to $2,499 | 192 (6.1%) | 45 (2.0%) |
| $2,500 to $2,999 | 14 (0.4%) | 11 (0.5%) |
| $3,000 or more | 0 (0.0%) | 0 (0.0%) |
| Total | 3,133 (100.0%) | 2,218 (100.0%) |
Physical Housing Characteristics in Marshall
Housing Structures in Marshall
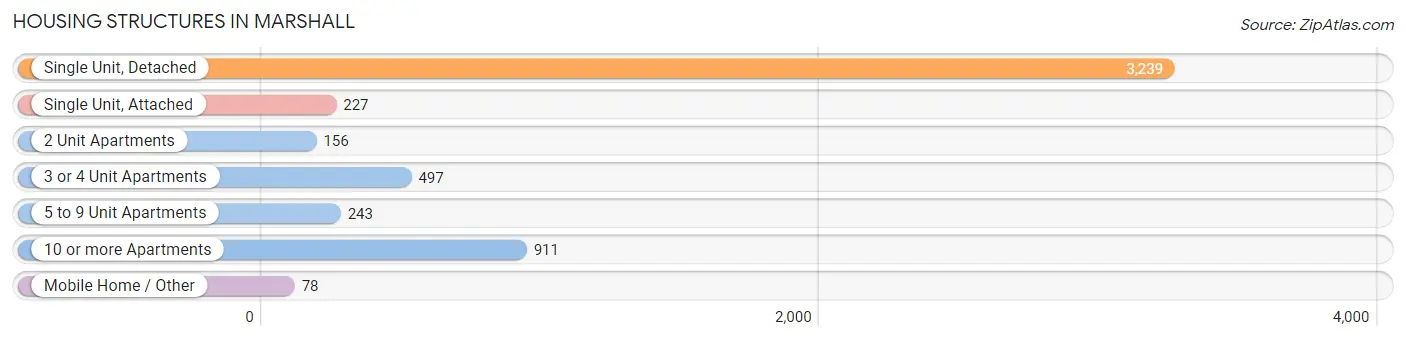
| Structure Type | # Housing Units | % Housing Units |
| Single Unit, Detached | 3,239 | 60.5% |
| Single Unit, Attached | 227 | 4.2% |
| 2 Unit Apartments | 156 | 2.9% |
| 3 or 4 Unit Apartments | 497 | 9.3% |
| 5 to 9 Unit Apartments | 243 | 4.5% |
| 10 or more Apartments | 911 | 17.0% |
| Mobile Home / Other | 78 | 1.5% |
| Total | 5,351 | 100.0% |
Housing Structures by Occupancy in Marshall
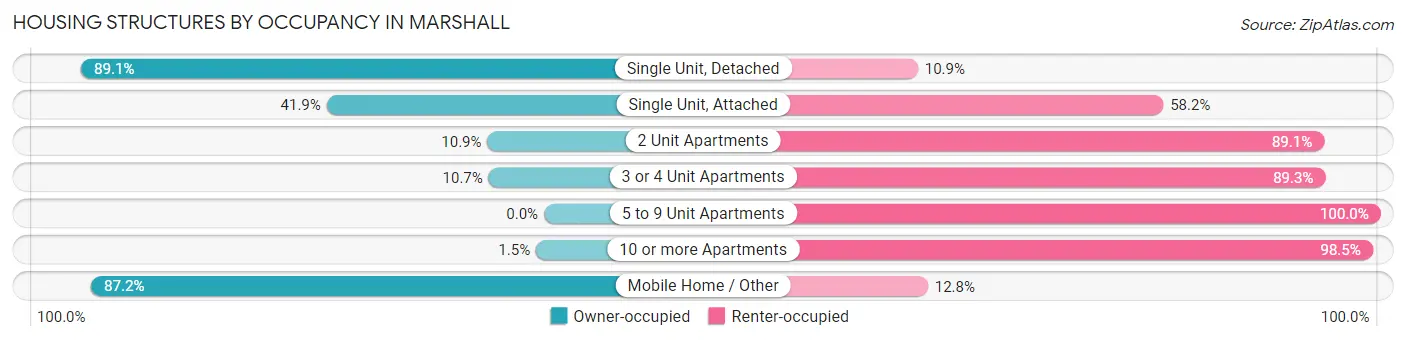
| Structure Type | Owner-occupied | Renter-occupied |
| Single Unit, Detached | 2,886 (89.1%) | 353 (10.9%) |
| Single Unit, Attached | 95 (41.8%) | 132 (58.2%) |
| 2 Unit Apartments | 17 (10.9%) | 139 (89.1%) |
| 3 or 4 Unit Apartments | 53 (10.7%) | 444 (89.3%) |
| 5 to 9 Unit Apartments | 0 (0.0%) | 243 (100.0%) |
| 10 or more Apartments | 14 (1.5%) | 897 (98.5%) |
| Mobile Home / Other | 68 (87.2%) | 10 (12.8%) |
| Total | 3,133 (58.6%) | 2,218 (41.4%) |
Housing Structures by Number of Rooms in Marshall
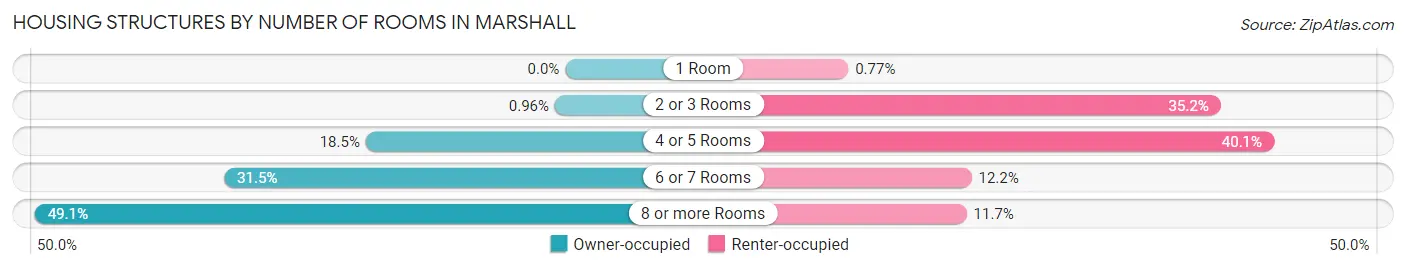
| Number of Rooms | Owner-occupied | Renter-occupied |
| 1 Room | 0 (0.0%) | 17 (0.8%) |
| 2 or 3 Rooms | 30 (1.0%) | 781 (35.2%) |
| 4 or 5 Rooms | 578 (18.4%) | 890 (40.1%) |
| 6 or 7 Rooms | 988 (31.5%) | 270 (12.2%) |
| 8 or more Rooms | 1,537 (49.1%) | 260 (11.7%) |
| Total | 3,133 (100.0%) | 2,218 (100.0%) |
Housing Structure by Heating Type in Marshall
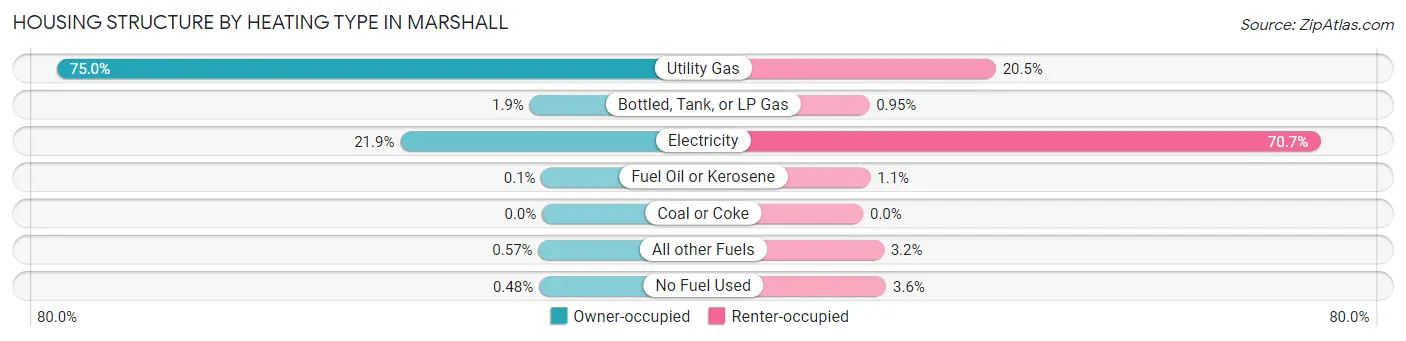
| Heating Type | Owner-occupied | Renter-occupied |
| Utility Gas | 2,350 (75.0%) | 455 (20.5%) |
| Bottled, Tank, or LP Gas | 60 (1.9%) | 21 (0.9%) |
| Electricity | 687 (21.9%) | 1,567 (70.7%) |
| Fuel Oil or Kerosene | 3 (0.1%) | 25 (1.1%) |
| Coal or Coke | 0 (0.0%) | 0 (0.0%) |
| All other Fuels | 18 (0.6%) | 71 (3.2%) |
| No Fuel Used | 15 (0.5%) | 79 (3.6%) |
| Total | 3,133 (100.0%) | 2,218 (100.0%) |
Household Vehicle Usage in Marshall
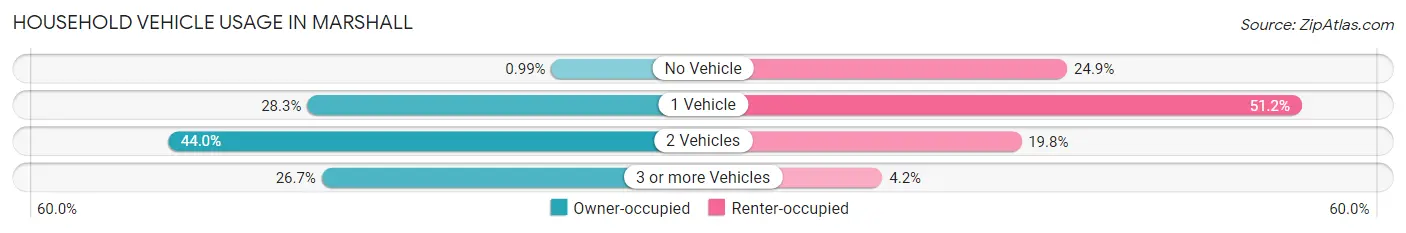
| Vehicles per Household | Owner-occupied | Renter-occupied |
| No Vehicle | 31 (1.0%) | 552 (24.9%) |
| 1 Vehicle | 888 (28.3%) | 1,135 (51.2%) |
| 2 Vehicles | 1,377 (44.0%) | 438 (19.8%) |
| 3 or more Vehicles | 837 (26.7%) | 93 (4.2%) |
| Total | 3,133 (100.0%) | 2,218 (100.0%) |
Real Estate & Mortgages in Marshall
Real Estate and Mortgage Overview in Marshall
| Characteristic | Without Mortgage | With Mortgage |
| Housing Units | 1,484 | 1,649 |
| Median Property Value | $168,700 | $206,700 |
| Median Household Income | $70,167 | $433 |
| Monthly Housing Costs | $563 | $0 |
| Real Estate Taxes | $2,081 | $23 |
Property Value by Mortgage Status in Marshall
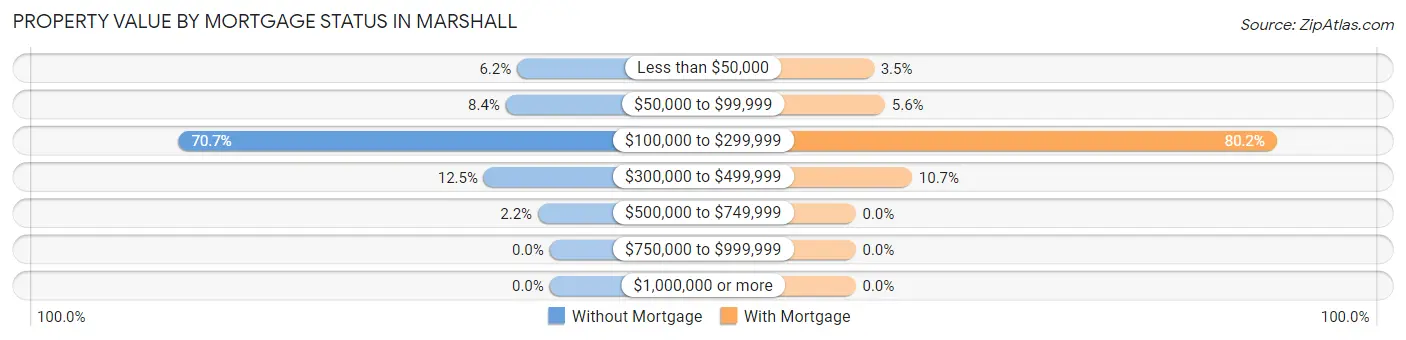
| Property Value | Without Mortgage | With Mortgage |
| Less than $50,000 | 92 (6.2%) | 57 (3.5%) |
| $50,000 to $99,999 | 124 (8.4%) | 92 (5.6%) |
| $100,000 to $299,999 | 1,049 (70.7%) | 1,323 (80.2%) |
| $300,000 to $499,999 | 186 (12.5%) | 177 (10.7%) |
| $500,000 to $749,999 | 33 (2.2%) | 0 (0.0%) |
| $750,000 to $999,999 | 0 (0.0%) | 0 (0.0%) |
| $1,000,000 or more | 0 (0.0%) | 0 (0.0%) |
| Total | 1,484 (100.0%) | 1,649 (100.0%) |
Household Income by Mortgage Status in Marshall
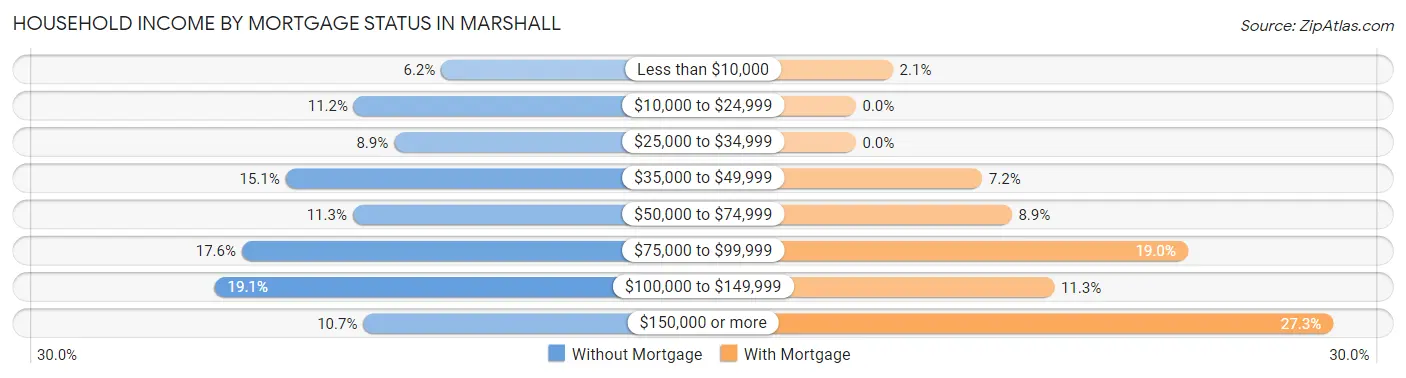
| Household Income | Without Mortgage | With Mortgage |
| Less than $10,000 | 92 (6.2%) | 35 (2.1%) |
| $10,000 to $24,999 | 166 (11.2%) | 0 (0.0%) |
| $25,000 to $34,999 | 132 (8.9%) | 0 (0.0%) |
| $35,000 to $49,999 | 224 (15.1%) | 119 (7.2%) |
| $50,000 to $74,999 | 167 (11.3%) | 147 (8.9%) |
| $75,000 to $99,999 | 261 (17.6%) | 313 (19.0%) |
| $100,000 to $149,999 | 284 (19.1%) | 187 (11.3%) |
| $150,000 or more | 158 (10.6%) | 450 (27.3%) |
| Total | 1,484 (100.0%) | 1,649 (100.0%) |
Property Value to Household Income Ratio in Marshall
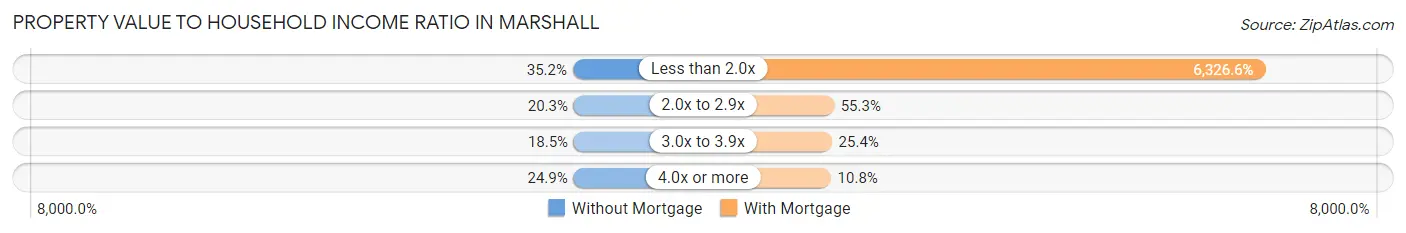
| Value-to-Income Ratio | Without Mortgage | With Mortgage |
| Less than 2.0x | 522 (35.2%) | 104,325 (6,326.6%) |
| 2.0x to 2.9x | 301 (20.3%) | 912 (55.3%) |
| 3.0x to 3.9x | 275 (18.5%) | 418 (25.4%) |
| 4.0x or more | 369 (24.9%) | 178 (10.8%) |
| Total | 1,484 (100.0%) | 1,649 (100.0%) |
Real Estate Taxes by Mortgage Status in Marshall
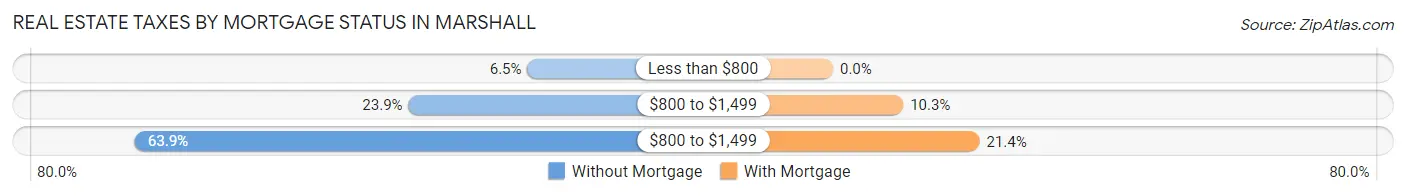
| Property Taxes | Without Mortgage | With Mortgage |
| Less than $800 | 97 (6.5%) | 0 (0.0%) |
| $800 to $1,499 | 355 (23.9%) | 169 (10.2%) |
| $800 to $1,499 | 948 (63.9%) | 353 (21.4%) |
| Total | 1,484 (100.0%) | 1,649 (100.0%) |
Health & Disability in Marshall
Health Insurance Coverage by Age in Marshall
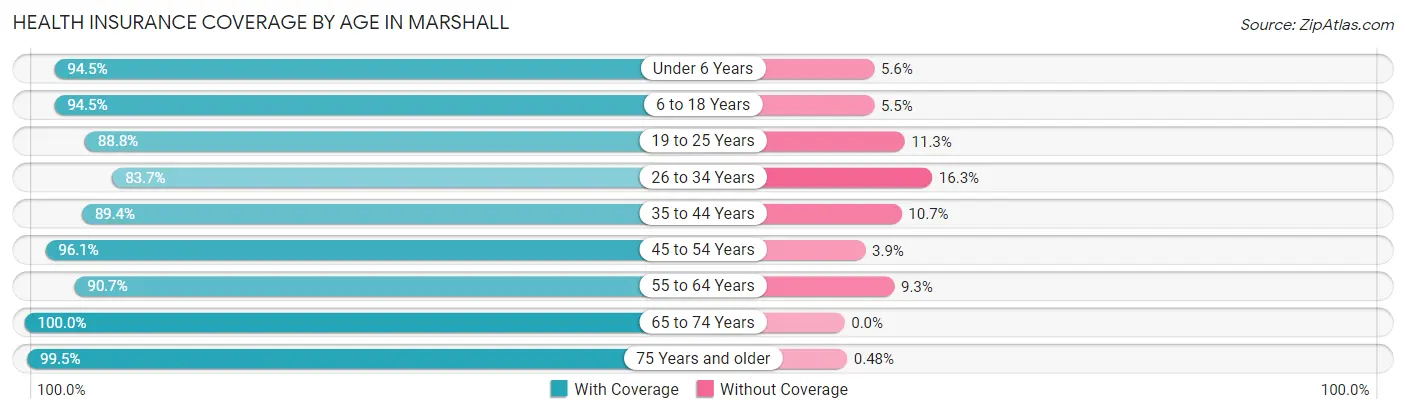
| Age Bracket | With Coverage | Without Coverage |
| Under 6 Years | 1,072 (94.5%) | 63 (5.6%) |
| 6 to 18 Years | 2,476 (94.5%) | 145 (5.5%) |
| 19 to 25 Years | 1,380 (88.7%) | 175 (11.3%) |
| 26 to 34 Years | 1,321 (83.7%) | 258 (16.3%) |
| 35 to 44 Years | 1,275 (89.3%) | 152 (10.6%) |
| 45 to 54 Years | 1,339 (96.1%) | 54 (3.9%) |
| 55 to 64 Years | 1,478 (90.7%) | 151 (9.3%) |
| 65 to 74 Years | 1,123 (100.0%) | 0 (0.0%) |
| 75 Years and older | 1,035 (99.5%) | 5 (0.5%) |
| Total | 12,499 (92.6%) | 1,003 (7.4%) |
Health Insurance Coverage by Citizenship Status in Marshall
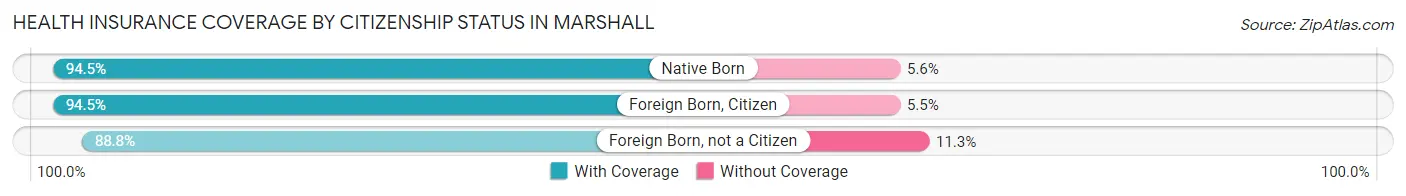
| Citizenship Status | With Coverage | Without Coverage |
| Native Born | 1,072 (94.5%) | 63 (5.6%) |
| Foreign Born, Citizen | 2,476 (94.5%) | 145 (5.5%) |
| Foreign Born, not a Citizen | 1,380 (88.7%) | 175 (11.3%) |
Health Insurance Coverage by Household Income in Marshall
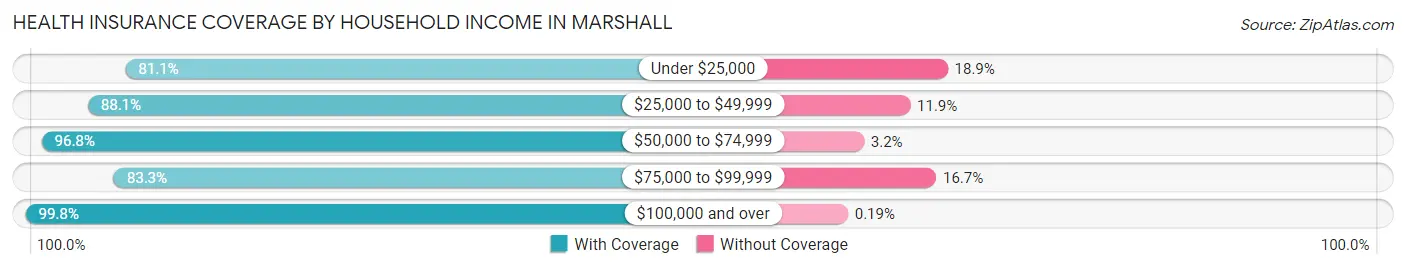
| Household Income | With Coverage | Without Coverage |
| Under $25,000 | 1,400 (81.1%) | 326 (18.9%) |
| $25,000 to $49,999 | 1,702 (88.1%) | 229 (11.9%) |
| $50,000 to $74,999 | 2,549 (96.8%) | 84 (3.2%) |
| $75,000 to $99,999 | 1,513 (83.3%) | 304 (16.7%) |
| $100,000 and over | 4,617 (99.8%) | 9 (0.2%) |
Public vs Private Health Insurance Coverage by Age in Marshall
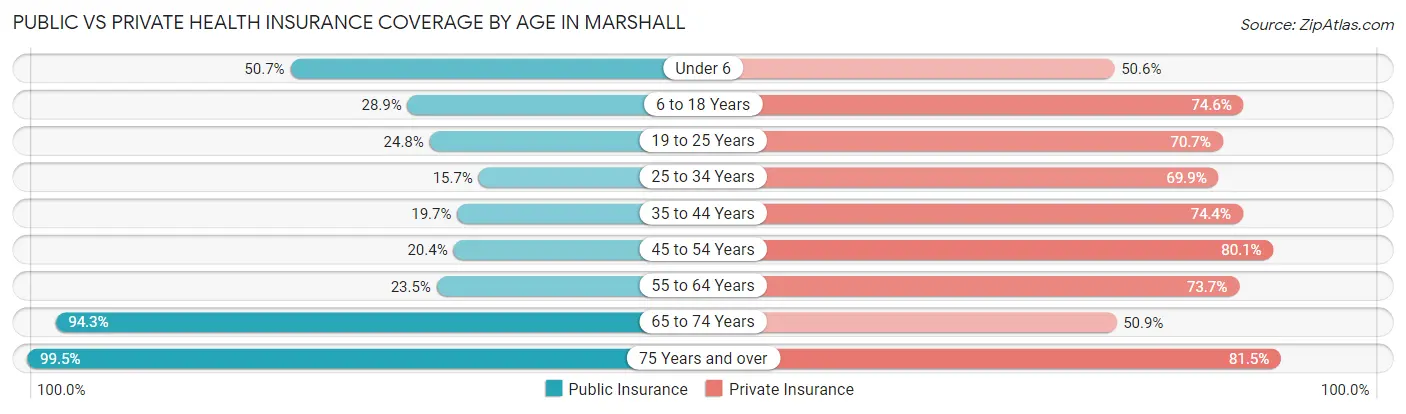
| Age Bracket | Public Insurance | Private Insurance |
| Under 6 | 575 (50.7%) | 574 (50.6%) |
| 6 to 18 Years | 758 (28.9%) | 1,955 (74.6%) |
| 19 to 25 Years | 386 (24.8%) | 1,099 (70.7%) |
| 25 to 34 Years | 248 (15.7%) | 1,104 (69.9%) |
| 35 to 44 Years | 281 (19.7%) | 1,062 (74.4%) |
| 45 to 54 Years | 284 (20.4%) | 1,116 (80.1%) |
| 55 to 64 Years | 383 (23.5%) | 1,201 (73.7%) |
| 65 to 74 Years | 1,059 (94.3%) | 572 (50.9%) |
| 75 Years and over | 1,035 (99.5%) | 848 (81.5%) |
| Total | 5,009 (37.1%) | 9,531 (70.6%) |
Disability Status by Sex by Age in Marshall
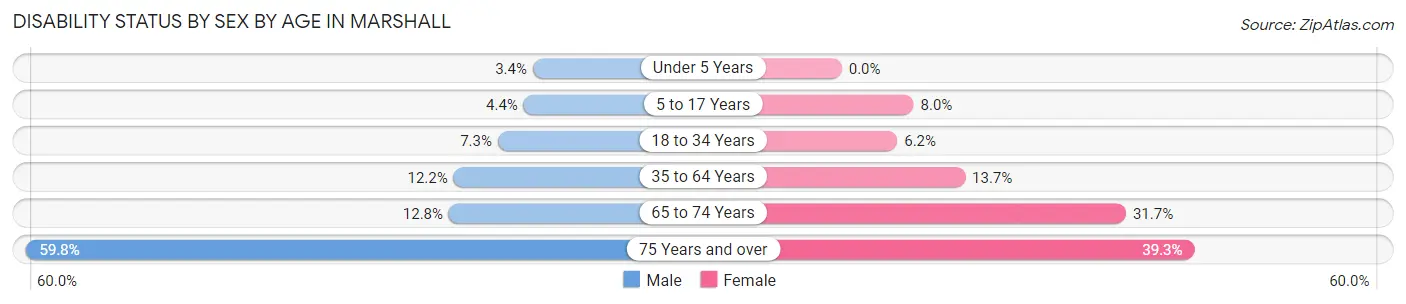
| Age Bracket | Male | Female |
| Under 5 Years | 13 (3.4%) | 0 (0.0%) |
| 5 to 17 Years | 51 (4.4%) | 105 (8.0%) |
| 18 to 34 Years | 133 (7.3%) | 97 (6.2%) |
| 35 to 64 Years | 260 (12.2%) | 319 (13.7%) |
| 65 to 74 Years | 65 (12.8%) | 194 (31.7%) |
| 75 Years and over | 235 (59.8%) | 254 (39.3%) |
Disability Class by Sex by Age in Marshall
Disability Class: Hearing Difficulty
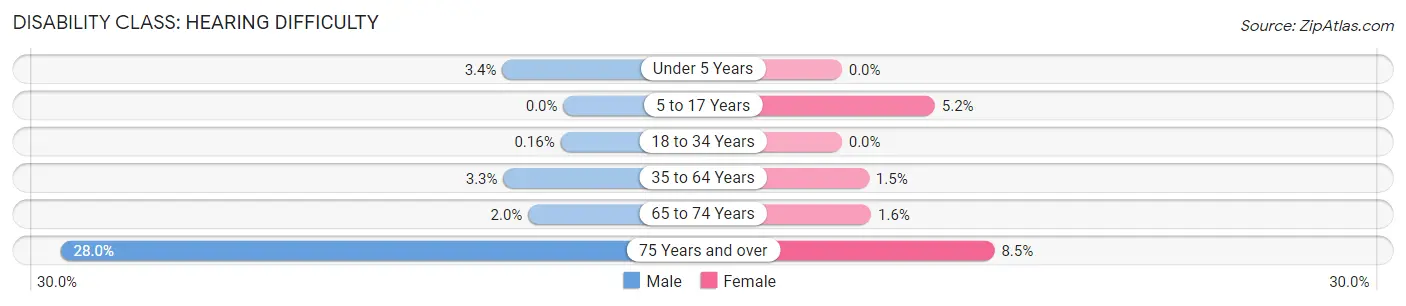
| Age Bracket | Male | Female |
| Under 5 Years | 13 (3.4%) | 0 (0.0%) |
| 5 to 17 Years | 0 (0.0%) | 68 (5.2%) |
| 18 to 34 Years | 3 (0.2%) | 0 (0.0%) |
| 35 to 64 Years | 71 (3.3%) | 35 (1.5%) |
| 65 to 74 Years | 10 (2.0%) | 10 (1.6%) |
| 75 Years and over | 110 (28.0%) | 55 (8.5%) |
Disability Class: Vision Difficulty
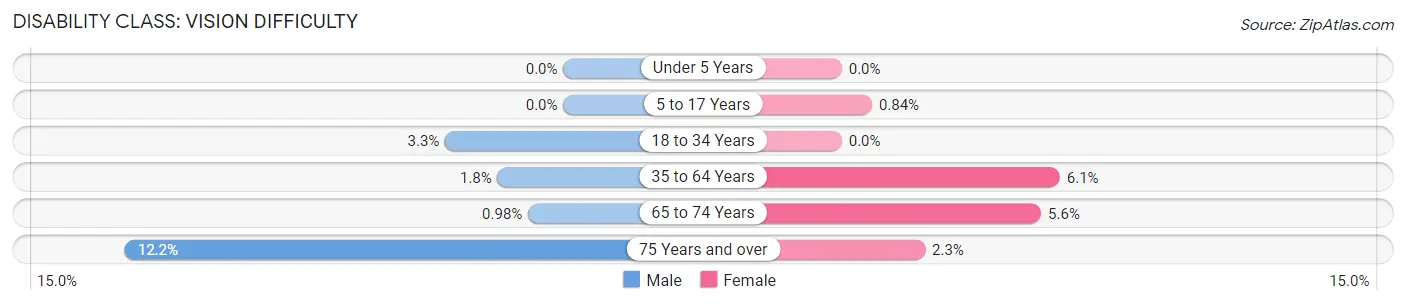
| Age Bracket | Male | Female |
| Under 5 Years | 0 (0.0%) | 0 (0.0%) |
| 5 to 17 Years | 0 (0.0%) | 11 (0.8%) |
| 18 to 34 Years | 60 (3.3%) | 0 (0.0%) |
| 35 to 64 Years | 39 (1.8%) | 141 (6.1%) |
| 65 to 74 Years | 5 (1.0%) | 34 (5.6%) |
| 75 Years and over | 48 (12.2%) | 15 (2.3%) |
Disability Class: Cognitive Difficulty
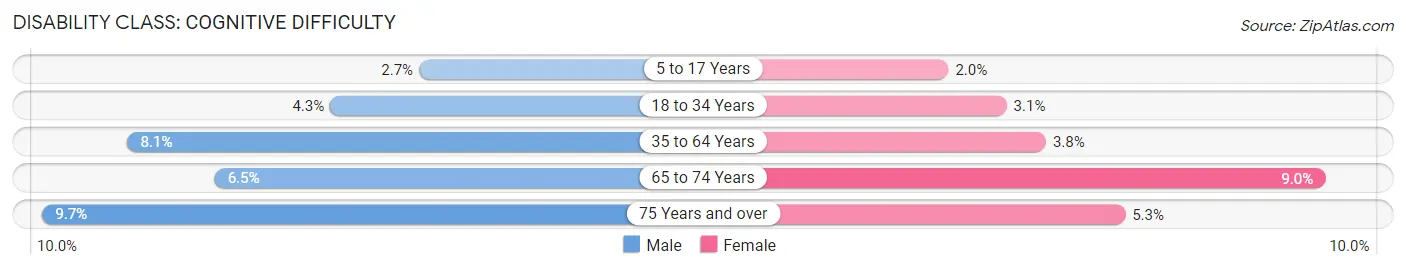
| Age Bracket | Male | Female |
| 5 to 17 Years | 31 (2.7%) | 26 (2.0%) |
| 18 to 34 Years | 79 (4.3%) | 48 (3.1%) |
| 35 to 64 Years | 172 (8.1%) | 88 (3.8%) |
| 65 to 74 Years | 33 (6.5%) | 55 (9.0%) |
| 75 Years and over | 38 (9.7%) | 34 (5.3%) |
Disability Class: Ambulatory Difficulty
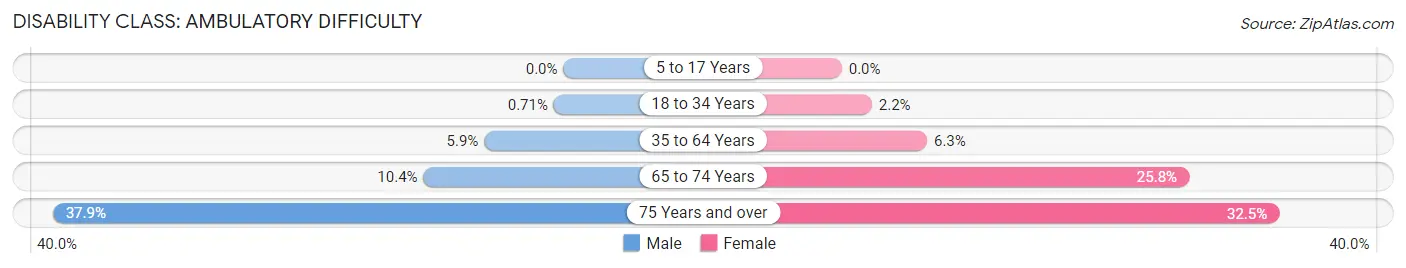
| Age Bracket | Male | Female |
| 5 to 17 Years | 0 (0.0%) | 0 (0.0%) |
| 18 to 34 Years | 13 (0.7%) | 35 (2.2%) |
| 35 to 64 Years | 125 (5.9%) | 147 (6.3%) |
| 65 to 74 Years | 53 (10.4%) | 158 (25.8%) |
| 75 Years and over | 149 (37.9%) | 210 (32.5%) |
Disability Class: Self-Care Difficulty
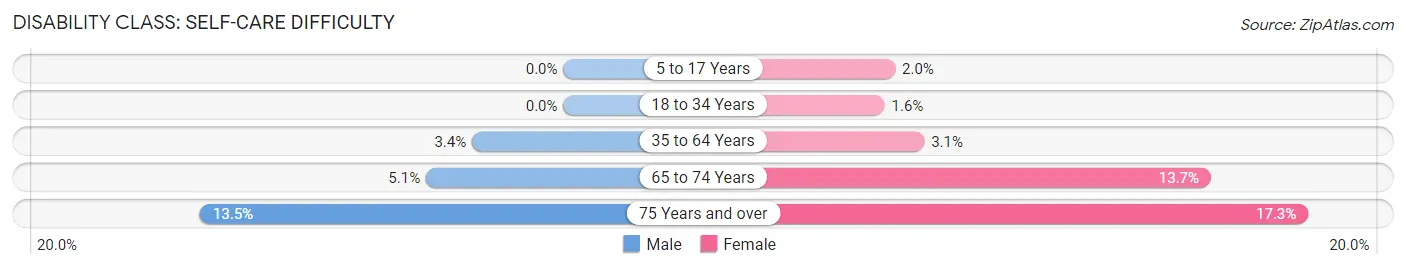
| Age Bracket | Male | Female |
| 5 to 17 Years | 0 (0.0%) | 26 (2.0%) |
| 18 to 34 Years | 0 (0.0%) | 25 (1.6%) |
| 35 to 64 Years | 72 (3.4%) | 71 (3.1%) |
| 65 to 74 Years | 26 (5.1%) | 84 (13.7%) |
| 75 Years and over | 53 (13.5%) | 112 (17.3%) |
Technology Access in Marshall
Computing Device Access in Marshall
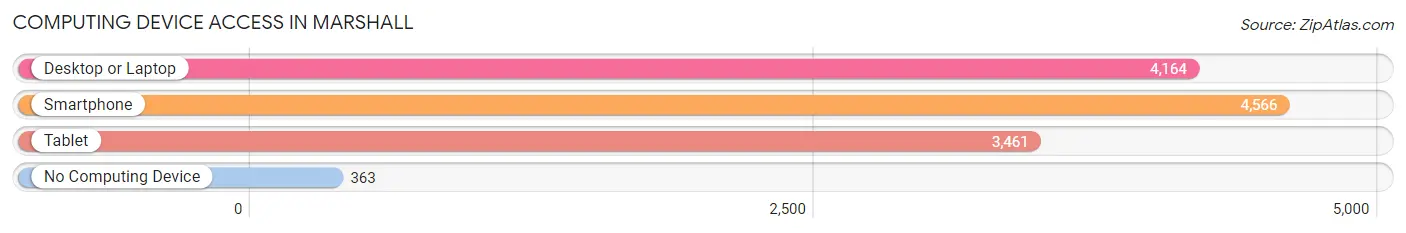
| Device Type | # Households | % Households |
| Desktop or Laptop | 4,164 | 77.8% |
| Smartphone | 4,566 | 85.3% |
| Tablet | 3,461 | 64.7% |
| No Computing Device | 363 | 6.8% |
| Total | 5,351 | 100.0% |
Internet Access in Marshall
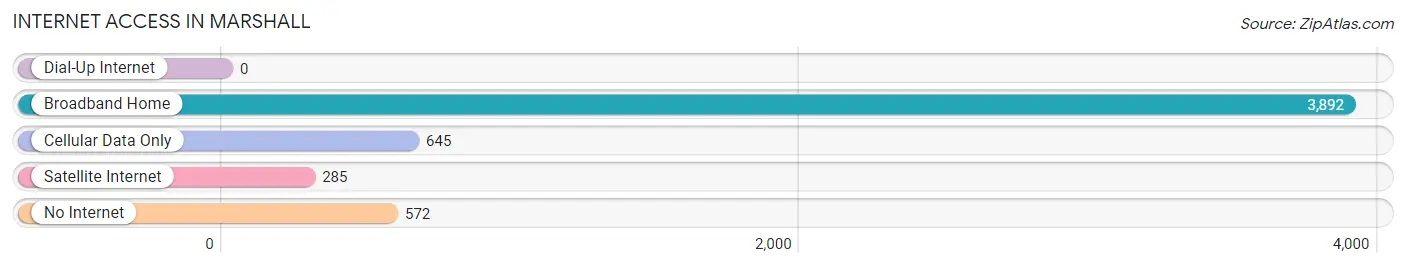
| Internet Type | # Households | % Households |
| Dial-Up Internet | 0 | 0.0% |
| Broadband Home | 3,892 | 72.7% |
| Cellular Data Only | 645 | 12.0% |
| Satellite Internet | 285 | 5.3% |
| No Internet | 572 | 10.7% |
| Total | 5,351 | 100.0% |
Marshall Summary
Marshall, Minnesota is a city located in Lyon County in the southwestern part of the state. It is the county seat and the largest city in the county. The city is located along the Minnesota River and is home to a population of 13,680 people as of the 2010 census.
History
Marshall was founded in 1872 by William P. Sanborn, who named the city after his friend, Chief Justice John Marshall of the United States Supreme Court. The city was incorporated in 1876 and was the first city in Lyon County. The city was initially a trading post for the Sioux and other Native American tribes in the area.
In the late 19th century, Marshall became a major railroad hub, with the Chicago, Milwaukee, St. Paul and Pacific Railroad (the Milwaukee Road) running through the city. This allowed Marshall to become a major agricultural center, with the city becoming a major producer of wheat, corn, and other grains.
In the early 20th century, Marshall became a major manufacturing center, with the opening of the Marshall Canning Company in 1906. The company was the first canning factory in the state and was responsible for canning many of the fruits and vegetables grown in the area.
Geography
Marshall is located in southwestern Minnesota, in Lyon County. The city is situated along the Minnesota River, which forms the city's western border. The city is located approximately 50 miles southwest of Minneapolis and St. Paul.
The city has a total area of 8.2 square miles, of which 8.1 square miles is land and 0.1 square miles is water. The city is located in a flat, open area, with the highest point in the city being only 1,068 feet above sea level.
Economy
Marshall's economy is largely based on agriculture and manufacturing. The city is a major producer of wheat, corn, and other grains, and is home to several large grain processing plants. The city is also home to several manufacturing companies, including the Marshall Canning Company, which produces canned fruits and vegetables, and the Marshall Manufacturing Company, which produces a variety of products, including furniture, tools, and automotive parts.
The city is also home to several retail stores, restaurants, and other businesses. The city is served by the Marshall Municipal Airport, which provides general aviation services.
Demographics
As of the 2010 census, there were 13,680 people, 5,541 households, and 3,541 families residing in the city. The population density was 1,683.2 people per square mile. The racial makeup of the city was 92.2% White, 0.7% African American, 0.4% Native American, 0.7% Asian, 0.1% Pacific Islander, 4.2% from other races, and 1.7% from two or more races. Hispanic or Latino of any race were 8.2% of the population.
The median income for a household in the city was $41,945, and the median income for a family was $50,945. The per capita income for the city was $20,845. About 8.2% of families and 11.2% of the population were below the poverty line, including 15.2% of those under age 18 and 8.2% of those age 65 or over.
Common Questions
What is the Total Population of Marshall?
Total Population of Marshall is 13,647.
What is the Total Male Population of Marshall?
Total Male Population of Marshall is 6,458.
What is the Total Female Population of Marshall?
Total Female Population of Marshall is 7,189.
What is the Ratio of Males per 100 Females in Marshall?
There are 89.83 Males per 100 Females in Marshall.
What is the Ratio of Females per 100 Males in Marshall?
There are 111.32 Females per 100 Males in Marshall.
What is the Median Population Age in Marshall?
Median Population Age in Marshall is 34.7 Years.
What is the Average Family Size in Marshall
Average Family Size in Marshall is 3.0 People.
What is the Average Household Size in Marshall
Average Household Size in Marshall is 2.4 People.
What is Per Capita Income in Marshall?
Per Capita income in Marshall is $33,428.
What is the Median Family Income in Marshall?
Median Family Income in Marshall is $74,125.
What is the Median Household income in Marshall?
Median Household Income in Marshall is $60,532.
What is Income or Wage Gap in Marshall?
Income or Wage Gap in Marshall is 33.5%.
Women in Marshall earn 66.5 cents for every dollar earned by a man.
What is Inequality or Gini Index in Marshall?
Inequality or Gini Index in Marshall is 0.49.
How Large is the Labor Force in Marshall?
There are 6,907 People in the Labor Forcein in Marshall.
What is the Percentage of People in the Labor Force in Marshall?
64.9% of People are in the Labor Force in Marshall.
What is the Unemployment Rate in Marshall?
Unemployment Rate in Marshall is 3.1%.