Cities with the Most Immigrants from Nigeria in Minnesota
RELATED REPORTS & OPTIONS
Nigeria
Minnesota
Compare Cities
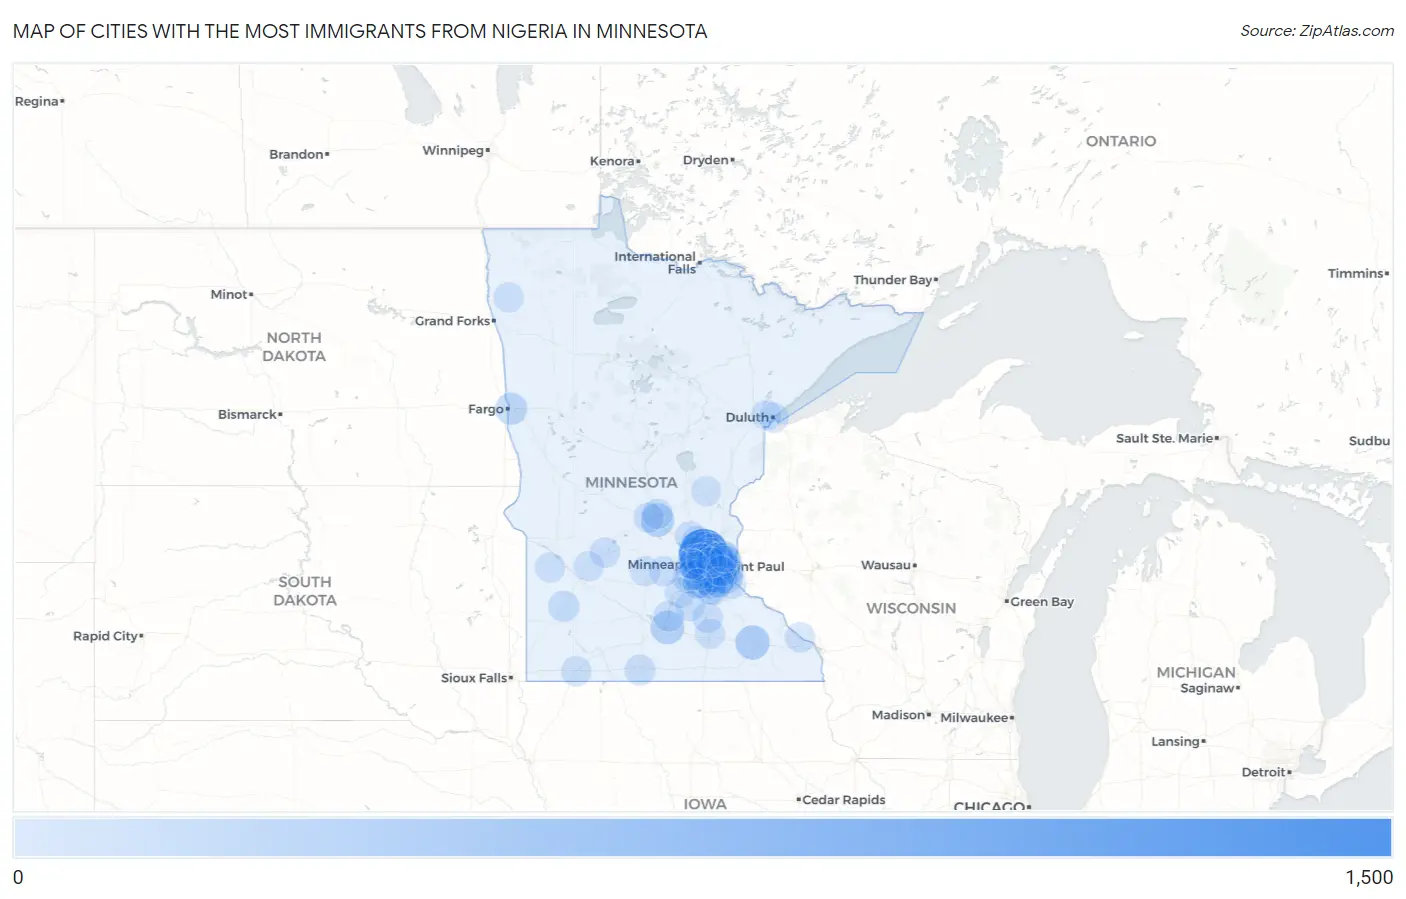
Map of Cities with the Most Immigrants from Nigeria in Minnesota
0
1,500
Cities with the Most Immigrants from Nigeria in Minnesota
| City | Nigeria | vs State | vs National | |
| 1. | Brooklyn Park | 1,398 | 8,263(16.92%)#1 | 416,418(0.34%)#32 |
| 2. | St Paul | 800 | 8,263(9.68%)#2 | 416,418(0.19%)#59 |
| 3. | Minneapolis | 579 | 8,263(7.01%)#3 | 416,418(0.14%)#102 |
| 4. | Brooklyn Center | 477 | 8,263(5.77%)#4 | 416,418(0.11%)#130 |
| 5. | Maple Grove | 342 | 8,263(4.14%)#5 | 416,418(0.08%)#179 |
| 6. | Inver Grove Heights | 291 | 8,263(3.52%)#6 | 416,418(0.07%)#212 |
| 7. | Coon Rapids | 290 | 8,263(3.51%)#7 | 416,418(0.07%)#213 |
| 8. | Rochester | 284 | 8,263(3.44%)#8 | 416,418(0.07%)#217 |
| 9. | St Cloud | 239 | 8,263(2.89%)#9 | 416,418(0.06%)#255 |
| 10. | Bloomington | 238 | 8,263(2.88%)#10 | 416,418(0.06%)#256 |
| 11. | Mankato | 237 | 8,263(2.87%)#11 | 416,418(0.06%)#257 |
| 12. | Savage | 228 | 8,263(2.76%)#12 | 416,418(0.05%)#272 |
| 13. | Oakdale | 225 | 8,263(2.72%)#13 | 416,418(0.05%)#276 |
| 14. | Woodbury | 162 | 8,263(1.96%)#14 | 416,418(0.04%)#394 |
| 15. | Cottage Grove | 158 | 8,263(1.91%)#15 | 416,418(0.04%)#401 |
| 16. | Eagan | 152 | 8,263(1.84%)#16 | 416,418(0.04%)#417 |
| 17. | Moorhead | 143 | 8,263(1.73%)#17 | 416,418(0.03%)#443 |
| 18. | Maplewood | 122 | 8,263(1.48%)#18 | 416,418(0.03%)#503 |
| 19. | Apple Valley | 121 | 8,263(1.46%)#19 | 416,418(0.03%)#510 |
| 20. | Plymouth | 116 | 8,263(1.40%)#20 | 416,418(0.03%)#534 |
| 21. | White Bear Lake | 110 | 8,263(1.33%)#21 | 416,418(0.03%)#557 |
| 22. | Mounds View | 105 | 8,263(1.27%)#22 | 416,418(0.03%)#579 |
| 23. | Lakeville | 99 | 8,263(1.20%)#23 | 416,418(0.02%)#602 |
| 24. | Chaska | 98 | 8,263(1.19%)#24 | 416,418(0.02%)#610 |
| 25. | Richfield | 83 | 8,263(1.00%)#25 | 416,418(0.02%)#672 |
| 26. | Minnetonka | 71 | 8,263(0.86%)#26 | 416,418(0.02%)#746 |
| 27. | Crystal | 68 | 8,263(0.82%)#27 | 416,418(0.02%)#769 |
| 28. | Columbia Heights | 68 | 8,263(0.82%)#28 | 416,418(0.02%)#770 |
| 29. | Roseville | 61 | 8,263(0.74%)#29 | 416,418(0.01%)#831 |
| 30. | Marshall | 60 | 8,263(0.73%)#30 | 416,418(0.01%)#844 |
| 31. | North St Paul | 50 | 8,263(0.61%)#31 | 416,418(0.01%)#958 |
| 32. | New Brighton | 48 | 8,263(0.58%)#32 | 416,418(0.01%)#982 |
| 33. | Burnsville | 46 | 8,263(0.56%)#33 | 416,418(0.01%)#998 |
| 34. | Fridley | 45 | 8,263(0.54%)#34 | 416,418(0.01%)#1,016 |
| 35. | Fairmont | 45 | 8,263(0.54%)#35 | 416,418(0.01%)#1,020 |
| 36. | St Peter | 40 | 8,263(0.48%)#36 | 416,418(0.01%)#1,087 |
| 37. | Golden Valley | 38 | 8,263(0.46%)#37 | 416,418(0.01%)#1,106 |
| 38. | Blaine | 36 | 8,263(0.44%)#38 | 416,418(0.01%)#1,136 |
| 39. | St Louis Park | 35 | 8,263(0.42%)#39 | 416,418(0.01%)#1,155 |
| 40. | Ramsey | 35 | 8,263(0.42%)#40 | 416,418(0.01%)#1,160 |
| 41. | Chanhassen | 35 | 8,263(0.42%)#41 | 416,418(0.01%)#1,161 |
| 42. | Belle Plaine | 24 | 8,263(0.29%)#42 | 416,418(0.01%)#1,377 |
| 43. | Eden Prairie | 23 | 8,263(0.28%)#43 | 416,418(0.01%)#1,389 |
| 44. | New Hope | 23 | 8,263(0.28%)#44 | 416,418(0.01%)#1,398 |
| 45. | Faribault | 22 | 8,263(0.27%)#45 | 416,418(0.01%)#1,425 |
| 46. | Wayzata | 22 | 8,263(0.27%)#46 | 416,418(0.01%)#1,433 |
| 47. | West St Paul | 17 | 8,263(0.21%)#47 | 416,418(0.00%)#1,563 |
| 48. | Sauk Rapids | 17 | 8,263(0.21%)#48 | 416,418(0.00%)#1,567 |
| 49. | Hastings | 16 | 8,263(0.19%)#49 | 416,418(0.00%)#1,593 |
| 50. | Vadnais Heights | 16 | 8,263(0.19%)#50 | 416,418(0.00%)#1,599 |
| 51. | Winona | 15 | 8,263(0.18%)#51 | 416,418(0.00%)#1,625 |
| 52. | Worthington | 15 | 8,263(0.18%)#52 | 416,418(0.00%)#1,636 |
| 53. | St Joseph | 15 | 8,263(0.18%)#53 | 416,418(0.00%)#1,640 |
| 54. | Willmar | 13 | 8,263(0.16%)#54 | 416,418(0.00%)#1,706 |
| 55. | Farmington | 11 | 8,263(0.13%)#55 | 416,418(0.00%)#1,783 |
| 56. | South St Paul | 11 | 8,263(0.13%)#56 | 416,418(0.00%)#1,787 |
| 57. | Rosemount | 10 | 8,263(0.12%)#57 | 416,418(0.00%)#1,831 |
| 58. | Hutchinson | 10 | 8,263(0.12%)#58 | 416,418(0.00%)#1,839 |
| 59. | Hermantown | 10 | 8,263(0.12%)#59 | 416,418(0.00%)#1,844 |
| 60. | Lauderdale | 10 | 8,263(0.12%)#60 | 416,418(0.00%)#1,860 |
| 61. | Duluth | 8 | 8,263(0.10%)#61 | 416,418(0.00%)#1,914 |
| 62. | Mora | 8 | 8,263(0.10%)#62 | 416,418(0.00%)#1,955 |
| 63. | Montgomery | 8 | 8,263(0.10%)#63 | 416,418(0.00%)#1,957 |
| 64. | Lester Prairie | 7 | 8,263(0.08%)#64 | 416,418(0.00%)#2,013 |
| 65. | Clara City | 5 | 8,263(0.06%)#65 | 416,418(0.00%)#2,086 |
| 66. | Elk River | 4 | 8,263(0.05%)#66 | 416,418(0.00%)#2,097 |
| 67. | Dawson | 4 | 8,263(0.05%)#67 | 416,418(0.00%)#2,126 |
| 68. | Long Lake | 3 | 8,263(0.04%)#68 | 416,418(0.00%)#2,155 |
| 69. | Willernie | 3 | 8,263(0.04%)#69 | 416,418(0.00%)#2,165 |
| 70. | Prior Lake | 2 | 8,263(0.02%)#70 | 416,418(0.00%)#2,174 |
| 71. | Owatonna | 2 | 8,263(0.02%)#71 | 416,418(0.00%)#2,176 |
| 72. | Warren | 2 | 8,263(0.02%)#72 | 416,418(0.00%)#2,195 |
Common Questions
What are the Top 10 Cities with the Most Immigrants from Nigeria in Minnesota?
Top 10 Cities with the Most Immigrants from Nigeria in Minnesota are:
#1
1,398
#2
800
#3
579
#4
477
#5
342
#6
291
#7
290
#8
284
#9
239
#10
238
What city has the Most Immigrants from Nigeria in Minnesota?
Brooklyn Park has the Most Immigrants from Nigeria in Minnesota with 1,398.
What is the Total Immigrants from Nigeria in the State of Minnesota?
Total Immigrants from Nigeria in Minnesota is 8,263.
What is the Total Immigrants from Nigeria in the United States?
Total Immigrants from Nigeria in the United States is 416,418.