Clinton, MN
Clinton Map
Clinton Overview
284
TOTAL POPULATION
124
MALE POPULATION
160
FEMALE POPULATION
77.50
MALES / 100 FEMALES
129.03
FEMALES / 100 MALES
50.9
MEDIAN AGE
2.9
AVG FAMILY SIZE
2.0
AVG HOUSEHOLD SIZE
$33,635
PER CAPITA INCOME
$92,857
AVG FAMILY INCOME
$64,444
AVG HOUSEHOLD INCOME
13.8%
WAGE / INCOME GAP [ % ]
86.2¢/ $1
WAGE / INCOME GAP [ $ ]
0.34
INEQUALITY / GINI INDEX
163
LABOR FORCE [ PEOPLE ]
70.3%
PERCENT IN LABOR FORCE
1.8%
UNEMPLOYMENT RATE
Clinton Zip Codes
Clinton Area Codes
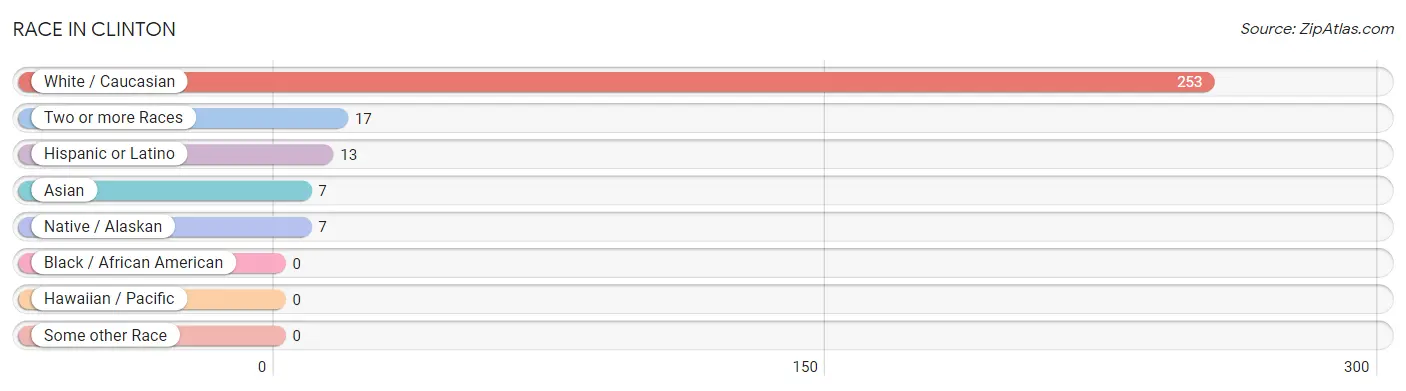
Race in Clinton
The most populous races in Clinton are White / Caucasian (253 | 89.1%), Two or more Races (17 | 6.0%), and Hispanic or Latino (13 | 4.6%).
| Race | # Population | % Population |
| Asian | 7 | 2.5% |
| Black / African American | 0 | 0.0% |
| Hawaiian / Pacific | 0 | 0.0% |
| Hispanic or Latino | 13 | 4.6% |
| Native / Alaskan | 7 | 2.5% |
| White / Caucasian | 253 | 89.1% |
| Two or more Races | 17 | 6.0% |
| Some other Race | 0 | 0.0% |
| Total | 284 | 100.0% |
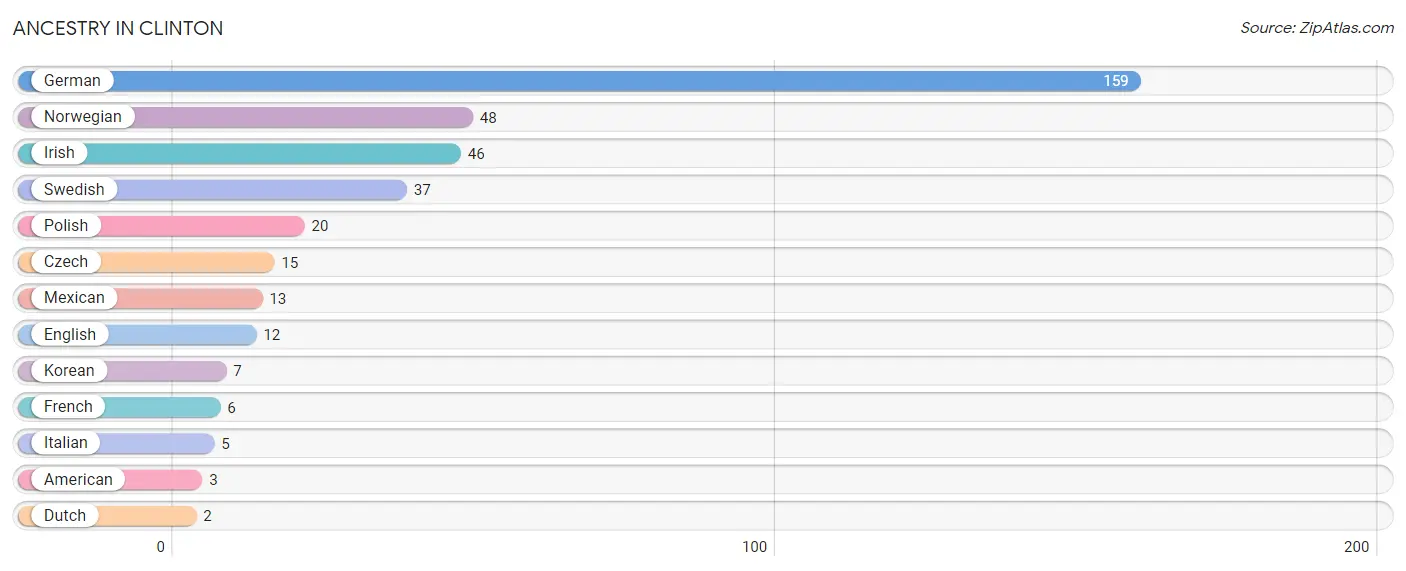
Ancestry in Clinton
The most populous ancestries reported in Clinton are German (159 | 56.0%), Norwegian (48 | 16.9%), Irish (46 | 16.2%), Swedish (37 | 13.0%), and Polish (20 | 7.0%), together accounting for 109.2% of all Clinton residents.
| Ancestry | # Population | % Population |
| American | 3 | 1.1% |
| Czech | 15 | 5.3% |
| Dutch | 2 | 0.7% |
| English | 12 | 4.2% |
| French | 6 | 2.1% |
| German | 159 | 56.0% |
| Irish | 46 | 16.2% |
| Italian | 5 | 1.8% |
| Korean | 7 | 2.5% |
| Mexican | 13 | 4.6% |
| Norwegian | 48 | 16.9% |
| Polish | 20 | 7.0% |
| Swedish | 37 | 13.0% | View All 13 Rows |
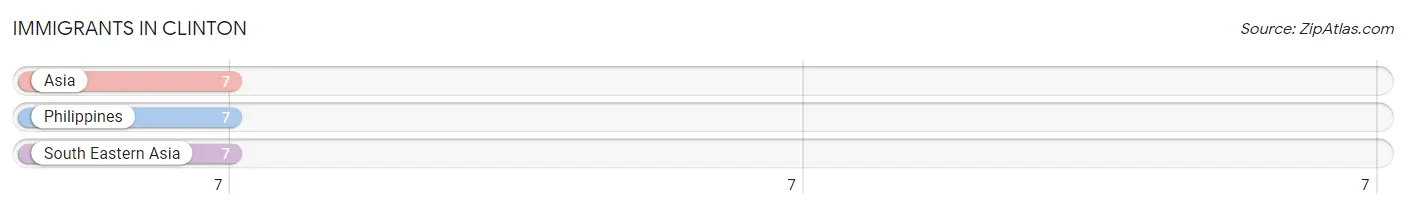
Immigrants in Clinton
The most numerous immigrant groups reported in Clinton came from Asia (7 | 2.5%), Philippines (7 | 2.5%), and South Eastern Asia (7 | 2.5%), together accounting for 7.4% of all Clinton residents.
| Immigration Origin | # Population | % Population |
| Asia | 7 | 2.5% |
| Philippines | 7 | 2.5% |
| South Eastern Asia | 7 | 2.5% | View All 3 Rows |
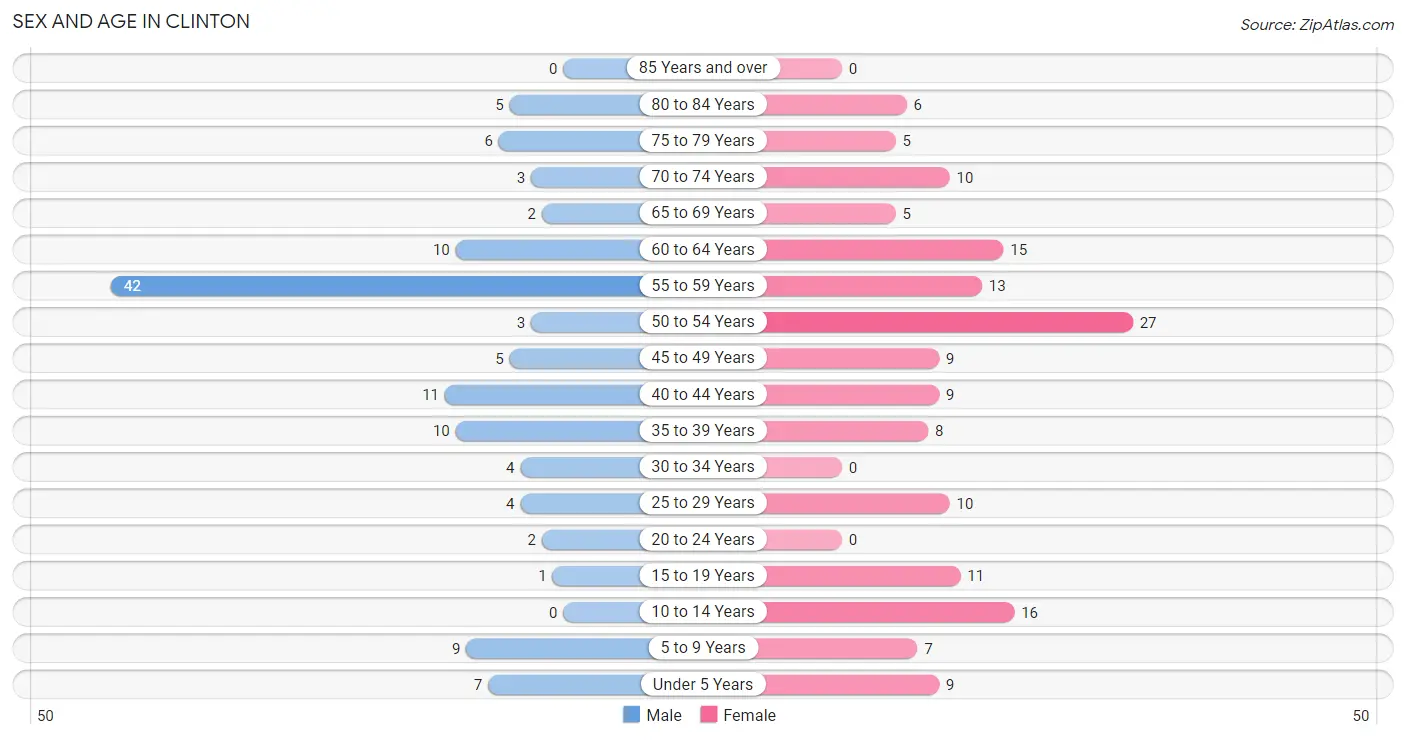
Sex and Age in Clinton
Sex and Age in Clinton
The most populous age groups in Clinton are 55 to 59 Years (42 | 33.9%) for men and 50 to 54 Years (27 | 16.9%) for women.
| Age Bracket | Male | Female |
| Under 5 Years | 7 (5.7%) | 9 (5.6%) |
| 5 to 9 Years | 9 (7.3%) | 7 (4.4%) |
| 10 to 14 Years | 0 (0.0%) | 16 (10.0%) |
| 15 to 19 Years | 1 (0.8%) | 11 (6.9%) |
| 20 to 24 Years | 2 (1.6%) | 0 (0.0%) |
| 25 to 29 Years | 4 (3.2%) | 10 (6.2%) |
| 30 to 34 Years | 4 (3.2%) | 0 (0.0%) |
| 35 to 39 Years | 10 (8.1%) | 8 (5.0%) |
| 40 to 44 Years | 11 (8.9%) | 9 (5.6%) |
| 45 to 49 Years | 5 (4.0%) | 9 (5.6%) |
| 50 to 54 Years | 3 (2.4%) | 27 (16.9%) |
| 55 to 59 Years | 42 (33.9%) | 13 (8.1%) |
| 60 to 64 Years | 10 (8.1%) | 15 (9.4%) |
| 65 to 69 Years | 2 (1.6%) | 5 (3.1%) |
| 70 to 74 Years | 3 (2.4%) | 10 (6.2%) |
| 75 to 79 Years | 6 (4.8%) | 5 (3.1%) |
| 80 to 84 Years | 5 (4.0%) | 6 (3.7%) |
| 85 Years and over | 0 (0.0%) | 0 (0.0%) |
| Total | 124 (100.0%) | 160 (100.0%) |
Families and Households in Clinton
Median Family Size in Clinton
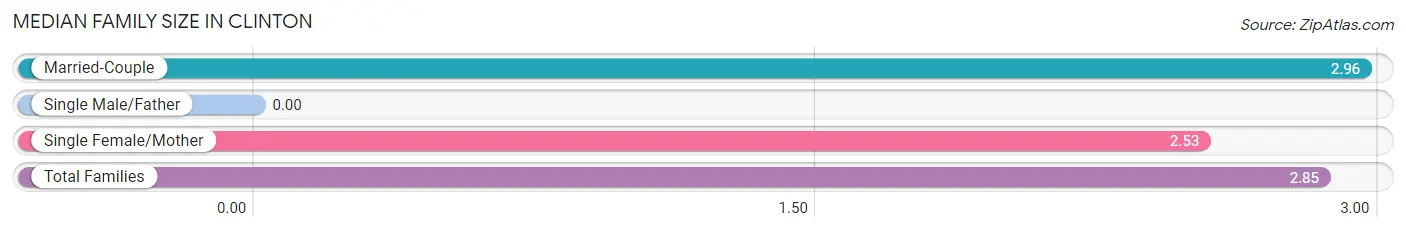
| Family Type | # Families | Family Size |
| Married-Couple | 51 (75.0%) | 2.96 |
| Single Male/Father | 0 (0.0%) | - |
| Single Female/Mother | 17 (25.0%) | 2.53 |
| Total Families | 68 (100.0%) | 2.85 |
Median Household Size in Clinton
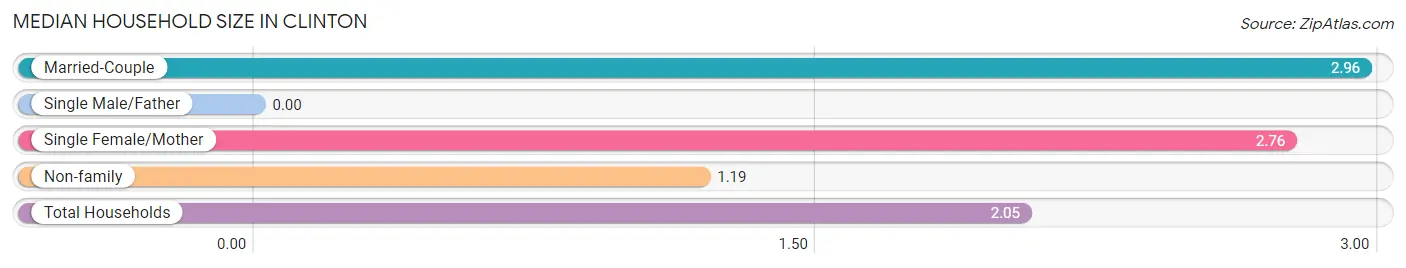
| Household Type | # Households | Household Size |
| Married-Couple | 51 (37.5%) | 2.96 |
| Single Male/Father | 0 (0.0%) | - |
| Single Female/Mother | 17 (12.5%) | 2.76 |
| Non-family | 68 (50.0%) | 1.19 |
| Total Households | 136 (100.0%) | 2.05 |
Household Size by Marriage Status in Clinton
Out of a total of 136 households in Clinton, 68 (50.0%) are family households, while 68 (50.0%) are nonfamily households. The most numerous type of family households are 2-person households, comprising 39, and the most common type of nonfamily households are 1-person households, comprising 50.
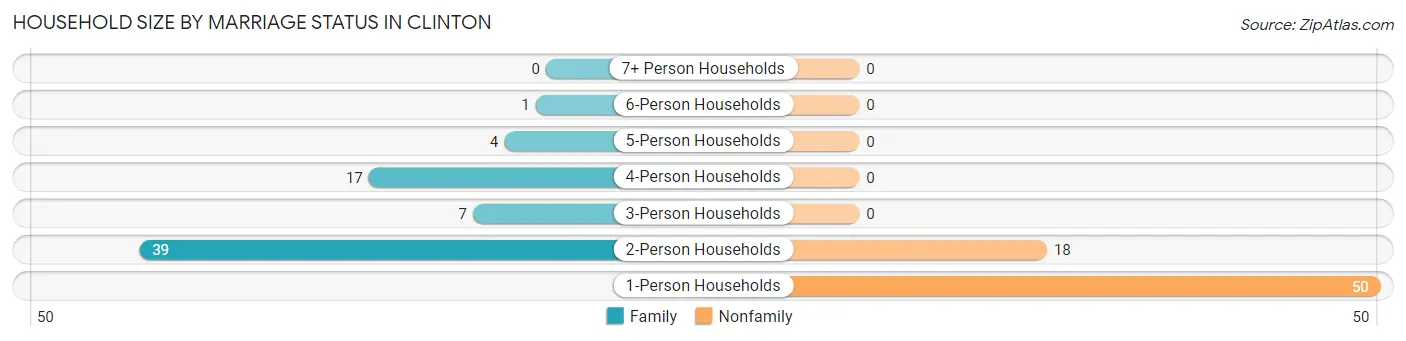
| Household Size | Family Households | Nonfamily Households |
| 1-Person Households | - | 50 (36.8%) |
| 2-Person Households | 39 (28.7%) | 18 (13.2%) |
| 3-Person Households | 7 (5.1%) | 0 (0.0%) |
| 4-Person Households | 17 (12.5%) | 0 (0.0%) |
| 5-Person Households | 4 (2.9%) | 0 (0.0%) |
| 6-Person Households | 1 (0.7%) | 0 (0.0%) |
| 7+ Person Households | 0 (0.0%) | 0 (0.0%) |
| Total | 68 (50.0%) | 68 (50.0%) |
Female Fertility in Clinton
Fertility by Age in Clinton
Average fertility rate in Clinton is 121.0 births per 1,000 women. Women in the age bracket of 20 to 34 years have the highest fertility rate with 700.0 births per 1,000 women. Women in the age bracket of 20 to 34 years acount for 100.0% of all women with births.
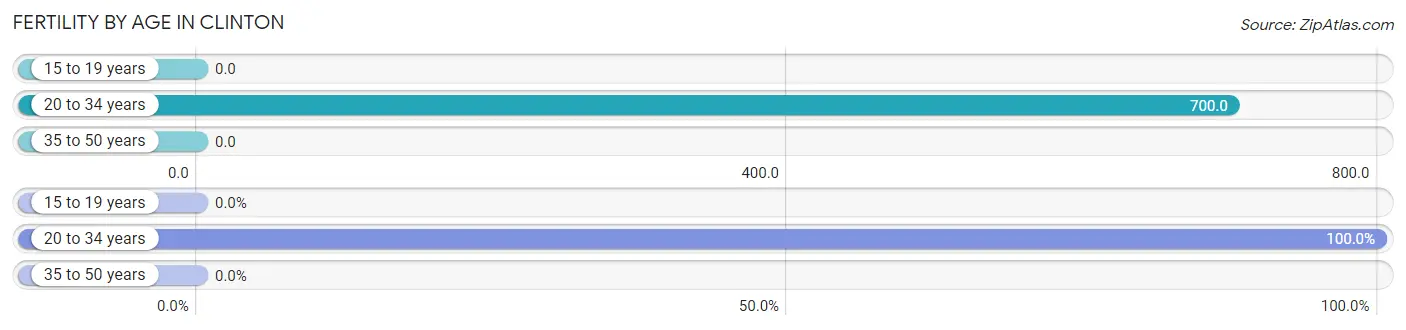
| Age Bracket | Women with Births | Births / 1,000 Women |
| 15 to 19 years | 0 (0.0%) | 0.0 |
| 20 to 34 years | 7 (100.0%) | 700.0 |
| 35 to 50 years | 0 (0.0%) | 0.0 |
| Total | 7 (100.0%) | 121.0 |
Fertility by Age by Marriage Status in Clinton
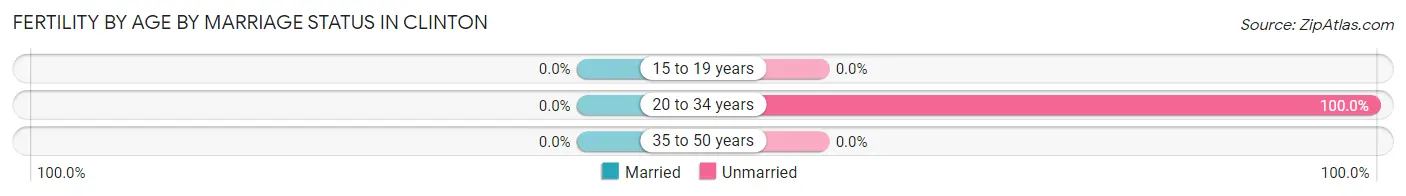
| Age Bracket | Married | Unmarried |
| 15 to 19 years | 0 (0.0%) | 0 (0.0%) |
| 20 to 34 years | 0 (0.0%) | 7 (100.0%) |
| 35 to 50 years | 0 (0.0%) | 0 (0.0%) |
| Total | 0 (0.0%) | 7 (100.0%) |
Fertility by Education in Clinton
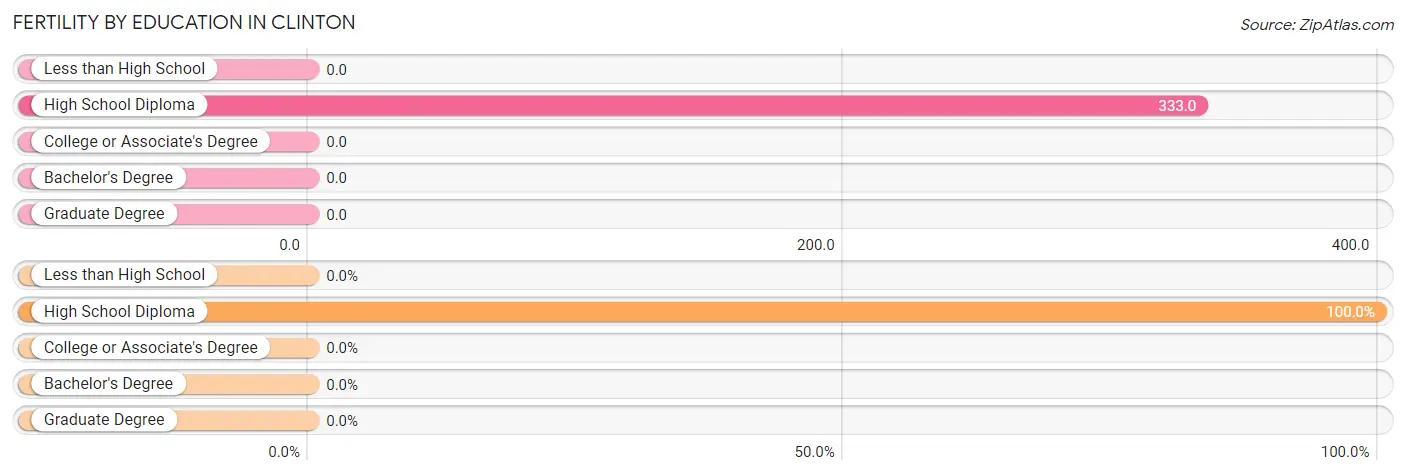
| Educational Attainment | Women with Births | Births / 1,000 Women |
| Less than High School | 0 (0.0%) | 0.0 |
| High School Diploma | 7 (100.0%) | 333.0 |
| College or Associate's Degree | 0 (0.0%) | 0.0 |
| Bachelor's Degree | 0 (0.0%) | 0.0 |
| Graduate Degree | 0 (0.0%) | 0.0 |
| Total | 7 (100.0%) | 121.0 |
Fertility by Education by Marriage Status in Clinton
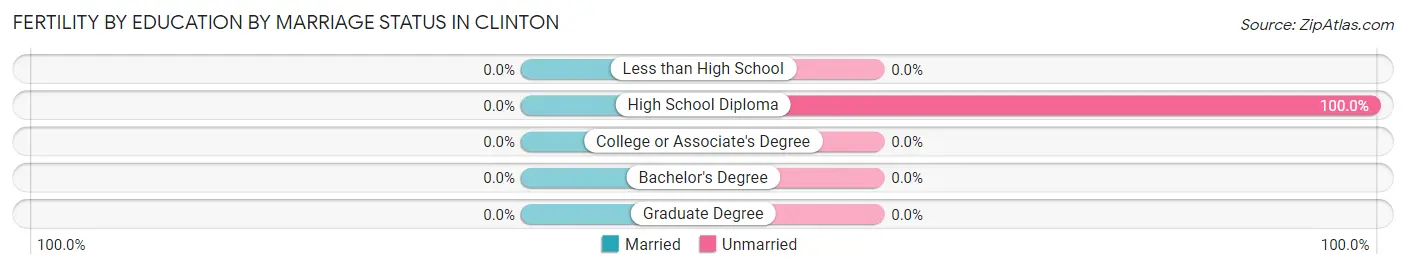
| Educational Attainment | Married | Unmarried |
| Less than High School | 0 (0.0%) | 0 (0.0%) |
| High School Diploma | 0 (0.0%) | 7 (100.0%) |
| College or Associate's Degree | 0 (0.0%) | 0 (0.0%) |
| Bachelor's Degree | 0 (0.0%) | 0 (0.0%) |
| Graduate Degree | 0 (0.0%) | 0 (0.0%) |
| Total | 0 (0.0%) | 7 (100.0%) |
Income in Clinton
Income Overview in Clinton
Per Capita Income in Clinton is $33,635, while median incomes of families and households are $92,857 and $64,444 respectively.
| Characteristic | Number | Measure |
| Per Capita Income | 284 | $33,635 |
| Median Family Income | 68 | $92,857 |
| Mean Family Income | 68 | $82,699 |
| Median Household Income | 136 | $64,444 |
| Mean Household Income | 136 | $69,340 |
| Income Deficit | 68 | $0 |
| Wage / Income Gap (%) | 284 | 13.83% |
| Wage / Income Gap ($) | 284 | 86.17¢ per $1 |
| Gini / Inequality Index | 284 | 0.34 |
Earnings by Sex in Clinton
Average Earnings in Clinton are $34,009, $34,491 for men and $29,722 for women, a difference of 13.8%.
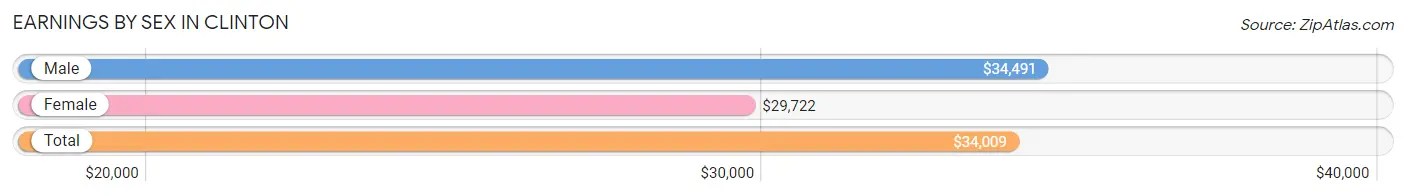
| Sex | Number | Average Earnings |
| Male | 85 (48.0%) | $34,491 |
| Female | 92 (52.0%) | $29,722 |
| Total | 177 (100.0%) | $34,009 |
Earnings by Sex by Income Bracket in Clinton
The most common earnings brackets in Clinton are $30,000 to $34,999 for men (27 | 31.8%) and $75,000 to $99,999 for women (19 | 20.6%).
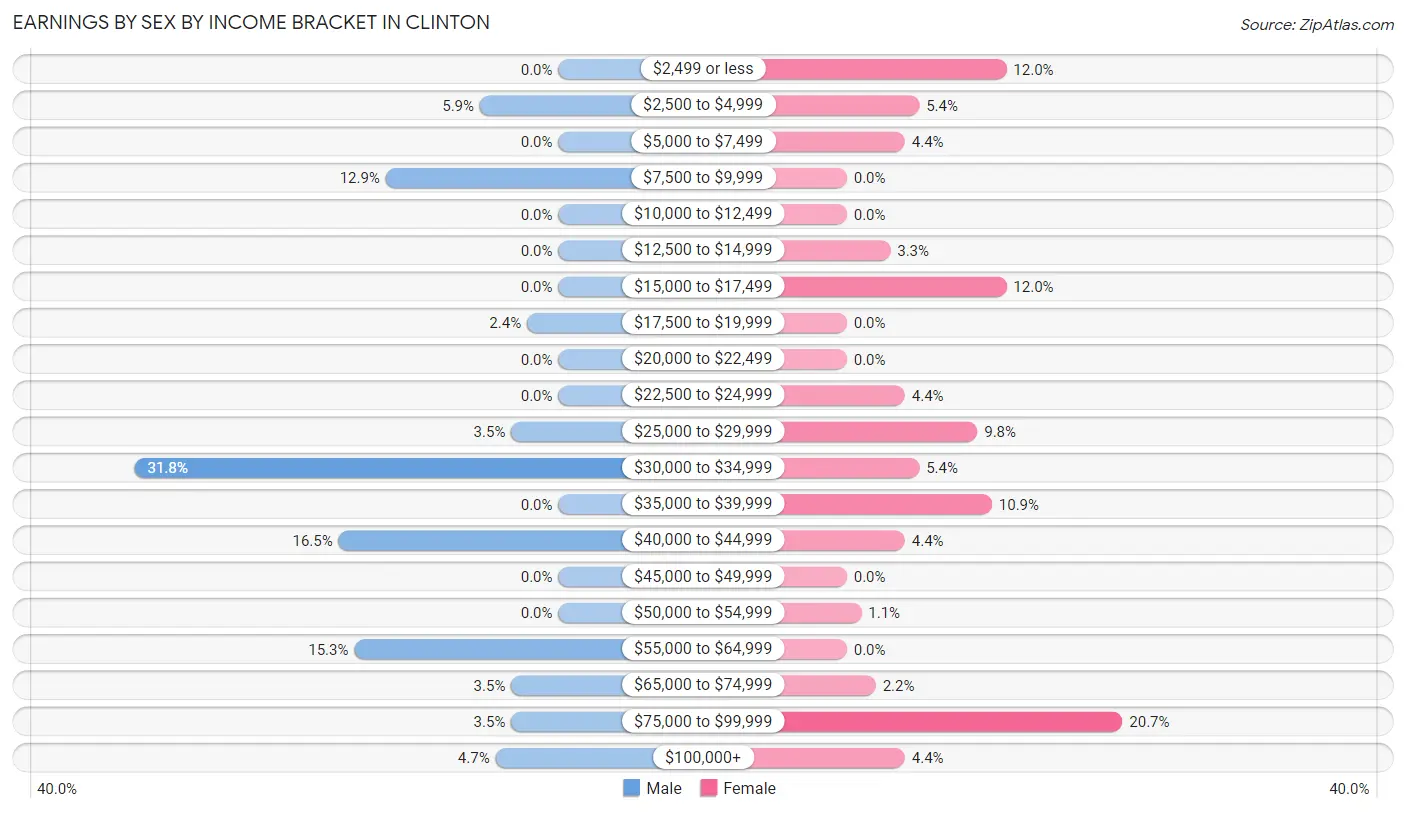
| Income | Male | Female |
| $2,499 or less | 0 (0.0%) | 11 (12.0%) |
| $2,500 to $4,999 | 5 (5.9%) | 5 (5.4%) |
| $5,000 to $7,499 | 0 (0.0%) | 4 (4.3%) |
| $7,500 to $9,999 | 11 (12.9%) | 0 (0.0%) |
| $10,000 to $12,499 | 0 (0.0%) | 0 (0.0%) |
| $12,500 to $14,999 | 0 (0.0%) | 3 (3.3%) |
| $15,000 to $17,499 | 0 (0.0%) | 11 (12.0%) |
| $17,500 to $19,999 | 2 (2.4%) | 0 (0.0%) |
| $20,000 to $22,499 | 0 (0.0%) | 0 (0.0%) |
| $22,500 to $24,999 | 0 (0.0%) | 4 (4.3%) |
| $25,000 to $29,999 | 3 (3.5%) | 9 (9.8%) |
| $30,000 to $34,999 | 27 (31.8%) | 5 (5.4%) |
| $35,000 to $39,999 | 0 (0.0%) | 10 (10.9%) |
| $40,000 to $44,999 | 14 (16.5%) | 4 (4.3%) |
| $45,000 to $49,999 | 0 (0.0%) | 0 (0.0%) |
| $50,000 to $54,999 | 0 (0.0%) | 1 (1.1%) |
| $55,000 to $64,999 | 13 (15.3%) | 0 (0.0%) |
| $65,000 to $74,999 | 3 (3.5%) | 2 (2.2%) |
| $75,000 to $99,999 | 3 (3.5%) | 19 (20.6%) |
| $100,000+ | 4 (4.7%) | 4 (4.3%) |
| Total | 85 (100.0%) | 92 (100.0%) |
Earnings by Sex by Educational Attainment in Clinton
Average earnings in Clinton are $34,583 for men and $31,667 for women, a difference of 8.4%. Men with an educational attainment of high school diploma enjoy the highest average annual earnings of $40,625, while those with college or associate's degree education earn the least with $33,750. Women with an educational attainment of bachelor's degree earn the most with the average annual earnings of $83,214, while those with bachelor's degree education have the smallest earnings of $83,214.
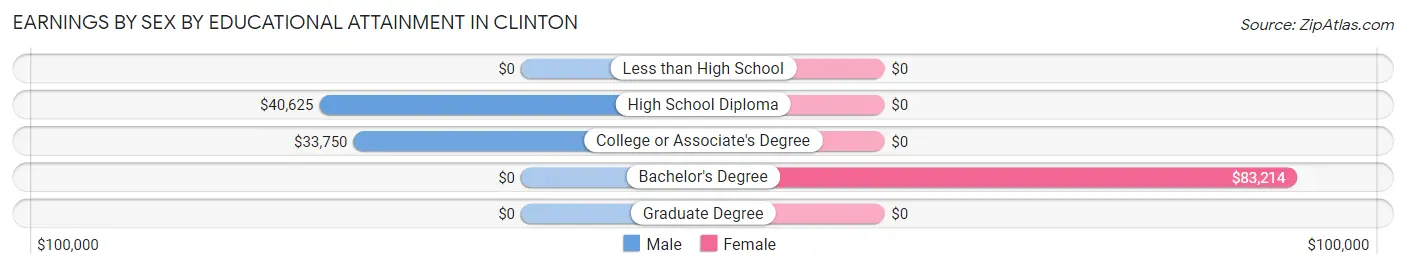
| Educational Attainment | Male Income | Female Income |
| Less than High School | - | - |
| High School Diploma | $40,625 | $0 |
| College or Associate's Degree | $33,750 | $0 |
| Bachelor's Degree | - | - |
| Graduate Degree | - | - |
| Total | $34,583 | $31,667 |
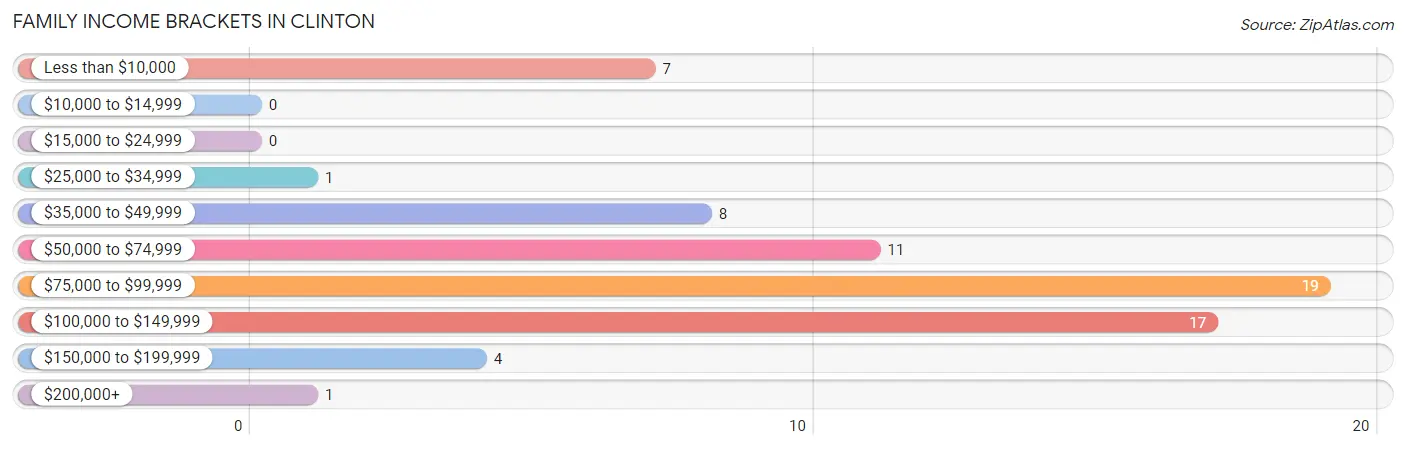
Family Income in Clinton
Family Income Brackets in Clinton
According to the Clinton family income data, there are 19 families falling into the $75,000 to $99,999 income range, which is the most common income bracket and makes up 27.9% of all families.
| Income Bracket | # Families | % Families |
| Less than $10,000 | 7 | 10.3% |
| $10,000 to $14,999 | 0 | 0.0% |
| $15,000 to $24,999 | 0 | 0.0% |
| $25,000 to $34,999 | 1 | 1.5% |
| $35,000 to $49,999 | 8 | 11.8% |
| $50,000 to $74,999 | 11 | 16.2% |
| $75,000 to $99,999 | 19 | 27.9% |
| $100,000 to $149,999 | 17 | 25.0% |
| $150,000 to $199,999 | 4 | 5.9% |
| $200,000+ | 1 | 1.5% |
Family Income by Famaliy Size in Clinton
4-person families (14 | 20.6%) account for the highest median family income in Clinton with $101,563 per family, while 2-person families (39 | 57.4%) have the highest median income of $44,875 per family member.
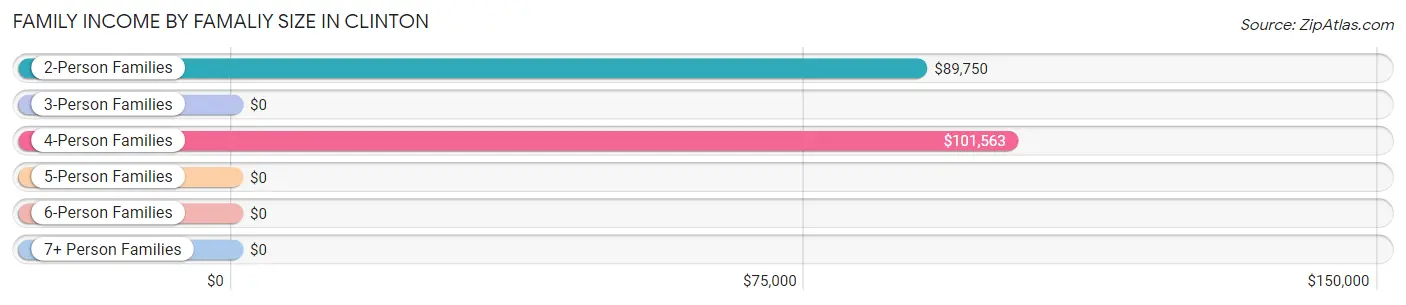
| Income Bracket | # Families | Median Income |
| 2-Person Families | 39 (57.4%) | $89,750 |
| 3-Person Families | 10 (14.7%) | $0 |
| 4-Person Families | 14 (20.6%) | $101,563 |
| 5-Person Families | 4 (5.9%) | $0 |
| 6-Person Families | 1 (1.5%) | $0 |
| 7+ Person Families | 0 (0.0%) | $0 |
| Total | 68 (100.0%) | $92,857 |
Family Income by Number of Earners in Clinton
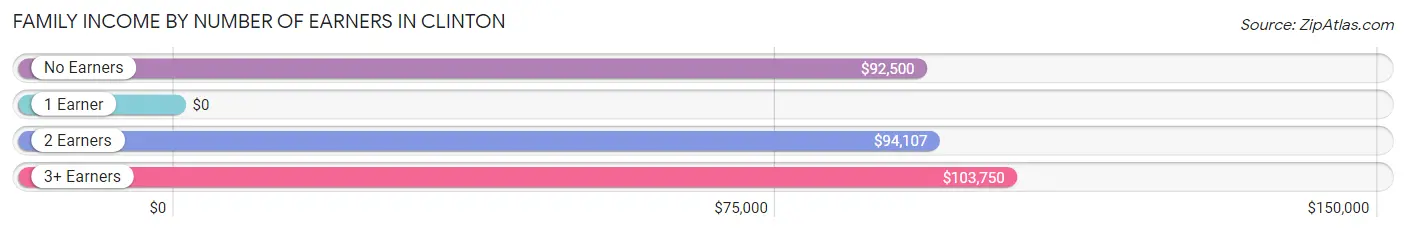
| Number of Earners | # Families | Median Income |
| No Earners | 12 (17.6%) | $92,500 |
| 1 Earner | 11 (16.2%) | $0 |
| 2 Earners | 37 (54.4%) | $94,107 |
| 3+ Earners | 8 (11.8%) | $103,750 |
| Total | 68 (100.0%) | $92,857 |
Household Income in Clinton
Household Income Brackets in Clinton
With 33 households falling in the category, the $100,000 to $149,999 income range is the most frequent in Clinton, accounting for 24.3% of all households. In contrast, only 1 households (0.7%) fall into the $200,000+ income bracket, making it the least populous group.
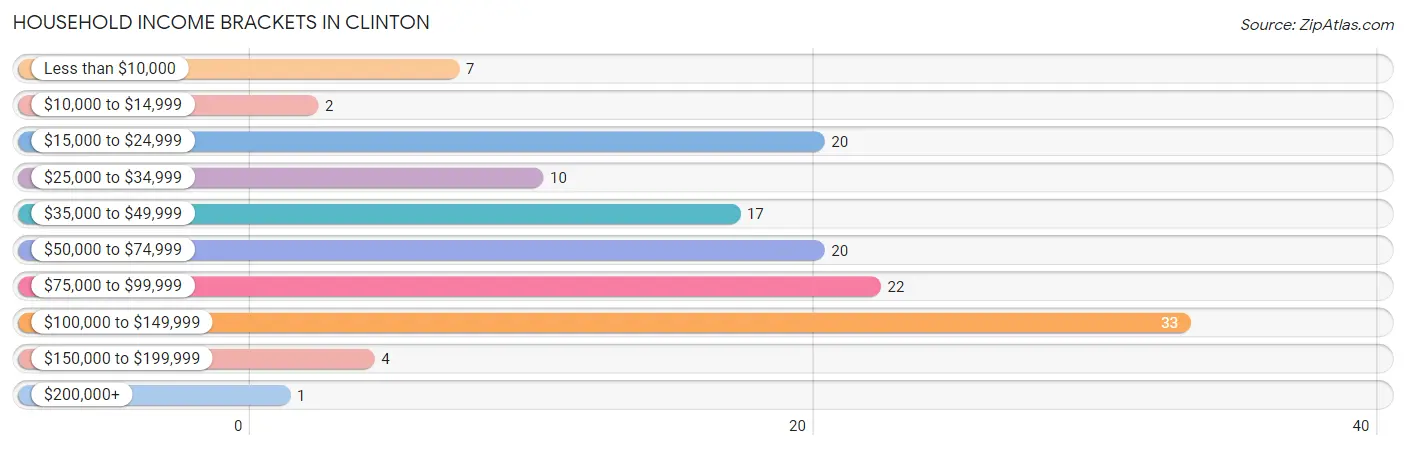
| Income Bracket | # Households | % Households |
| Less than $10,000 | 7 | 5.1% |
| $10,000 to $14,999 | 2 | 1.5% |
| $15,000 to $24,999 | 20 | 14.7% |
| $25,000 to $34,999 | 10 | 7.4% |
| $35,000 to $49,999 | 17 | 12.5% |
| $50,000 to $74,999 | 20 | 14.7% |
| $75,000 to $99,999 | 22 | 16.2% |
| $100,000 to $149,999 | 33 | 24.3% |
| $150,000 to $199,999 | 4 | 2.9% |
| $200,000+ | 1 | 0.7% |
Household Income by Householder Age in Clinton
The median household income in Clinton is $64,444, with the highest median household income of $71,250 found in the 25 to 44 years age bracket for the primary householder. A total of 31 households (22.8%) fall into this category.
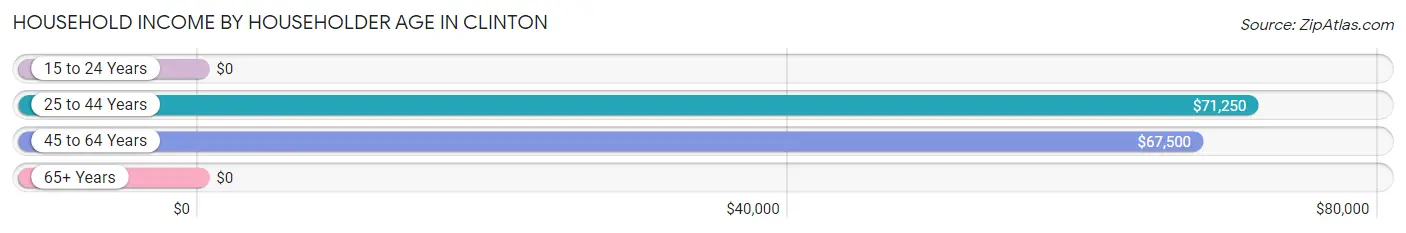
| Income Bracket | # Households | Median Income |
| 15 to 24 Years | 0 (0.0%) | $0 |
| 25 to 44 Years | 31 (22.8%) | $71,250 |
| 45 to 64 Years | 74 (54.4%) | $67,500 |
| 65+ Years | 31 (22.8%) | $0 |
| Total | 136 (100.0%) | $64,444 |
Poverty in Clinton
Income Below Poverty by Sex and Age in Clinton
With 10.5% poverty level for males and 9.4% for females among the residents of Clinton, 6 to 11 year old males and 25 to 34 year old females are the most vulnerable to poverty, with 8 males (88.9%) and 7 females (70.0%) in their respective age groups living below the poverty level.
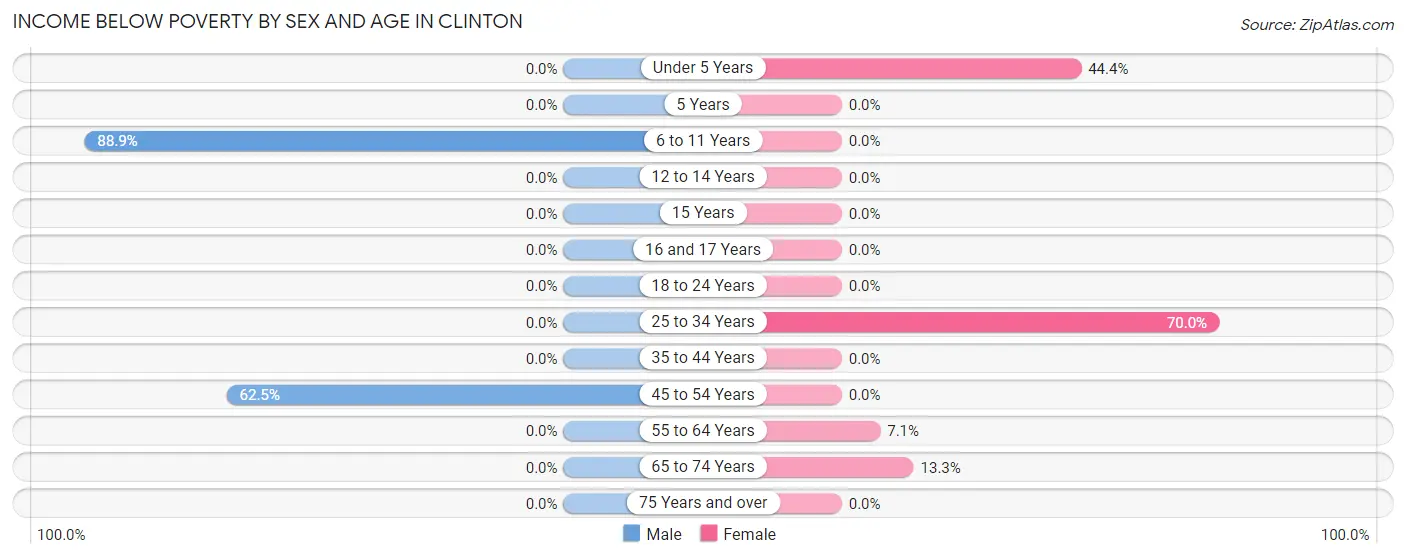
| Age Bracket | Male | Female |
| Under 5 Years | 0 (0.0%) | 4 (44.4%) |
| 5 Years | 0 (0.0%) | 0 (0.0%) |
| 6 to 11 Years | 8 (88.9%) | 0 (0.0%) |
| 12 to 14 Years | 0 (0.0%) | 0 (0.0%) |
| 15 Years | 0 (0.0%) | 0 (0.0%) |
| 16 and 17 Years | 0 (0.0%) | 0 (0.0%) |
| 18 to 24 Years | 0 (0.0%) | 0 (0.0%) |
| 25 to 34 Years | 0 (0.0%) | 7 (70.0%) |
| 35 to 44 Years | 0 (0.0%) | 0 (0.0%) |
| 45 to 54 Years | 5 (62.5%) | 0 (0.0%) |
| 55 to 64 Years | 0 (0.0%) | 2 (7.1%) |
| 65 to 74 Years | 0 (0.0%) | 2 (13.3%) |
| 75 Years and over | 0 (0.0%) | 0 (0.0%) |
| Total | 13 (10.5%) | 15 (9.4%) |
Income Above Poverty by Sex and Age in Clinton
According to the poverty statistics in Clinton, males aged under 5 years and females aged 5 years are the age groups that are most secure financially, with 100.0% of males and 100.0% of females in these age groups living above the poverty line.
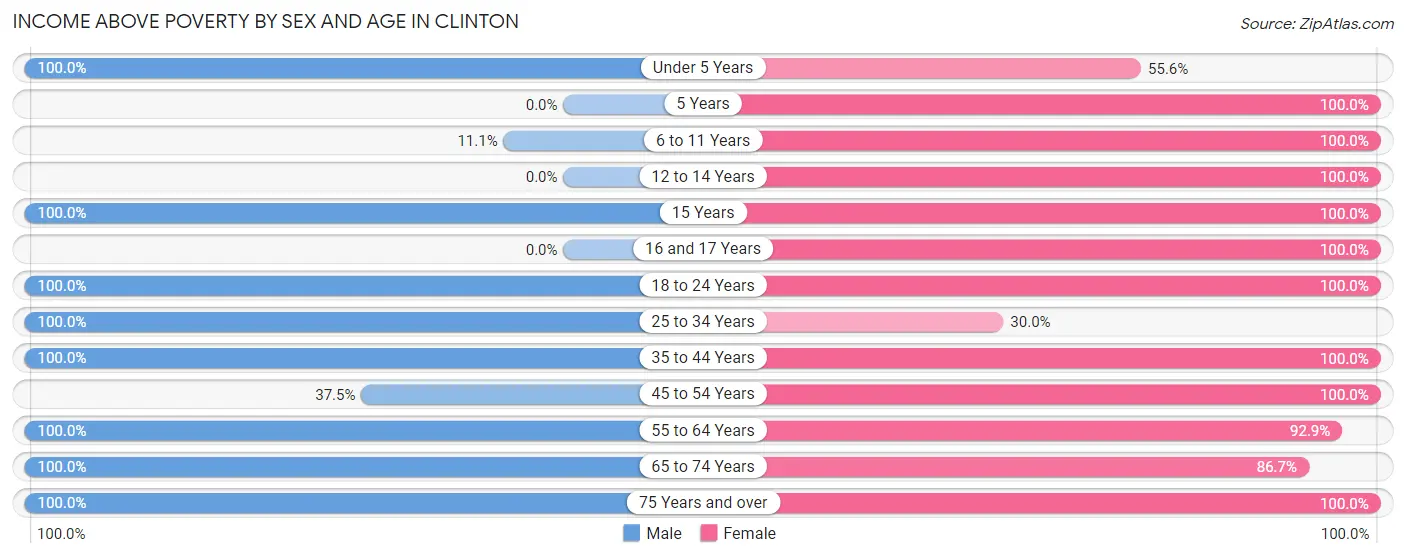
| Age Bracket | Male | Female |
| Under 5 Years | 7 (100.0%) | 5 (55.6%) |
| 5 Years | 0 (0.0%) | 1 (100.0%) |
| 6 to 11 Years | 1 (11.1%) | 17 (100.0%) |
| 12 to 14 Years | 0 (0.0%) | 5 (100.0%) |
| 15 Years | 1 (100.0%) | 3 (100.0%) |
| 16 and 17 Years | 0 (0.0%) | 3 (100.0%) |
| 18 to 24 Years | 2 (100.0%) | 5 (100.0%) |
| 25 to 34 Years | 8 (100.0%) | 3 (30.0%) |
| 35 to 44 Years | 21 (100.0%) | 17 (100.0%) |
| 45 to 54 Years | 3 (37.5%) | 36 (100.0%) |
| 55 to 64 Years | 52 (100.0%) | 26 (92.9%) |
| 65 to 74 Years | 5 (100.0%) | 13 (86.7%) |
| 75 Years and over | 11 (100.0%) | 11 (100.0%) |
| Total | 111 (89.5%) | 145 (90.6%) |
Income Below Poverty Among Married-Couple Families in Clinton
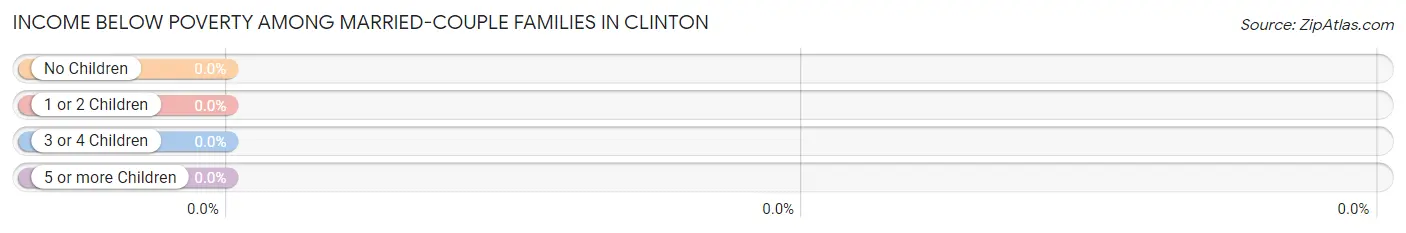
| Children | Above Poverty | Below Poverty |
| No Children | 34 (100.0%) | 0 (0.0%) |
| 1 or 2 Children | 12 (100.0%) | 0 (0.0%) |
| 3 or 4 Children | 5 (100.0%) | 0 (0.0%) |
| 5 or more Children | 0 (0.0%) | 0 (0.0%) |
| Total | 51 (100.0%) | 0 (0.0%) |
Income Below Poverty Among Single-Parent Households in Clinton
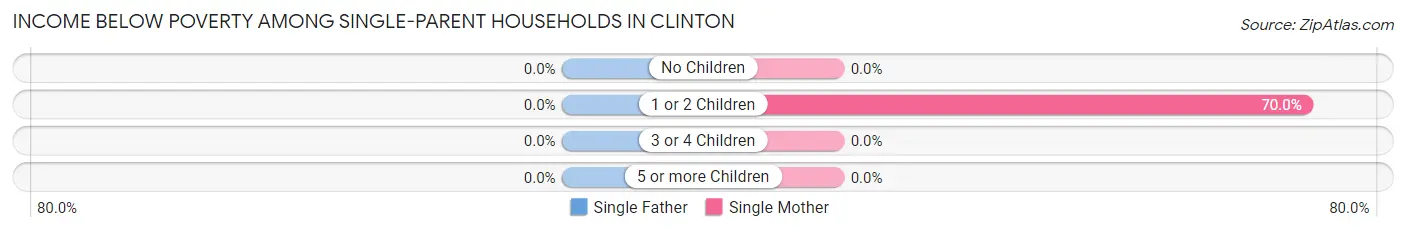
| Children | Single Father | Single Mother |
| No Children | 0 (0.0%) | 0 (0.0%) |
| 1 or 2 Children | 0 (0.0%) | 7 (70.0%) |
| 3 or 4 Children | 0 (0.0%) | 0 (0.0%) |
| 5 or more Children | 0 (0.0%) | 0 (0.0%) |
| Total | 0 (0.0%) | 7 (41.2%) |
Income Below Poverty Among Married-Couple vs Single-Parent Households in Clinton
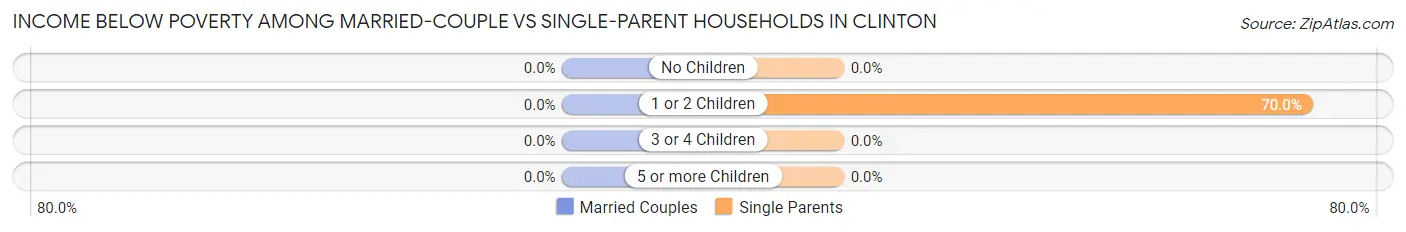
| Children | Married-Couple Families | Single-Parent Households |
| No Children | 0 (0.0%) | 0 (0.0%) |
| 1 or 2 Children | 0 (0.0%) | 7 (70.0%) |
| 3 or 4 Children | 0 (0.0%) | 0 (0.0%) |
| 5 or more Children | 0 (0.0%) | 0 (0.0%) |
| Total | 0 (0.0%) | 7 (41.2%) |
Employment Characteristics in Clinton
Employment by Class of Employer in Clinton
Among the 160 employed individuals in Clinton, private company employees (79 | 49.4%), not-for-profit organizations (46 | 28.7%), and self-employed (incorporated) (17 | 10.6%) make up the most common classes of employment.
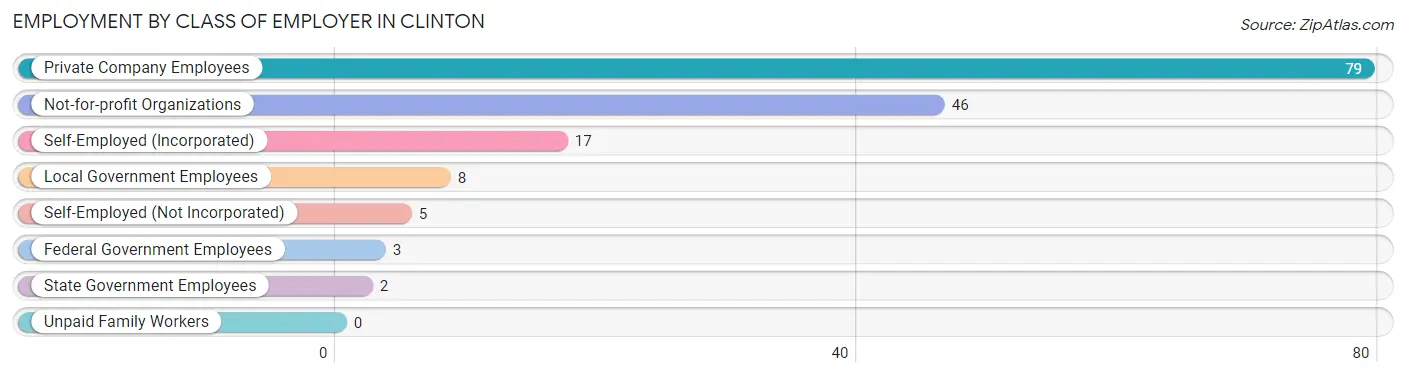
| Employer Class | # Employees | % Employees |
| Private Company Employees | 79 | 49.4% |
| Self-Employed (Incorporated) | 17 | 10.6% |
| Self-Employed (Not Incorporated) | 5 | 3.1% |
| Not-for-profit Organizations | 46 | 28.7% |
| Local Government Employees | 8 | 5.0% |
| State Government Employees | 2 | 1.3% |
| Federal Government Employees | 3 | 1.9% |
| Unpaid Family Workers | 0 | 0.0% |
| Total | 160 | 100.0% |
Employment Status by Age in Clinton
According to the labor force statistics for Clinton, out of the total population over 16 years of age (232), 70.3% or 163 individuals are in the labor force, with 1.8% or 3 of them unemployed. The age group with the highest labor force participation rate is 20 to 24 years, with 100.0% or 2 individuals in the labor force. Within the labor force, the 16 to 19 years age range has the highest percentage of unemployed individuals, with 50.0% or 3 of them being unemployed.
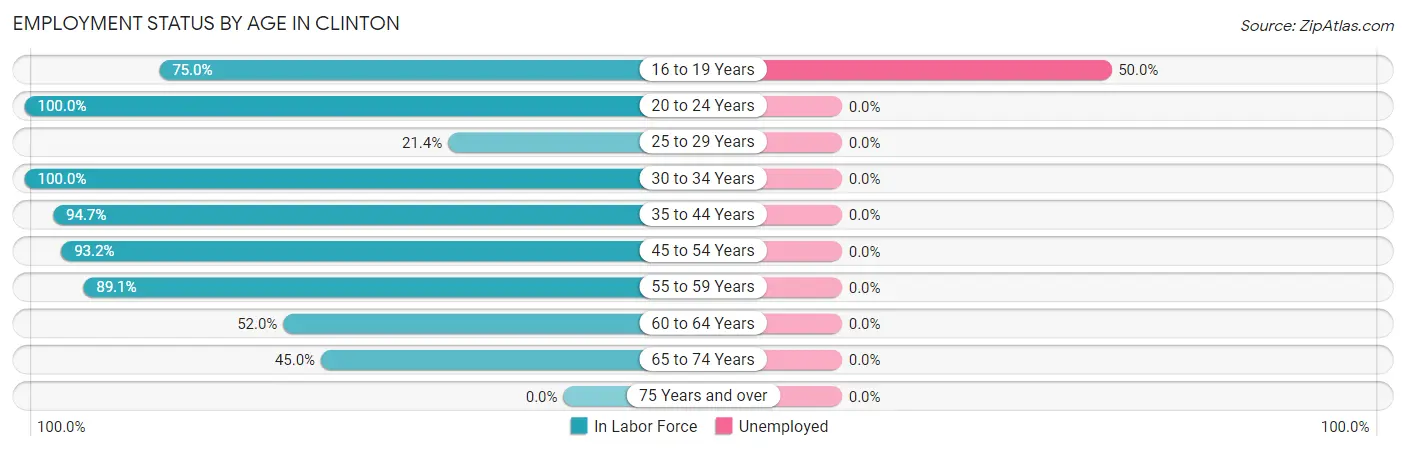
| Age Bracket | In Labor Force | Unemployed |
| 16 to 19 Years | 6 (75.0%) | 3 (50.0%) |
| 20 to 24 Years | 2 (100.0%) | 0 (0.0%) |
| 25 to 29 Years | 3 (21.4%) | 0 (0.0%) |
| 30 to 34 Years | 4 (100.0%) | 0 (0.0%) |
| 35 to 44 Years | 36 (94.7%) | 0 (0.0%) |
| 45 to 54 Years | 41 (93.2%) | 0 (0.0%) |
| 55 to 59 Years | 49 (89.1%) | 0 (0.0%) |
| 60 to 64 Years | 13 (52.0%) | 0 (0.0%) |
| 65 to 74 Years | 9 (45.0%) | 0 (0.0%) |
| 75 Years and over | 0 (0.0%) | 0 (0.0%) |
| Total | 163 (70.3%) | 3 (1.8%) |
Employment Status by Educational Attainment in Clinton
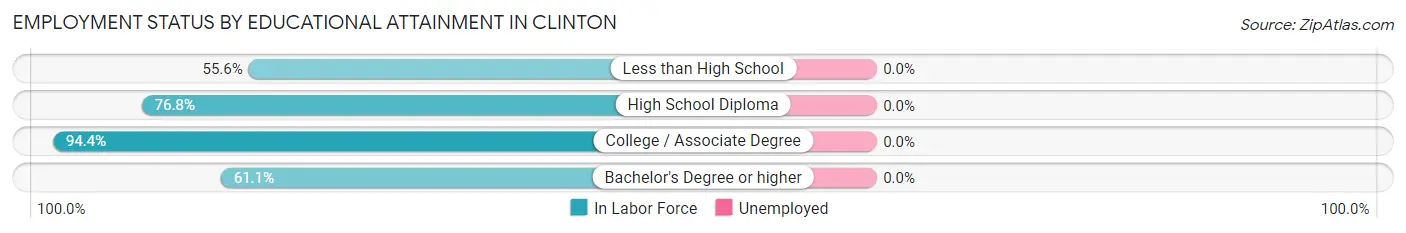
| Educational Attainment | In Labor Force | Unemployed |
| Less than High School | 5 (55.6%) | 0 (0.0%) |
| High School Diploma | 63 (76.8%) | 0 (0.0%) |
| College / Associate Degree | 67 (94.4%) | 0 (0.0%) |
| Bachelor's Degree or higher | 11 (61.1%) | 0 (0.0%) |
| Total | 146 (81.1%) | 0 (0.0%) |
Employment Occupations by Sex in Clinton
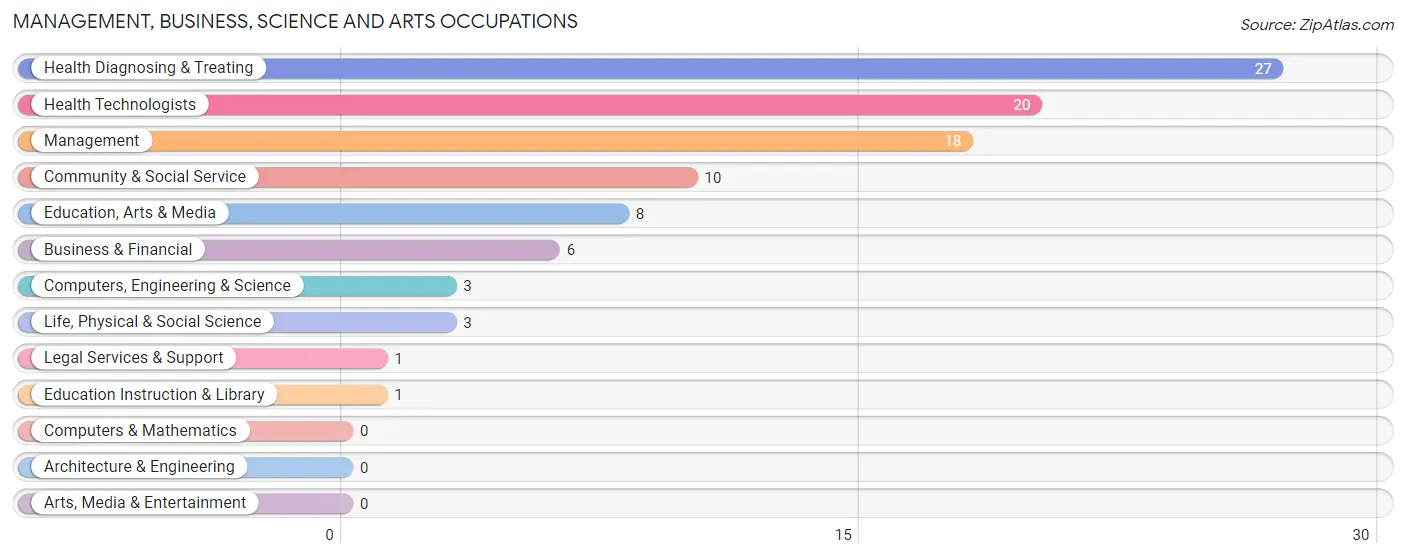
Management, Business, Science and Arts Occupations
The most common Management, Business, Science and Arts occupations in Clinton are Health Diagnosing & Treating (27 | 16.9%), Health Technologists (20 | 12.5%), Management (18 | 11.3%), Community & Social Service (10 | 6.2%), and Education, Arts & Media (8 | 5.0%).
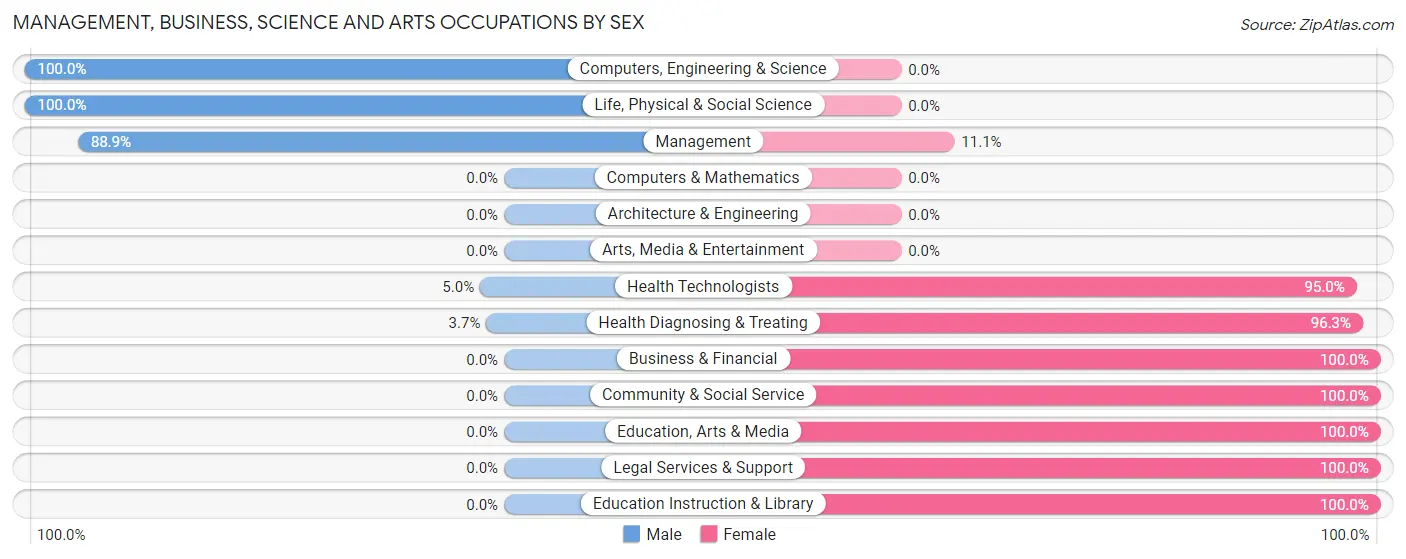
Management, Business, Science and Arts Occupations by Sex
Within the Management, Business, Science and Arts occupations in Clinton, the most male-oriented occupations are Computers, Engineering & Science (100.0%), Life, Physical & Social Science (100.0%), and Management (88.9%), while the most female-oriented occupations are Business & Financial (100.0%), Community & Social Service (100.0%), and Education, Arts & Media (100.0%).
| Occupation | Male | Female |
| Management | 16 (88.9%) | 2 (11.1%) |
| Business & Financial | 0 (0.0%) | 6 (100.0%) |
| Computers, Engineering & Science | 3 (100.0%) | 0 (0.0%) |
| Computers & Mathematics | 0 (0.0%) | 0 (0.0%) |
| Architecture & Engineering | 0 (0.0%) | 0 (0.0%) |
| Life, Physical & Social Science | 3 (100.0%) | 0 (0.0%) |
| Community & Social Service | 0 (0.0%) | 10 (100.0%) |
| Education, Arts & Media | 0 (0.0%) | 8 (100.0%) |
| Legal Services & Support | 0 (0.0%) | 1 (100.0%) |
| Education Instruction & Library | 0 (0.0%) | 1 (100.0%) |
| Arts, Media & Entertainment | 0 (0.0%) | 0 (0.0%) |
| Health Diagnosing & Treating | 1 (3.7%) | 26 (96.3%) |
| Health Technologists | 1 (5.0%) | 19 (95.0%) |
| Total (Category) | 20 (31.2%) | 44 (68.8%) |
| Total (Overall) | 81 (50.6%) | 79 (49.4%) |
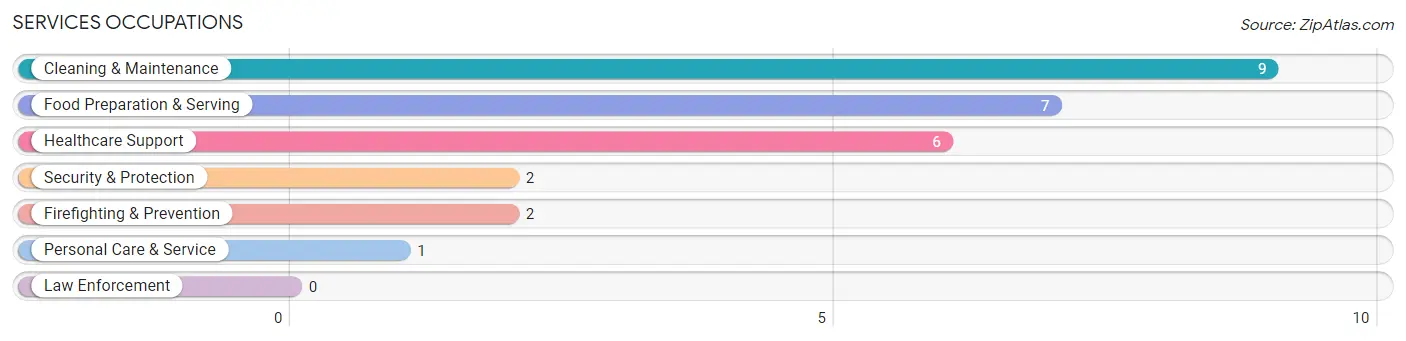
Services Occupations
The most common Services occupations in Clinton are Cleaning & Maintenance (9 | 5.6%), Food Preparation & Serving (7 | 4.4%), Healthcare Support (6 | 3.7%), Security & Protection (2 | 1.3%), and Firefighting & Prevention (2 | 1.3%).
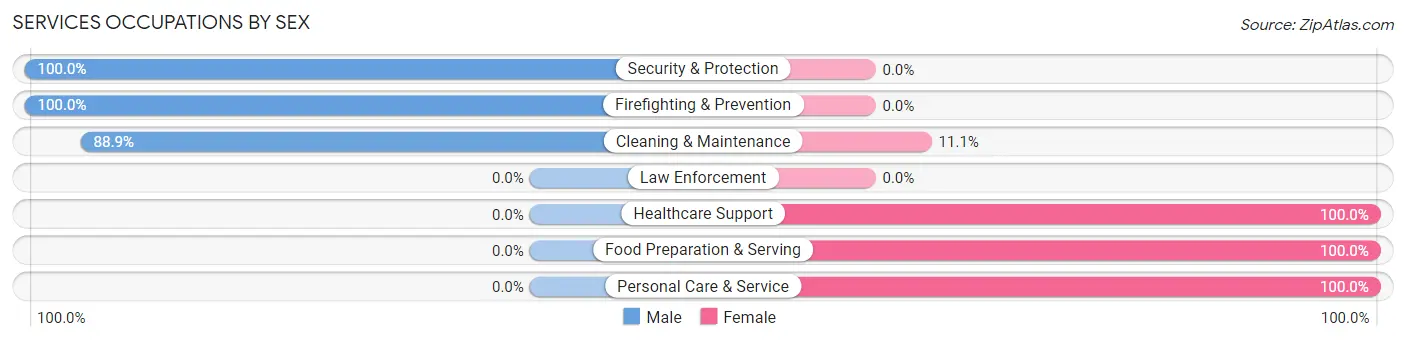
Services Occupations by Sex
Within the Services occupations in Clinton, the most male-oriented occupations are Security & Protection (100.0%), Firefighting & Prevention (100.0%), and Cleaning & Maintenance (88.9%), while the most female-oriented occupations are Healthcare Support (100.0%), Food Preparation & Serving (100.0%), and Personal Care & Service (100.0%).
| Occupation | Male | Female |
| Healthcare Support | 0 (0.0%) | 6 (100.0%) |
| Security & Protection | 2 (100.0%) | 0 (0.0%) |
| Firefighting & Prevention | 2 (100.0%) | 0 (0.0%) |
| Law Enforcement | 0 (0.0%) | 0 (0.0%) |
| Food Preparation & Serving | 0 (0.0%) | 7 (100.0%) |
| Cleaning & Maintenance | 8 (88.9%) | 1 (11.1%) |
| Personal Care & Service | 0 (0.0%) | 1 (100.0%) |
| Total (Category) | 10 (40.0%) | 15 (60.0%) |
| Total (Overall) | 81 (50.6%) | 79 (49.4%) |
Sales and Office Occupations
The most common Sales and Office occupations in Clinton are Office & Administration (14 | 8.7%), and Sales & Related (4 | 2.5%).
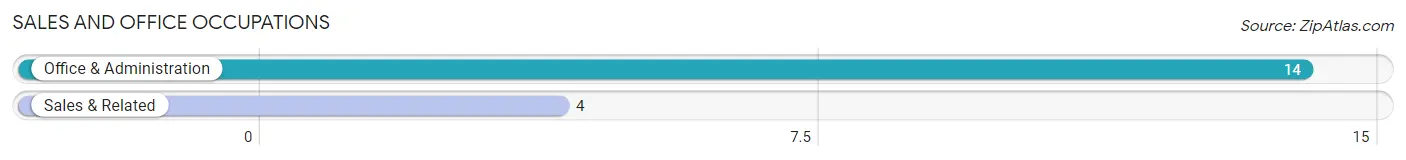
Sales and Office Occupations by Sex
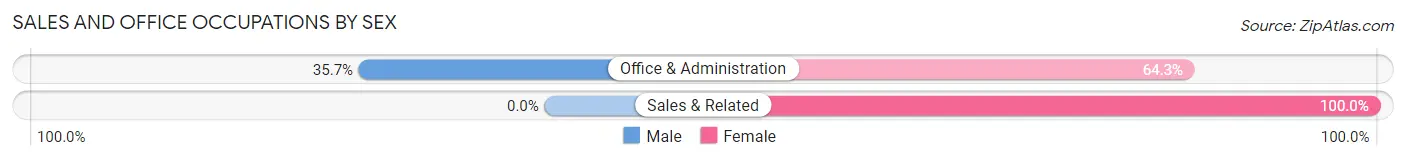
| Occupation | Male | Female |
| Sales & Related | 0 (0.0%) | 4 (100.0%) |
| Office & Administration | 5 (35.7%) | 9 (64.3%) |
| Total (Category) | 5 (27.8%) | 13 (72.2%) |
| Total (Overall) | 81 (50.6%) | 79 (49.4%) |
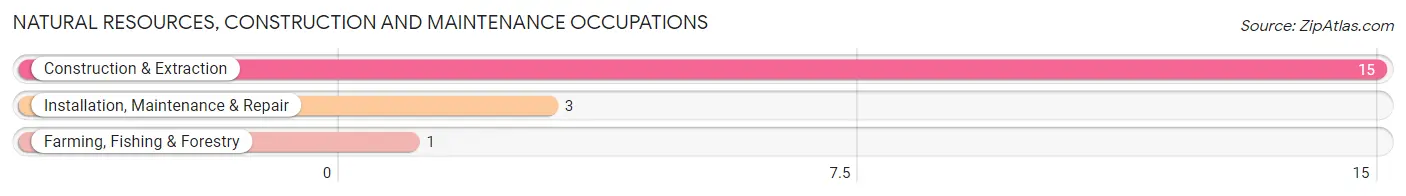
Natural Resources, Construction and Maintenance Occupations
The most common Natural Resources, Construction and Maintenance occupations in Clinton are Construction & Extraction (15 | 9.4%), Installation, Maintenance & Repair (3 | 1.9%), and Farming, Fishing & Forestry (1 | 0.6%).
Natural Resources, Construction and Maintenance Occupations by Sex
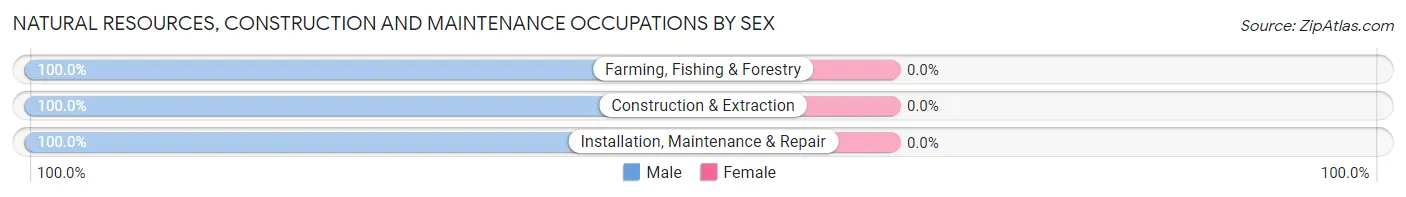
| Occupation | Male | Female |
| Farming, Fishing & Forestry | 1 (100.0%) | 0 (0.0%) |
| Construction & Extraction | 15 (100.0%) | 0 (0.0%) |
| Installation, Maintenance & Repair | 3 (100.0%) | 0 (0.0%) |
| Total (Category) | 19 (100.0%) | 0 (0.0%) |
| Total (Overall) | 81 (50.6%) | 79 (49.4%) |
Production, Transportation and Moving Occupations
The most common Production, Transportation and Moving occupations in Clinton are Material Moving (22 | 13.8%), Production (8 | 5.0%), and Transportation (4 | 2.5%).
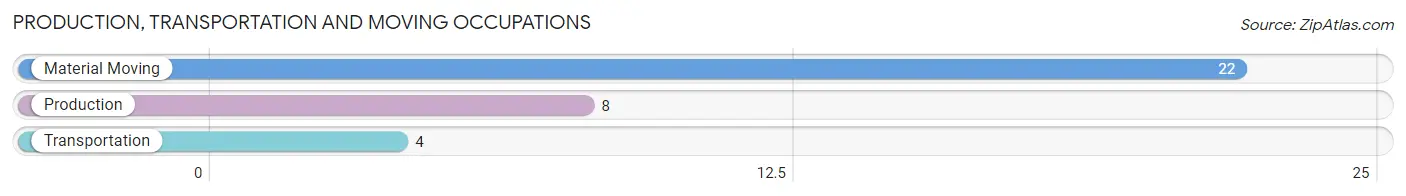
Production, Transportation and Moving Occupations by Sex
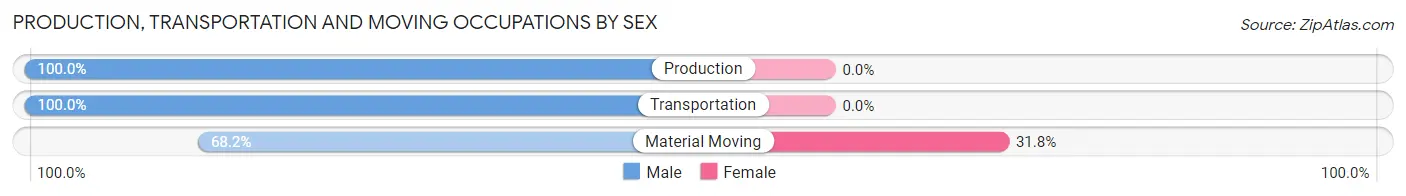
| Occupation | Male | Female |
| Production | 8 (100.0%) | 0 (0.0%) |
| Transportation | 4 (100.0%) | 0 (0.0%) |
| Material Moving | 15 (68.2%) | 7 (31.8%) |
| Total (Category) | 27 (79.4%) | 7 (20.6%) |
| Total (Overall) | 81 (50.6%) | 79 (49.4%) |
Employment Industries by Sex in Clinton
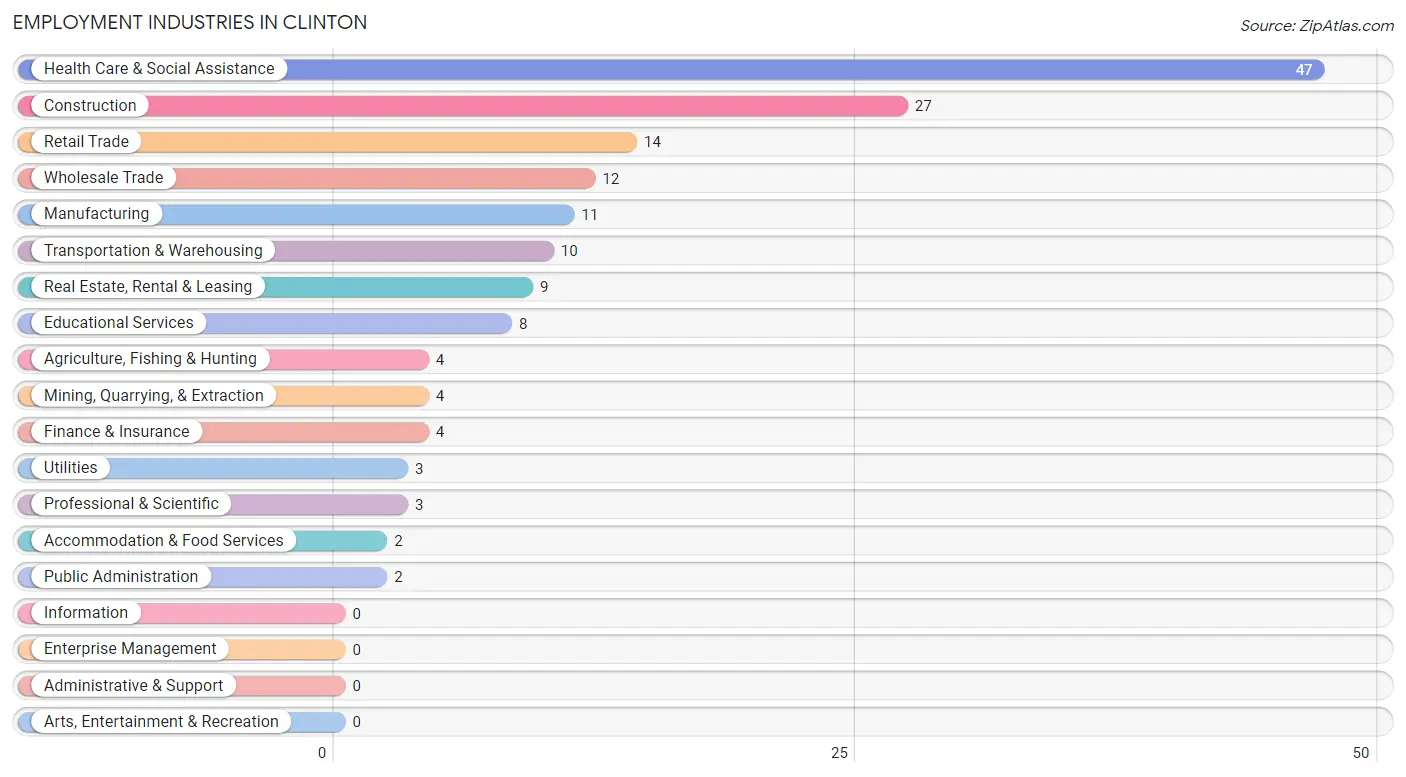
Employment Industries in Clinton
The major employment industries in Clinton include Health Care & Social Assistance (47 | 29.4%), Construction (27 | 16.9%), Retail Trade (14 | 8.7%), Wholesale Trade (12 | 7.5%), and Manufacturing (11 | 6.9%).
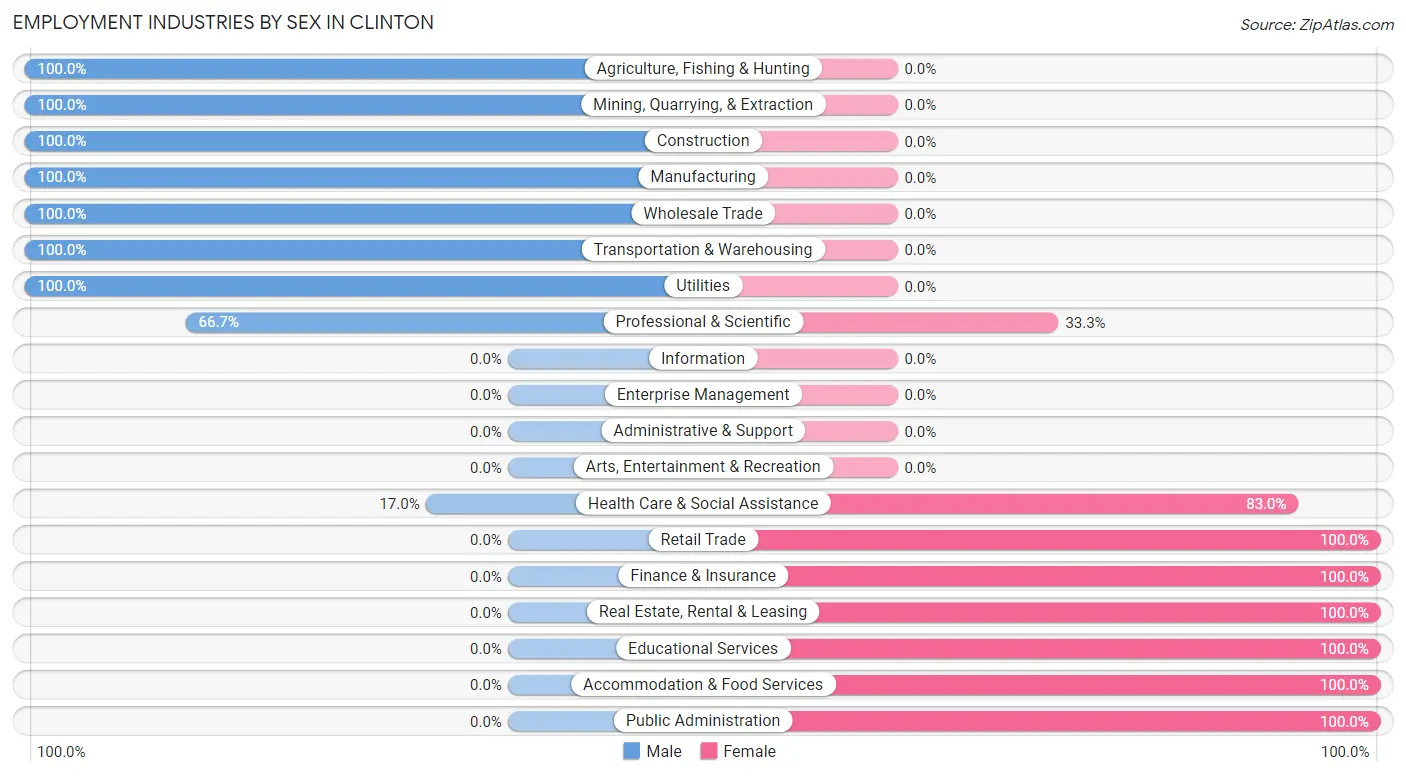
Employment Industries by Sex in Clinton
The Clinton industries that see more men than women are Agriculture, Fishing & Hunting (100.0%), Mining, Quarrying, & Extraction (100.0%), and Construction (100.0%), whereas the industries that tend to have a higher number of women are Retail Trade (100.0%), Finance & Insurance (100.0%), and Real Estate, Rental & Leasing (100.0%).
| Industry | Male | Female |
| Agriculture, Fishing & Hunting | 4 (100.0%) | 0 (0.0%) |
| Mining, Quarrying, & Extraction | 4 (100.0%) | 0 (0.0%) |
| Construction | 27 (100.0%) | 0 (0.0%) |
| Manufacturing | 11 (100.0%) | 0 (0.0%) |
| Wholesale Trade | 12 (100.0%) | 0 (0.0%) |
| Retail Trade | 0 (0.0%) | 14 (100.0%) |
| Transportation & Warehousing | 10 (100.0%) | 0 (0.0%) |
| Utilities | 3 (100.0%) | 0 (0.0%) |
| Information | 0 (0.0%) | 0 (0.0%) |
| Finance & Insurance | 0 (0.0%) | 4 (100.0%) |
| Real Estate, Rental & Leasing | 0 (0.0%) | 9 (100.0%) |
| Professional & Scientific | 2 (66.7%) | 1 (33.3%) |
| Enterprise Management | 0 (0.0%) | 0 (0.0%) |
| Administrative & Support | 0 (0.0%) | 0 (0.0%) |
| Educational Services | 0 (0.0%) | 8 (100.0%) |
| Health Care & Social Assistance | 8 (17.0%) | 39 (83.0%) |
| Arts, Entertainment & Recreation | 0 (0.0%) | 0 (0.0%) |
| Accommodation & Food Services | 0 (0.0%) | 2 (100.0%) |
| Public Administration | 0 (0.0%) | 2 (100.0%) |
| Total | 81 (50.6%) | 79 (49.4%) |
Education in Clinton
School Enrollment in Clinton
The most common levels of schooling among the 51 students in Clinton are elementary school (26 | 51.0%), high school (7 | 13.7%), and college / undergraduate (7 | 13.7%).
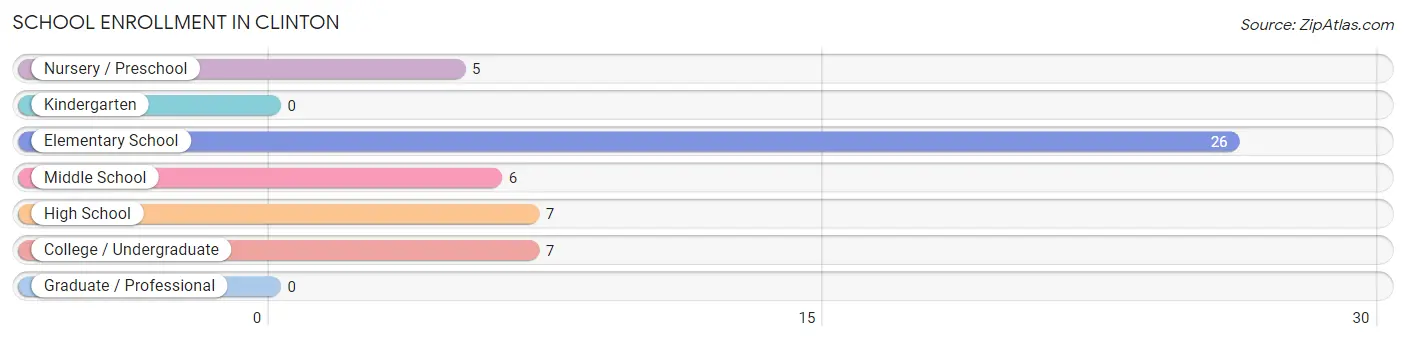
| School Level | # Students | % Students |
| Nursery / Preschool | 5 | 9.8% |
| Kindergarten | 0 | 0.0% |
| Elementary School | 26 | 51.0% |
| Middle School | 6 | 11.8% |
| High School | 7 | 13.7% |
| College / Undergraduate | 7 | 13.7% |
| Graduate / Professional | 0 | 0.0% |
| Total | 51 | 100.0% |
School Enrollment by Age by Funding Source in Clinton
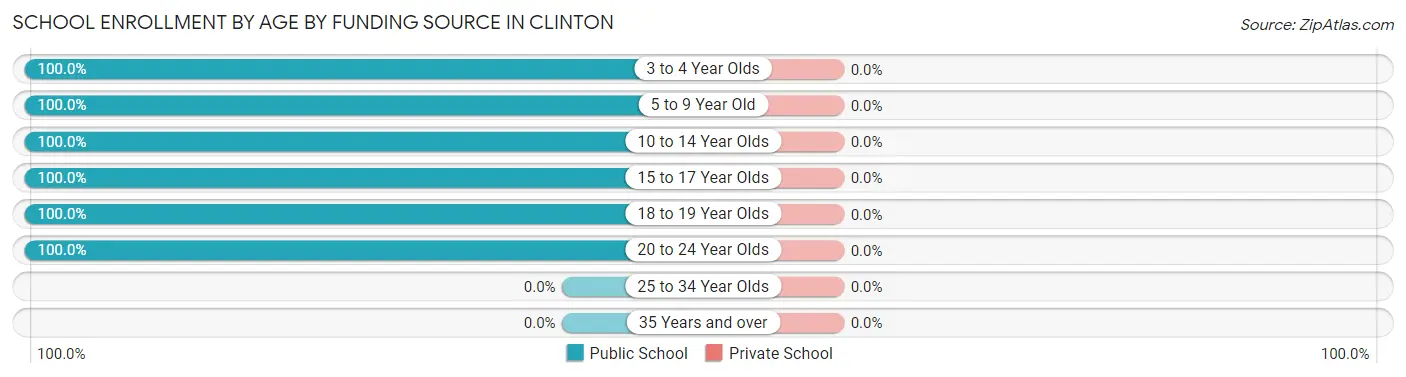
| Age Bracket | Public School | Private School |
| 3 to 4 Year Olds | 5 (100.0%) | 0 (0.0%) |
| 5 to 9 Year Old | 16 (100.0%) | 0 (0.0%) |
| 10 to 14 Year Olds | 16 (100.0%) | 0 (0.0%) |
| 15 to 17 Year Olds | 7 (100.0%) | 0 (0.0%) |
| 18 to 19 Year Olds | 5 (100.0%) | 0 (0.0%) |
| 20 to 24 Year Olds | 2 (100.0%) | 0 (0.0%) |
| 25 to 34 Year Olds | 0 (0.0%) | 0 (0.0%) |
| 35 Years and over | 0 (0.0%) | 0 (0.0%) |
| Total | 51 (100.0%) | 0 (0.0%) |
Educational Attainment by Field of Study in Clinton
Science & technology (14 | 48.3%), education (7 | 24.1%), psychology (2 | 6.9%), business (2 | 6.9%), and literature & languages (2 | 6.9%) are the most common fields of study among 29 individuals in Clinton who have obtained a bachelor's degree or higher.
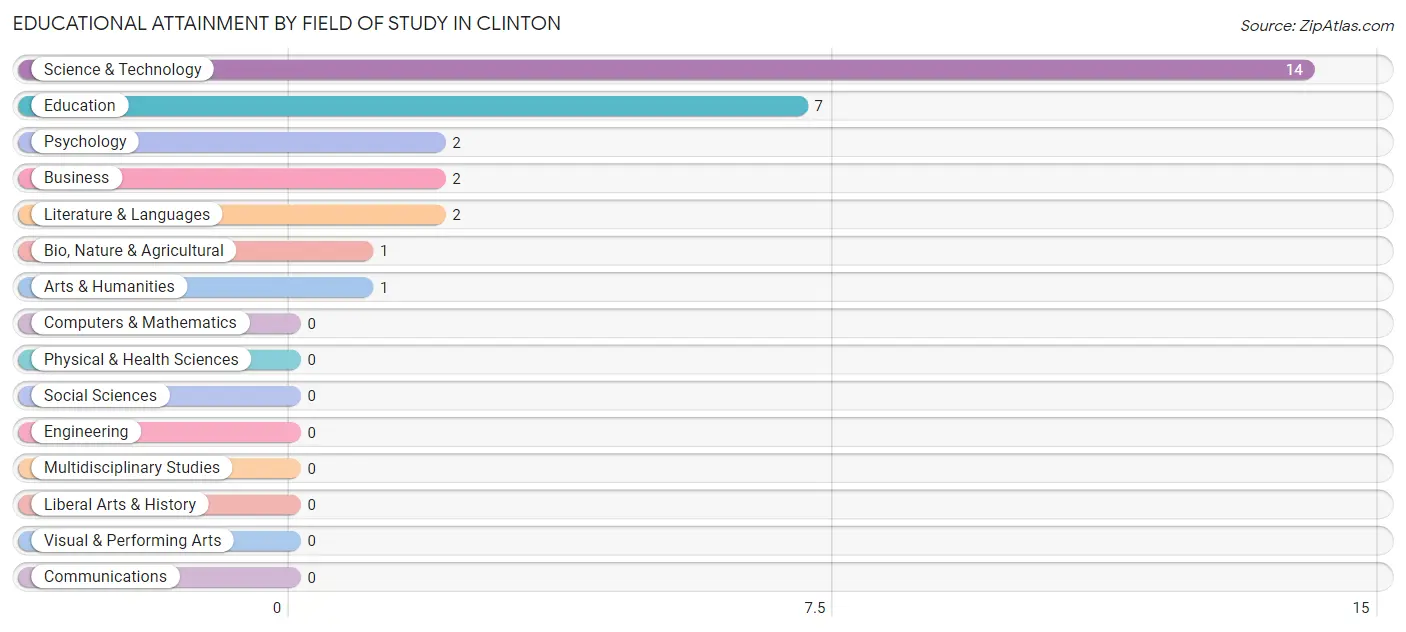
| Field of Study | # Graduates | % Graduates |
| Computers & Mathematics | 0 | 0.0% |
| Bio, Nature & Agricultural | 1 | 3.5% |
| Physical & Health Sciences | 0 | 0.0% |
| Psychology | 2 | 6.9% |
| Social Sciences | 0 | 0.0% |
| Engineering | 0 | 0.0% |
| Multidisciplinary Studies | 0 | 0.0% |
| Science & Technology | 14 | 48.3% |
| Business | 2 | 6.9% |
| Education | 7 | 24.1% |
| Literature & Languages | 2 | 6.9% |
| Liberal Arts & History | 0 | 0.0% |
| Visual & Performing Arts | 0 | 0.0% |
| Communications | 0 | 0.0% |
| Arts & Humanities | 1 | 3.5% |
| Total | 29 | 100.0% |
Transportation & Commute in Clinton
Vehicle Availability by Sex in Clinton
The most prevalent vehicle ownership categories in Clinton are males with 2 vehicles (53, accounting for 69.7%) and females with 2 vehicles (36, making up 67.1%).
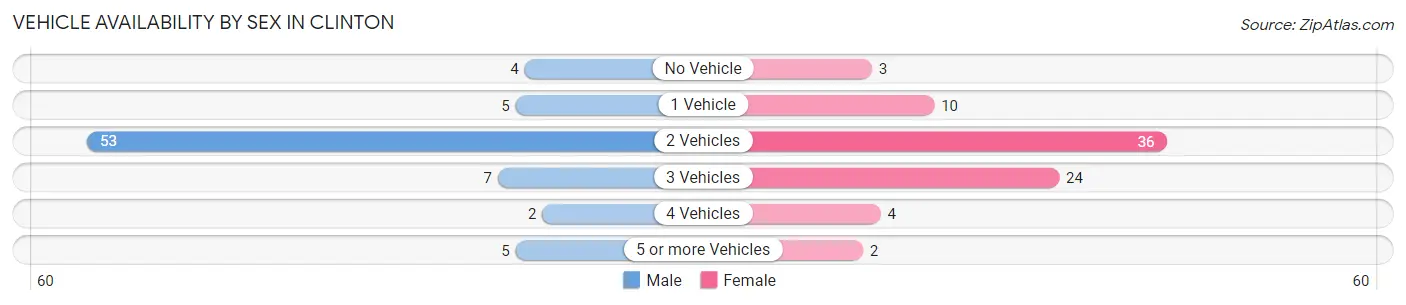
| Vehicles Available | Male | Female |
| No Vehicle | 4 (5.3%) | 3 (3.8%) |
| 1 Vehicle | 5 (6.6%) | 10 (12.7%) |
| 2 Vehicles | 53 (69.7%) | 36 (45.6%) |
| 3 Vehicles | 7 (9.2%) | 24 (30.4%) |
| 4 Vehicles | 2 (2.6%) | 4 (5.1%) |
| 5 or more Vehicles | 5 (6.6%) | 2 (2.5%) |
| Total | 76 (100.0%) | 79 (100.0%) |
Commute Time in Clinton
The most frequently occuring commute durations in Clinton are 15 to 19 minutes (37 commuters, 29.4%), 30 to 34 minutes (21 commuters, 16.7%), and 5 to 9 minutes (20 commuters, 15.9%).
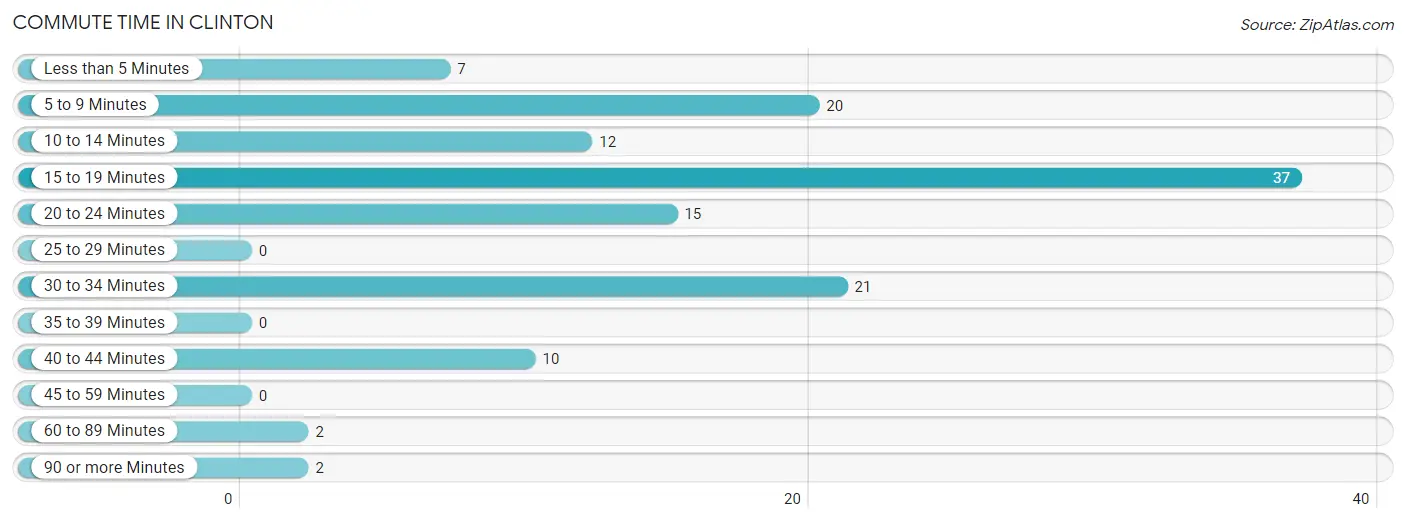
| Commute Time | # Commuters | % Commuters |
| Less than 5 Minutes | 7 | 5.6% |
| 5 to 9 Minutes | 20 | 15.9% |
| 10 to 14 Minutes | 12 | 9.5% |
| 15 to 19 Minutes | 37 | 29.4% |
| 20 to 24 Minutes | 15 | 11.9% |
| 25 to 29 Minutes | 0 | 0.0% |
| 30 to 34 Minutes | 21 | 16.7% |
| 35 to 39 Minutes | 0 | 0.0% |
| 40 to 44 Minutes | 10 | 7.9% |
| 45 to 59 Minutes | 0 | 0.0% |
| 60 to 89 Minutes | 2 | 1.6% |
| 90 or more Minutes | 2 | 1.6% |
Commute Time by Sex in Clinton
The most common commute times in Clinton are 15 to 19 minutes (17 commuters, 29.8%) for males and 15 to 19 minutes (20 commuters, 29.0%) for females.
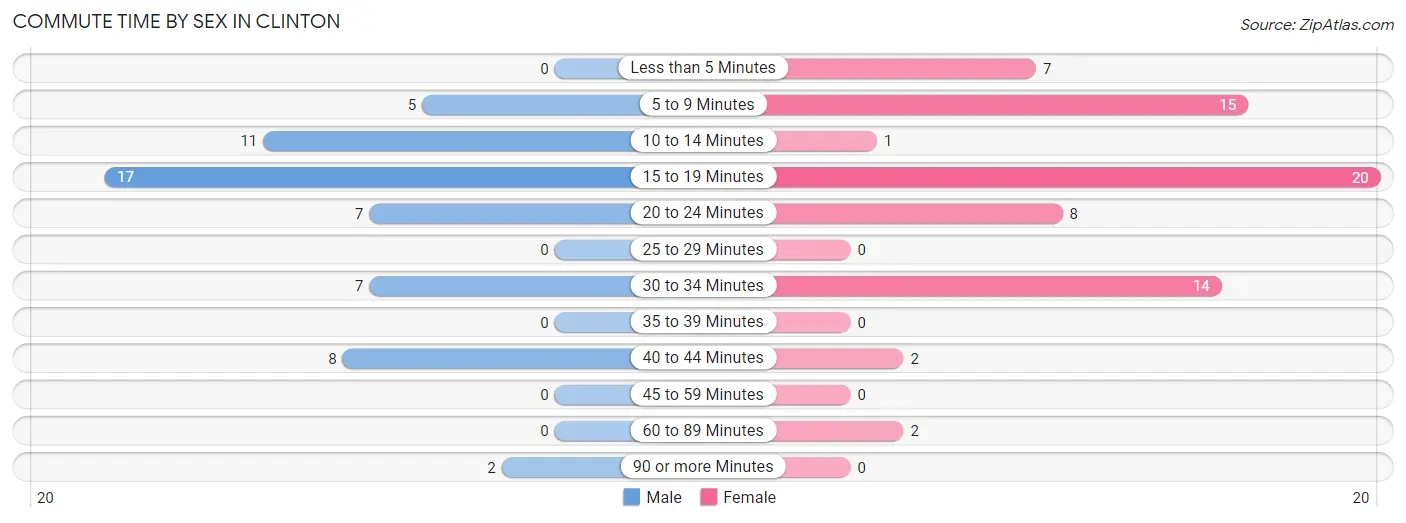
| Commute Time | Male | Female |
| Less than 5 Minutes | 0 (0.0%) | 7 (10.1%) |
| 5 to 9 Minutes | 5 (8.8%) | 15 (21.7%) |
| 10 to 14 Minutes | 11 (19.3%) | 1 (1.5%) |
| 15 to 19 Minutes | 17 (29.8%) | 20 (29.0%) |
| 20 to 24 Minutes | 7 (12.3%) | 8 (11.6%) |
| 25 to 29 Minutes | 0 (0.0%) | 0 (0.0%) |
| 30 to 34 Minutes | 7 (12.3%) | 14 (20.3%) |
| 35 to 39 Minutes | 0 (0.0%) | 0 (0.0%) |
| 40 to 44 Minutes | 8 (14.0%) | 2 (2.9%) |
| 45 to 59 Minutes | 0 (0.0%) | 0 (0.0%) |
| 60 to 89 Minutes | 0 (0.0%) | 2 (2.9%) |
| 90 or more Minutes | 2 (3.5%) | 0 (0.0%) |
Time of Departure to Work by Sex in Clinton
The most frequent times of departure to work in Clinton are 7:30 AM to 7:59 AM (13, 22.8%) for males and 6:00 AM to 6:29 AM (22, 31.9%) for females.
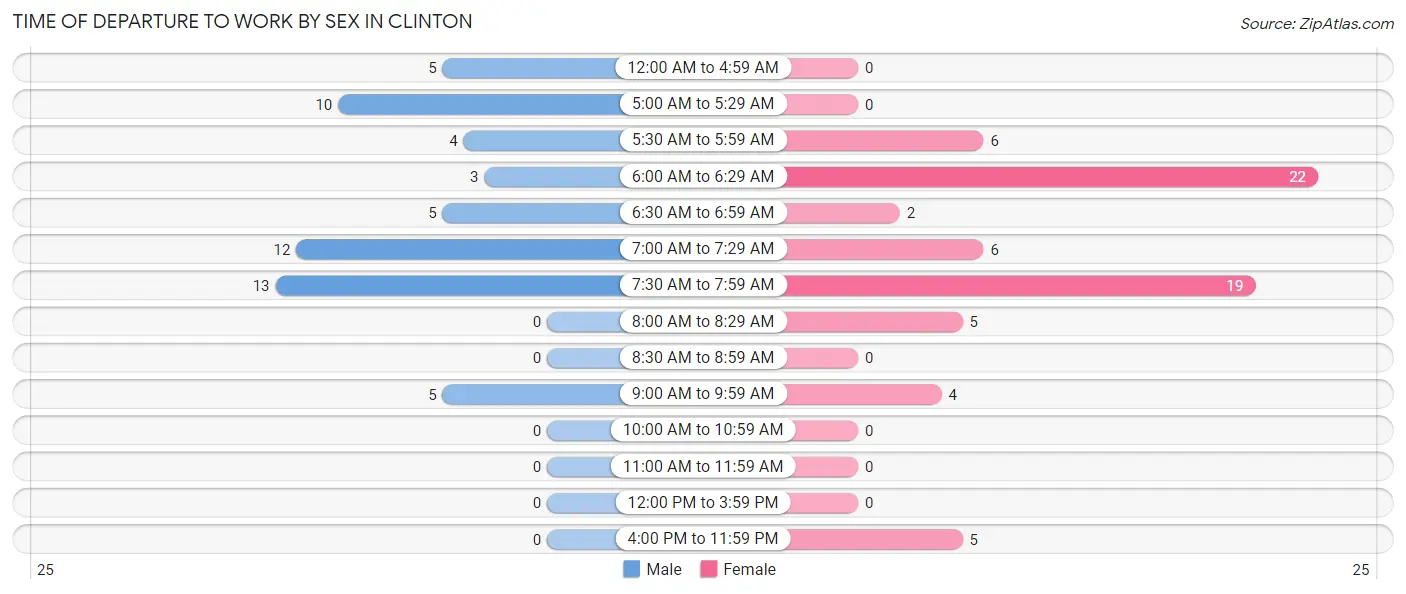
| Time of Departure | Male | Female |
| 12:00 AM to 4:59 AM | 5 (8.8%) | 0 (0.0%) |
| 5:00 AM to 5:29 AM | 10 (17.5%) | 0 (0.0%) |
| 5:30 AM to 5:59 AM | 4 (7.0%) | 6 (8.7%) |
| 6:00 AM to 6:29 AM | 3 (5.3%) | 22 (31.9%) |
| 6:30 AM to 6:59 AM | 5 (8.8%) | 2 (2.9%) |
| 7:00 AM to 7:29 AM | 12 (21.0%) | 6 (8.7%) |
| 7:30 AM to 7:59 AM | 13 (22.8%) | 19 (27.5%) |
| 8:00 AM to 8:29 AM | 0 (0.0%) | 5 (7.2%) |
| 8:30 AM to 8:59 AM | 0 (0.0%) | 0 (0.0%) |
| 9:00 AM to 9:59 AM | 5 (8.8%) | 4 (5.8%) |
| 10:00 AM to 10:59 AM | 0 (0.0%) | 0 (0.0%) |
| 11:00 AM to 11:59 AM | 0 (0.0%) | 0 (0.0%) |
| 12:00 PM to 3:59 PM | 0 (0.0%) | 0 (0.0%) |
| 4:00 PM to 11:59 PM | 0 (0.0%) | 5 (7.2%) |
| Total | 57 (100.0%) | 69 (100.0%) |
Housing Occupancy in Clinton
Occupancy by Ownership in Clinton
Of the total 136 dwellings in Clinton, owner-occupied units account for 106 (77.9%), while renter-occupied units make up 30 (22.1%).
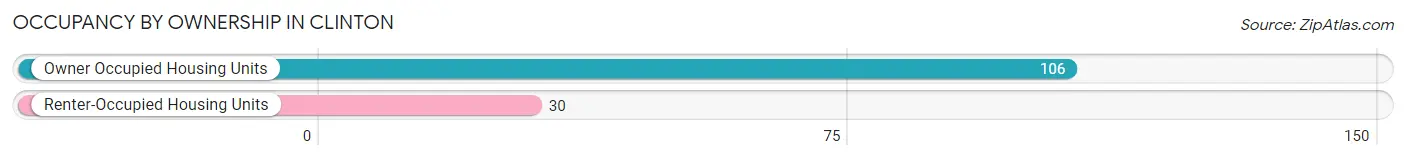
| Occupancy | # Housing Units | % Housing Units |
| Owner Occupied Housing Units | 106 | 77.9% |
| Renter-Occupied Housing Units | 30 | 22.1% |
| Total Occupied Housing Units | 136 | 100.0% |
Occupancy by Household Size in Clinton
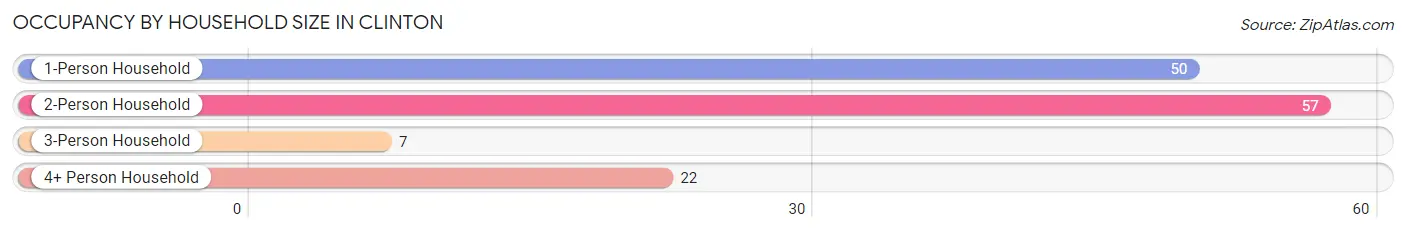
| Household Size | # Housing Units | % Housing Units |
| 1-Person Household | 50 | 36.8% |
| 2-Person Household | 57 | 41.9% |
| 3-Person Household | 7 | 5.1% |
| 4+ Person Household | 22 | 16.2% |
| Total Housing Units | 136 | 100.0% |
Occupancy by Ownership by Household Size in Clinton
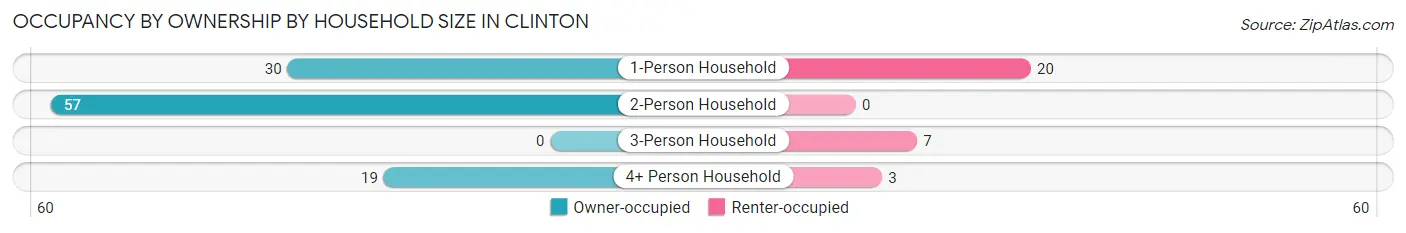
| Household Size | Owner-occupied | Renter-occupied |
| 1-Person Household | 30 (60.0%) | 20 (40.0%) |
| 2-Person Household | 57 (100.0%) | 0 (0.0%) |
| 3-Person Household | 0 (0.0%) | 7 (100.0%) |
| 4+ Person Household | 19 (86.4%) | 3 (13.6%) |
| Total Housing Units | 106 (77.9%) | 30 (22.1%) |
Occupancy by Educational Attainment in Clinton
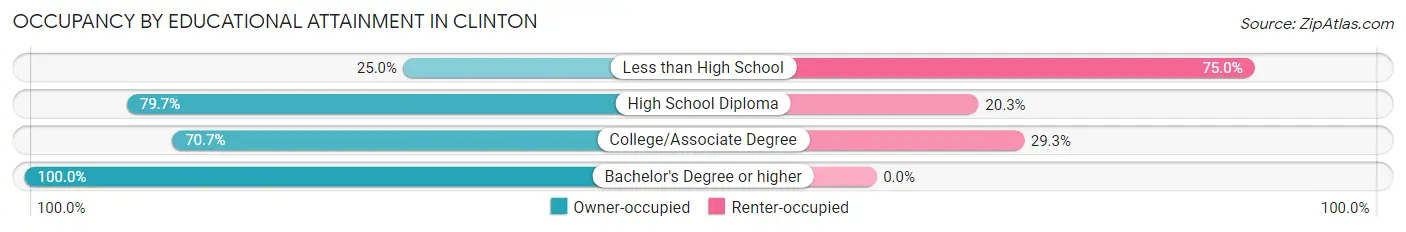
| Household Size | Owner-occupied | Renter-occupied |
| Less than High School | 1 (25.0%) | 3 (75.0%) |
| High School Diploma | 59 (79.7%) | 15 (20.3%) |
| College/Associate Degree | 29 (70.7%) | 12 (29.3%) |
| Bachelor's Degree or higher | 17 (100.0%) | 0 (0.0%) |
Occupancy by Age of Householder in Clinton
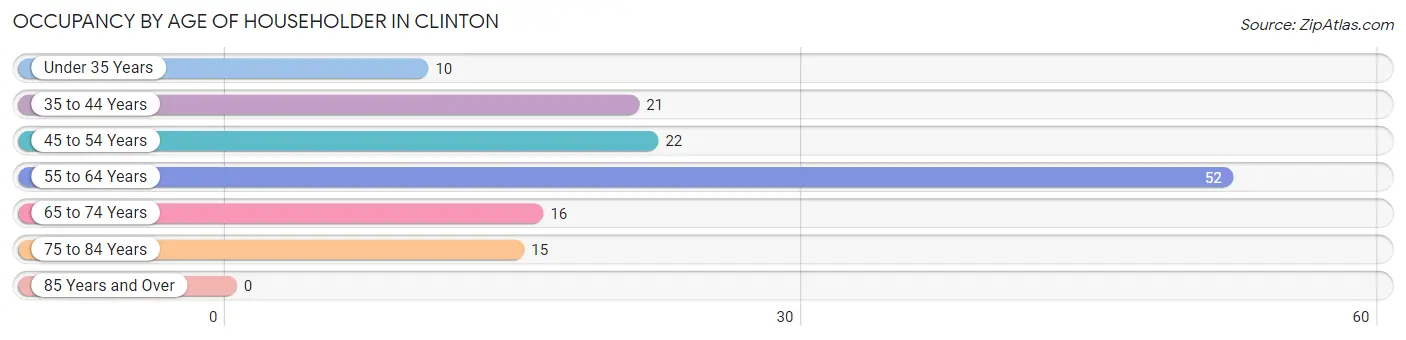
| Age Bracket | # Households | % Households |
| Under 35 Years | 10 | 7.3% |
| 35 to 44 Years | 21 | 15.4% |
| 45 to 54 Years | 22 | 16.2% |
| 55 to 64 Years | 52 | 38.2% |
| 65 to 74 Years | 16 | 11.8% |
| 75 to 84 Years | 15 | 11.0% |
| 85 Years and Over | 0 | 0.0% |
| Total | 136 | 100.0% |
Housing Finances in Clinton
Median Income by Occupancy in Clinton
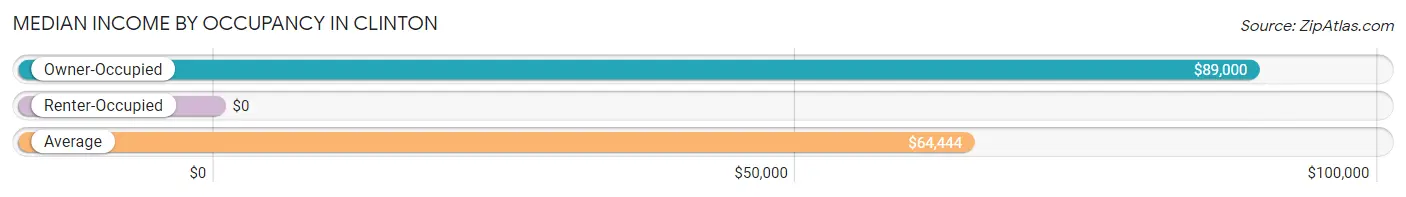
| Occupancy Type | # Households | Median Income |
| Owner-Occupied | 106 (77.9%) | $89,000 |
| Renter-Occupied | 30 (22.1%) | $0 |
| Average | 136 (100.0%) | $64,444 |
Occupancy by Householder Income Bracket in Clinton
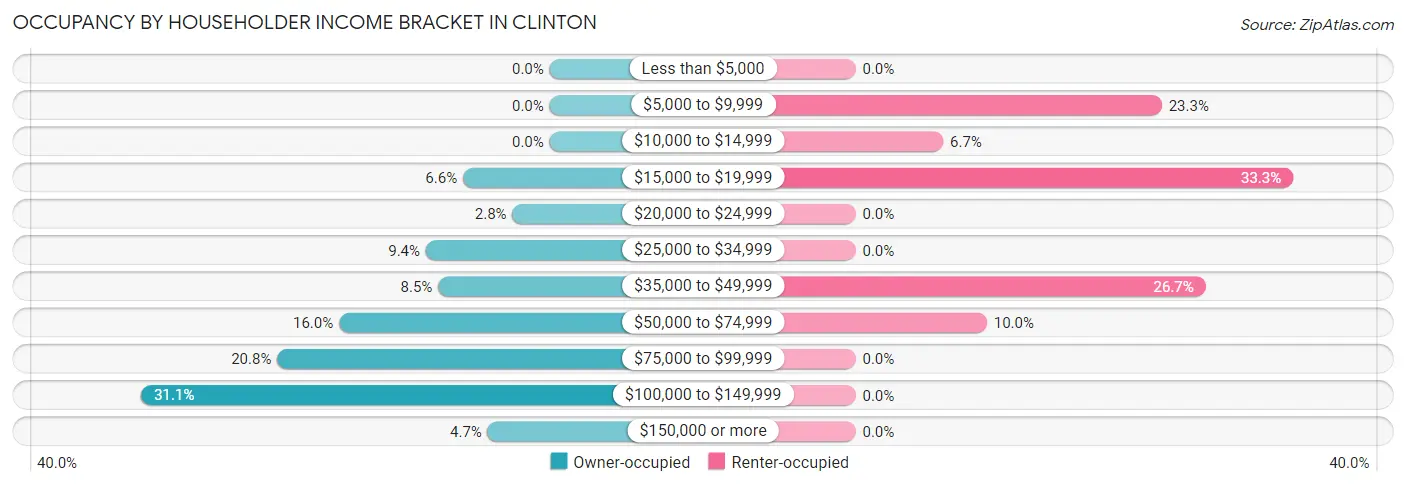
| Income Bracket | Owner-occupied | Renter-occupied |
| Less than $5,000 | 0 (0.0%) | 0 (0.0%) |
| $5,000 to $9,999 | 0 (0.0%) | 7 (23.3%) |
| $10,000 to $14,999 | 0 (0.0%) | 2 (6.7%) |
| $15,000 to $19,999 | 7 (6.6%) | 10 (33.3%) |
| $20,000 to $24,999 | 3 (2.8%) | 0 (0.0%) |
| $25,000 to $34,999 | 10 (9.4%) | 0 (0.0%) |
| $35,000 to $49,999 | 9 (8.5%) | 8 (26.7%) |
| $50,000 to $74,999 | 17 (16.0%) | 3 (10.0%) |
| $75,000 to $99,999 | 22 (20.7%) | 0 (0.0%) |
| $100,000 to $149,999 | 33 (31.1%) | 0 (0.0%) |
| $150,000 or more | 5 (4.7%) | 0 (0.0%) |
| Total | 106 (100.0%) | 30 (100.0%) |
Monthly Housing Cost Tiers in Clinton
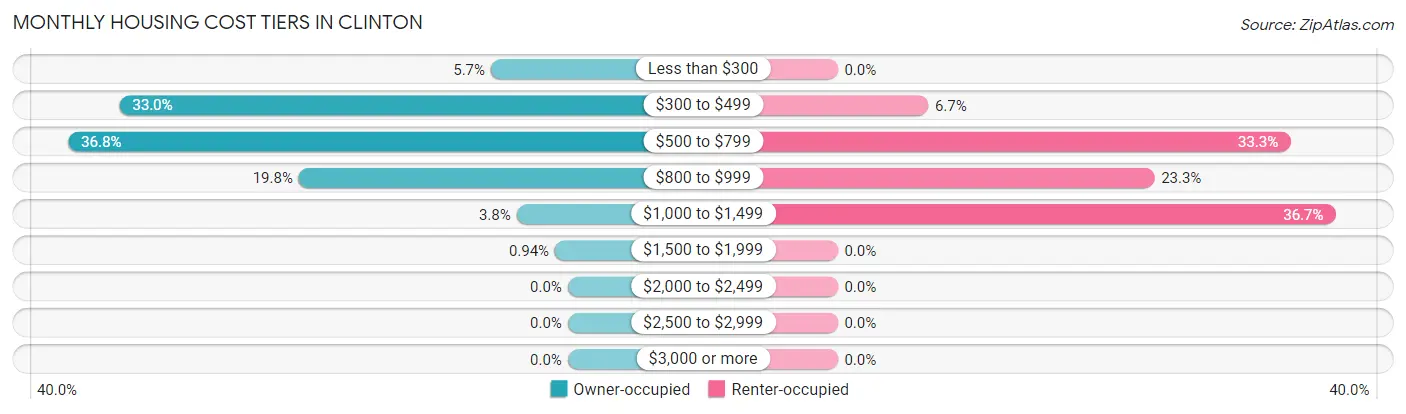
| Monthly Cost | Owner-occupied | Renter-occupied |
| Less than $300 | 6 (5.7%) | 0 (0.0%) |
| $300 to $499 | 35 (33.0%) | 2 (6.7%) |
| $500 to $799 | 39 (36.8%) | 10 (33.3%) |
| $800 to $999 | 21 (19.8%) | 7 (23.3%) |
| $1,000 to $1,499 | 4 (3.8%) | 11 (36.7%) |
| $1,500 to $1,999 | 1 (0.9%) | 0 (0.0%) |
| $2,000 to $2,499 | 0 (0.0%) | 0 (0.0%) |
| $2,500 to $2,999 | 0 (0.0%) | 0 (0.0%) |
| $3,000 or more | 0 (0.0%) | 0 (0.0%) |
| Total | 106 (100.0%) | 30 (100.0%) |
Physical Housing Characteristics in Clinton
Housing Structures in Clinton
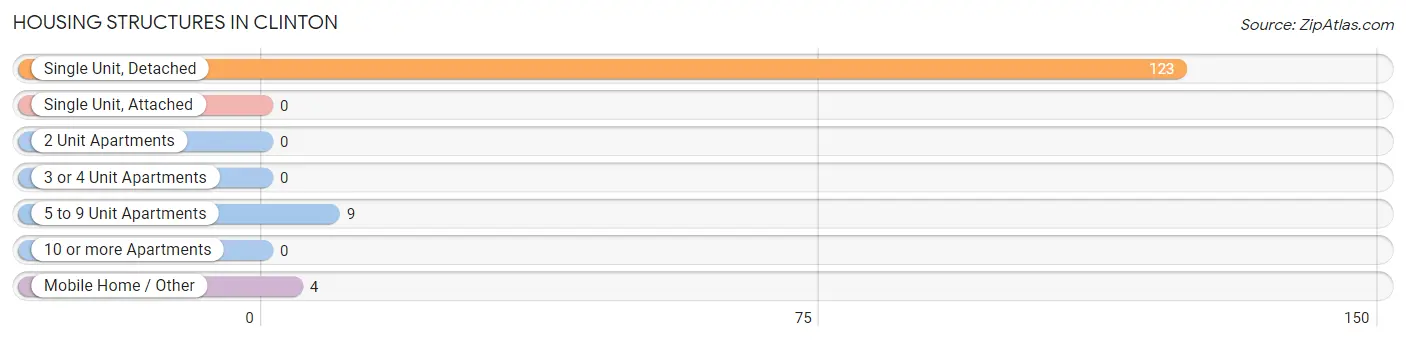
| Structure Type | # Housing Units | % Housing Units |
| Single Unit, Detached | 123 | 90.4% |
| Single Unit, Attached | 0 | 0.0% |
| 2 Unit Apartments | 0 | 0.0% |
| 3 or 4 Unit Apartments | 0 | 0.0% |
| 5 to 9 Unit Apartments | 9 | 6.6% |
| 10 or more Apartments | 0 | 0.0% |
| Mobile Home / Other | 4 | 2.9% |
| Total | 136 | 100.0% |
Housing Structures by Occupancy in Clinton
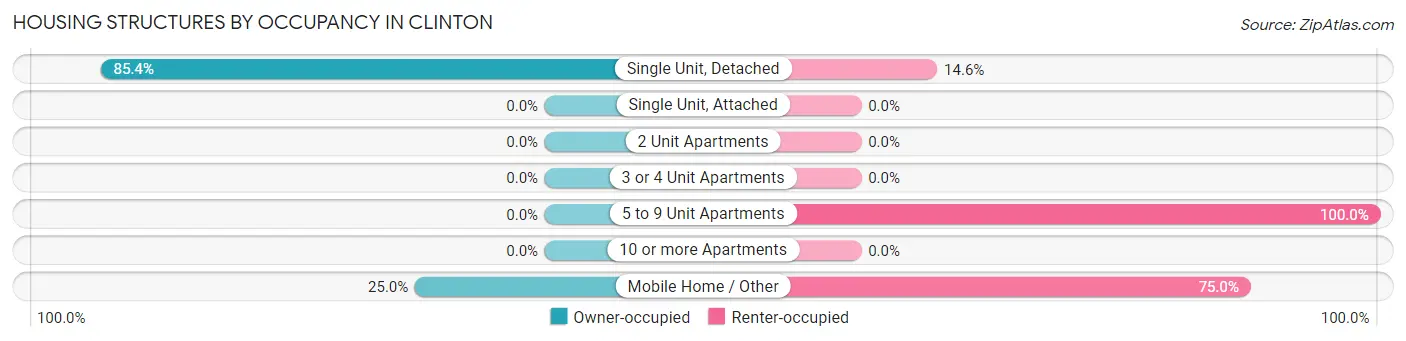
| Structure Type | Owner-occupied | Renter-occupied |
| Single Unit, Detached | 105 (85.4%) | 18 (14.6%) |
| Single Unit, Attached | 0 (0.0%) | 0 (0.0%) |
| 2 Unit Apartments | 0 (0.0%) | 0 (0.0%) |
| 3 or 4 Unit Apartments | 0 (0.0%) | 0 (0.0%) |
| 5 to 9 Unit Apartments | 0 (0.0%) | 9 (100.0%) |
| 10 or more Apartments | 0 (0.0%) | 0 (0.0%) |
| Mobile Home / Other | 1 (25.0%) | 3 (75.0%) |
| Total | 106 (77.9%) | 30 (22.1%) |
Housing Structures by Number of Rooms in Clinton
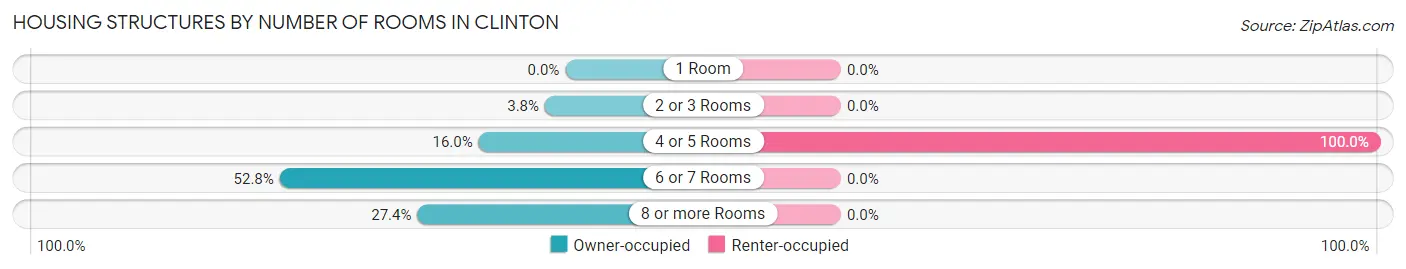
| Number of Rooms | Owner-occupied | Renter-occupied |
| 1 Room | 0 (0.0%) | 0 (0.0%) |
| 2 or 3 Rooms | 4 (3.8%) | 0 (0.0%) |
| 4 or 5 Rooms | 17 (16.0%) | 30 (100.0%) |
| 6 or 7 Rooms | 56 (52.8%) | 0 (0.0%) |
| 8 or more Rooms | 29 (27.4%) | 0 (0.0%) |
| Total | 106 (100.0%) | 30 (100.0%) |
Housing Structure by Heating Type in Clinton
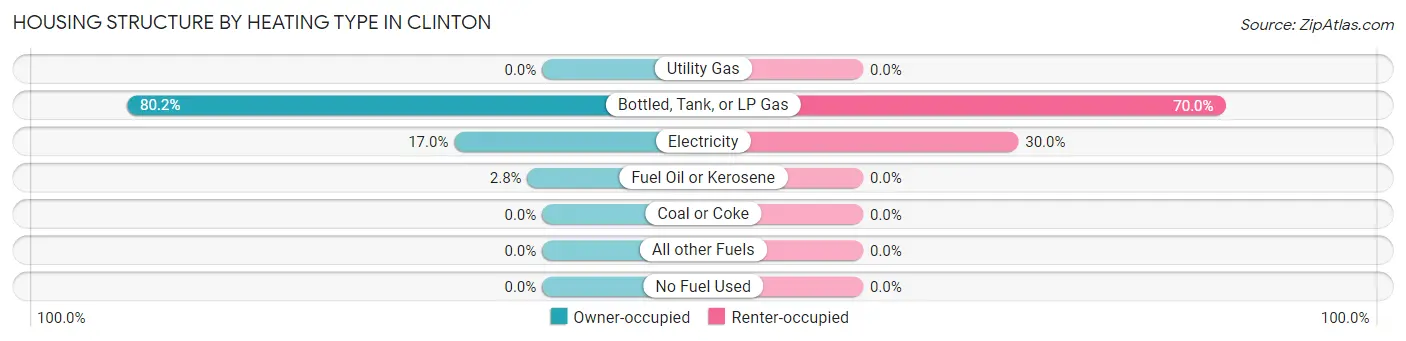
| Heating Type | Owner-occupied | Renter-occupied |
| Utility Gas | 0 (0.0%) | 0 (0.0%) |
| Bottled, Tank, or LP Gas | 85 (80.2%) | 21 (70.0%) |
| Electricity | 18 (17.0%) | 9 (30.0%) |
| Fuel Oil or Kerosene | 3 (2.8%) | 0 (0.0%) |
| Coal or Coke | 0 (0.0%) | 0 (0.0%) |
| All other Fuels | 0 (0.0%) | 0 (0.0%) |
| No Fuel Used | 0 (0.0%) | 0 (0.0%) |
| Total | 106 (100.0%) | 30 (100.0%) |
Household Vehicle Usage in Clinton
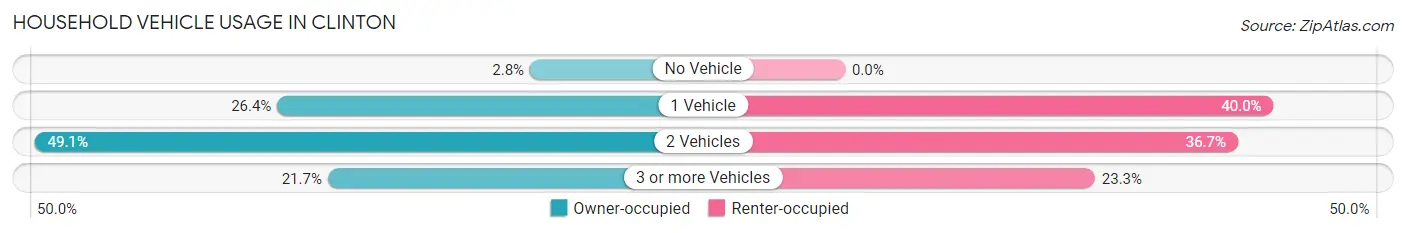
| Vehicles per Household | Owner-occupied | Renter-occupied |
| No Vehicle | 3 (2.8%) | 0 (0.0%) |
| 1 Vehicle | 28 (26.4%) | 12 (40.0%) |
| 2 Vehicles | 52 (49.1%) | 11 (36.7%) |
| 3 or more Vehicles | 23 (21.7%) | 7 (23.3%) |
| Total | 106 (100.0%) | 30 (100.0%) |
Real Estate & Mortgages in Clinton
Real Estate and Mortgage Overview in Clinton
| Characteristic | Without Mortgage | With Mortgage |
| Housing Units | 81 | 25 |
| Median Property Value | $68,600 | $45,000 |
| Median Household Income | $83,750 | $3 |
| Monthly Housing Costs | $508 | $0 |
| Real Estate Taxes | $536 | $0 |
Property Value by Mortgage Status in Clinton
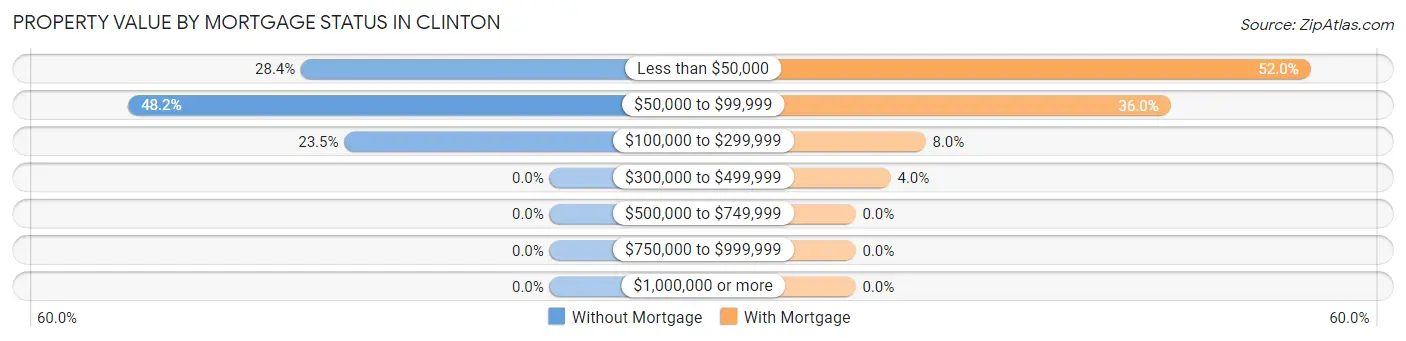
| Property Value | Without Mortgage | With Mortgage |
| Less than $50,000 | 23 (28.4%) | 13 (52.0%) |
| $50,000 to $99,999 | 39 (48.1%) | 9 (36.0%) |
| $100,000 to $299,999 | 19 (23.5%) | 2 (8.0%) |
| $300,000 to $499,999 | 0 (0.0%) | 1 (4.0%) |
| $500,000 to $749,999 | 0 (0.0%) | 0 (0.0%) |
| $750,000 to $999,999 | 0 (0.0%) | 0 (0.0%) |
| $1,000,000 or more | 0 (0.0%) | 0 (0.0%) |
| Total | 81 (100.0%) | 25 (100.0%) |
Household Income by Mortgage Status in Clinton
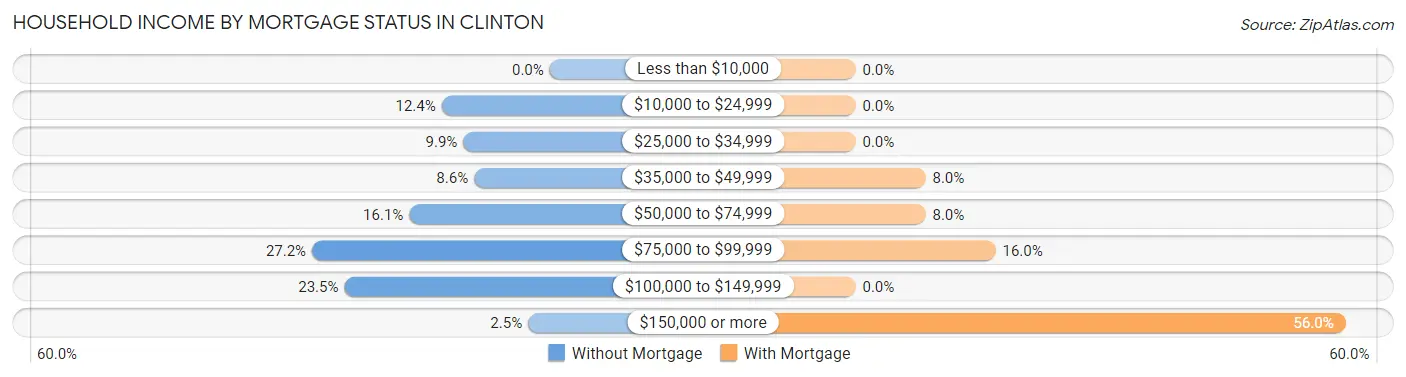
| Household Income | Without Mortgage | With Mortgage |
| Less than $10,000 | 0 (0.0%) | 0 (0.0%) |
| $10,000 to $24,999 | 10 (12.3%) | 0 (0.0%) |
| $25,000 to $34,999 | 8 (9.9%) | 0 (0.0%) |
| $35,000 to $49,999 | 7 (8.6%) | 2 (8.0%) |
| $50,000 to $74,999 | 13 (16.1%) | 2 (8.0%) |
| $75,000 to $99,999 | 22 (27.2%) | 4 (16.0%) |
| $100,000 to $149,999 | 19 (23.5%) | 0 (0.0%) |
| $150,000 or more | 2 (2.5%) | 14 (56.0%) |
| Total | 81 (100.0%) | 25 (100.0%) |
Property Value to Household Income Ratio in Clinton
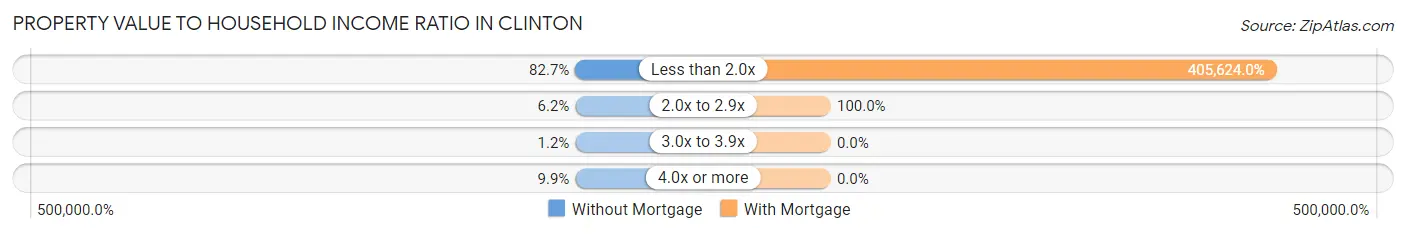
| Value-to-Income Ratio | Without Mortgage | With Mortgage |
| Less than 2.0x | 67 (82.7%) | 101,406 (405,624.0%) |
| 2.0x to 2.9x | 5 (6.2%) | 25 (100.0%) |
| 3.0x to 3.9x | 1 (1.2%) | 0 (0.0%) |
| 4.0x or more | 8 (9.9%) | 0 (0.0%) |
| Total | 81 (100.0%) | 25 (100.0%) |
Real Estate Taxes by Mortgage Status in Clinton
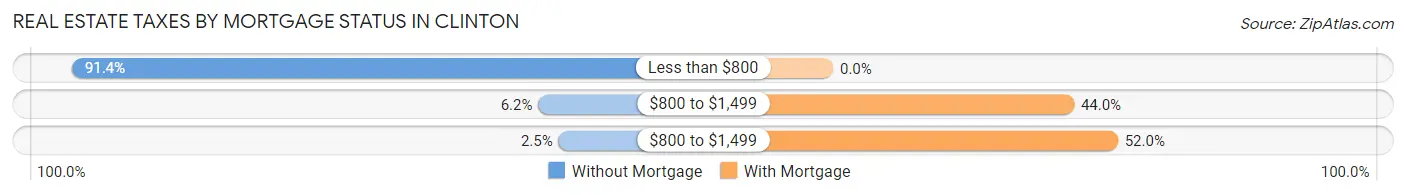
| Property Taxes | Without Mortgage | With Mortgage |
| Less than $800 | 74 (91.4%) | 0 (0.0%) |
| $800 to $1,499 | 5 (6.2%) | 11 (44.0%) |
| $800 to $1,499 | 2 (2.5%) | 13 (52.0%) |
| Total | 81 (100.0%) | 25 (100.0%) |
Health & Disability in Clinton
Health Insurance Coverage by Age in Clinton
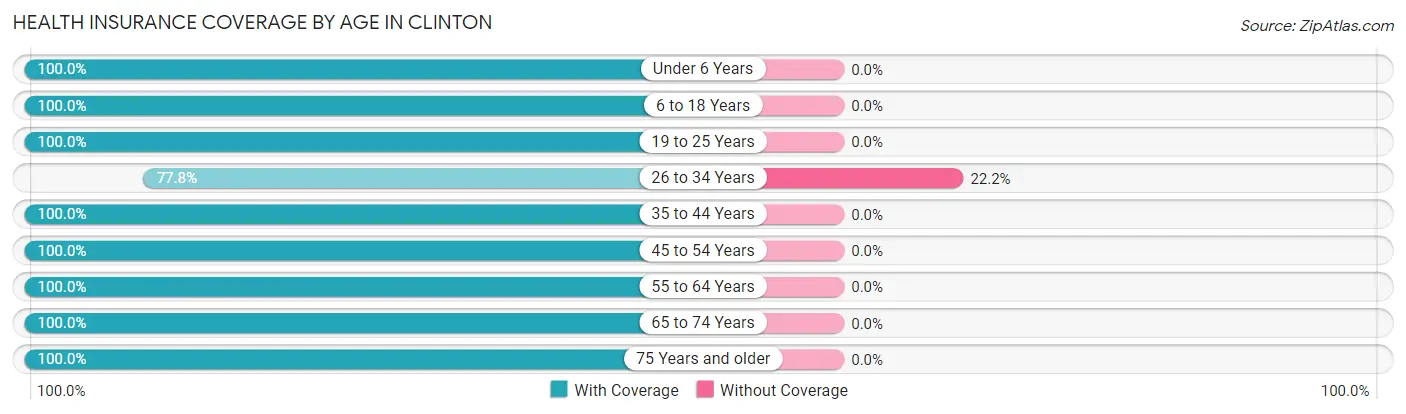
| Age Bracket | With Coverage | Without Coverage |
| Under 6 Years | 17 (100.0%) | 0 (0.0%) |
| 6 to 18 Years | 38 (100.0%) | 0 (0.0%) |
| 19 to 25 Years | 7 (100.0%) | 0 (0.0%) |
| 26 to 34 Years | 14 (77.8%) | 4 (22.2%) |
| 35 to 44 Years | 38 (100.0%) | 0 (0.0%) |
| 45 to 54 Years | 44 (100.0%) | 0 (0.0%) |
| 55 to 64 Years | 80 (100.0%) | 0 (0.0%) |
| 65 to 74 Years | 20 (100.0%) | 0 (0.0%) |
| 75 Years and older | 22 (100.0%) | 0 (0.0%) |
| Total | 280 (98.6%) | 4 (1.4%) |
Health Insurance Coverage by Citizenship Status in Clinton
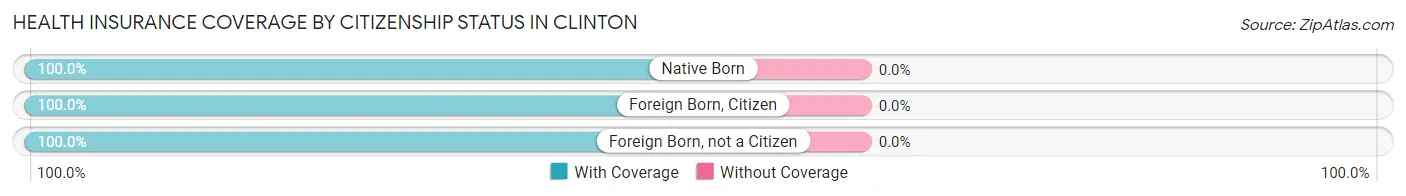
| Citizenship Status | With Coverage | Without Coverage |
| Native Born | 17 (100.0%) | 0 (0.0%) |
| Foreign Born, Citizen | 38 (100.0%) | 0 (0.0%) |
| Foreign Born, not a Citizen | 7 (100.0%) | 0 (0.0%) |
Health Insurance Coverage by Household Income in Clinton
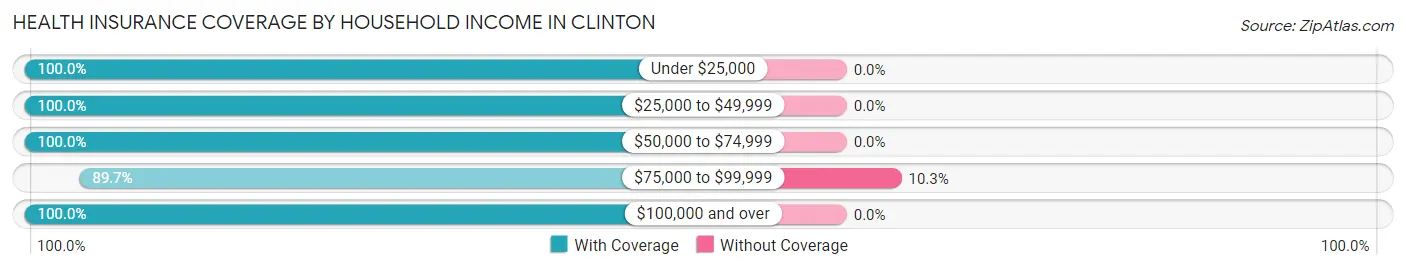
| Household Income | With Coverage | Without Coverage |
| Under $25,000 | 41 (100.0%) | 0 (0.0%) |
| $25,000 to $49,999 | 43 (100.0%) | 0 (0.0%) |
| $50,000 to $74,999 | 53 (100.0%) | 0 (0.0%) |
| $75,000 to $99,999 | 35 (89.7%) | 4 (10.3%) |
| $100,000 and over | 103 (100.0%) | 0 (0.0%) |
Public vs Private Health Insurance Coverage by Age in Clinton
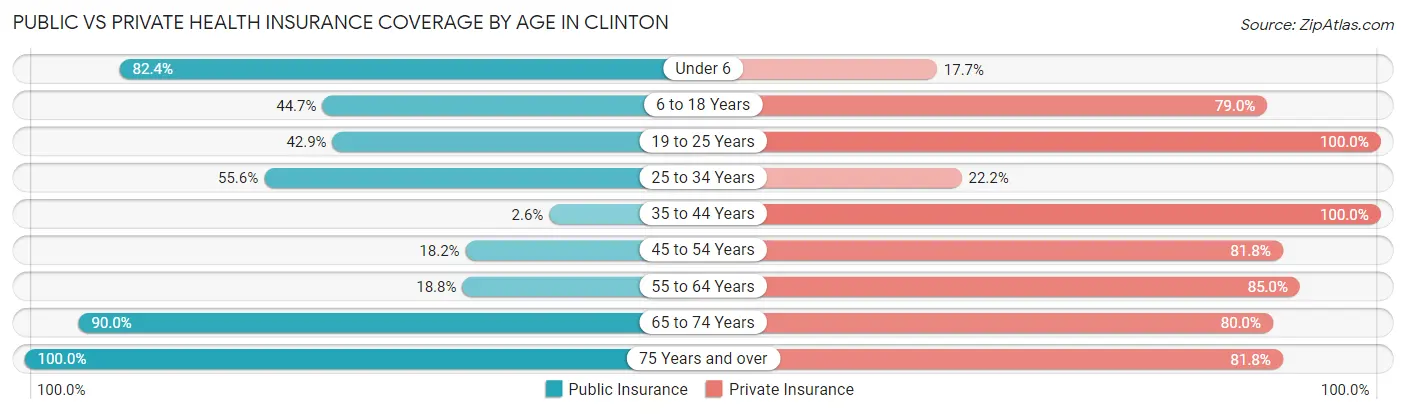
| Age Bracket | Public Insurance | Private Insurance |
| Under 6 | 14 (82.4%) | 3 (17.6%) |
| 6 to 18 Years | 17 (44.7%) | 30 (78.9%) |
| 19 to 25 Years | 3 (42.9%) | 7 (100.0%) |
| 25 to 34 Years | 10 (55.6%) | 4 (22.2%) |
| 35 to 44 Years | 1 (2.6%) | 38 (100.0%) |
| 45 to 54 Years | 8 (18.2%) | 36 (81.8%) |
| 55 to 64 Years | 15 (18.8%) | 68 (85.0%) |
| 65 to 74 Years | 18 (90.0%) | 16 (80.0%) |
| 75 Years and over | 22 (100.0%) | 18 (81.8%) |
| Total | 108 (38.0%) | 220 (77.5%) |
Disability Status by Sex by Age in Clinton
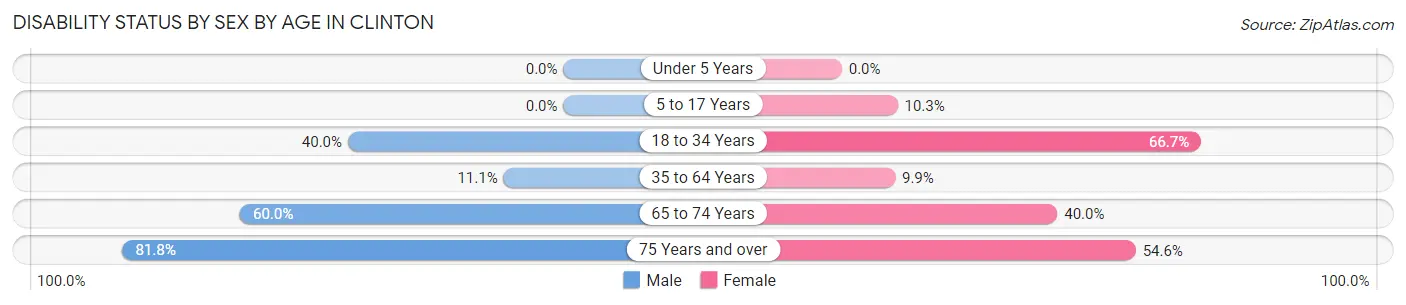
| Age Bracket | Male | Female |
| Under 5 Years | 0 (0.0%) | 0 (0.0%) |
| 5 to 17 Years | 0 (0.0%) | 3 (10.3%) |
| 18 to 34 Years | 4 (40.0%) | 10 (66.7%) |
| 35 to 64 Years | 9 (11.1%) | 8 (9.9%) |
| 65 to 74 Years | 3 (60.0%) | 6 (40.0%) |
| 75 Years and over | 9 (81.8%) | 6 (54.5%) |
Disability Class by Sex by Age in Clinton
Disability Class: Hearing Difficulty
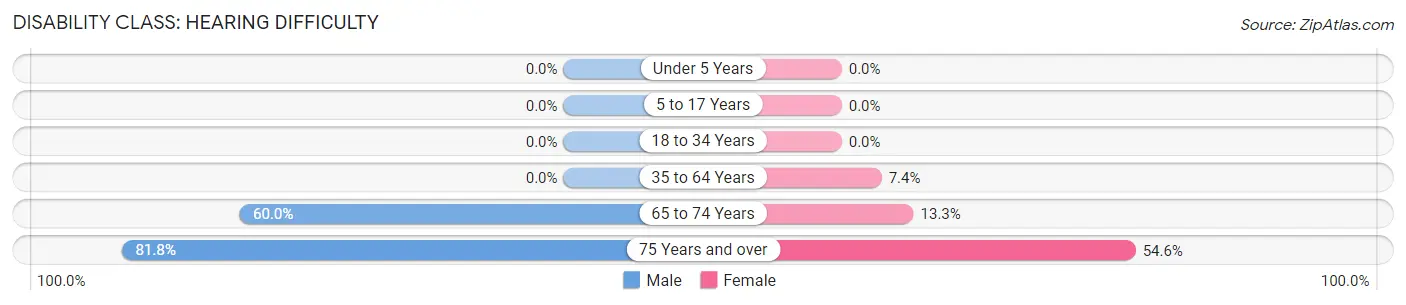
| Age Bracket | Male | Female |
| Under 5 Years | 0 (0.0%) | 0 (0.0%) |
| 5 to 17 Years | 0 (0.0%) | 0 (0.0%) |
| 18 to 34 Years | 0 (0.0%) | 0 (0.0%) |
| 35 to 64 Years | 0 (0.0%) | 6 (7.4%) |
| 65 to 74 Years | 3 (60.0%) | 2 (13.3%) |
| 75 Years and over | 9 (81.8%) | 6 (54.5%) |
Disability Class: Vision Difficulty
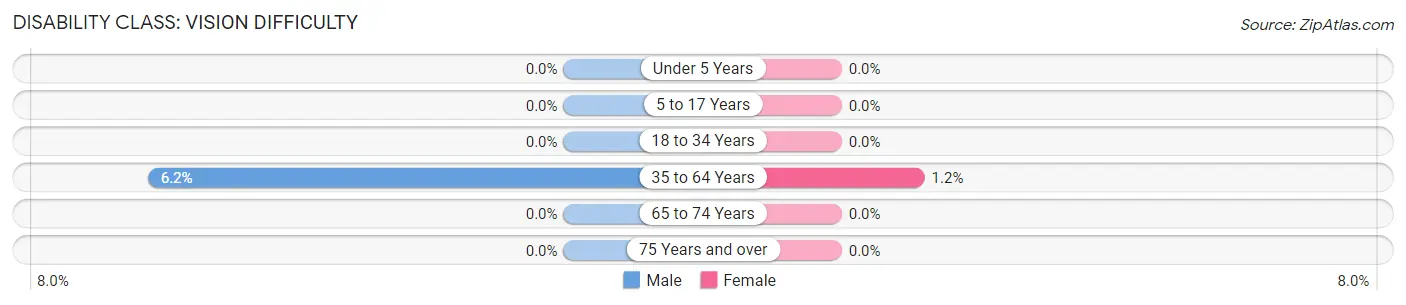
| Age Bracket | Male | Female |
| Under 5 Years | 0 (0.0%) | 0 (0.0%) |
| 5 to 17 Years | 0 (0.0%) | 0 (0.0%) |
| 18 to 34 Years | 0 (0.0%) | 0 (0.0%) |
| 35 to 64 Years | 5 (6.2%) | 1 (1.2%) |
| 65 to 74 Years | 0 (0.0%) | 0 (0.0%) |
| 75 Years and over | 0 (0.0%) | 0 (0.0%) |
Disability Class: Cognitive Difficulty
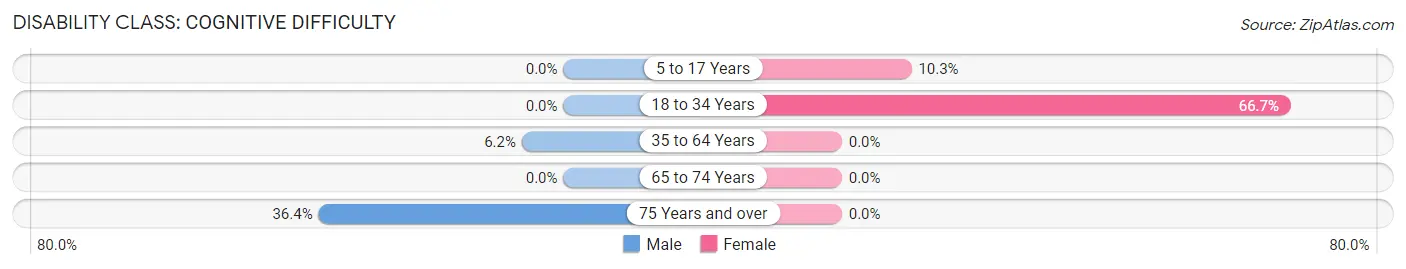
| Age Bracket | Male | Female |
| 5 to 17 Years | 0 (0.0%) | 3 (10.3%) |
| 18 to 34 Years | 0 (0.0%) | 10 (66.7%) |
| 35 to 64 Years | 5 (6.2%) | 0 (0.0%) |
| 65 to 74 Years | 0 (0.0%) | 0 (0.0%) |
| 75 Years and over | 4 (36.4%) | 0 (0.0%) |
Disability Class: Ambulatory Difficulty
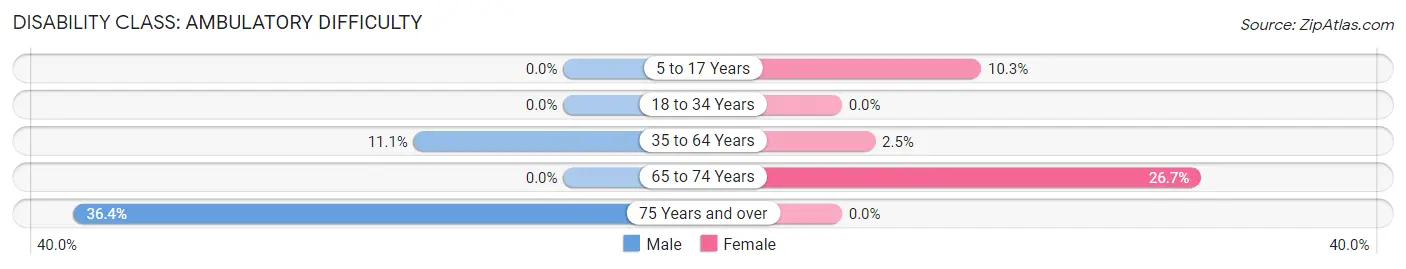
| Age Bracket | Male | Female |
| 5 to 17 Years | 0 (0.0%) | 3 (10.3%) |
| 18 to 34 Years | 0 (0.0%) | 0 (0.0%) |
| 35 to 64 Years | 9 (11.1%) | 2 (2.5%) |
| 65 to 74 Years | 0 (0.0%) | 4 (26.7%) |
| 75 Years and over | 4 (36.4%) | 0 (0.0%) |
Disability Class: Self-Care Difficulty
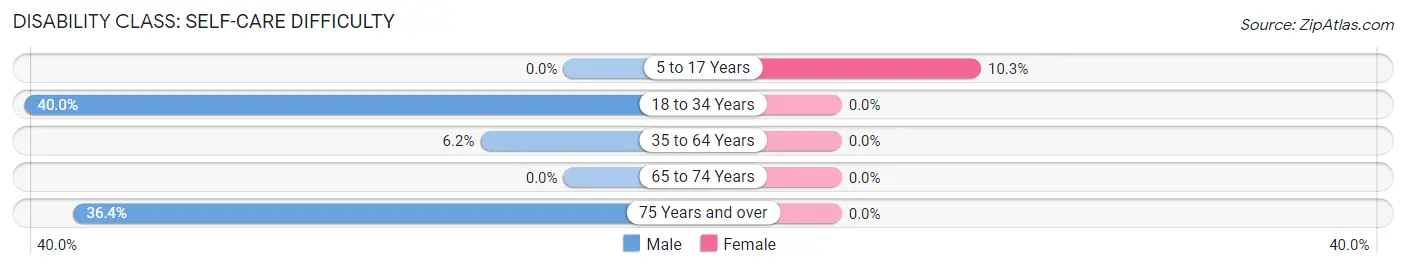
| Age Bracket | Male | Female |
| 5 to 17 Years | 0 (0.0%) | 3 (10.3%) |
| 18 to 34 Years | 4 (40.0%) | 0 (0.0%) |
| 35 to 64 Years | 5 (6.2%) | 0 (0.0%) |
| 65 to 74 Years | 0 (0.0%) | 0 (0.0%) |
| 75 Years and over | 4 (36.4%) | 0 (0.0%) |
Technology Access in Clinton
Computing Device Access in Clinton
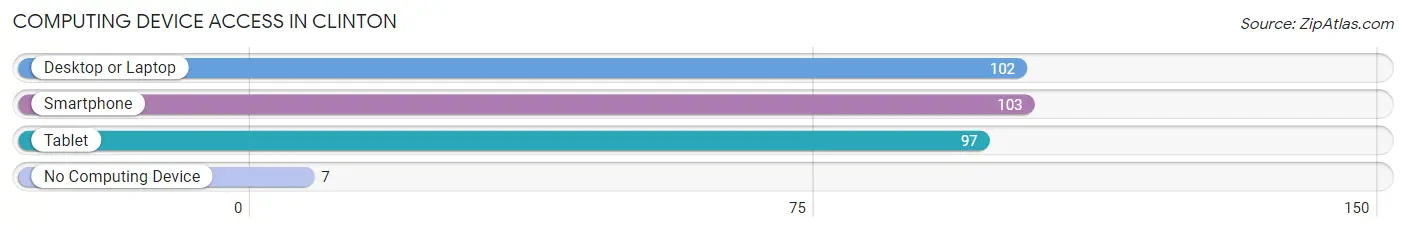
| Device Type | # Households | % Households |
| Desktop or Laptop | 102 | 75.0% |
| Smartphone | 103 | 75.7% |
| Tablet | 97 | 71.3% |
| No Computing Device | 7 | 5.1% |
| Total | 136 | 100.0% |
Internet Access in Clinton
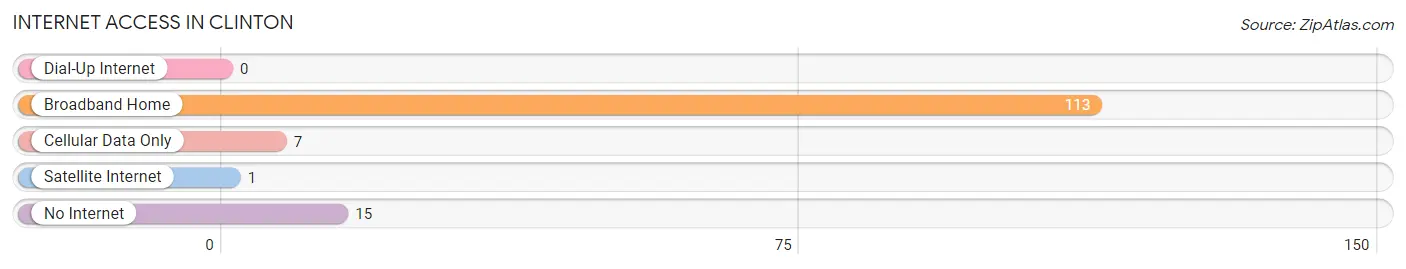
| Internet Type | # Households | % Households |
| Dial-Up Internet | 0 | 0.0% |
| Broadband Home | 113 | 83.1% |
| Cellular Data Only | 7 | 5.1% |
| Satellite Internet | 1 | 0.7% |
| No Internet | 15 | 11.0% |
| Total | 136 | 100.0% |
Clinton Summary
Clinton, Minnesota is a small city located in the southeastern corner of the state, just north of the Iowa border. It is part of the larger Mankato-North Mankato metropolitan area, and is home to a population of just over 4,000 people. The city is known for its rich history, diverse geography, and vibrant economy.
History
The area that is now Clinton was first settled in 1854 by a group of settlers from New York. The city was named after DeWitt Clinton, the former governor of New York. The city was officially incorporated in 1872, and the first post office was established in 1873.
In the late 19th century, Clinton was a thriving agricultural community, with many farmers growing wheat, corn, and other crops. The city also had a thriving lumber industry, with several sawmills located in the area.
In the early 20th century, Clinton began to experience a period of growth and development. The city was connected to the rest of the state by the Minnesota and International Railway in 1906, and the first telephone service was established in 1907. The city also saw the construction of several new buildings, including a new school, a bank, and a hotel.
Geography
Clinton is located in the southeastern corner of Minnesota, just north of the Iowa border. The city is situated on the banks of the Blue Earth River, and is surrounded by rolling hills and farmland. The city is located in Blue Earth County, and is part of the larger Mankato-North Mankato metropolitan area.
The city has a total area of 1.7 square miles, all of which is land. The city has a humid continental climate, with cold winters and warm summers. The average annual temperature is around 40 degrees Fahrenheit, and the average annual precipitation is around 30 inches.
Economy
Clinton’s economy is largely based on agriculture and manufacturing. The city is home to several large farms, which produce a variety of crops, including corn, soybeans, and wheat. The city also has several manufacturing plants, which produce a variety of products, including furniture, clothing, and electronics.
The city also has a thriving retail sector, with several stores and restaurants located in the downtown area. The city is also home to several small businesses, including a local newspaper, a hardware store, and a bakery.
Demographics
As of the 2010 census, the population of Clinton was 4,072. The city has a population density of 2,400 people per square mile. The median age of the population is 38.7 years, and the median household income is $45,000.
The racial makeup of the city is 95.3% White, 0.7% African American, 0.3% Native American, 0.7% Asian, 0.1% Pacific Islander, and 2.0% from other races. The city also has a large Hispanic population, with 8.3% of the population identifying as Hispanic or Latino.
Conclusion
Clinton, Minnesota is a small city located in the southeastern corner of the state, just north of the Iowa border. It is part of the larger Mankato-North Mankato metropolitan area, and is home to a population of just over 4,000 people. The city is known for its rich history, diverse geography, and vibrant economy. The city’s economy is largely based on agriculture and manufacturing, and the city has a thriving retail sector. The city also has a diverse population, with a large Hispanic population and a median age of 38.7 years.
Common Questions
What is the Total Population of Clinton?
Total Population of Clinton is 284.
What is the Total Male Population of Clinton?
Total Male Population of Clinton is 124.
What is the Total Female Population of Clinton?
Total Female Population of Clinton is 160.
What is the Ratio of Males per 100 Females in Clinton?
There are 77.50 Males per 100 Females in Clinton.
What is the Ratio of Females per 100 Males in Clinton?
There are 129.03 Females per 100 Males in Clinton.
What is the Median Population Age in Clinton?
Median Population Age in Clinton is 50.9 Years.
What is the Average Family Size in Clinton
Average Family Size in Clinton is 2.9 People.
What is the Average Household Size in Clinton
Average Household Size in Clinton is 2.0 People.
What is Per Capita Income in Clinton?
Per Capita income in Clinton is $33,635.
What is the Median Family Income in Clinton?
Median Family Income in Clinton is $92,857.
What is the Median Household income in Clinton?
Median Household Income in Clinton is $64,444.
What is Income or Wage Gap in Clinton?
Income or Wage Gap in Clinton is 13.8%.
Women in Clinton earn 86.2 cents for every dollar earned by a man.
What is Inequality or Gini Index in Clinton?
Inequality or Gini Index in Clinton is 0.34.
How Large is the Labor Force in Clinton?
There are 163 People in the Labor Forcein in Clinton.
What is the Percentage of People in the Labor Force in Clinton?
70.3% of People are in the Labor Force in Clinton.
What is the Unemployment Rate in Clinton?
Unemployment Rate in Clinton is 1.8%.