Chanhassen, MN
Chanhassen Map
Chanhassen Overview
25,868
TOTAL POPULATION
12,892
MALE POPULATION
12,976
FEMALE POPULATION
99.35
MALES / 100 FEMALES
100.65
FEMALES / 100 MALES
40.6
MEDIAN AGE
3.2
AVG FAMILY SIZE
2.7
AVG HOUSEHOLD SIZE
$67,775
PER CAPITA INCOME
$166,101
AVG FAMILY INCOME
$131,633
AVG HOUSEHOLD INCOME
46.5%
WAGE / INCOME GAP [ % ]
53.5¢/ $1
WAGE / INCOME GAP [ $ ]
$10,357
FAMILY INCOME DEFICIT
0.44
INEQUALITY / GINI INDEX
13,926
LABOR FORCE [ PEOPLE ]
69.8%
PERCENT IN LABOR FORCE
3.5%
UNEMPLOYMENT RATE
Chanhassen Zip Codes
Chanhassen Area Codes
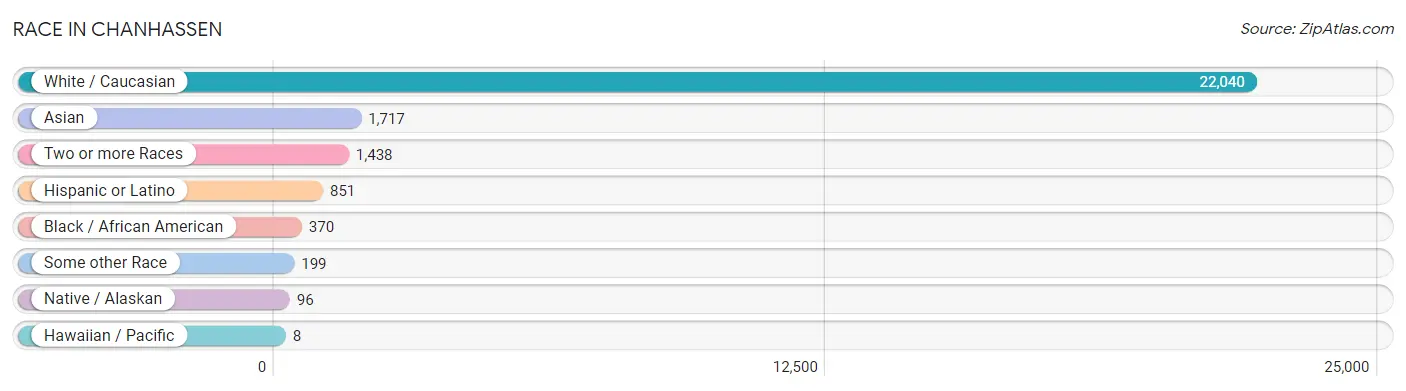
Race in Chanhassen
The most populous races in Chanhassen are White / Caucasian (22,040 | 85.2%), Asian (1,717 | 6.6%), and Two or more Races (1,438 | 5.6%).
| Race | # Population | % Population |
| Asian | 1,717 | 6.6% |
| Black / African American | 370 | 1.4% |
| Hawaiian / Pacific | 8 | 0.0% |
| Hispanic or Latino | 851 | 3.3% |
| Native / Alaskan | 96 | 0.4% |
| White / Caucasian | 22,040 | 85.2% |
| Two or more Races | 1,438 | 5.6% |
| Some other Race | 199 | 0.8% |
| Total | 25,868 | 100.0% |
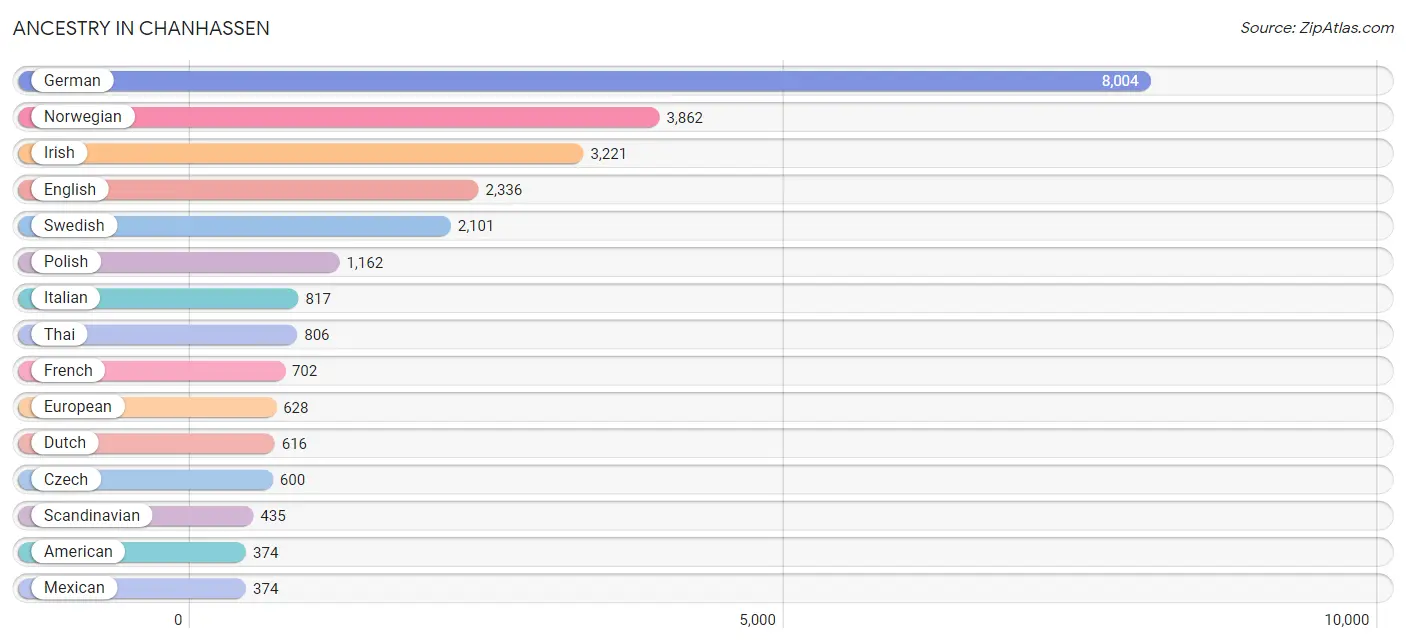
Ancestry in Chanhassen
The most populous ancestries reported in Chanhassen are German (8,004 | 30.9%), Norwegian (3,862 | 14.9%), Irish (3,221 | 12.4%), English (2,336 | 9.0%), and Swedish (2,101 | 8.1%), together accounting for 75.5% of all Chanhassen residents.
| Ancestry | # Population | % Population |
| African | 36 | 0.1% |
| American | 374 | 1.5% |
| Arab | 46 | 0.2% |
| Armenian | 43 | 0.2% |
| Australian | 16 | 0.1% |
| Austrian | 132 | 0.5% |
| Bangladeshi | 162 | 0.6% |
| Belgian | 110 | 0.4% |
| Bhutanese | 28 | 0.1% |
| Bolivian | 36 | 0.1% |
| Brazilian | 159 | 0.6% |
| British | 167 | 0.6% |
| Bulgarian | 14 | 0.1% |
| Burmese | 178 | 0.7% |
| Cambodian | 13 | 0.1% |
| Canadian | 62 | 0.2% |
| Celtic | 13 | 0.1% |
| Central American | 314 | 1.2% |
| Chippewa | 53 | 0.2% |
| Colombian | 30 | 0.1% |
| Croatian | 44 | 0.2% |
| Czech | 600 | 2.3% |
| Czechoslovakian | 51 | 0.2% |
| Danish | 308 | 1.2% |
| Dutch | 616 | 2.4% |
| Eastern European | 59 | 0.2% |
| English | 2,336 | 9.0% |
| European | 628 | 2.4% |
| Finnish | 276 | 1.1% |
| French | 702 | 2.7% |
| French American Indian | 17 | 0.1% |
| French Canadian | 238 | 0.9% |
| German | 8,004 | 30.9% |
| Ghanaian | 62 | 0.2% |
| Greek | 68 | 0.3% |
| Guamanian / Chamorro | 8 | 0.0% |
| Guatemalan | 143 | 0.5% |
| Honduran | 59 | 0.2% |
| Hungarian | 26 | 0.1% |
| Icelander | 26 | 0.1% |
| Indian (Asian) | 193 | 0.7% |
| Iranian | 17 | 0.1% |
| Irish | 3,221 | 12.4% |
| Israeli | 6 | 0.0% |
| Italian | 817 | 3.2% |
| Jamaican | 16 | 0.1% |
| Japanese | 25 | 0.1% |
| Kenyan | 110 | 0.4% |
| Korean | 196 | 0.8% |
| Laotian | 9 | 0.0% |
| Latvian | 50 | 0.2% |
| Lebanese | 38 | 0.2% |
| Lithuanian | 49 | 0.2% |
| Luxembourger | 66 | 0.3% |
| Malaysian | 149 | 0.6% |
| Mexican | 374 | 1.5% |
| Mexican American Indian | 37 | 0.1% |
| Native Hawaiian | 7 | 0.0% |
| New Zealander | 21 | 0.1% |
| Nigerian | 151 | 0.6% |
| Northern European | 172 | 0.7% |
| Norwegian | 3,862 | 14.9% |
| Panamanian | 78 | 0.3% |
| Pennsylvania German | 11 | 0.0% |
| Polish | 1,162 | 4.5% |
| Portuguese | 23 | 0.1% |
| Puerto Rican | 2 | 0.0% |
| Romanian | 95 | 0.4% |
| Russian | 190 | 0.7% |
| Salvadoran | 34 | 0.1% |
| Scandinavian | 435 | 1.7% |
| Scotch-Irish | 119 | 0.5% |
| Scottish | 273 | 1.1% |
| Sioux | 18 | 0.1% |
| Slovak | 36 | 0.1% |
| Slovene | 18 | 0.1% |
| South African | 9 | 0.0% |
| South American | 76 | 0.3% |
| Spaniard | 67 | 0.3% |
| Sri Lankan | 333 | 1.3% |
| Subsaharan African | 370 | 1.4% |
| Swedish | 2,101 | 8.1% |
| Swiss | 87 | 0.3% |
| Thai | 806 | 3.1% |
| Turkish | 32 | 0.1% |
| Ukrainian | 90 | 0.4% |
| Venezuelan | 10 | 0.0% |
| Welsh | 198 | 0.8% |
| Yugoslavian | 39 | 0.2% | View All 89 Rows |
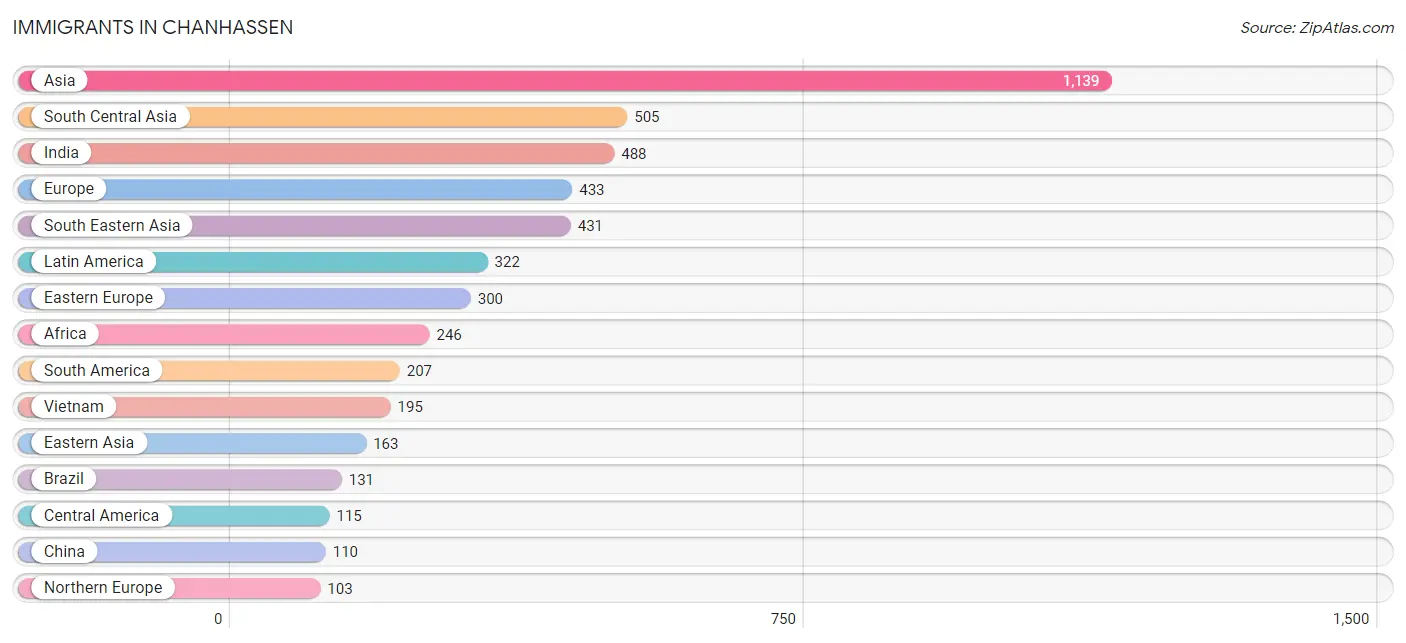
Immigrants in Chanhassen
The most numerous immigrant groups reported in Chanhassen came from Asia (1,139 | 4.4%), South Central Asia (505 | 1.9%), India (488 | 1.9%), Europe (433 | 1.7%), and South Eastern Asia (431 | 1.7%), together accounting for 11.6% of all Chanhassen residents.
| Immigration Origin | # Population | % Population |
| Africa | 246 | 0.9% |
| Asia | 1,139 | 4.4% |
| Australia | 27 | 0.1% |
| Austria | 20 | 0.1% |
| Belarus | 94 | 0.4% |
| Bolivia | 7 | 0.0% |
| Bosnia and Herzegovina | 23 | 0.1% |
| Brazil | 131 | 0.5% |
| Bulgaria | 14 | 0.1% |
| Cambodia | 22 | 0.1% |
| Canada | 44 | 0.2% |
| Central America | 115 | 0.4% |
| China | 110 | 0.4% |
| Colombia | 30 | 0.1% |
| Czechoslovakia | 18 | 0.1% |
| Denmark | 6 | 0.0% |
| Eastern Africa | 94 | 0.4% |
| Eastern Asia | 163 | 0.6% |
| Eastern Europe | 300 | 1.2% |
| El Salvador | 34 | 0.1% |
| England | 9 | 0.0% |
| Eritrea | 9 | 0.0% |
| Ethiopia | 27 | 0.1% |
| Europe | 433 | 1.7% |
| France | 6 | 0.0% |
| Ghana | 62 | 0.2% |
| Guyana | 5 | 0.0% |
| Honduras | 21 | 0.1% |
| Hong Kong | 10 | 0.0% |
| India | 488 | 1.9% |
| Indonesia | 4 | 0.0% |
| Iran | 17 | 0.1% |
| Iraq | 8 | 0.0% |
| Kenya | 53 | 0.2% |
| Korea | 53 | 0.2% |
| Laos | 70 | 0.3% |
| Latin America | 322 | 1.2% |
| Latvia | 4 | 0.0% |
| Lithuania | 5 | 0.0% |
| Malaysia | 2 | 0.0% |
| Mexico | 60 | 0.2% |
| Netherlands | 4 | 0.0% |
| Nigeria | 35 | 0.1% |
| Northern Europe | 103 | 0.4% |
| Norway | 6 | 0.0% |
| Oceania | 41 | 0.2% |
| Philippines | 95 | 0.4% |
| Poland | 11 | 0.0% |
| Romania | 36 | 0.1% |
| Russia | 52 | 0.2% |
| Singapore | 10 | 0.0% |
| South Africa | 55 | 0.2% |
| South America | 207 | 0.8% |
| South Central Asia | 505 | 1.9% |
| South Eastern Asia | 431 | 1.7% |
| Thailand | 33 | 0.1% |
| Ukraine | 43 | 0.2% |
| Uruguay | 10 | 0.0% |
| Venezuela | 24 | 0.1% |
| Vietnam | 195 | 0.7% |
| Western Africa | 97 | 0.4% |
| Western Asia | 40 | 0.2% |
| Western Europe | 30 | 0.1% | View All 63 Rows |
Sex and Age in Chanhassen
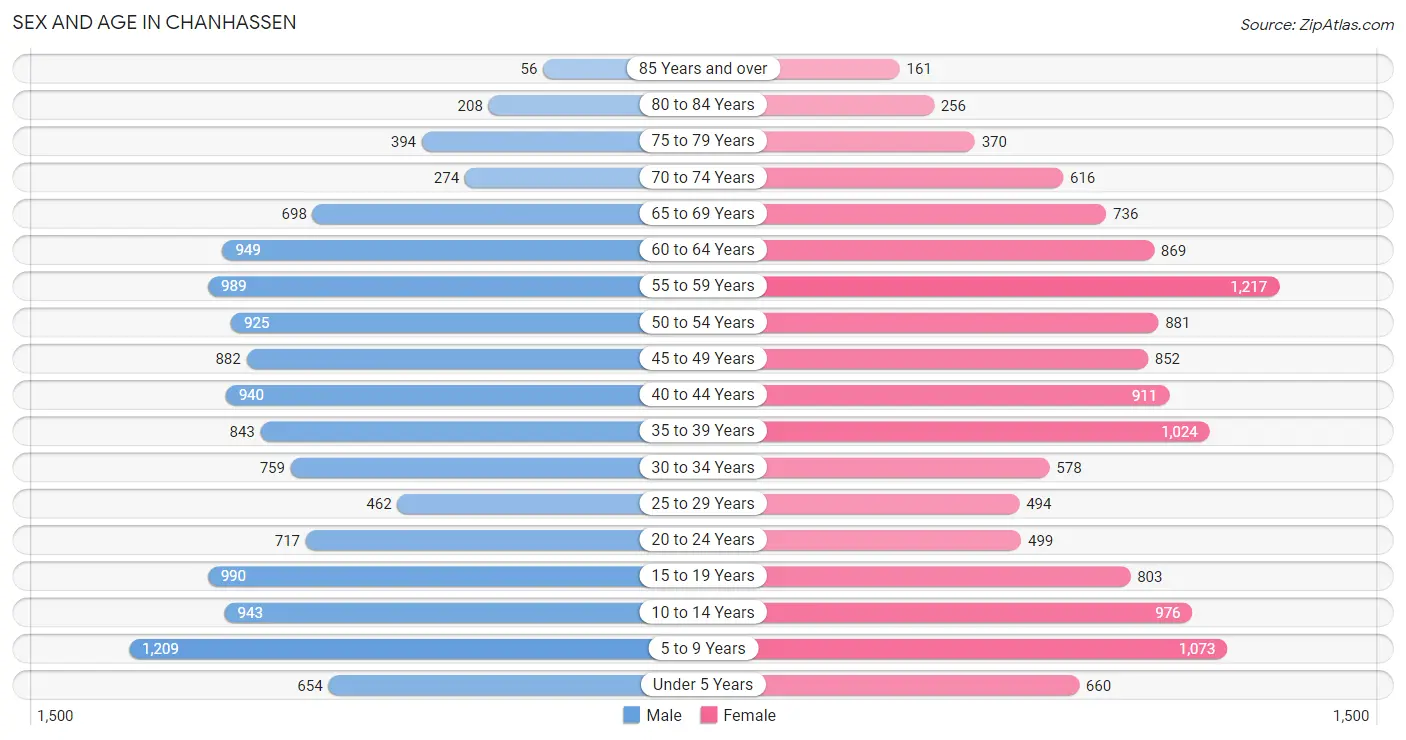
Sex and Age in Chanhassen
The most populous age groups in Chanhassen are 5 to 9 Years (1,209 | 9.4%) for men and 55 to 59 Years (1,217 | 9.4%) for women.
| Age Bracket | Male | Female |
| Under 5 Years | 654 (5.1%) | 660 (5.1%) |
| 5 to 9 Years | 1,209 (9.4%) | 1,073 (8.3%) |
| 10 to 14 Years | 943 (7.3%) | 976 (7.5%) |
| 15 to 19 Years | 990 (7.7%) | 803 (6.2%) |
| 20 to 24 Years | 717 (5.6%) | 499 (3.8%) |
| 25 to 29 Years | 462 (3.6%) | 494 (3.8%) |
| 30 to 34 Years | 759 (5.9%) | 578 (4.4%) |
| 35 to 39 Years | 843 (6.5%) | 1,024 (7.9%) |
| 40 to 44 Years | 940 (7.3%) | 911 (7.0%) |
| 45 to 49 Years | 882 (6.8%) | 852 (6.6%) |
| 50 to 54 Years | 925 (7.2%) | 881 (6.8%) |
| 55 to 59 Years | 989 (7.7%) | 1,217 (9.4%) |
| 60 to 64 Years | 949 (7.4%) | 869 (6.7%) |
| 65 to 69 Years | 698 (5.4%) | 736 (5.7%) |
| 70 to 74 Years | 274 (2.1%) | 616 (4.8%) |
| 75 to 79 Years | 394 (3.1%) | 370 (2.9%) |
| 80 to 84 Years | 208 (1.6%) | 256 (2.0%) |
| 85 Years and over | 56 (0.4%) | 161 (1.2%) |
| Total | 12,892 (100.0%) | 12,976 (100.0%) |
Families and Households in Chanhassen
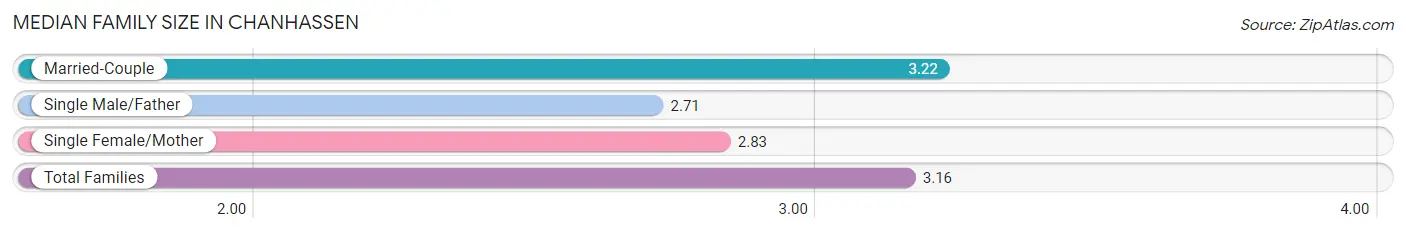
Median Family Size in Chanhassen
The median family size in Chanhassen is 3.16 persons per family, with married-couple families (5,977 | 84.4%) accounting for the largest median family size of 3.22 persons per family. On the other hand, single male/father families (268 | 3.8%) represent the smallest median family size with 2.71 persons per family.
| Family Type | # Families | Family Size |
| Married-Couple | 5,977 (84.4%) | 3.22 |
| Single Male/Father | 268 (3.8%) | 2.71 |
| Single Female/Mother | 836 (11.8%) | 2.83 |
| Total Families | 7,081 (100.0%) | 3.16 |
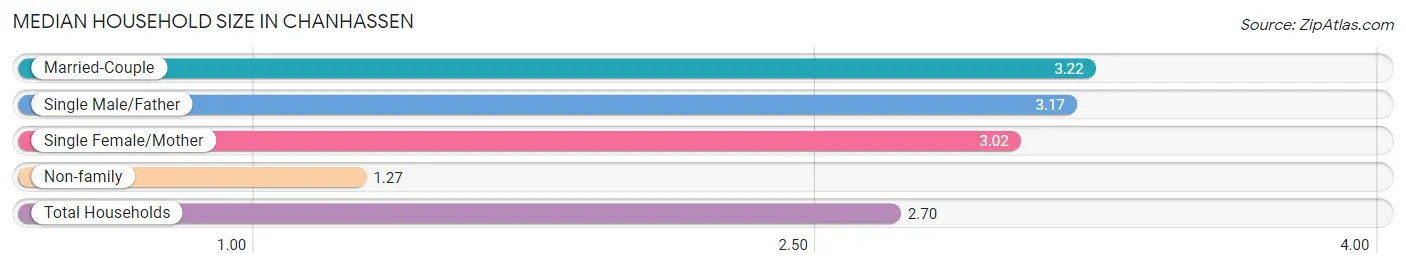
Median Household Size in Chanhassen
The median household size in Chanhassen is 2.70 persons per household, with married-couple households (5,977 | 62.4%) accounting for the largest median household size of 3.22 persons per household. non-family households (2,497 | 26.1%) represent the smallest median household size with 1.27 persons per household.
| Household Type | # Households | Household Size |
| Married-Couple | 5,977 (62.4%) | 3.22 |
| Single Male/Father | 268 (2.8%) | 3.17 |
| Single Female/Mother | 836 (8.7%) | 3.02 |
| Non-family | 2,497 (26.1%) | 1.27 |
| Total Households | 9,578 (100.0%) | 2.70 |
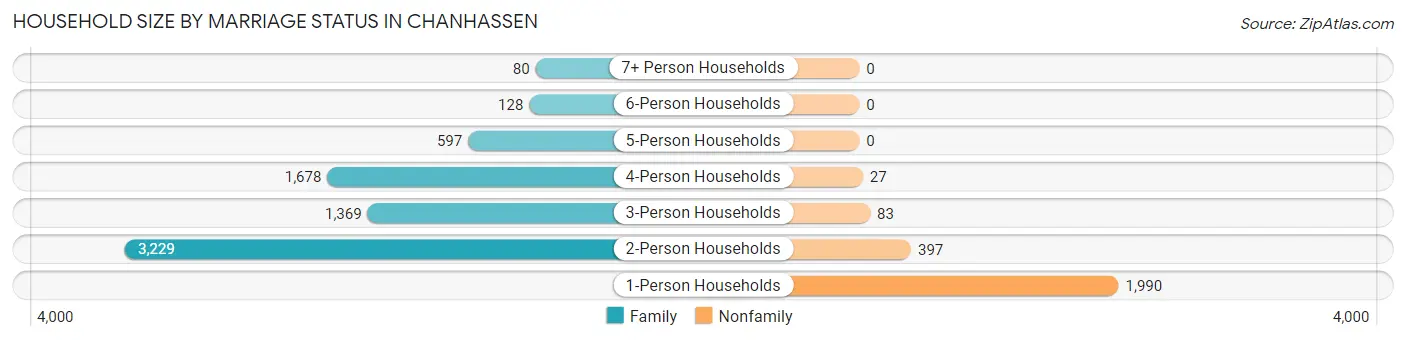
Household Size by Marriage Status in Chanhassen
Out of a total of 9,578 households in Chanhassen, 7,081 (73.9%) are family households, while 2,497 (26.1%) are nonfamily households. The most numerous type of family households are 2-person households, comprising 3,229, and the most common type of nonfamily households are 1-person households, comprising 1,990.
| Household Size | Family Households | Nonfamily Households |
| 1-Person Households | - | 1,990 (20.8%) |
| 2-Person Households | 3,229 (33.7%) | 397 (4.1%) |
| 3-Person Households | 1,369 (14.3%) | 83 (0.9%) |
| 4-Person Households | 1,678 (17.5%) | 27 (0.3%) |
| 5-Person Households | 597 (6.2%) | 0 (0.0%) |
| 6-Person Households | 128 (1.3%) | 0 (0.0%) |
| 7+ Person Households | 80 (0.8%) | 0 (0.0%) |
| Total | 7,081 (73.9%) | 2,497 (26.1%) |
Female Fertility in Chanhassen
Fertility by Age in Chanhassen
Average fertility rate in Chanhassen is 36.0 births per 1,000 women. Women in the age bracket of 20 to 34 years have the highest fertility rate with 72.0 births per 1,000 women. Women in the age bracket of 20 to 34 years acount for 59.5% of all women with births.
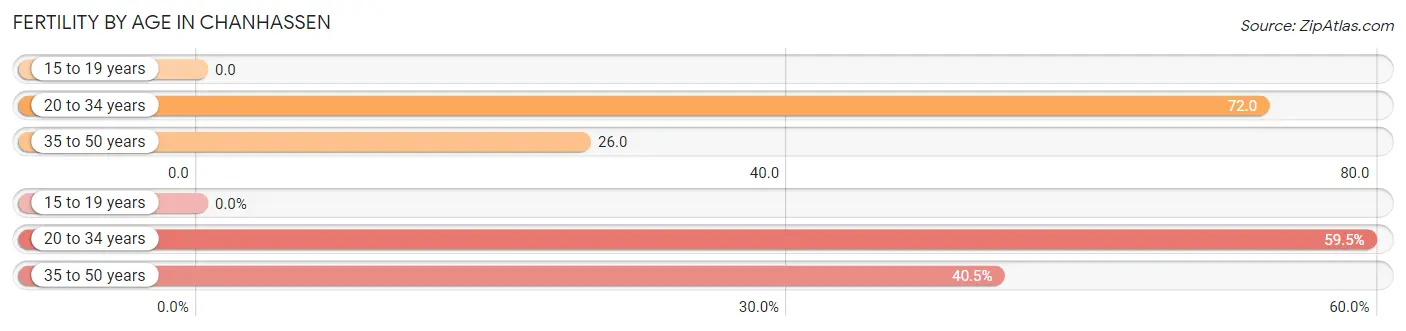
| Age Bracket | Women with Births | Births / 1,000 Women |
| 15 to 19 years | 0 (0.0%) | 0.0 |
| 20 to 34 years | 113 (59.5%) | 72.0 |
| 35 to 50 years | 77 (40.5%) | 26.0 |
| Total | 190 (100.0%) | 36.0 |
Fertility by Age by Marriage Status in Chanhassen
96.8% of women with births (190) in Chanhassen are married. The highest percentage of unmarried women with births falls into 35 to 50 years age bracket with 7.8% of them unmarried at the time of birth, while the lowest percentage of unmarried women with births belong to 20 to 34 years age bracket with 0.0% of them unmarried.
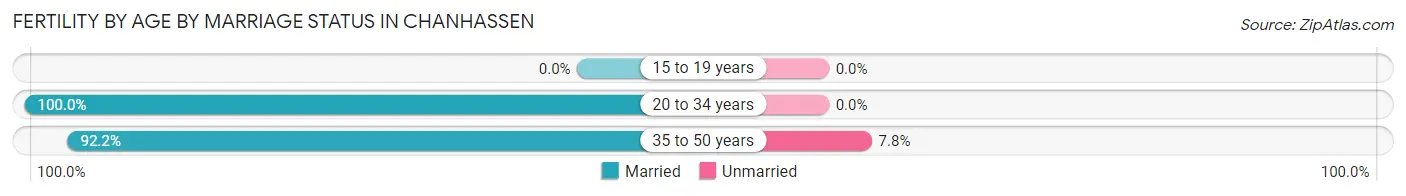
| Age Bracket | Married | Unmarried |
| 15 to 19 years | 0 (0.0%) | 0 (0.0%) |
| 20 to 34 years | 113 (100.0%) | 0 (0.0%) |
| 35 to 50 years | 71 (92.2%) | 6 (7.8%) |
| Total | 184 (96.8%) | 6 (3.2%) |
Fertility by Education in Chanhassen
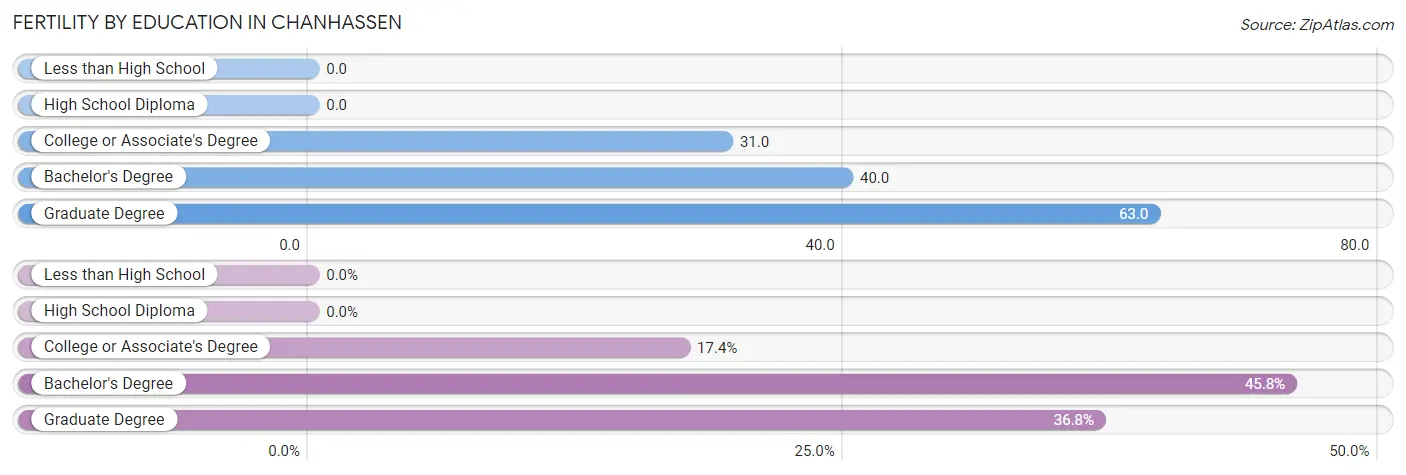
| Educational Attainment | Women with Births | Births / 1,000 Women |
| Less than High School | 0 (0.0%) | 0.0 |
| High School Diploma | 0 (0.0%) | 0.0 |
| College or Associate's Degree | 33 (17.4%) | 31.0 |
| Bachelor's Degree | 87 (45.8%) | 40.0 |
| Graduate Degree | 70 (36.8%) | 63.0 |
| Total | 190 (100.0%) | 36.0 |
Fertility by Education by Marriage Status in Chanhassen
3.2% of women with births in Chanhassen are unmarried. Women with the educational attainment of college or associate's degree are most likely to be married with 100.0% of them married at childbirth, while women with the educational attainment of bachelor's degree are least likely to be married with 6.9% of them unmarried at childbirth.
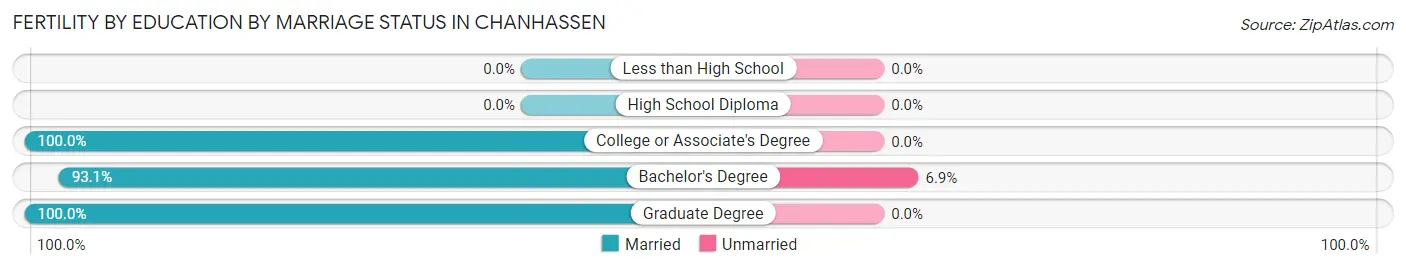
| Educational Attainment | Married | Unmarried |
| Less than High School | 0 (0.0%) | 0 (0.0%) |
| High School Diploma | 0 (0.0%) | 0 (0.0%) |
| College or Associate's Degree | 33 (100.0%) | 0 (0.0%) |
| Bachelor's Degree | 81 (93.1%) | 6 (6.9%) |
| Graduate Degree | 70 (100.0%) | 0 (0.0%) |
| Total | 184 (96.8%) | 6 (3.2%) |
Income in Chanhassen
Income Overview in Chanhassen
Per Capita Income in Chanhassen is $67,775, while median incomes of families and households are $166,101 and $131,633 respectively.
| Characteristic | Number | Measure |
| Per Capita Income | 25,868 | $67,775 |
| Median Family Income | 7,081 | $166,101 |
| Mean Family Income | 7,081 | $210,488 |
| Median Household Income | 9,578 | $131,633 |
| Mean Household Income | 9,578 | $179,719 |
| Income Deficit | 7,081 | $10,357 |
| Wage / Income Gap (%) | 25,868 | 46.52% |
| Wage / Income Gap ($) | 25,868 | 53.48¢ per $1 |
| Gini / Inequality Index | 25,868 | 0.44 |
Earnings by Sex in Chanhassen
Average Earnings in Chanhassen are $63,738, $90,911 for men and $48,618 for women, a difference of 46.5%.
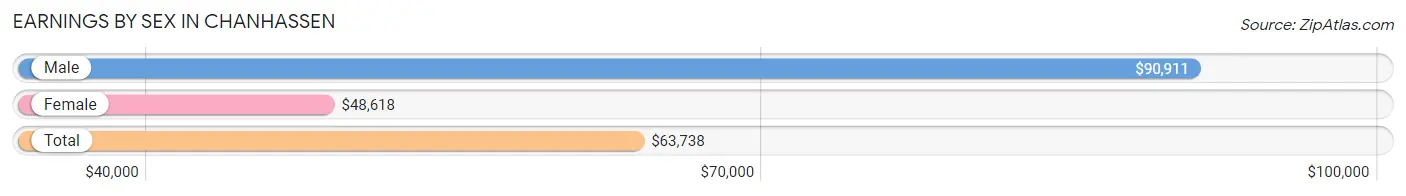
| Sex | Number | Average Earnings |
| Male | 7,888 (53.1%) | $90,911 |
| Female | 6,969 (46.9%) | $48,618 |
| Total | 14,857 (100.0%) | $63,738 |
Earnings by Sex by Income Bracket in Chanhassen
The most common earnings brackets in Chanhassen are $100,000+ for men (3,608 | 45.7%) and $100,000+ for women (1,501 | 21.5%).
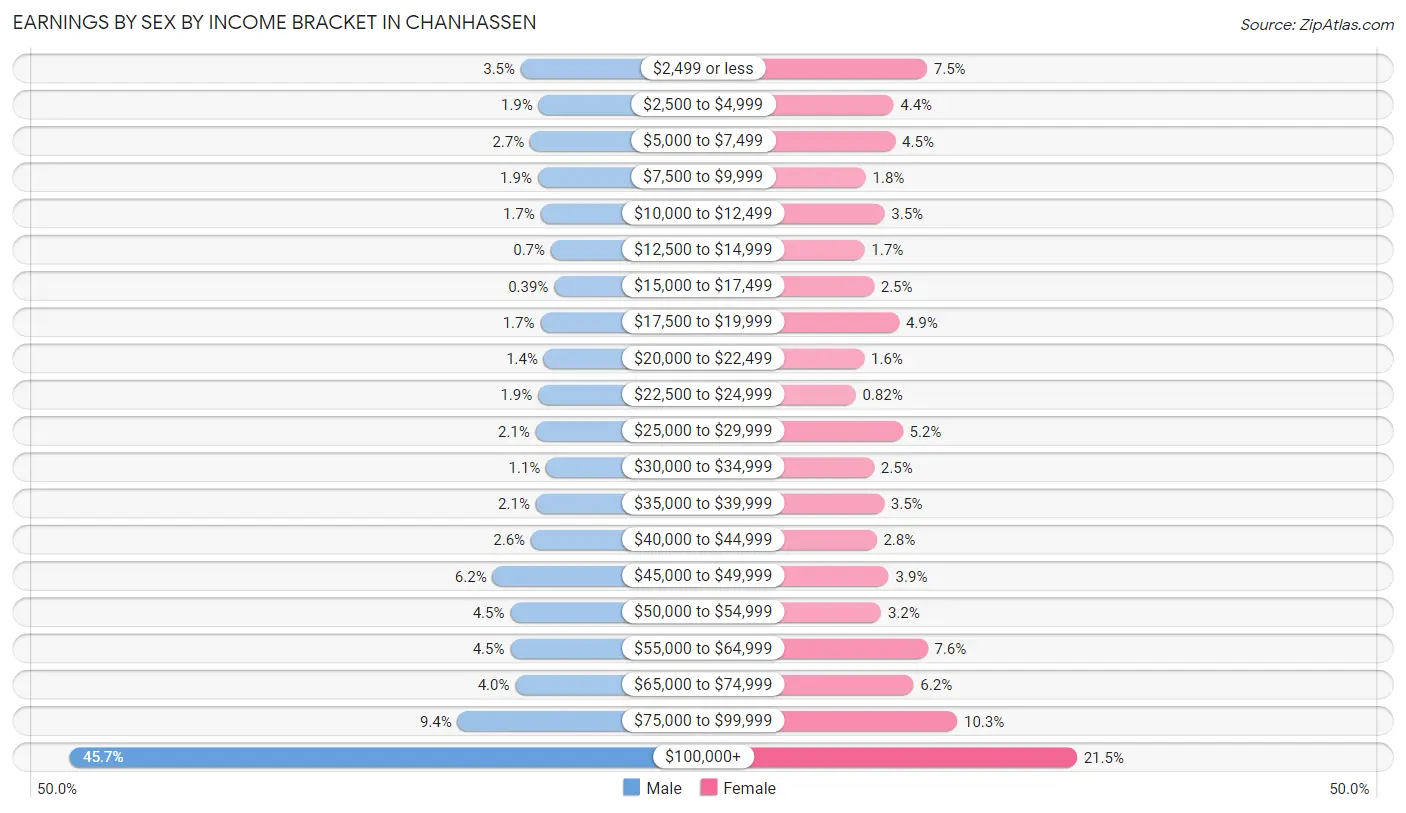
| Income | Male | Female |
| $2,499 or less | 277 (3.5%) | 523 (7.5%) |
| $2,500 to $4,999 | 146 (1.8%) | 304 (4.4%) |
| $5,000 to $7,499 | 209 (2.6%) | 316 (4.5%) |
| $7,500 to $9,999 | 152 (1.9%) | 123 (1.8%) |
| $10,000 to $12,499 | 132 (1.7%) | 245 (3.5%) |
| $12,500 to $14,999 | 55 (0.7%) | 115 (1.7%) |
| $15,000 to $17,499 | 31 (0.4%) | 176 (2.5%) |
| $17,500 to $19,999 | 133 (1.7%) | 341 (4.9%) |
| $20,000 to $22,499 | 107 (1.4%) | 113 (1.6%) |
| $22,500 to $24,999 | 150 (1.9%) | 57 (0.8%) |
| $25,000 to $29,999 | 168 (2.1%) | 364 (5.2%) |
| $30,000 to $34,999 | 90 (1.1%) | 177 (2.5%) |
| $35,000 to $39,999 | 167 (2.1%) | 242 (3.5%) |
| $40,000 to $44,999 | 203 (2.6%) | 194 (2.8%) |
| $45,000 to $49,999 | 487 (6.2%) | 273 (3.9%) |
| $50,000 to $54,999 | 355 (4.5%) | 223 (3.2%) |
| $55,000 to $64,999 | 355 (4.5%) | 527 (7.6%) |
| $65,000 to $74,999 | 318 (4.0%) | 435 (6.2%) |
| $75,000 to $99,999 | 745 (9.4%) | 720 (10.3%) |
| $100,000+ | 3,608 (45.7%) | 1,501 (21.5%) |
| Total | 7,888 (100.0%) | 6,969 (100.0%) |
Earnings by Sex by Educational Attainment in Chanhassen
Average earnings in Chanhassen are $105,102 for men and $57,486 for women, a difference of 45.3%. Men with an educational attainment of graduate degree enjoy the highest average annual earnings of $168,167, while those with high school diploma education earn the least with $50,917. Women with an educational attainment of graduate degree earn the most with the average annual earnings of $91,715, while those with college or associate's degree education have the smallest earnings of $34,022.
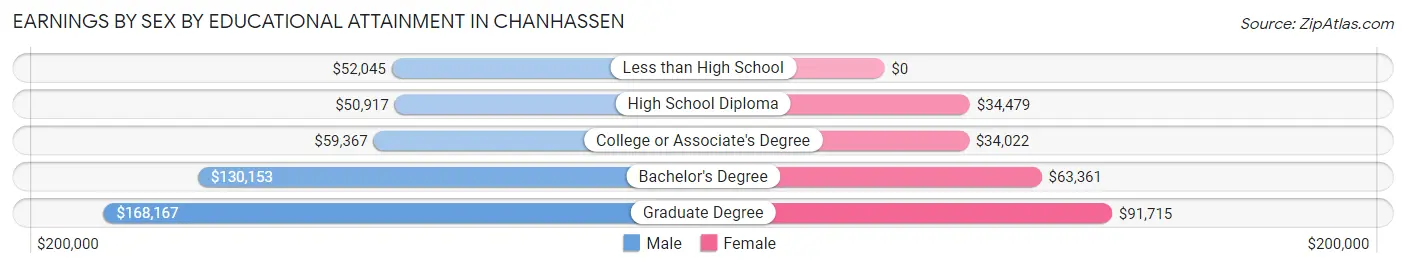
| Educational Attainment | Male Income | Female Income |
| Less than High School | $52,045 | $0 |
| High School Diploma | $50,917 | $34,479 |
| College or Associate's Degree | $59,367 | $34,022 |
| Bachelor's Degree | $130,153 | $63,361 |
| Graduate Degree | $168,167 | $91,715 |
| Total | $105,102 | $57,486 |
Family Income in Chanhassen
Family Income Brackets in Chanhassen
According to the Chanhassen family income data, there are 2,995 families falling into the $200,000+ income range, which is the most common income bracket and makes up 42.3% of all families. Conversely, the $10,000 to $14,999 income bracket is the least frequent group with only 14 families (0.2%) belonging to this category.
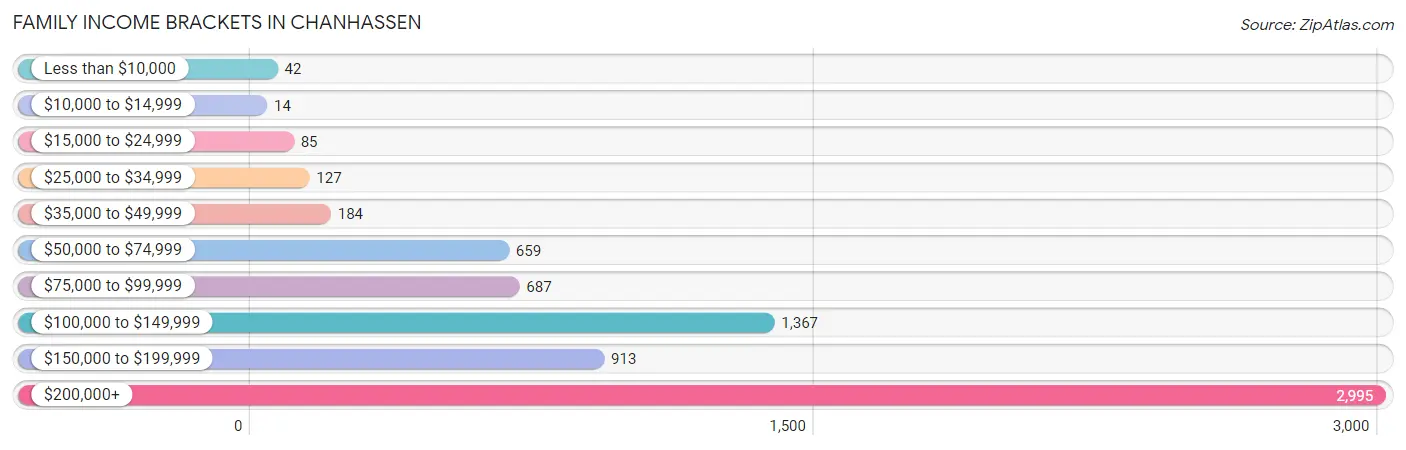
| Income Bracket | # Families | % Families |
| Less than $10,000 | 42 | 0.6% |
| $10,000 to $14,999 | 14 | 0.2% |
| $15,000 to $24,999 | 85 | 1.2% |
| $25,000 to $34,999 | 127 | 1.8% |
| $35,000 to $49,999 | 184 | 2.6% |
| $50,000 to $74,999 | 659 | 9.3% |
| $75,000 to $99,999 | 687 | 9.7% |
| $100,000 to $149,999 | 1,367 | 19.3% |
| $150,000 to $199,999 | 913 | 12.9% |
| $200,000+ | 2,995 | 42.3% |
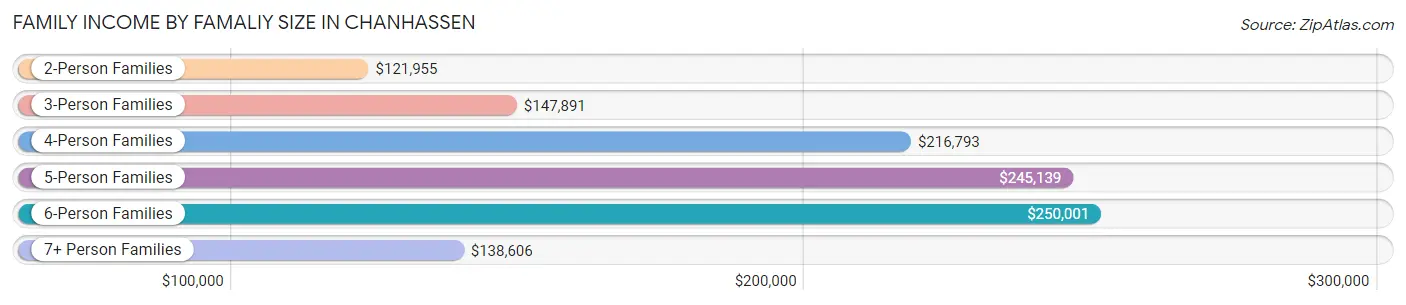
Family Income by Famaliy Size in Chanhassen
6-person families (128 | 1.8%) account for the highest median family income in Chanhassen with $250,001 per family, while 2-person families (3,341 | 47.2%) have the highest median income of $60,978 per family member.
| Income Bracket | # Families | Median Income |
| 2-Person Families | 3,341 (47.2%) | $121,955 |
| 3-Person Families | 1,351 (19.1%) | $147,891 |
| 4-Person Families | 1,635 (23.1%) | $216,793 |
| 5-Person Families | 559 (7.9%) | $245,139 |
| 6-Person Families | 128 (1.8%) | $250,001 |
| 7+ Person Families | 67 (0.9%) | $138,606 |
| Total | 7,081 (100.0%) | $166,101 |
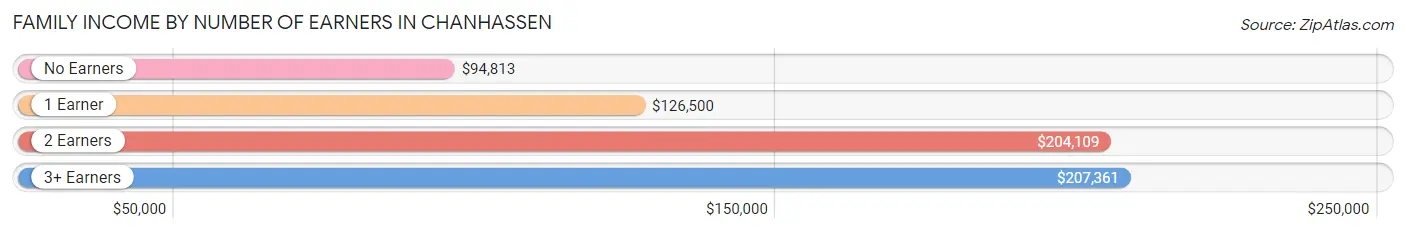
Family Income by Number of Earners in Chanhassen
The median family income in Chanhassen is $166,101, with families comprising 3+ earners (859) having the highest median family income of $207,361, while families with no earners (842) have the lowest median family income of $94,813, accounting for 12.1% and 11.9% of families, respectively.
| Number of Earners | # Families | Median Income |
| No Earners | 842 (11.9%) | $94,813 |
| 1 Earner | 1,864 (26.3%) | $126,500 |
| 2 Earners | 3,516 (49.6%) | $204,109 |
| 3+ Earners | 859 (12.1%) | $207,361 |
| Total | 7,081 (100.0%) | $166,101 |
Household Income in Chanhassen
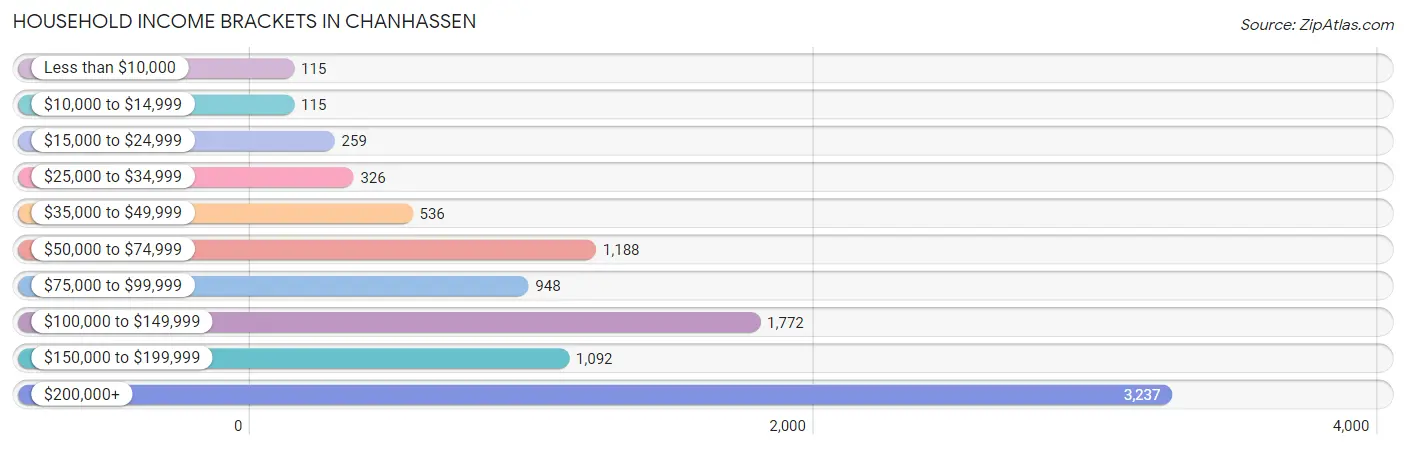
Household Income Brackets in Chanhassen
With 3,237 households falling in the category, the $200,000+ income range is the most frequent in Chanhassen, accounting for 33.8% of all households. In contrast, only 115 households (1.2%) fall into the less than $10,000 income bracket, making it the least populous group.
| Income Bracket | # Households | % Households |
| Less than $10,000 | 115 | 1.2% |
| $10,000 to $14,999 | 115 | 1.2% |
| $15,000 to $24,999 | 259 | 2.7% |
| $25,000 to $34,999 | 326 | 3.4% |
| $35,000 to $49,999 | 536 | 5.6% |
| $50,000 to $74,999 | 1,188 | 12.4% |
| $75,000 to $99,999 | 948 | 9.9% |
| $100,000 to $149,999 | 1,772 | 18.5% |
| $150,000 to $199,999 | 1,092 | 11.4% |
| $200,000+ | 3,237 | 33.8% |
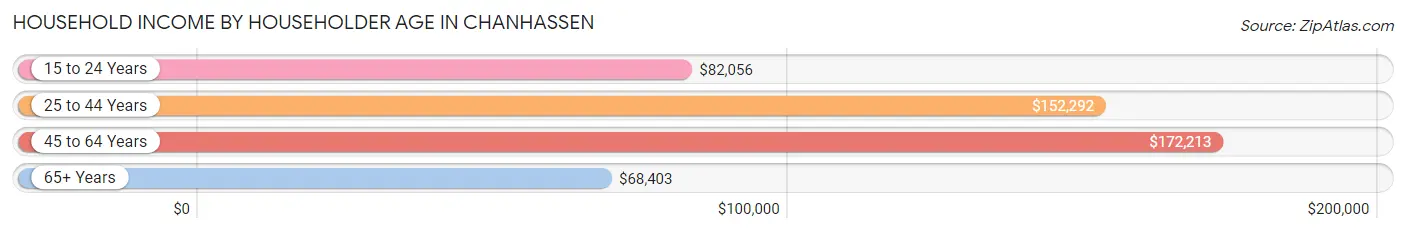
Household Income by Householder Age in Chanhassen
The median household income in Chanhassen is $131,633, with the highest median household income of $172,213 found in the 45 to 64 years age bracket for the primary householder. A total of 4,402 households (46.0%) fall into this category. Meanwhile, the 65+ years age bracket for the primary householder has the lowest median household income of $68,403, with 2,309 households (24.1%) in this group.
| Income Bracket | # Households | Median Income |
| 15 to 24 Years | 83 (0.9%) | $82,056 |
| 25 to 44 Years | 2,784 (29.1%) | $152,292 |
| 45 to 64 Years | 4,402 (46.0%) | $172,213 |
| 65+ Years | 2,309 (24.1%) | $68,403 |
| Total | 9,578 (100.0%) | $131,633 |
Poverty in Chanhassen
Income Below Poverty by Sex and Age in Chanhassen
With 1.8% poverty level for males and 3.4% for females among the residents of Chanhassen, 16 and 17 year old males and 75 year old and over females are the most vulnerable to poverty, with 28 males (7.3%) and 70 females (8.9%) in their respective age groups living below the poverty level.
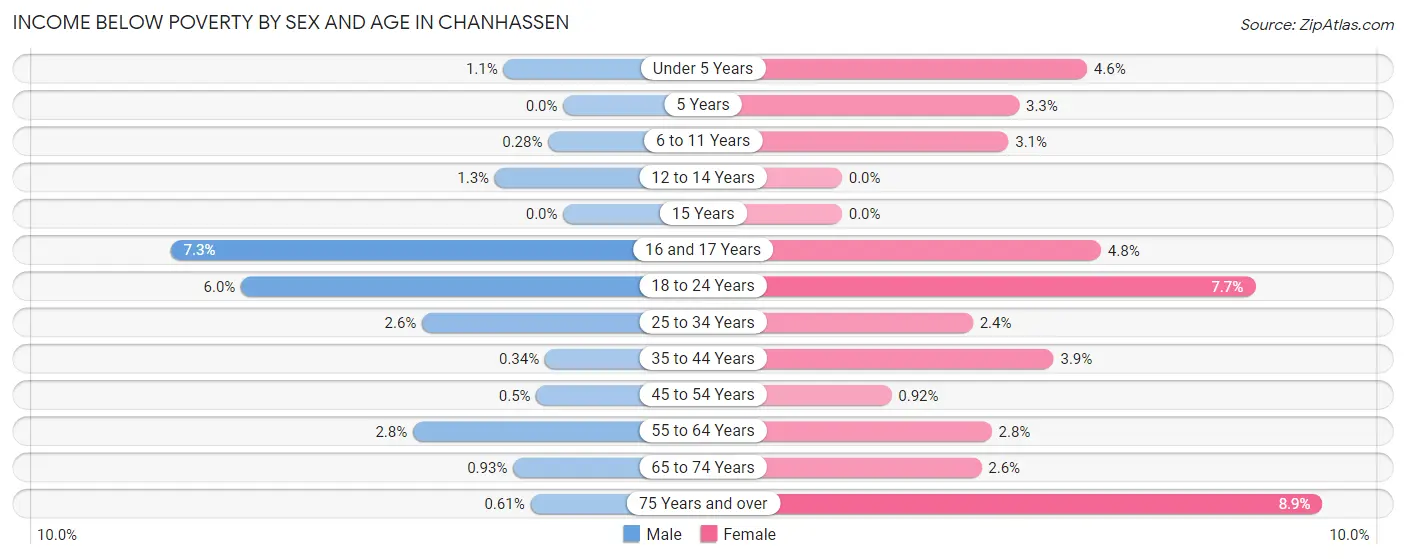
| Age Bracket | Male | Female |
| Under 5 Years | 7 (1.1%) | 30 (4.5%) |
| 5 Years | 0 (0.0%) | 12 (3.3%) |
| 6 to 11 Years | 4 (0.3%) | 34 (3.1%) |
| 12 to 14 Years | 7 (1.3%) | 0 (0.0%) |
| 15 Years | 0 (0.0%) | 0 (0.0%) |
| 16 and 17 Years | 28 (7.3%) | 15 (4.8%) |
| 18 to 24 Years | 66 (6.0%) | 62 (7.7%) |
| 25 to 34 Years | 32 (2.6%) | 26 (2.4%) |
| 35 to 44 Years | 6 (0.3%) | 76 (3.9%) |
| 45 to 54 Years | 9 (0.5%) | 16 (0.9%) |
| 55 to 64 Years | 54 (2.8%) | 58 (2.8%) |
| 65 to 74 Years | 9 (0.9%) | 35 (2.6%) |
| 75 Years and over | 4 (0.6%) | 70 (8.9%) |
| Total | 226 (1.8%) | 434 (3.4%) |
Income Above Poverty by Sex and Age in Chanhassen
According to the poverty statistics in Chanhassen, males aged 5 years and females aged 12 to 14 years are the age groups that are most secure financially, with 100.0% of males and 100.0% of females in these age groups living above the poverty line.
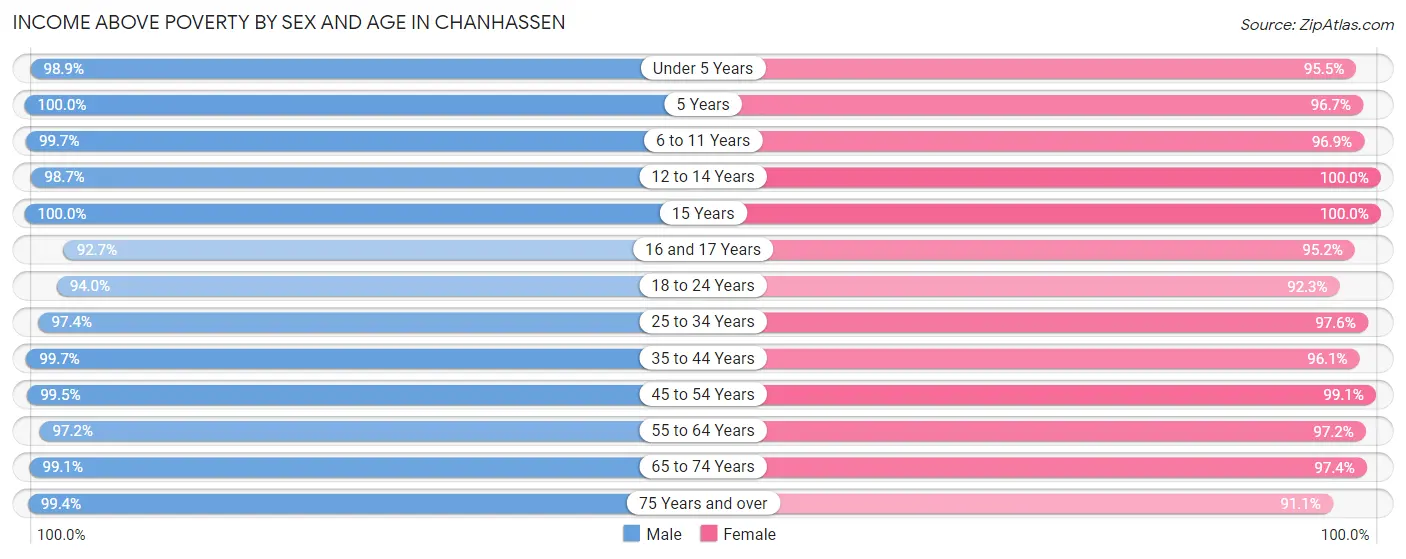
| Age Bracket | Male | Female |
| Under 5 Years | 621 (98.9%) | 630 (95.5%) |
| 5 Years | 140 (100.0%) | 353 (96.7%) |
| 6 to 11 Years | 1,440 (99.7%) | 1,066 (96.9%) |
| 12 to 14 Years | 543 (98.7%) | 558 (100.0%) |
| 15 Years | 220 (100.0%) | 182 (100.0%) |
| 16 and 17 Years | 356 (92.7%) | 297 (95.2%) |
| 18 to 24 Years | 1,037 (94.0%) | 746 (92.3%) |
| 25 to 34 Years | 1,189 (97.4%) | 1,046 (97.6%) |
| 35 to 44 Years | 1,777 (99.7%) | 1,859 (96.1%) |
| 45 to 54 Years | 1,798 (99.5%) | 1,717 (99.1%) |
| 55 to 64 Years | 1,884 (97.2%) | 2,028 (97.2%) |
| 65 to 74 Years | 963 (99.1%) | 1,316 (97.4%) |
| 75 Years and over | 654 (99.4%) | 715 (91.1%) |
| Total | 12,622 (98.2%) | 12,513 (96.7%) |
Income Below Poverty Among Married-Couple Families in Chanhassen
The poverty statistics for married-couple families in Chanhassen show that 0.9% or 53 of the total 5,977 families live below the poverty line. Families with 3 or 4 children have the highest poverty rate of 2.2%, comprising of 13 families. On the other hand, families with 1 or 2 children have the lowest poverty rate of 0.0%, which includes 0 families.
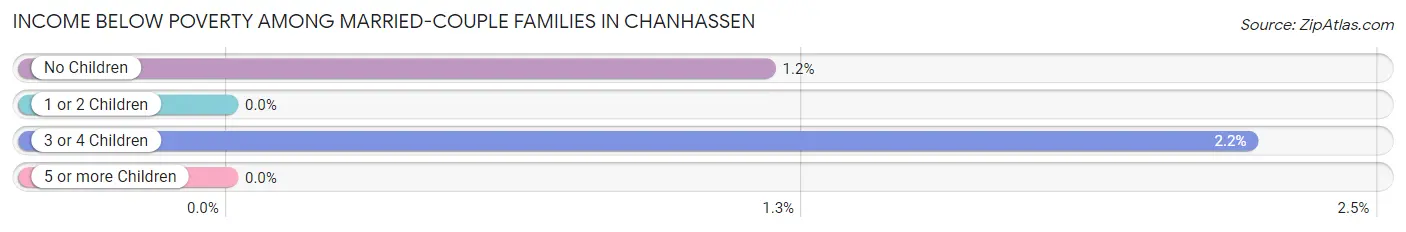
| Children | Above Poverty | Below Poverty |
| No Children | 3,381 (98.8%) | 40 (1.2%) |
| 1 or 2 Children | 1,970 (100.0%) | 0 (0.0%) |
| 3 or 4 Children | 573 (97.8%) | 13 (2.2%) |
| 5 or more Children | 0 (0.0%) | 0 (0.0%) |
| Total | 5,924 (99.1%) | 53 (0.9%) |
Income Below Poverty Among Single-Parent Households in Chanhassen
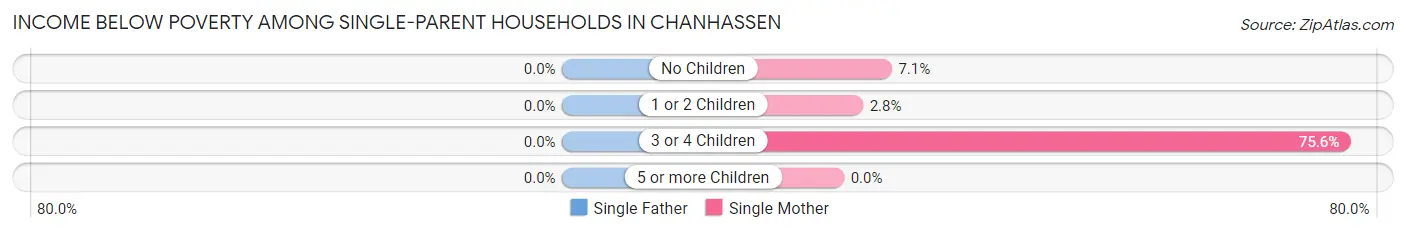
| Children | Single Father | Single Mother |
| No Children | 0 (0.0%) | 24 (7.1%) |
| 1 or 2 Children | 0 (0.0%) | 13 (2.8%) |
| 3 or 4 Children | 0 (0.0%) | 31 (75.6%) |
| 5 or more Children | 0 (0.0%) | 0 (0.0%) |
| Total | 0 (0.0%) | 68 (8.1%) |
Income Below Poverty Among Married-Couple vs Single-Parent Households in Chanhassen
The poverty data for Chanhassen shows that 53 of the married-couple family households (0.9%) and 68 of the single-parent households (6.2%) are living below the poverty level. Within the married-couple family households, those with 3 or 4 children have the highest poverty rate, with 13 households (2.2%) falling below the poverty line. Among the single-parent households, those with 3 or 4 children have the highest poverty rate, with 31 household (50.0%) living below poverty.
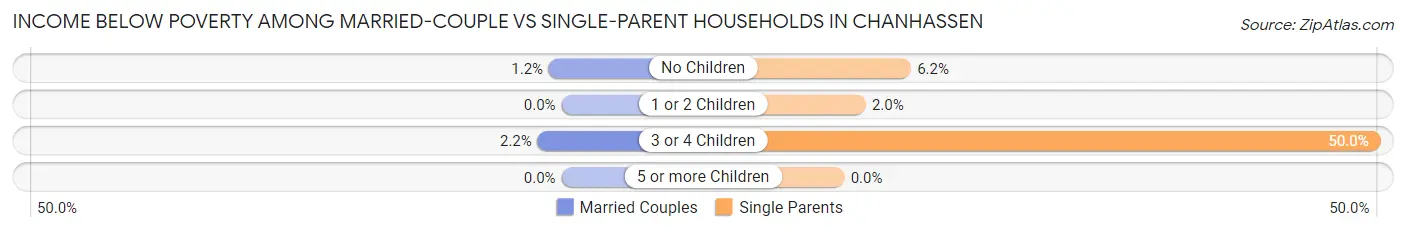
| Children | Married-Couple Families | Single-Parent Households |
| No Children | 40 (1.2%) | 24 (6.2%) |
| 1 or 2 Children | 0 (0.0%) | 13 (2.0%) |
| 3 or 4 Children | 13 (2.2%) | 31 (50.0%) |
| 5 or more Children | 0 (0.0%) | 0 (0.0%) |
| Total | 53 (0.9%) | 68 (6.2%) |
Employment Characteristics in Chanhassen
Employment by Class of Employer in Chanhassen
Among the 13,320 employed individuals in Chanhassen, private company employees (9,890 | 74.3%), not-for-profit organizations (982 | 7.4%), and local government employees (760 | 5.7%) make up the most common classes of employment.
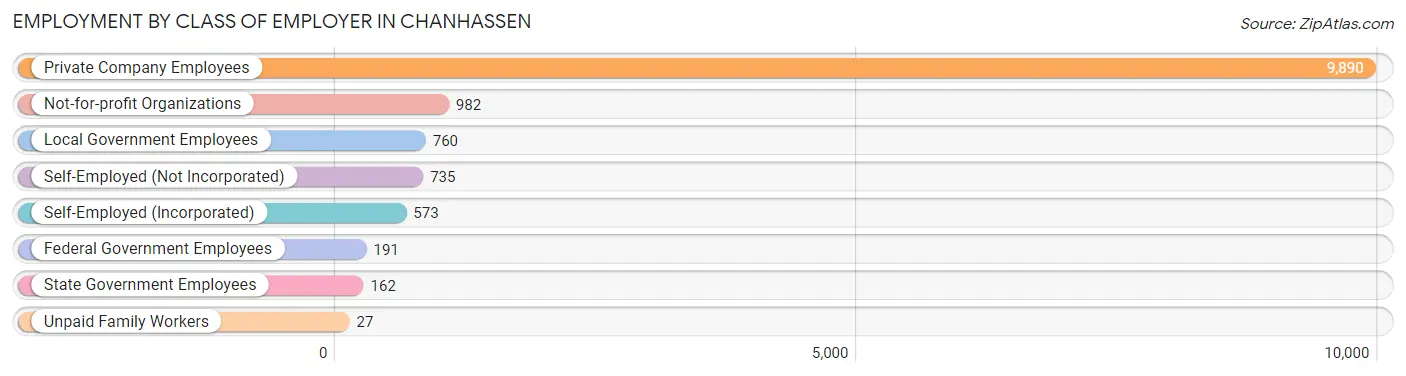
| Employer Class | # Employees | % Employees |
| Private Company Employees | 9,890 | 74.3% |
| Self-Employed (Incorporated) | 573 | 4.3% |
| Self-Employed (Not Incorporated) | 735 | 5.5% |
| Not-for-profit Organizations | 982 | 7.4% |
| Local Government Employees | 760 | 5.7% |
| State Government Employees | 162 | 1.2% |
| Federal Government Employees | 191 | 1.4% |
| Unpaid Family Workers | 27 | 0.2% |
| Total | 13,320 | 100.0% |
Employment Status by Age in Chanhassen
According to the labor force statistics for Chanhassen, out of the total population over 16 years of age (19,951), 69.8% or 13,926 individuals are in the labor force, with 3.5% or 487 of them unemployed. The age group with the highest labor force participation rate is 25 to 29 years, with 92.6% or 885 individuals in the labor force. Within the labor force, the 16 to 19 years age range has the highest percentage of unemployed individuals, with 16.3% or 106 of them being unemployed.
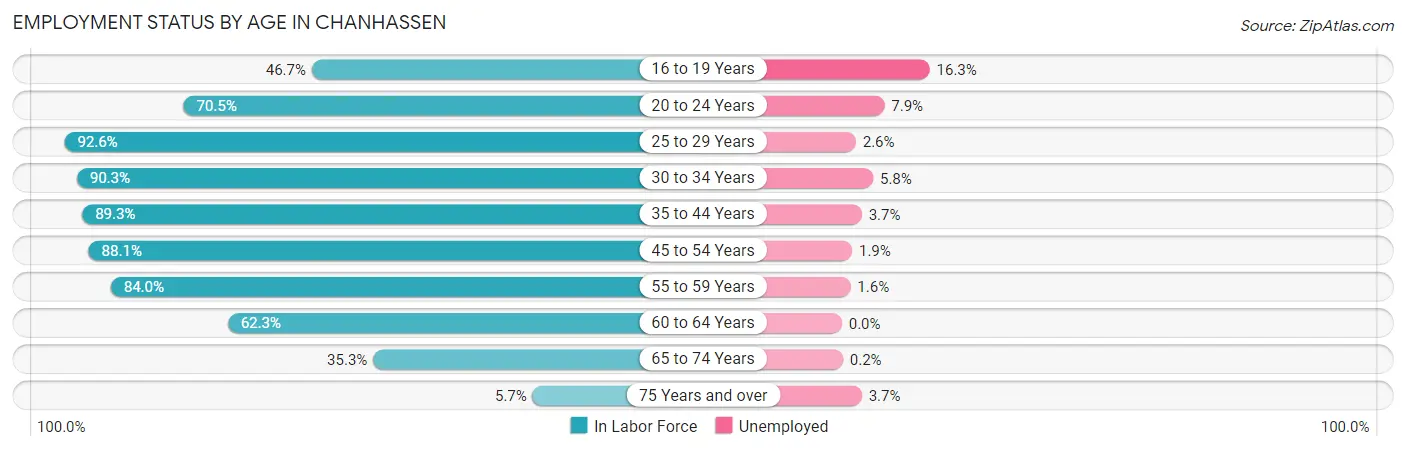
| Age Bracket | In Labor Force | Unemployed |
| 16 to 19 Years | 650 (46.7%) | 106 (16.3%) |
| 20 to 24 Years | 857 (70.5%) | 68 (7.9%) |
| 25 to 29 Years | 885 (92.6%) | 23 (2.6%) |
| 30 to 34 Years | 1,207 (90.3%) | 70 (5.8%) |
| 35 to 44 Years | 3,320 (89.3%) | 123 (3.7%) |
| 45 to 54 Years | 3,119 (88.1%) | 59 (1.9%) |
| 55 to 59 Years | 1,853 (84.0%) | 30 (1.6%) |
| 60 to 64 Years | 1,133 (62.3%) | 0 (0.0%) |
| 65 to 74 Years | 820 (35.3%) | 2 (0.2%) |
| 75 Years and over | 82 (5.7%) | 3 (3.7%) |
| Total | 13,926 (69.8%) | 487 (3.5%) |
Employment Status by Educational Attainment in Chanhassen
According to labor force statistics for Chanhassen, 84.8% of individuals (11,512) out of the total population between 25 and 64 years of age (13,575) are in the labor force, with 2.7% or 311 of them being unemployed. The group with the highest labor force participation rate are those with the educational attainment of college / associate degree, with 89.2% or 2,724 individuals in the labor force. Within the labor force, individuals with high school diploma education have the highest percentage of unemployment, with 6.9% or 49 of them being unemployed.
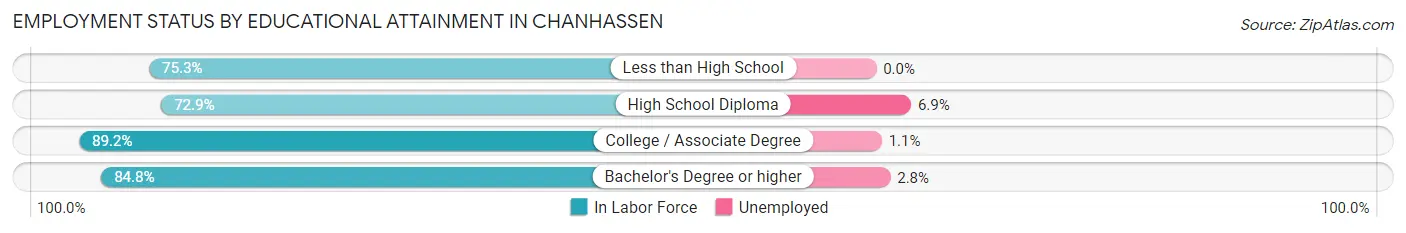
| Educational Attainment | In Labor Force | Unemployed |
| Less than High School | 119 (75.3%) | 0 (0.0%) |
| High School Diploma | 715 (72.9%) | 68 (6.9%) |
| College / Associate Degree | 2,724 (89.2%) | 34 (1.1%) |
| Bachelor's Degree or higher | 7,956 (84.8%) | 263 (2.8%) |
| Total | 11,512 (84.8%) | 367 (2.7%) |
Employment Occupations by Sex in Chanhassen
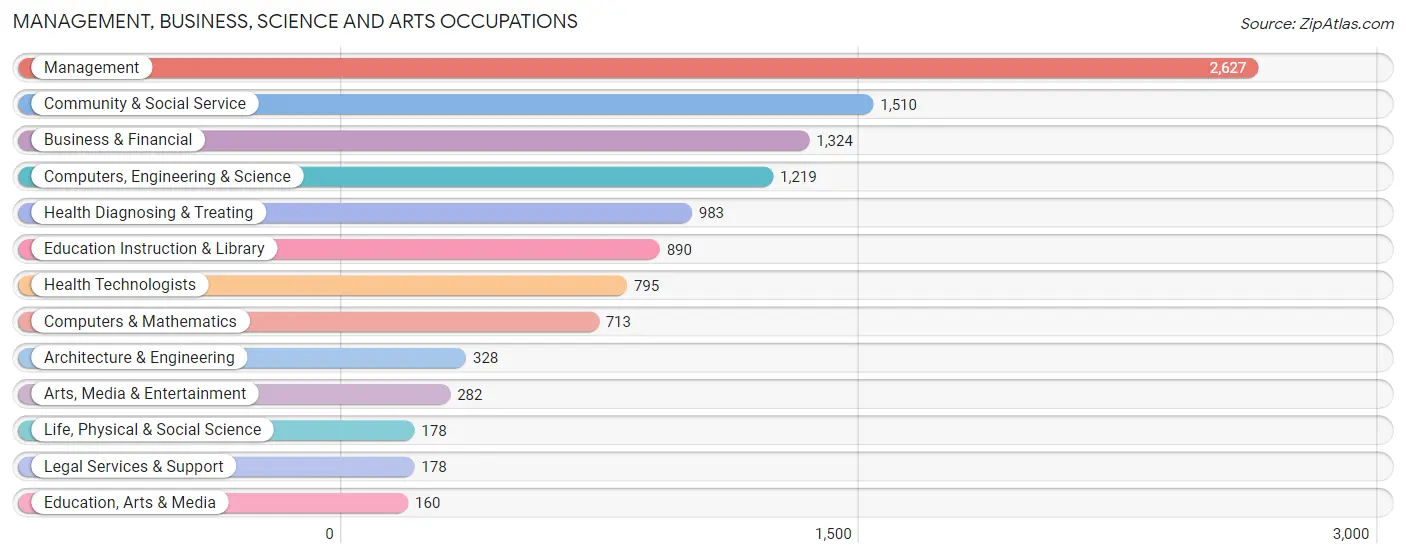
Management, Business, Science and Arts Occupations
The most common Management, Business, Science and Arts occupations in Chanhassen are Management (2,627 | 19.6%), Community & Social Service (1,510 | 11.2%), Business & Financial (1,324 | 9.9%), Computers, Engineering & Science (1,219 | 9.1%), and Health Diagnosing & Treating (983 | 7.3%).
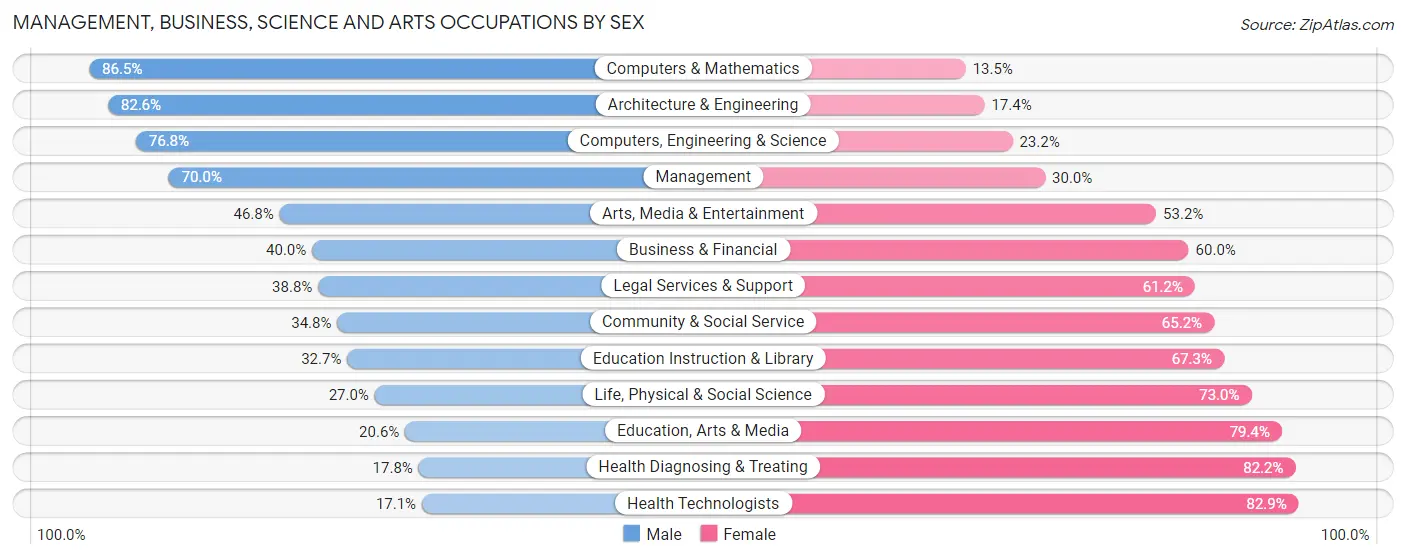
Management, Business, Science and Arts Occupations by Sex
Within the Management, Business, Science and Arts occupations in Chanhassen, the most male-oriented occupations are Computers & Mathematics (86.5%), Architecture & Engineering (82.6%), and Computers, Engineering & Science (76.8%), while the most female-oriented occupations are Health Technologists (82.9%), Health Diagnosing & Treating (82.2%), and Education, Arts & Media (79.4%).
| Occupation | Male | Female |
| Management | 1,838 (70.0%) | 789 (30.0%) |
| Business & Financial | 530 (40.0%) | 794 (60.0%) |
| Computers, Engineering & Science | 936 (76.8%) | 283 (23.2%) |
| Computers & Mathematics | 617 (86.5%) | 96 (13.5%) |
| Architecture & Engineering | 271 (82.6%) | 57 (17.4%) |
| Life, Physical & Social Science | 48 (27.0%) | 130 (73.0%) |
| Community & Social Service | 525 (34.8%) | 985 (65.2%) |
| Education, Arts & Media | 33 (20.6%) | 127 (79.4%) |
| Legal Services & Support | 69 (38.8%) | 109 (61.2%) |
| Education Instruction & Library | 291 (32.7%) | 599 (67.3%) |
| Arts, Media & Entertainment | 132 (46.8%) | 150 (53.2%) |
| Health Diagnosing & Treating | 175 (17.8%) | 808 (82.2%) |
| Health Technologists | 136 (17.1%) | 659 (82.9%) |
| Total (Category) | 4,004 (52.2%) | 3,659 (47.7%) |
| Total (Overall) | 7,195 (53.5%) | 6,244 (46.5%) |
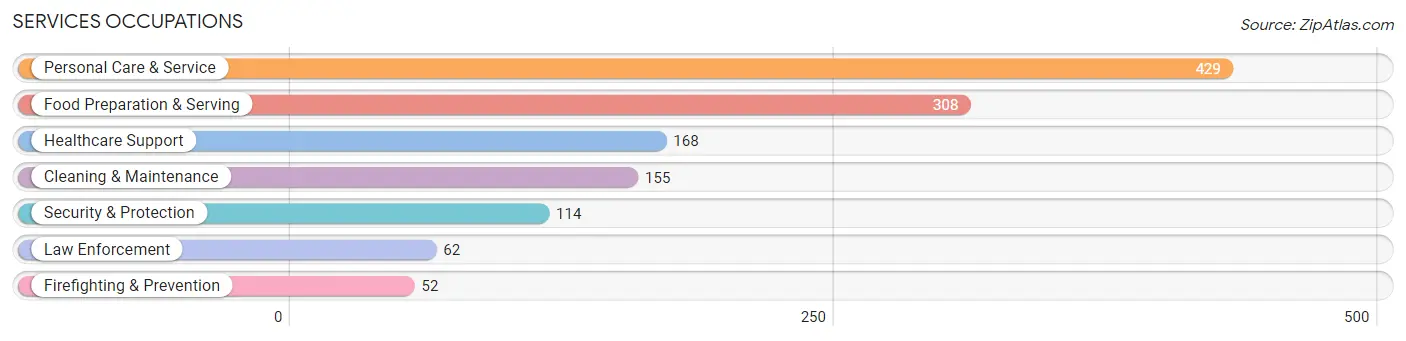
Services Occupations
The most common Services occupations in Chanhassen are Personal Care & Service (429 | 3.2%), Food Preparation & Serving (308 | 2.3%), Healthcare Support (168 | 1.3%), Cleaning & Maintenance (155 | 1.1%), and Security & Protection (114 | 0.9%).
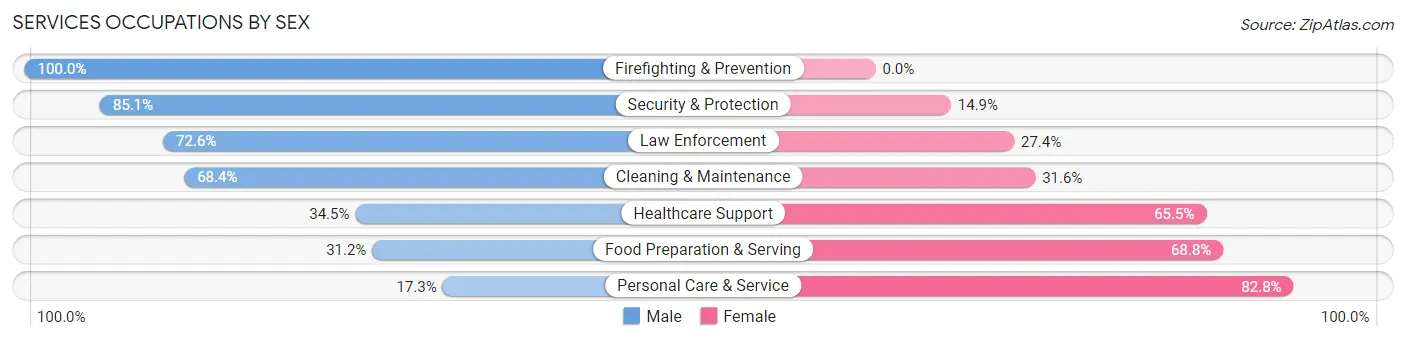
Services Occupations by Sex
Within the Services occupations in Chanhassen, the most male-oriented occupations are Firefighting & Prevention (100.0%), Security & Protection (85.1%), and Law Enforcement (72.6%), while the most female-oriented occupations are Personal Care & Service (82.8%), Food Preparation & Serving (68.8%), and Healthcare Support (65.5%).
| Occupation | Male | Female |
| Healthcare Support | 58 (34.5%) | 110 (65.5%) |
| Security & Protection | 97 (85.1%) | 17 (14.9%) |
| Firefighting & Prevention | 52 (100.0%) | 0 (0.0%) |
| Law Enforcement | 45 (72.6%) | 17 (27.4%) |
| Food Preparation & Serving | 96 (31.2%) | 212 (68.8%) |
| Cleaning & Maintenance | 106 (68.4%) | 49 (31.6%) |
| Personal Care & Service | 74 (17.2%) | 355 (82.8%) |
| Total (Category) | 431 (36.7%) | 743 (63.3%) |
| Total (Overall) | 7,195 (53.5%) | 6,244 (46.5%) |
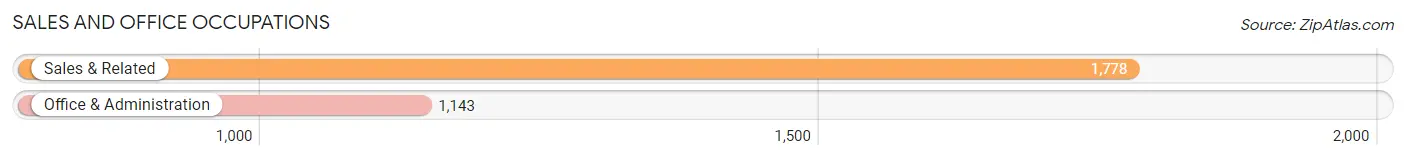
Sales and Office Occupations
The most common Sales and Office occupations in Chanhassen are Sales & Related (1,778 | 13.2%), and Office & Administration (1,143 | 8.5%).
Sales and Office Occupations by Sex
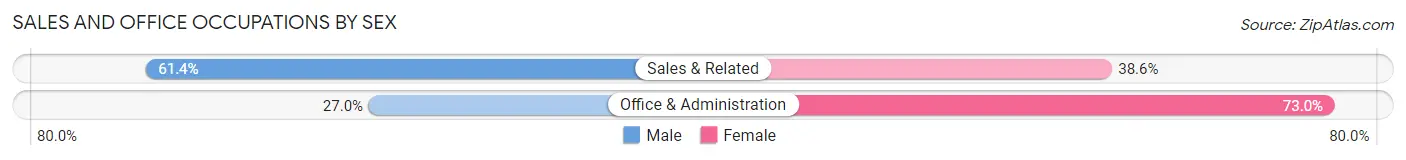
| Occupation | Male | Female |
| Sales & Related | 1,092 (61.4%) | 686 (38.6%) |
| Office & Administration | 309 (27.0%) | 834 (73.0%) |
| Total (Category) | 1,401 (48.0%) | 1,520 (52.0%) |
| Total (Overall) | 7,195 (53.5%) | 6,244 (46.5%) |
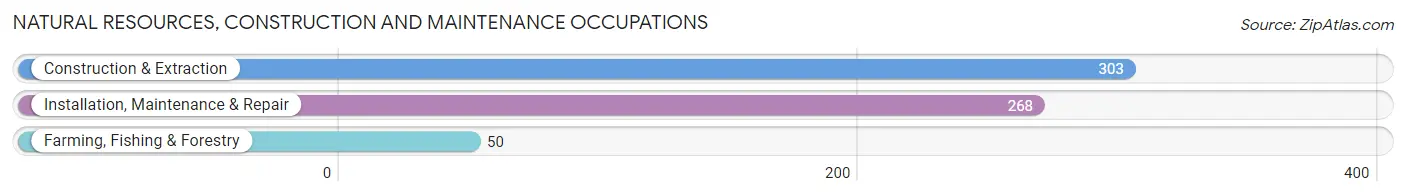
Natural Resources, Construction and Maintenance Occupations
The most common Natural Resources, Construction and Maintenance occupations in Chanhassen are Construction & Extraction (303 | 2.2%), Installation, Maintenance & Repair (268 | 2.0%), and Farming, Fishing & Forestry (50 | 0.4%).
Natural Resources, Construction and Maintenance Occupations by Sex
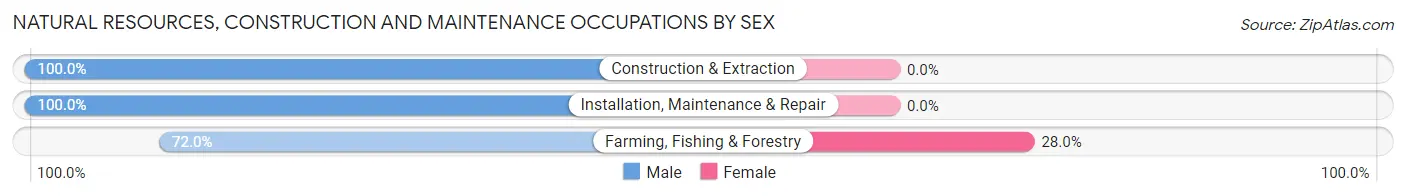
| Occupation | Male | Female |
| Farming, Fishing & Forestry | 36 (72.0%) | 14 (28.0%) |
| Construction & Extraction | 303 (100.0%) | 0 (0.0%) |
| Installation, Maintenance & Repair | 268 (100.0%) | 0 (0.0%) |
| Total (Category) | 607 (97.8%) | 14 (2.2%) |
| Total (Overall) | 7,195 (53.5%) | 6,244 (46.5%) |
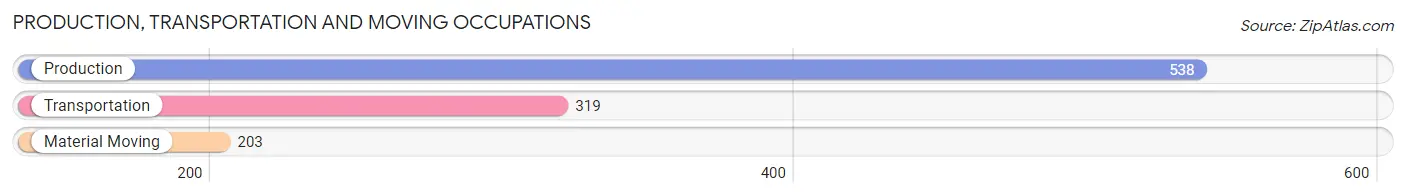
Production, Transportation and Moving Occupations
The most common Production, Transportation and Moving occupations in Chanhassen are Production (538 | 4.0%), Transportation (319 | 2.4%), and Material Moving (203 | 1.5%).
Production, Transportation and Moving Occupations by Sex
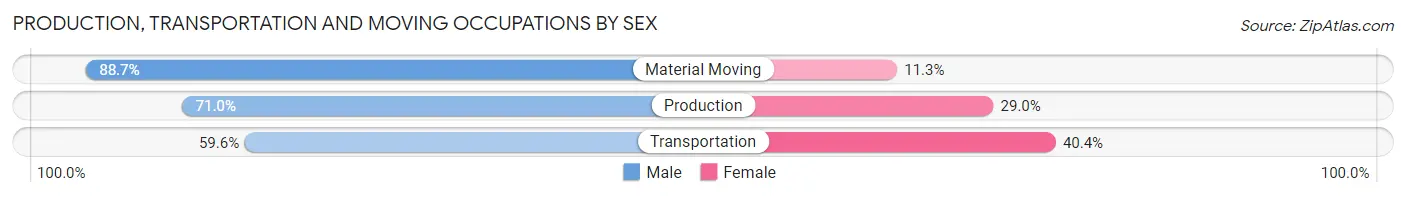
| Occupation | Male | Female |
| Production | 382 (71.0%) | 156 (29.0%) |
| Transportation | 190 (59.6%) | 129 (40.4%) |
| Material Moving | 180 (88.7%) | 23 (11.3%) |
| Total (Category) | 752 (70.9%) | 308 (29.1%) |
| Total (Overall) | 7,195 (53.5%) | 6,244 (46.5%) |
Employment Industries by Sex in Chanhassen
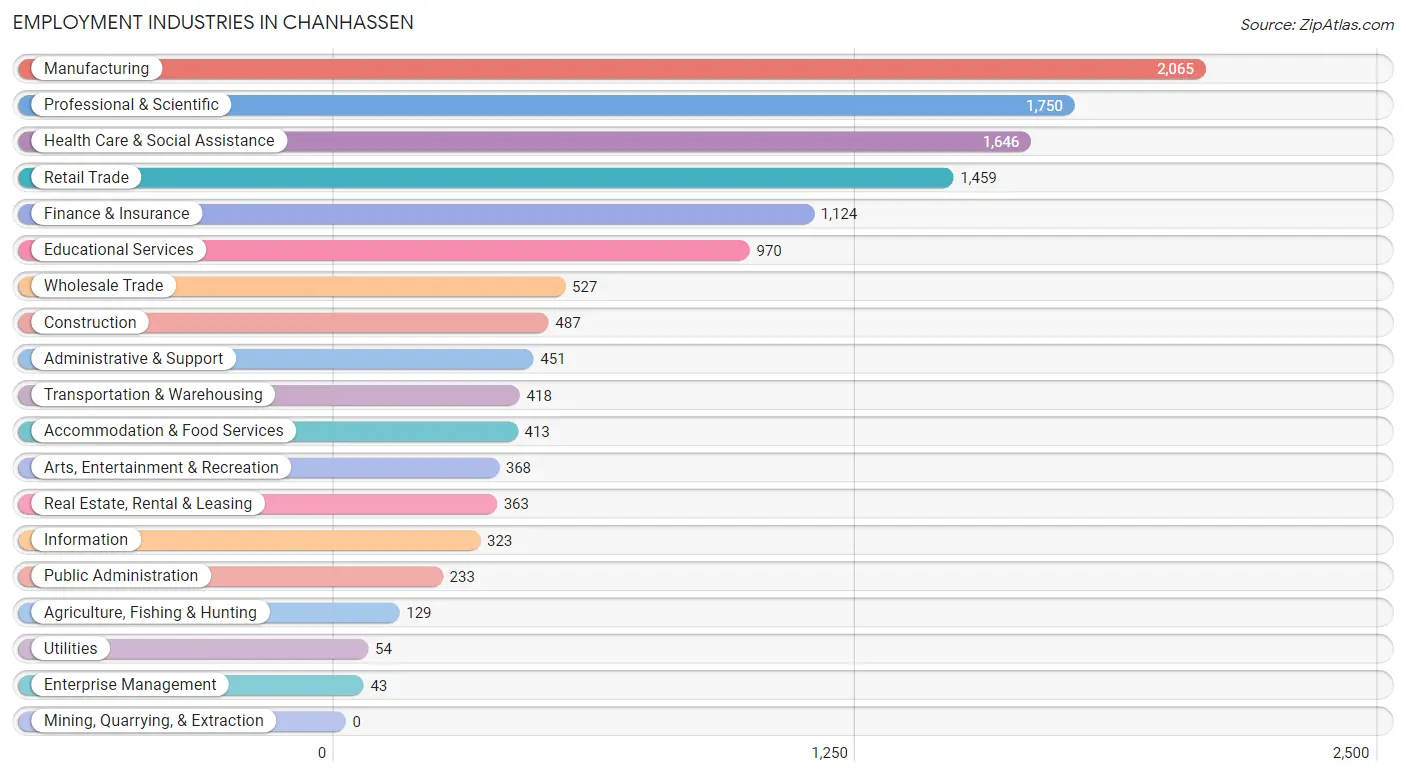
Employment Industries in Chanhassen
The major employment industries in Chanhassen include Manufacturing (2,065 | 15.4%), Professional & Scientific (1,750 | 13.0%), Health Care & Social Assistance (1,646 | 12.2%), Retail Trade (1,459 | 10.9%), and Finance & Insurance (1,124 | 8.4%).
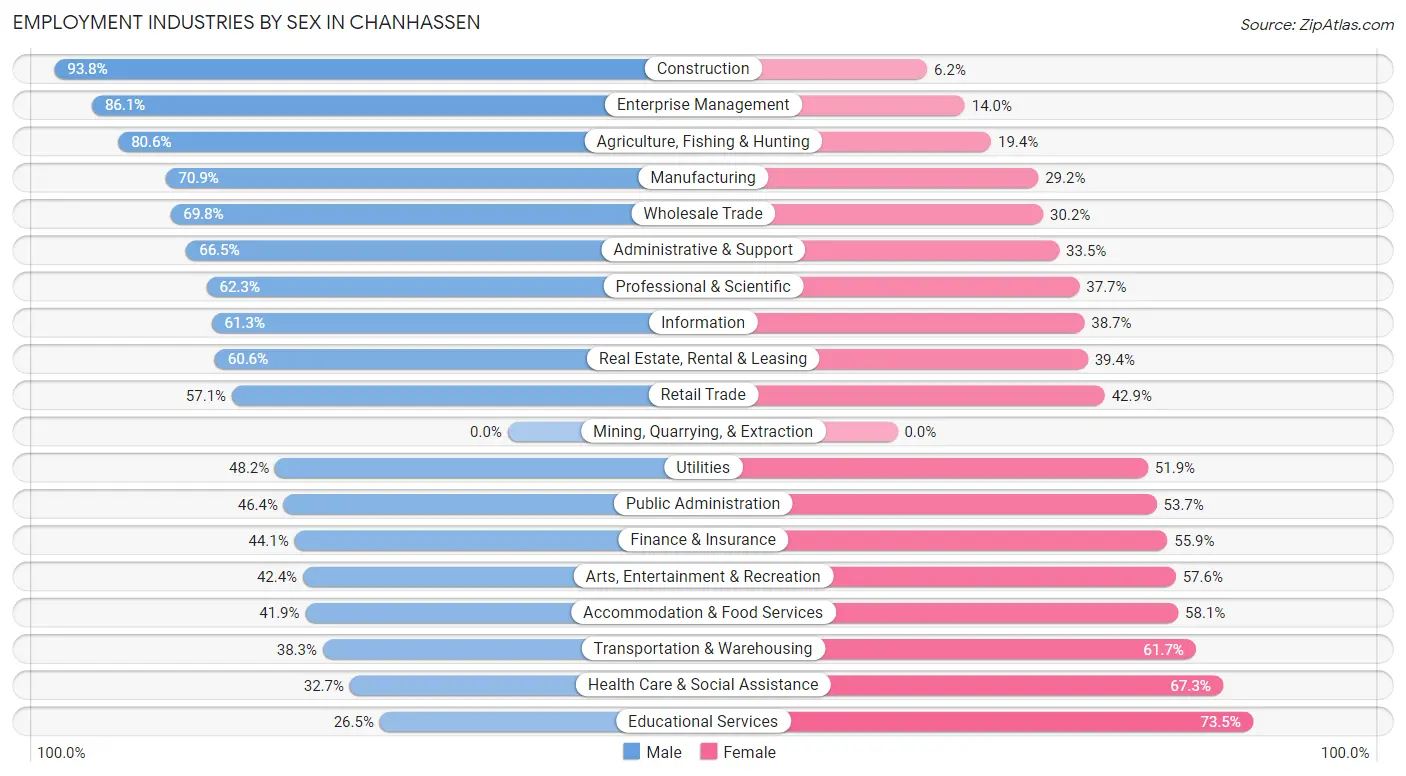
Employment Industries by Sex in Chanhassen
The Chanhassen industries that see more men than women are Construction (93.8%), Enterprise Management (86.1%), and Agriculture, Fishing & Hunting (80.6%), whereas the industries that tend to have a higher number of women are Educational Services (73.5%), Health Care & Social Assistance (67.3%), and Transportation & Warehousing (61.7%).
| Industry | Male | Female |
| Agriculture, Fishing & Hunting | 104 (80.6%) | 25 (19.4%) |
| Mining, Quarrying, & Extraction | 0 (0.0%) | 0 (0.0%) |
| Construction | 457 (93.8%) | 30 (6.2%) |
| Manufacturing | 1,463 (70.9%) | 602 (29.1%) |
| Wholesale Trade | 368 (69.8%) | 159 (30.2%) |
| Retail Trade | 833 (57.1%) | 626 (42.9%) |
| Transportation & Warehousing | 160 (38.3%) | 258 (61.7%) |
| Utilities | 26 (48.1%) | 28 (51.8%) |
| Information | 198 (61.3%) | 125 (38.7%) |
| Finance & Insurance | 496 (44.1%) | 628 (55.9%) |
| Real Estate, Rental & Leasing | 220 (60.6%) | 143 (39.4%) |
| Professional & Scientific | 1,091 (62.3%) | 659 (37.7%) |
| Enterprise Management | 37 (86.1%) | 6 (14.0%) |
| Administrative & Support | 300 (66.5%) | 151 (33.5%) |
| Educational Services | 257 (26.5%) | 713 (73.5%) |
| Health Care & Social Assistance | 538 (32.7%) | 1,108 (67.3%) |
| Arts, Entertainment & Recreation | 156 (42.4%) | 212 (57.6%) |
| Accommodation & Food Services | 173 (41.9%) | 240 (58.1%) |
| Public Administration | 108 (46.4%) | 125 (53.6%) |
| Total | 7,195 (53.5%) | 6,244 (46.5%) |
Education in Chanhassen
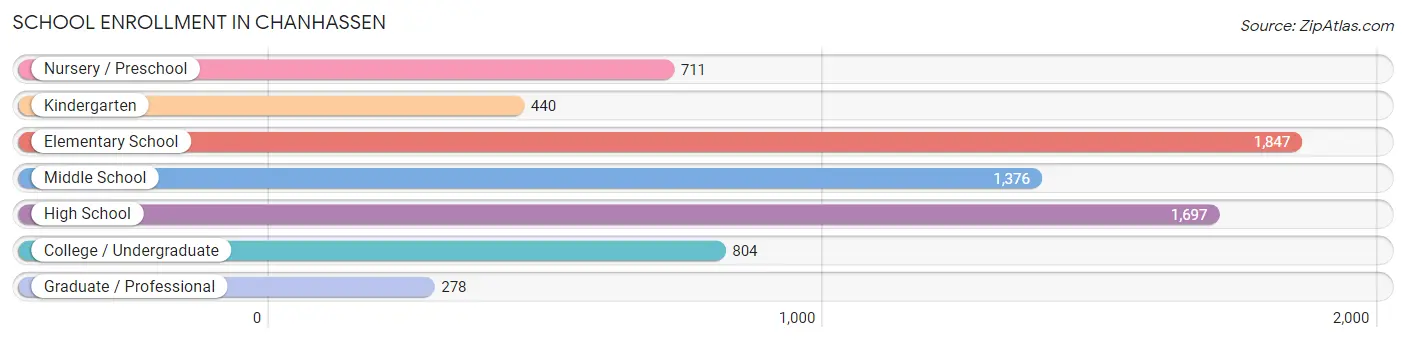
School Enrollment in Chanhassen
The most common levels of schooling among the 7,153 students in Chanhassen are elementary school (1,847 | 25.8%), high school (1,697 | 23.7%), and middle school (1,376 | 19.2%).
| School Level | # Students | % Students |
| Nursery / Preschool | 711 | 9.9% |
| Kindergarten | 440 | 6.1% |
| Elementary School | 1,847 | 25.8% |
| Middle School | 1,376 | 19.2% |
| High School | 1,697 | 23.7% |
| College / Undergraduate | 804 | 11.2% |
| Graduate / Professional | 278 | 3.9% |
| Total | 7,153 | 100.0% |
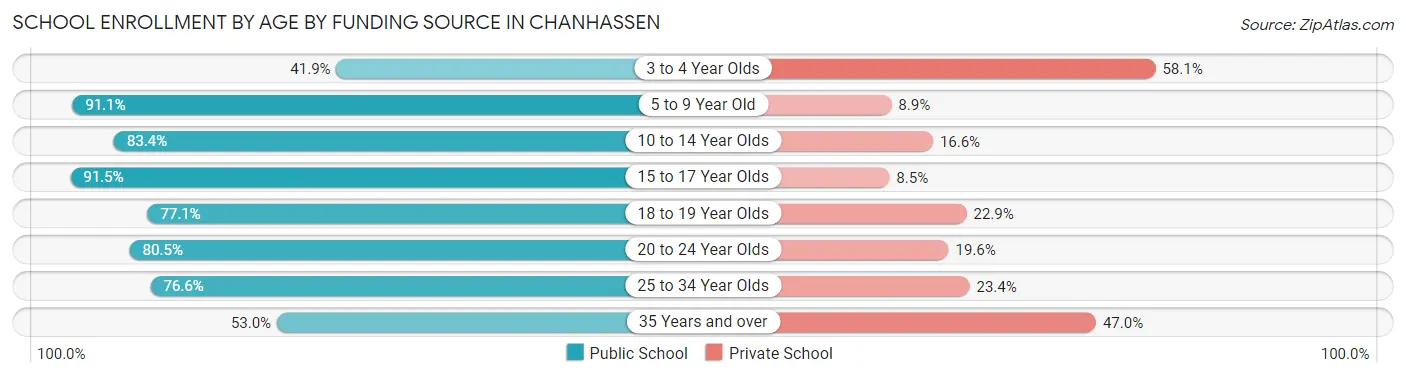
School Enrollment by Age by Funding Source in Chanhassen
Out of a total of 7,153 students who are enrolled in schools in Chanhassen, 1,230 (17.2%) attend a private institution, while the remaining 5,923 (82.8%) are enrolled in public schools. The age group of 3 to 4 year olds has the highest likelihood of being enrolled in private schools, with 248 (58.1% in the age bracket) enrolled. Conversely, the age group of 15 to 17 year olds has the lowest likelihood of being enrolled in a private school, with 998 (91.5% in the age bracket) attending a public institution.
| Age Bracket | Public School | Private School |
| 3 to 4 Year Olds | 179 (41.9%) | 248 (58.1%) |
| 5 to 9 Year Old | 2,030 (91.1%) | 198 (8.9%) |
| 10 to 14 Year Olds | 1,589 (83.4%) | 317 (16.6%) |
| 15 to 17 Year Olds | 998 (91.5%) | 93 (8.5%) |
| 18 to 19 Year Olds | 428 (77.1%) | 127 (22.9%) |
| 20 to 24 Year Olds | 432 (80.4%) | 105 (19.6%) |
| 25 to 34 Year Olds | 160 (76.6%) | 49 (23.4%) |
| 35 Years and over | 106 (53.0%) | 94 (47.0%) |
| Total | 5,923 (82.8%) | 1,230 (17.2%) |
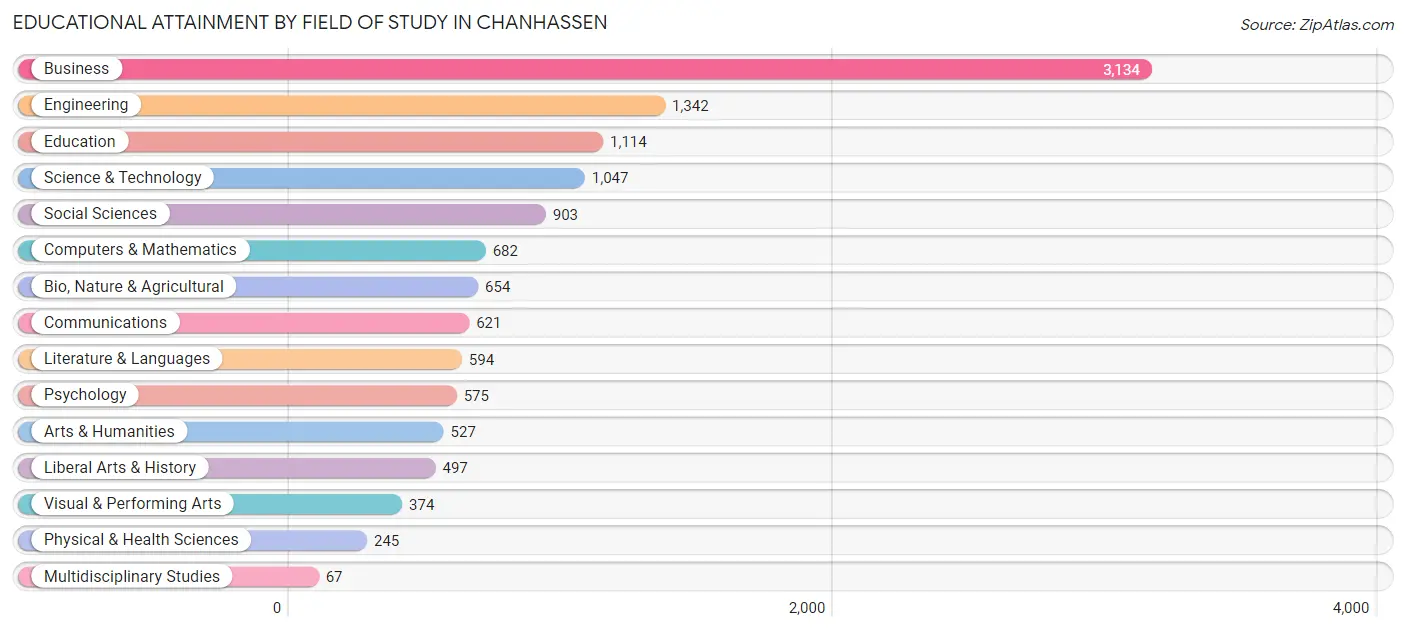
Educational Attainment by Field of Study in Chanhassen
Business (3,134 | 25.3%), engineering (1,342 | 10.8%), education (1,114 | 9.0%), science & technology (1,047 | 8.5%), and social sciences (903 | 7.3%) are the most common fields of study among 12,376 individuals in Chanhassen who have obtained a bachelor's degree or higher.
| Field of Study | # Graduates | % Graduates |
| Computers & Mathematics | 682 | 5.5% |
| Bio, Nature & Agricultural | 654 | 5.3% |
| Physical & Health Sciences | 245 | 2.0% |
| Psychology | 575 | 4.6% |
| Social Sciences | 903 | 7.3% |
| Engineering | 1,342 | 10.8% |
| Multidisciplinary Studies | 67 | 0.5% |
| Science & Technology | 1,047 | 8.5% |
| Business | 3,134 | 25.3% |
| Education | 1,114 | 9.0% |
| Literature & Languages | 594 | 4.8% |
| Liberal Arts & History | 497 | 4.0% |
| Visual & Performing Arts | 374 | 3.0% |
| Communications | 621 | 5.0% |
| Arts & Humanities | 527 | 4.3% |
| Total | 12,376 | 100.0% |
Transportation & Commute in Chanhassen
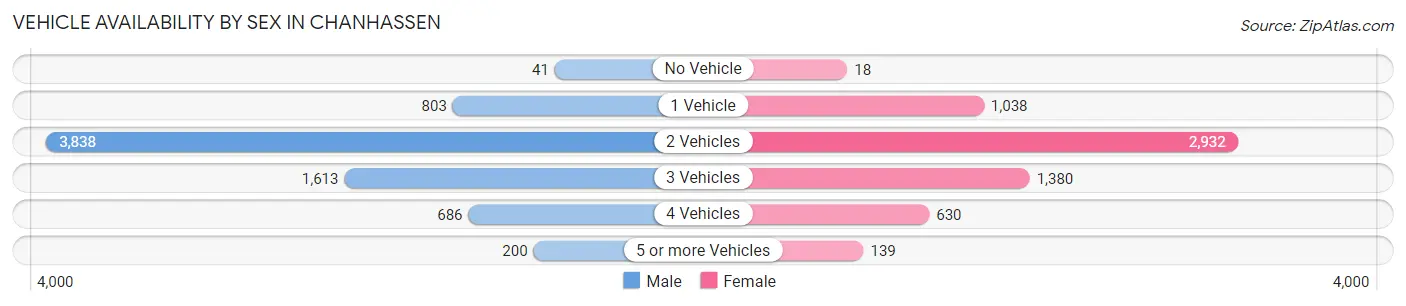
Vehicle Availability by Sex in Chanhassen
The most prevalent vehicle ownership categories in Chanhassen are males with 2 vehicles (3,838, accounting for 53.4%) and females with 2 vehicles (2,932, making up 62.5%).
| Vehicles Available | Male | Female |
| No Vehicle | 41 (0.6%) | 18 (0.3%) |
| 1 Vehicle | 803 (11.2%) | 1,038 (16.9%) |
| 2 Vehicles | 3,838 (53.4%) | 2,932 (47.8%) |
| 3 Vehicles | 1,613 (22.5%) | 1,380 (22.5%) |
| 4 Vehicles | 686 (9.6%) | 630 (10.3%) |
| 5 or more Vehicles | 200 (2.8%) | 139 (2.3%) |
| Total | 7,181 (100.0%) | 6,137 (100.0%) |
Commute Time in Chanhassen
The most frequently occuring commute durations in Chanhassen are 30 to 34 minutes (1,764 commuters, 16.8%), 20 to 24 minutes (1,704 commuters, 16.2%), and 15 to 19 minutes (1,563 commuters, 14.8%).
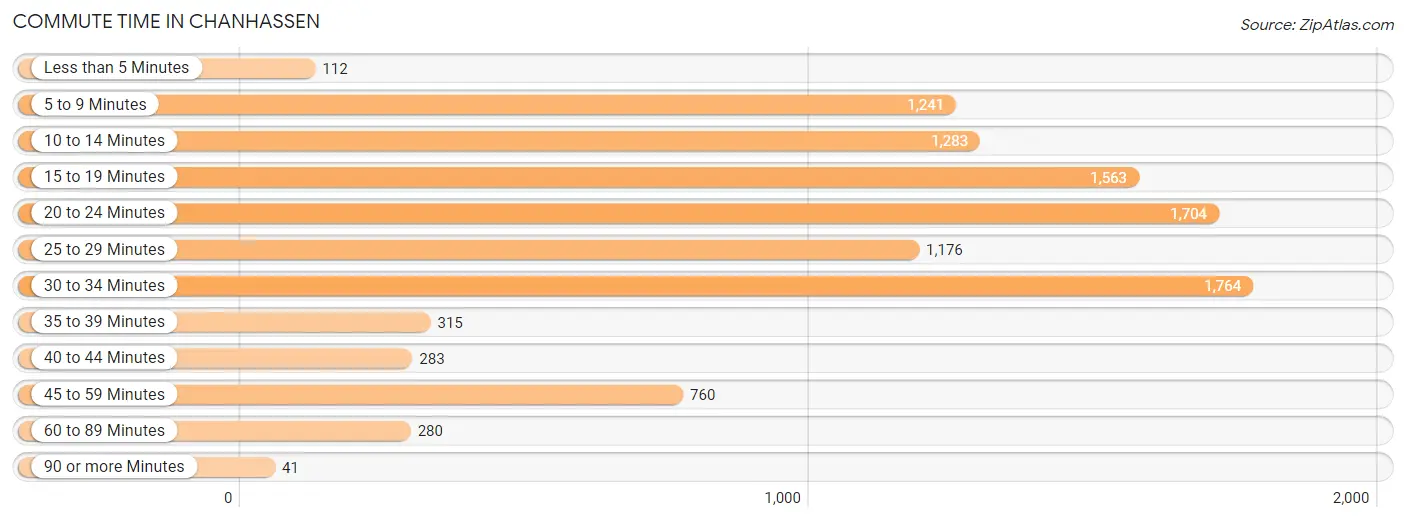
| Commute Time | # Commuters | % Commuters |
| Less than 5 Minutes | 112 | 1.1% |
| 5 to 9 Minutes | 1,241 | 11.8% |
| 10 to 14 Minutes | 1,283 | 12.2% |
| 15 to 19 Minutes | 1,563 | 14.8% |
| 20 to 24 Minutes | 1,704 | 16.2% |
| 25 to 29 Minutes | 1,176 | 11.2% |
| 30 to 34 Minutes | 1,764 | 16.8% |
| 35 to 39 Minutes | 315 | 3.0% |
| 40 to 44 Minutes | 283 | 2.7% |
| 45 to 59 Minutes | 760 | 7.2% |
| 60 to 89 Minutes | 280 | 2.7% |
| 90 or more Minutes | 41 | 0.4% |
Commute Time by Sex in Chanhassen
The most common commute times in Chanhassen are 30 to 34 minutes (1,099 commuters, 19.0%) for males and 20 to 24 minutes (843 commuters, 17.8%) for females.
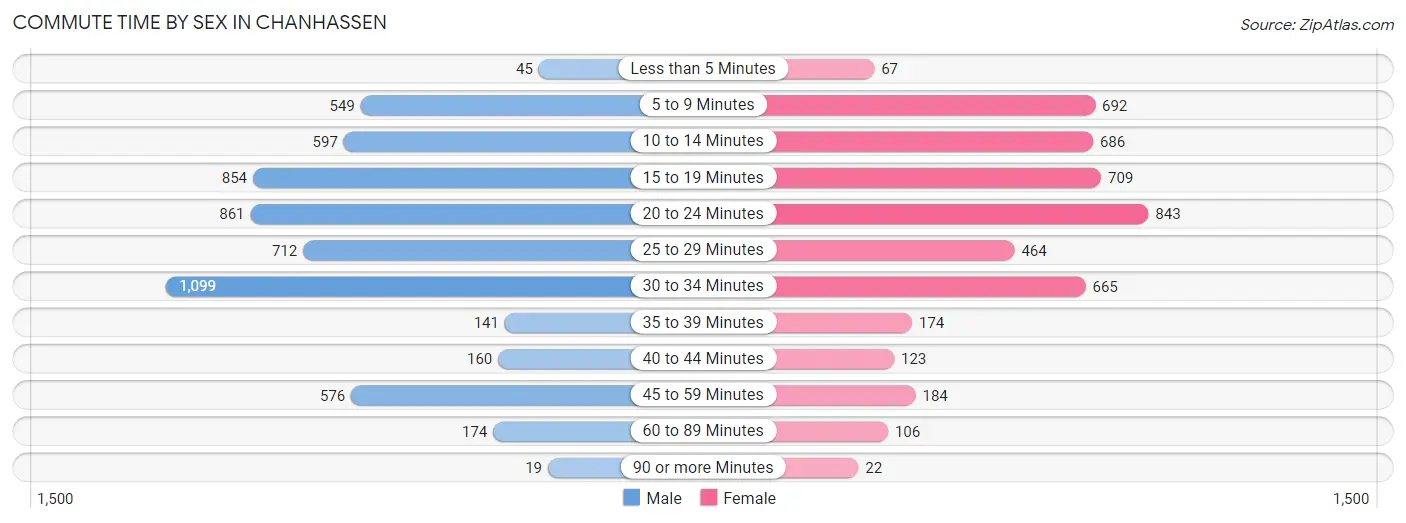
| Commute Time | Male | Female |
| Less than 5 Minutes | 45 (0.8%) | 67 (1.4%) |
| 5 to 9 Minutes | 549 (9.5%) | 692 (14.6%) |
| 10 to 14 Minutes | 597 (10.3%) | 686 (14.5%) |
| 15 to 19 Minutes | 854 (14.8%) | 709 (15.0%) |
| 20 to 24 Minutes | 861 (14.9%) | 843 (17.8%) |
| 25 to 29 Minutes | 712 (12.3%) | 464 (9.8%) |
| 30 to 34 Minutes | 1,099 (19.0%) | 665 (14.0%) |
| 35 to 39 Minutes | 141 (2.4%) | 174 (3.7%) |
| 40 to 44 Minutes | 160 (2.8%) | 123 (2.6%) |
| 45 to 59 Minutes | 576 (10.0%) | 184 (3.9%) |
| 60 to 89 Minutes | 174 (3.0%) | 106 (2.2%) |
| 90 or more Minutes | 19 (0.3%) | 22 (0.5%) |
Time of Departure to Work by Sex in Chanhassen
The most frequent times of departure to work in Chanhassen are 7:00 AM to 7:29 AM (962, 16.6%) for males and 8:00 AM to 8:29 AM (935, 19.8%) for females.
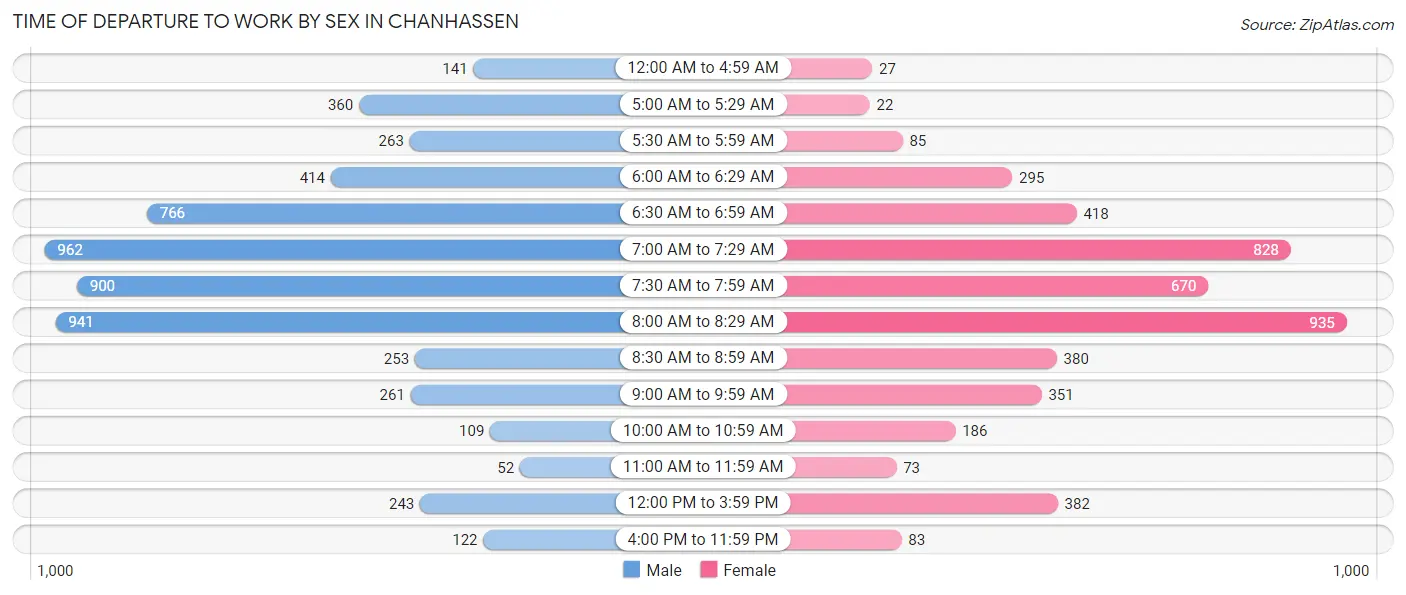
| Time of Departure | Male | Female |
| 12:00 AM to 4:59 AM | 141 (2.4%) | 27 (0.6%) |
| 5:00 AM to 5:29 AM | 360 (6.2%) | 22 (0.5%) |
| 5:30 AM to 5:59 AM | 263 (4.5%) | 85 (1.8%) |
| 6:00 AM to 6:29 AM | 414 (7.1%) | 295 (6.2%) |
| 6:30 AM to 6:59 AM | 766 (13.2%) | 418 (8.8%) |
| 7:00 AM to 7:29 AM | 962 (16.6%) | 828 (17.5%) |
| 7:30 AM to 7:59 AM | 900 (15.5%) | 670 (14.1%) |
| 8:00 AM to 8:29 AM | 941 (16.3%) | 935 (19.8%) |
| 8:30 AM to 8:59 AM | 253 (4.4%) | 380 (8.0%) |
| 9:00 AM to 9:59 AM | 261 (4.5%) | 351 (7.4%) |
| 10:00 AM to 10:59 AM | 109 (1.9%) | 186 (3.9%) |
| 11:00 AM to 11:59 AM | 52 (0.9%) | 73 (1.5%) |
| 12:00 PM to 3:59 PM | 243 (4.2%) | 382 (8.1%) |
| 4:00 PM to 11:59 PM | 122 (2.1%) | 83 (1.8%) |
| Total | 5,787 (100.0%) | 4,735 (100.0%) |
Housing Occupancy in Chanhassen
Occupancy by Ownership in Chanhassen
Of the total 9,578 dwellings in Chanhassen, owner-occupied units account for 8,292 (86.6%), while renter-occupied units make up 1,286 (13.4%).
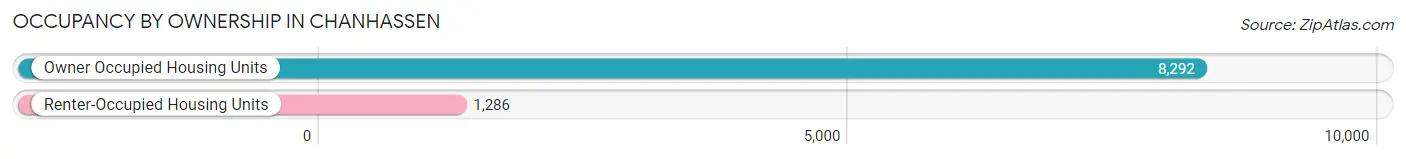
| Occupancy | # Housing Units | % Housing Units |
| Owner Occupied Housing Units | 8,292 | 86.6% |
| Renter-Occupied Housing Units | 1,286 | 13.4% |
| Total Occupied Housing Units | 9,578 | 100.0% |
Occupancy by Household Size in Chanhassen
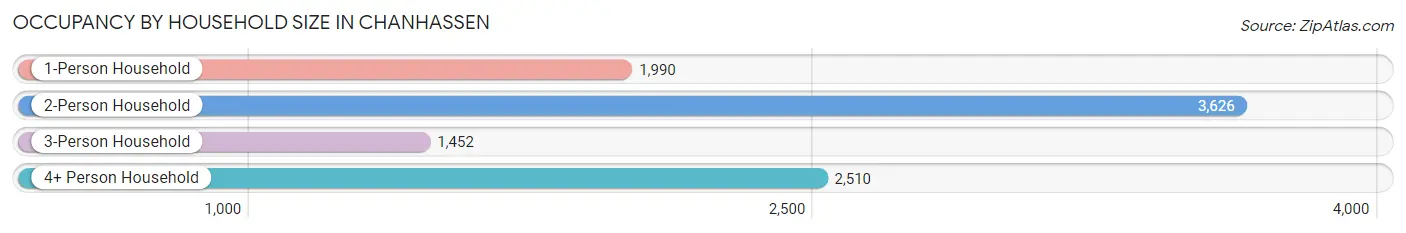
| Household Size | # Housing Units | % Housing Units |
| 1-Person Household | 1,990 | 20.8% |
| 2-Person Household | 3,626 | 37.9% |
| 3-Person Household | 1,452 | 15.2% |
| 4+ Person Household | 2,510 | 26.2% |
| Total Housing Units | 9,578 | 100.0% |
Occupancy by Ownership by Household Size in Chanhassen
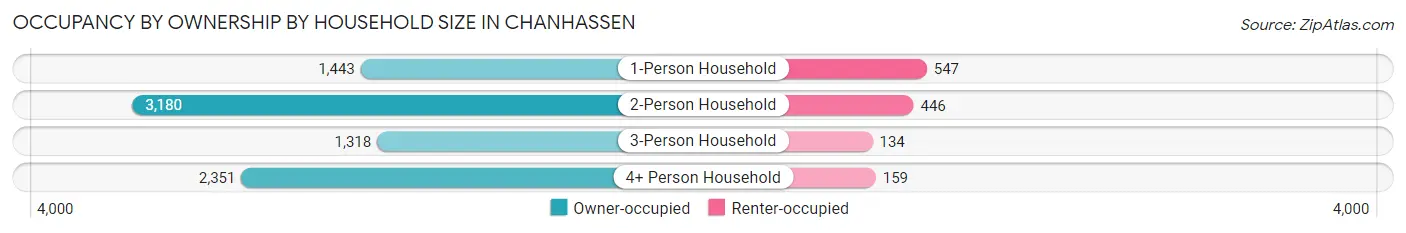
| Household Size | Owner-occupied | Renter-occupied |
| 1-Person Household | 1,443 (72.5%) | 547 (27.5%) |
| 2-Person Household | 3,180 (87.7%) | 446 (12.3%) |
| 3-Person Household | 1,318 (90.8%) | 134 (9.2%) |
| 4+ Person Household | 2,351 (93.7%) | 159 (6.3%) |
| Total Housing Units | 8,292 (86.6%) | 1,286 (13.4%) |
Occupancy by Educational Attainment in Chanhassen
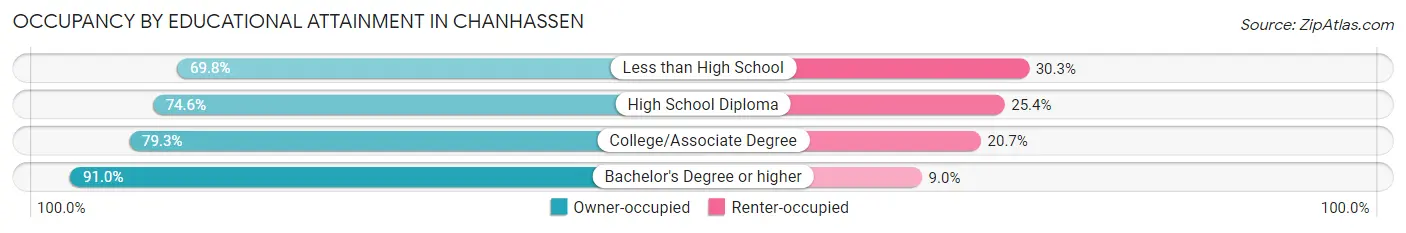
| Household Size | Owner-occupied | Renter-occupied |
| Less than High School | 83 (69.8%) | 36 (30.2%) |
| High School Diploma | 546 (74.6%) | 186 (25.4%) |
| College/Associate Degree | 1,876 (79.3%) | 490 (20.7%) |
| Bachelor's Degree or higher | 5,787 (91.0%) | 574 (9.0%) |
Occupancy by Age of Householder in Chanhassen
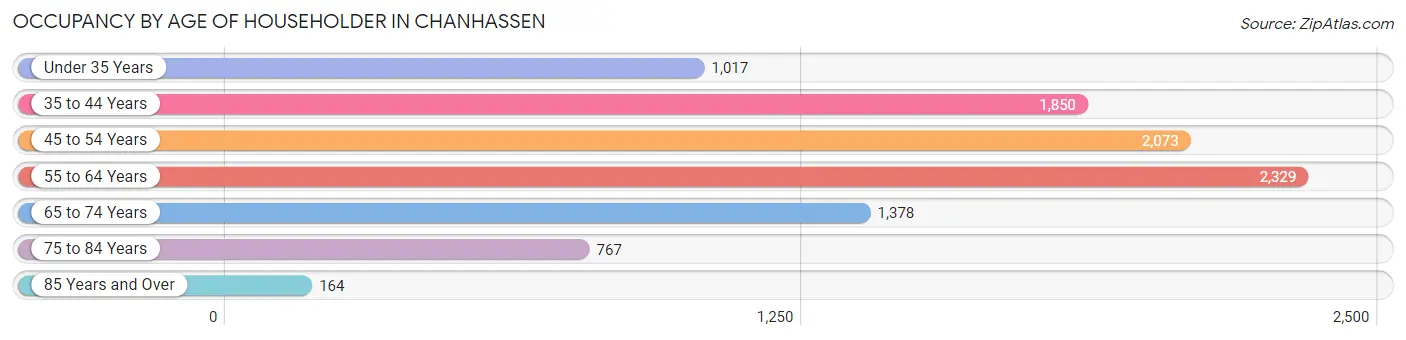
| Age Bracket | # Households | % Households |
| Under 35 Years | 1,017 | 10.6% |
| 35 to 44 Years | 1,850 | 19.3% |
| 45 to 54 Years | 2,073 | 21.6% |
| 55 to 64 Years | 2,329 | 24.3% |
| 65 to 74 Years | 1,378 | 14.4% |
| 75 to 84 Years | 767 | 8.0% |
| 85 Years and Over | 164 | 1.7% |
| Total | 9,578 | 100.0% |
Housing Finances in Chanhassen
Median Income by Occupancy in Chanhassen
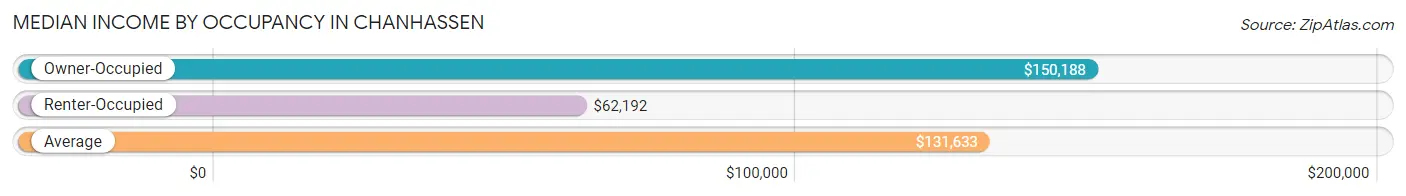
| Occupancy Type | # Households | Median Income |
| Owner-Occupied | 8,292 (86.6%) | $150,188 |
| Renter-Occupied | 1,286 (13.4%) | $62,192 |
| Average | 9,578 (100.0%) | $131,633 |
Occupancy by Householder Income Bracket in Chanhassen
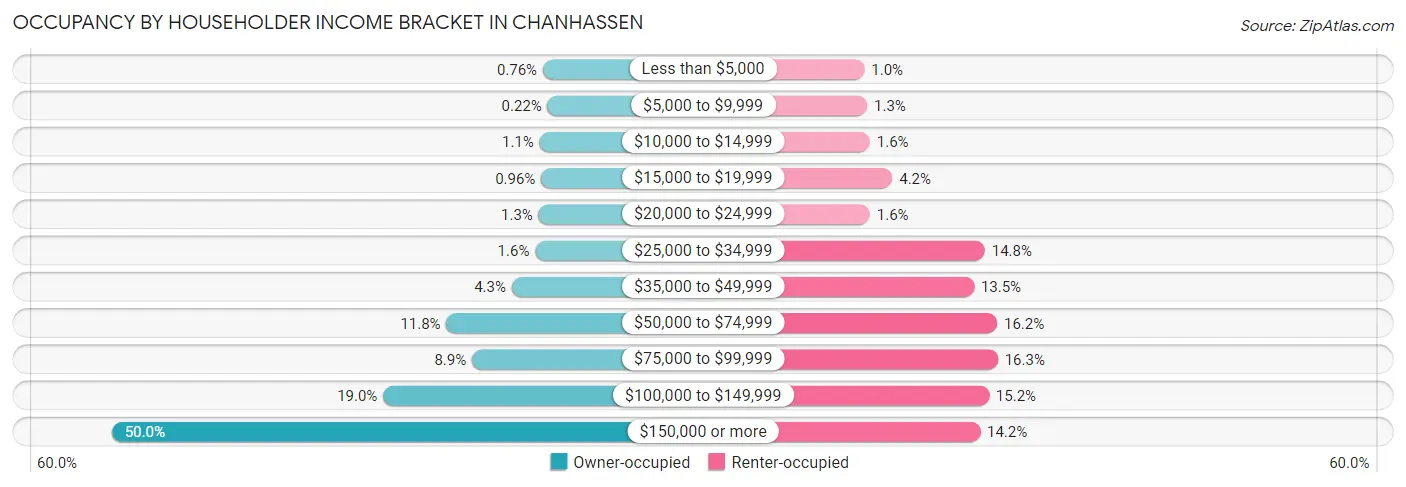
| Income Bracket | Owner-occupied | Renter-occupied |
| Less than $5,000 | 63 (0.8%) | 13 (1.0%) |
| $5,000 to $9,999 | 18 (0.2%) | 17 (1.3%) |
| $10,000 to $14,999 | 94 (1.1%) | 21 (1.6%) |
| $15,000 to $19,999 | 80 (1.0%) | 54 (4.2%) |
| $20,000 to $24,999 | 104 (1.3%) | 21 (1.6%) |
| $25,000 to $34,999 | 136 (1.6%) | 190 (14.8%) |
| $35,000 to $49,999 | 358 (4.3%) | 174 (13.5%) |
| $50,000 to $74,999 | 978 (11.8%) | 208 (16.2%) |
| $75,000 to $99,999 | 735 (8.9%) | 209 (16.3%) |
| $100,000 to $149,999 | 1,577 (19.0%) | 196 (15.2%) |
| $150,000 or more | 4,149 (50.0%) | 183 (14.2%) |
| Total | 8,292 (100.0%) | 1,286 (100.0%) |
Monthly Housing Cost Tiers in Chanhassen
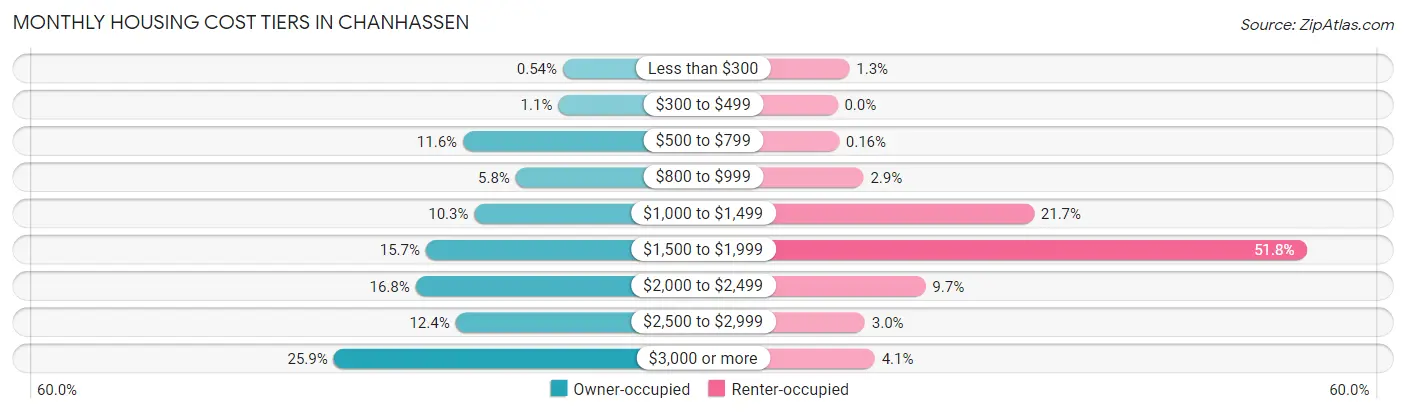
| Monthly Cost | Owner-occupied | Renter-occupied |
| Less than $300 | 45 (0.5%) | 17 (1.3%) |
| $300 to $499 | 87 (1.1%) | 0 (0.0%) |
| $500 to $799 | 960 (11.6%) | 2 (0.2%) |
| $800 to $999 | 477 (5.8%) | 37 (2.9%) |
| $1,000 to $1,499 | 856 (10.3%) | 279 (21.7%) |
| $1,500 to $1,999 | 1,300 (15.7%) | 666 (51.8%) |
| $2,000 to $2,499 | 1,394 (16.8%) | 125 (9.7%) |
| $2,500 to $2,999 | 1,028 (12.4%) | 39 (3.0%) |
| $3,000 or more | 2,145 (25.9%) | 53 (4.1%) |
| Total | 8,292 (100.0%) | 1,286 (100.0%) |
Physical Housing Characteristics in Chanhassen
Housing Structures in Chanhassen
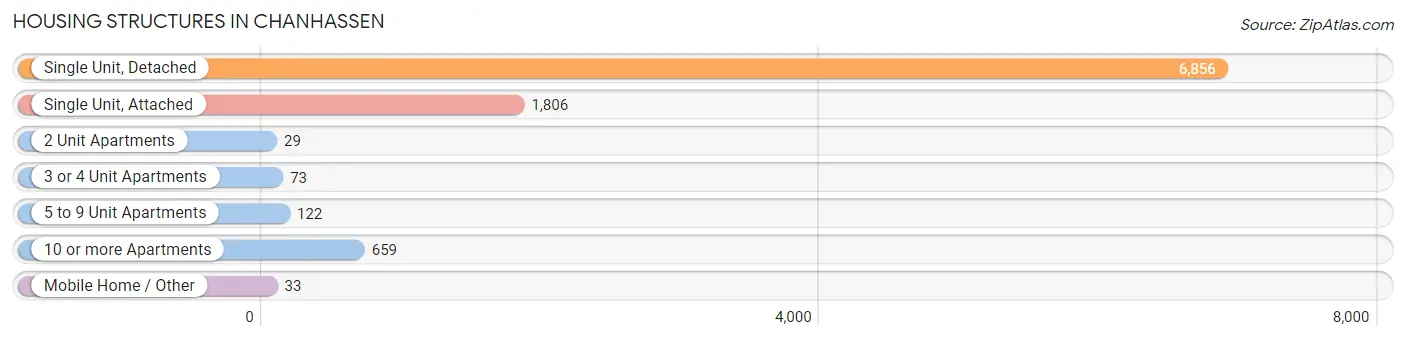
| Structure Type | # Housing Units | % Housing Units |
| Single Unit, Detached | 6,856 | 71.6% |
| Single Unit, Attached | 1,806 | 18.9% |
| 2 Unit Apartments | 29 | 0.3% |
| 3 or 4 Unit Apartments | 73 | 0.8% |
| 5 to 9 Unit Apartments | 122 | 1.3% |
| 10 or more Apartments | 659 | 6.9% |
| Mobile Home / Other | 33 | 0.3% |
| Total | 9,578 | 100.0% |
Housing Structures by Occupancy in Chanhassen
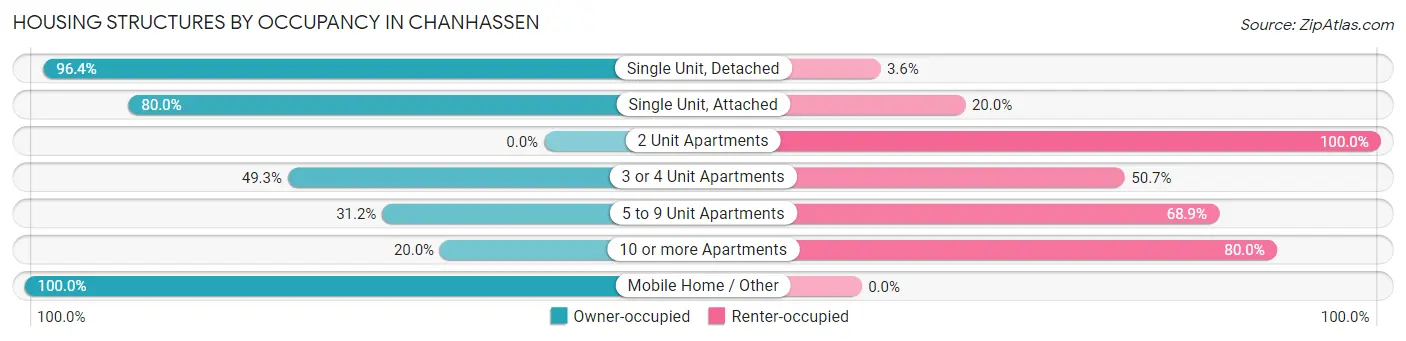
| Structure Type | Owner-occupied | Renter-occupied |
| Single Unit, Detached | 6,608 (96.4%) | 248 (3.6%) |
| Single Unit, Attached | 1,445 (80.0%) | 361 (20.0%) |
| 2 Unit Apartments | 0 (0.0%) | 29 (100.0%) |
| 3 or 4 Unit Apartments | 36 (49.3%) | 37 (50.7%) |
| 5 to 9 Unit Apartments | 38 (31.1%) | 84 (68.9%) |
| 10 or more Apartments | 132 (20.0%) | 527 (80.0%) |
| Mobile Home / Other | 33 (100.0%) | 0 (0.0%) |
| Total | 8,292 (86.6%) | 1,286 (13.4%) |
Housing Structures by Number of Rooms in Chanhassen
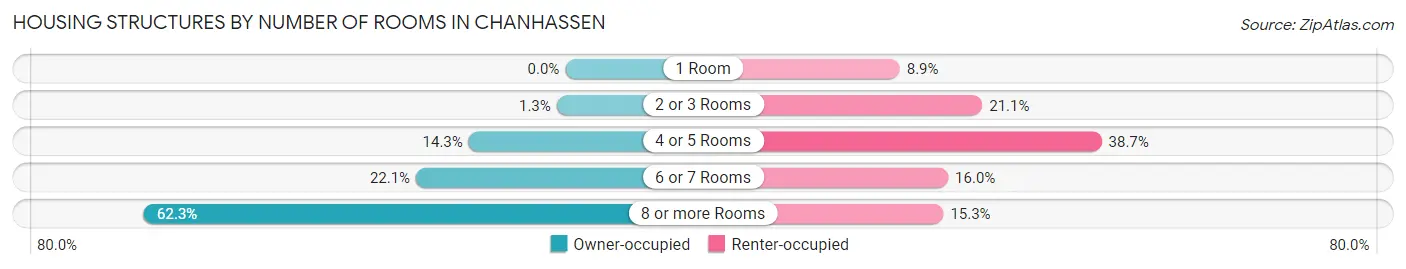
| Number of Rooms | Owner-occupied | Renter-occupied |
| 1 Room | 0 (0.0%) | 114 (8.9%) |
| 2 or 3 Rooms | 105 (1.3%) | 271 (21.1%) |
| 4 or 5 Rooms | 1,186 (14.3%) | 498 (38.7%) |
| 6 or 7 Rooms | 1,832 (22.1%) | 206 (16.0%) |
| 8 or more Rooms | 5,169 (62.3%) | 197 (15.3%) |
| Total | 8,292 (100.0%) | 1,286 (100.0%) |
Housing Structure by Heating Type in Chanhassen
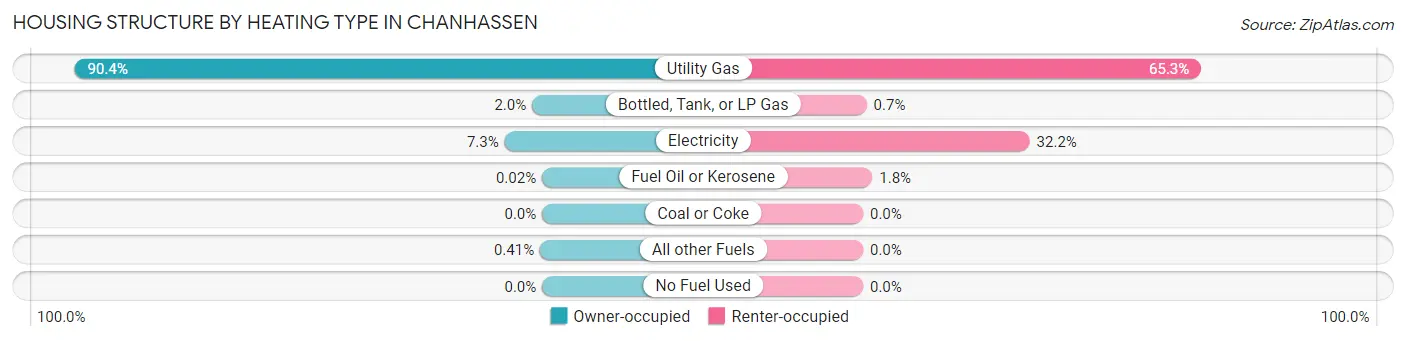
| Heating Type | Owner-occupied | Renter-occupied |
| Utility Gas | 7,492 (90.3%) | 840 (65.3%) |
| Bottled, Tank, or LP Gas | 162 (1.9%) | 9 (0.7%) |
| Electricity | 602 (7.3%) | 414 (32.2%) |
| Fuel Oil or Kerosene | 2 (0.0%) | 23 (1.8%) |
| Coal or Coke | 0 (0.0%) | 0 (0.0%) |
| All other Fuels | 34 (0.4%) | 0 (0.0%) |
| No Fuel Used | 0 (0.0%) | 0 (0.0%) |
| Total | 8,292 (100.0%) | 1,286 (100.0%) |
Household Vehicle Usage in Chanhassen
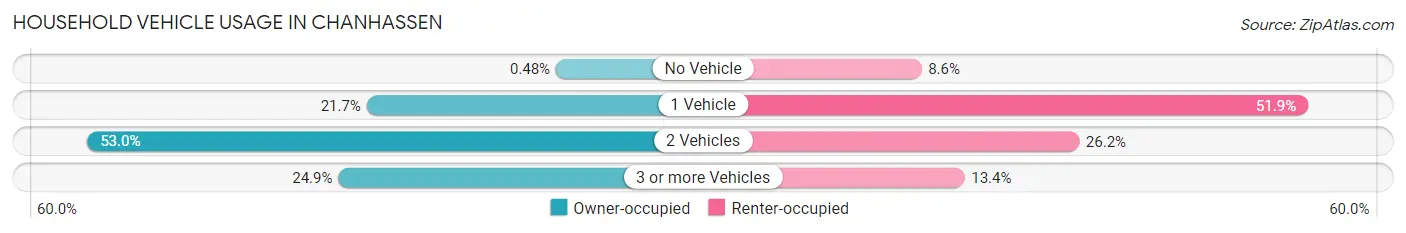
| Vehicles per Household | Owner-occupied | Renter-occupied |
| No Vehicle | 40 (0.5%) | 110 (8.6%) |
| 1 Vehicle | 1,798 (21.7%) | 667 (51.9%) |
| 2 Vehicles | 4,393 (53.0%) | 337 (26.2%) |
| 3 or more Vehicles | 2,061 (24.9%) | 172 (13.4%) |
| Total | 8,292 (100.0%) | 1,286 (100.0%) |
Real Estate & Mortgages in Chanhassen
Real Estate and Mortgage Overview in Chanhassen
| Characteristic | Without Mortgage | With Mortgage |
| Housing Units | 2,209 | 6,083 |
| Median Property Value | $455,300 | $499,200 |
| Median Household Income | $104,321 | $3,331 |
| Monthly Housing Costs | $819 | $2,105 |
| Real Estate Taxes | $4,778 | $19 |
Property Value by Mortgage Status in Chanhassen
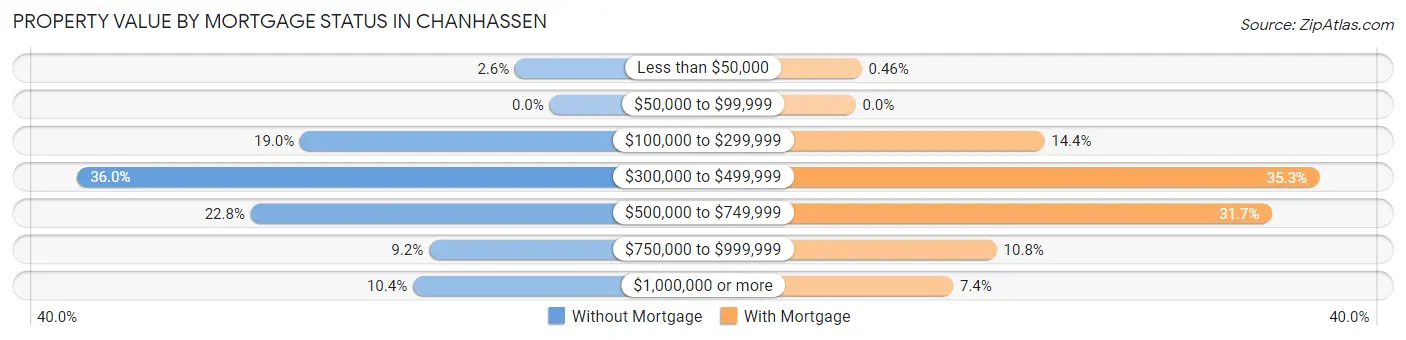
| Property Value | Without Mortgage | With Mortgage |
| Less than $50,000 | 58 (2.6%) | 28 (0.5%) |
| $50,000 to $99,999 | 0 (0.0%) | 0 (0.0%) |
| $100,000 to $299,999 | 420 (19.0%) | 875 (14.4%) |
| $300,000 to $499,999 | 795 (36.0%) | 2,147 (35.3%) |
| $500,000 to $749,999 | 503 (22.8%) | 1,927 (31.7%) |
| $750,000 to $999,999 | 203 (9.2%) | 654 (10.7%) |
| $1,000,000 or more | 230 (10.4%) | 452 (7.4%) |
| Total | 2,209 (100.0%) | 6,083 (100.0%) |
Household Income by Mortgage Status in Chanhassen
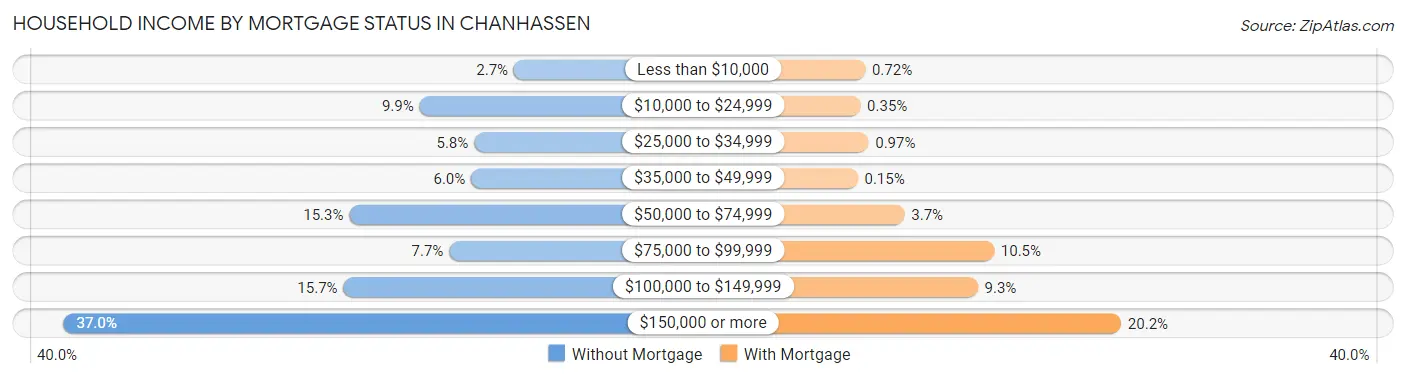
| Household Income | Without Mortgage | With Mortgage |
| Less than $10,000 | 60 (2.7%) | 44 (0.7%) |
| $10,000 to $24,999 | 219 (9.9%) | 21 (0.4%) |
| $25,000 to $34,999 | 127 (5.8%) | 59 (1.0%) |
| $35,000 to $49,999 | 132 (6.0%) | 9 (0.2%) |
| $50,000 to $74,999 | 337 (15.3%) | 226 (3.7%) |
| $75,000 to $99,999 | 169 (7.6%) | 641 (10.5%) |
| $100,000 to $149,999 | 347 (15.7%) | 566 (9.3%) |
| $150,000 or more | 818 (37.0%) | 1,230 (20.2%) |
| Total | 2,209 (100.0%) | 6,083 (100.0%) |
Property Value to Household Income Ratio in Chanhassen
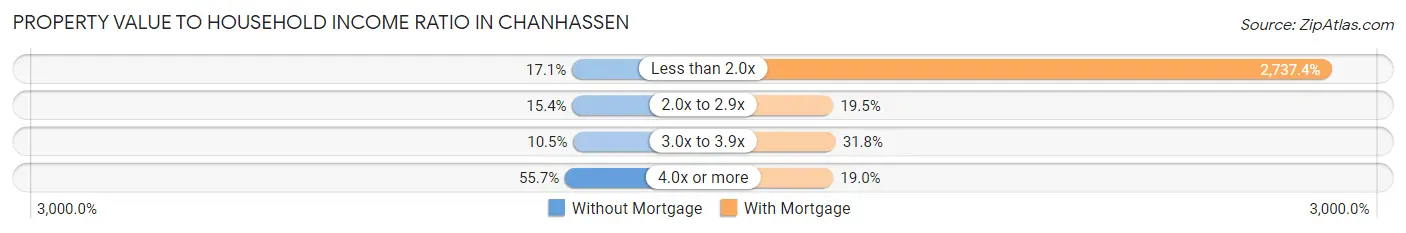
| Value-to-Income Ratio | Without Mortgage | With Mortgage |
| Less than 2.0x | 377 (17.1%) | 166,518 (2,737.4%) |
| 2.0x to 2.9x | 340 (15.4%) | 1,183 (19.5%) |
| 3.0x to 3.9x | 232 (10.5%) | 1,937 (31.8%) |
| 4.0x or more | 1,231 (55.7%) | 1,153 (19.0%) |
| Total | 2,209 (100.0%) | 6,083 (100.0%) |
Real Estate Taxes by Mortgage Status in Chanhassen
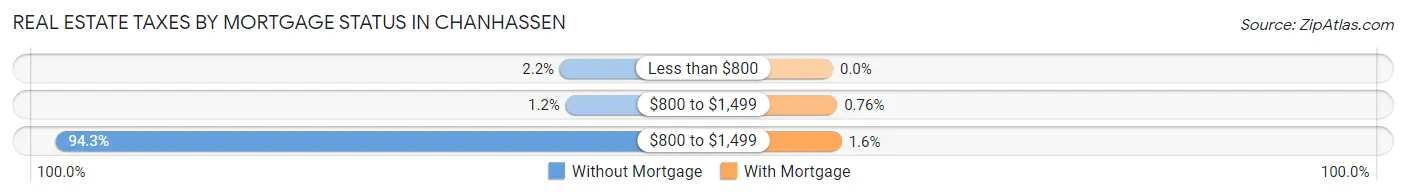
| Property Taxes | Without Mortgage | With Mortgage |
| Less than $800 | 49 (2.2%) | 0 (0.0%) |
| $800 to $1,499 | 26 (1.2%) | 46 (0.8%) |
| $800 to $1,499 | 2,084 (94.3%) | 96 (1.6%) |
| Total | 2,209 (100.0%) | 6,083 (100.0%) |
Health & Disability in Chanhassen
Health Insurance Coverage by Age in Chanhassen
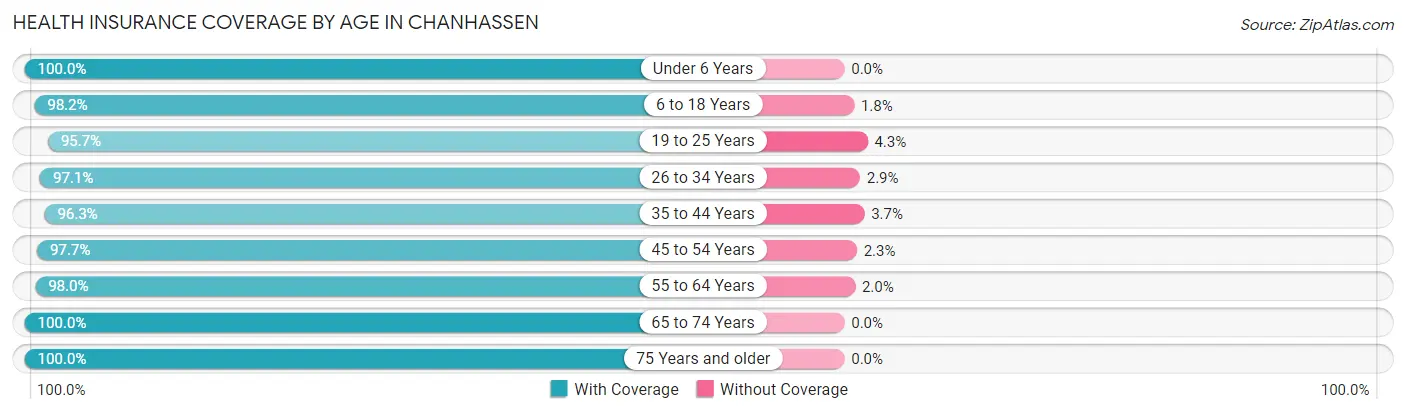
| Age Bracket | With Coverage | Without Coverage |
| Under 6 Years | 1,819 (100.0%) | 0 (0.0%) |
| 6 to 18 Years | 5,151 (98.2%) | 95 (1.8%) |
| 19 to 25 Years | 1,505 (95.7%) | 68 (4.3%) |
| 26 to 34 Years | 2,116 (97.1%) | 63 (2.9%) |
| 35 to 44 Years | 3,580 (96.3%) | 138 (3.7%) |
| 45 to 54 Years | 3,458 (97.7%) | 82 (2.3%) |
| 55 to 64 Years | 3,944 (98.0%) | 80 (2.0%) |
| 65 to 74 Years | 2,323 (100.0%) | 0 (0.0%) |
| 75 Years and older | 1,443 (100.0%) | 0 (0.0%) |
| Total | 25,339 (98.0%) | 526 (2.0%) |
Health Insurance Coverage by Citizenship Status in Chanhassen
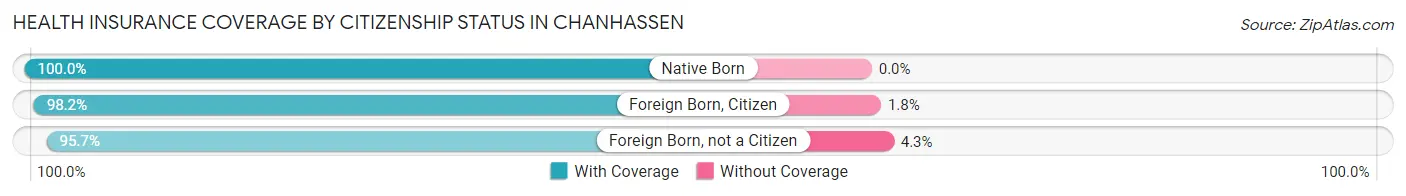
| Citizenship Status | With Coverage | Without Coverage |
| Native Born | 1,819 (100.0%) | 0 (0.0%) |
| Foreign Born, Citizen | 5,151 (98.2%) | 95 (1.8%) |
| Foreign Born, not a Citizen | 1,505 (95.7%) | 68 (4.3%) |
Health Insurance Coverage by Household Income in Chanhassen
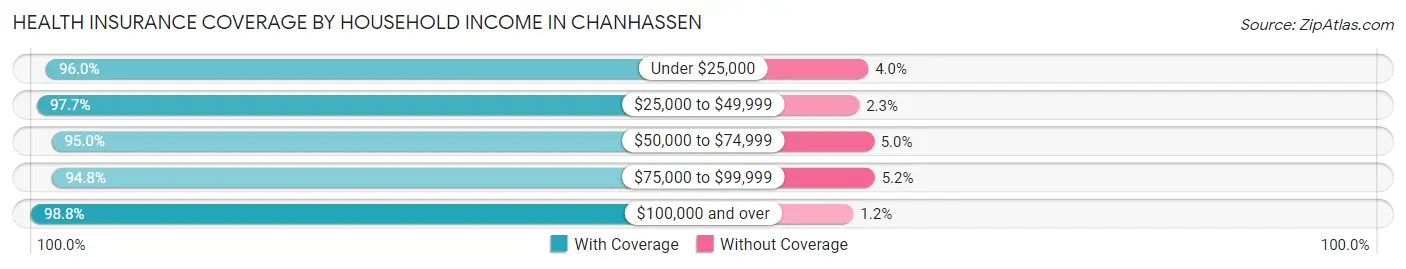
| Household Income | With Coverage | Without Coverage |
| Under $25,000 | 716 (96.0%) | 30 (4.0%) |
| $25,000 to $49,999 | 1,301 (97.7%) | 31 (2.3%) |
| $50,000 to $74,999 | 2,074 (95.0%) | 110 (5.0%) |
| $75,000 to $99,999 | 2,103 (94.8%) | 116 (5.2%) |
| $100,000 and over | 19,095 (98.8%) | 239 (1.2%) |
Public vs Private Health Insurance Coverage by Age in Chanhassen
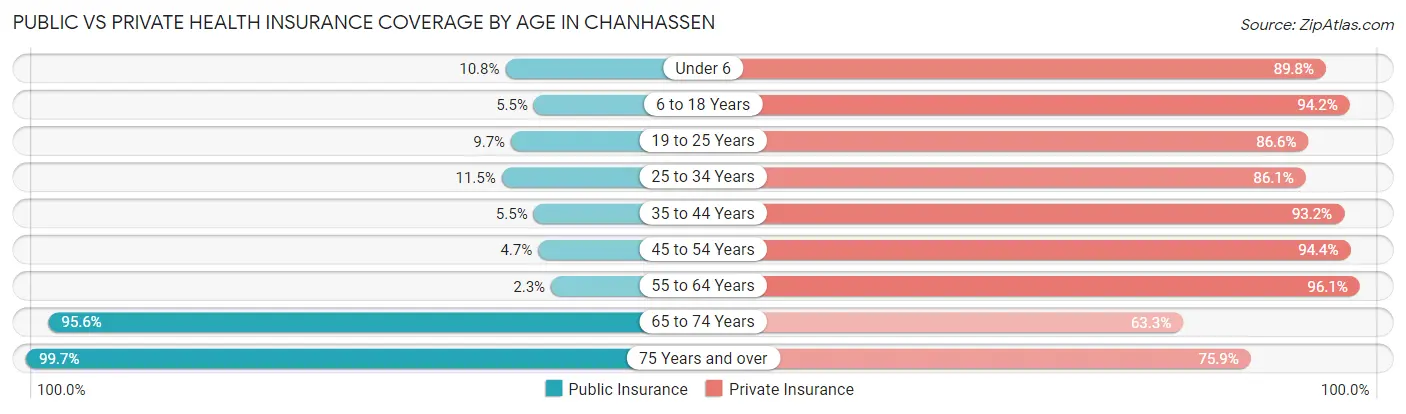
| Age Bracket | Public Insurance | Private Insurance |
| Under 6 | 196 (10.8%) | 1,634 (89.8%) |
| 6 to 18 Years | 288 (5.5%) | 4,944 (94.2%) |
| 19 to 25 Years | 153 (9.7%) | 1,362 (86.6%) |
| 25 to 34 Years | 250 (11.5%) | 1,876 (86.1%) |
| 35 to 44 Years | 206 (5.5%) | 3,465 (93.2%) |
| 45 to 54 Years | 166 (4.7%) | 3,341 (94.4%) |
| 55 to 64 Years | 93 (2.3%) | 3,868 (96.1%) |
| 65 to 74 Years | 2,220 (95.6%) | 1,471 (63.3%) |
| 75 Years and over | 1,439 (99.7%) | 1,095 (75.9%) |
| Total | 5,011 (19.4%) | 23,056 (89.1%) |
Disability Status by Sex by Age in Chanhassen
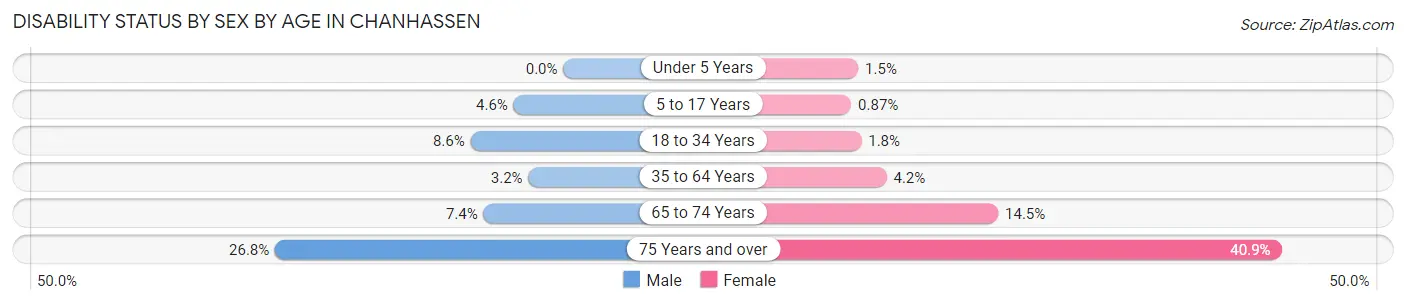
| Age Bracket | Male | Female |
| Under 5 Years | 0 (0.0%) | 10 (1.5%) |
| 5 to 17 Years | 127 (4.6%) | 22 (0.9%) |
| 18 to 34 Years | 200 (8.6%) | 34 (1.8%) |
| 35 to 64 Years | 179 (3.2%) | 239 (4.2%) |
| 65 to 74 Years | 72 (7.4%) | 196 (14.5%) |
| 75 Years and over | 176 (26.8%) | 321 (40.9%) |
Disability Class by Sex by Age in Chanhassen
Disability Class: Hearing Difficulty
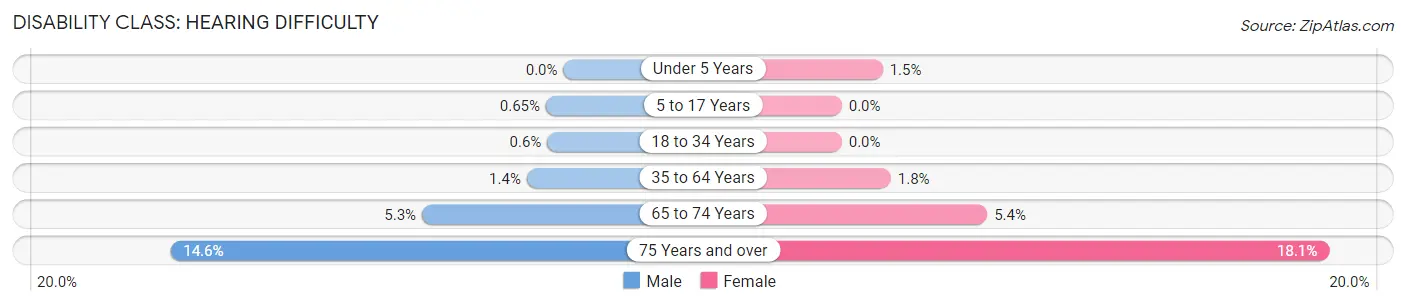
| Age Bracket | Male | Female |
| Under 5 Years | 0 (0.0%) | 10 (1.5%) |
| 5 to 17 Years | 18 (0.6%) | 0 (0.0%) |
| 18 to 34 Years | 14 (0.6%) | 0 (0.0%) |
| 35 to 64 Years | 75 (1.4%) | 105 (1.8%) |
| 65 to 74 Years | 51 (5.2%) | 73 (5.4%) |
| 75 Years and over | 96 (14.6%) | 142 (18.1%) |
Disability Class: Vision Difficulty
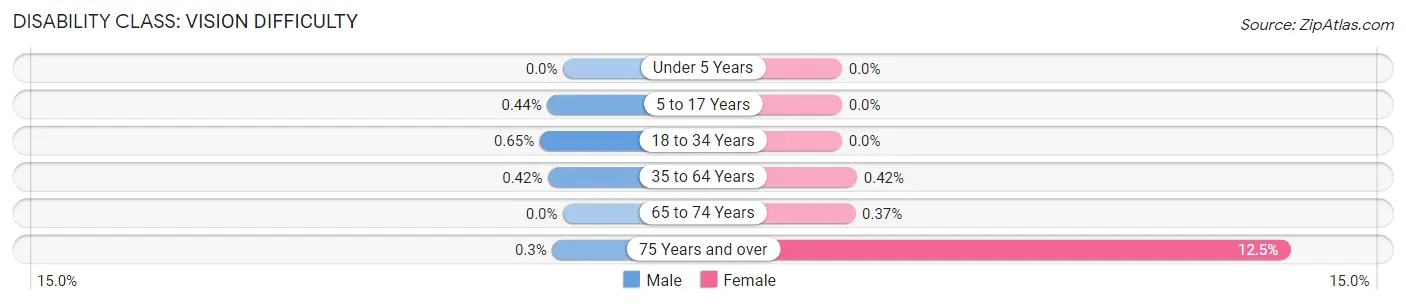
| Age Bracket | Male | Female |
| Under 5 Years | 0 (0.0%) | 0 (0.0%) |
| 5 to 17 Years | 12 (0.4%) | 0 (0.0%) |
| 18 to 34 Years | 15 (0.6%) | 0 (0.0%) |
| 35 to 64 Years | 23 (0.4%) | 24 (0.4%) |
| 65 to 74 Years | 0 (0.0%) | 5 (0.4%) |
| 75 Years and over | 2 (0.3%) | 98 (12.5%) |
Disability Class: Cognitive Difficulty
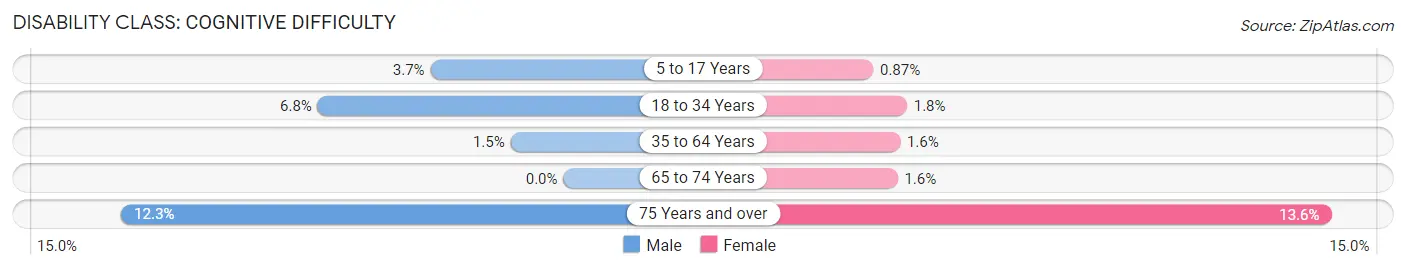
| Age Bracket | Male | Female |
| 5 to 17 Years | 102 (3.7%) | 22 (0.9%) |
| 18 to 34 Years | 159 (6.8%) | 34 (1.8%) |
| 35 to 64 Years | 81 (1.5%) | 93 (1.6%) |
| 65 to 74 Years | 0 (0.0%) | 21 (1.5%) |
| 75 Years and over | 81 (12.3%) | 107 (13.6%) |
Disability Class: Ambulatory Difficulty
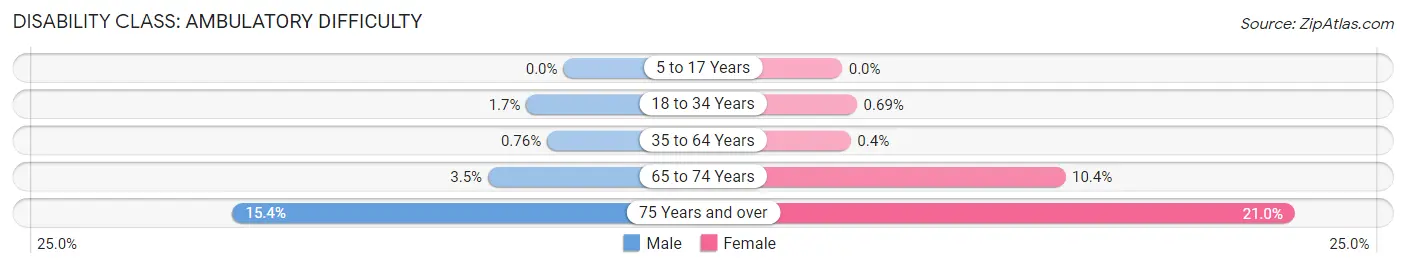
| Age Bracket | Male | Female |
| 5 to 17 Years | 0 (0.0%) | 0 (0.0%) |
| 18 to 34 Years | 40 (1.7%) | 13 (0.7%) |
| 35 to 64 Years | 42 (0.8%) | 23 (0.4%) |
| 65 to 74 Years | 34 (3.5%) | 140 (10.4%) |
| 75 Years and over | 101 (15.3%) | 165 (21.0%) |
Disability Class: Self-Care Difficulty
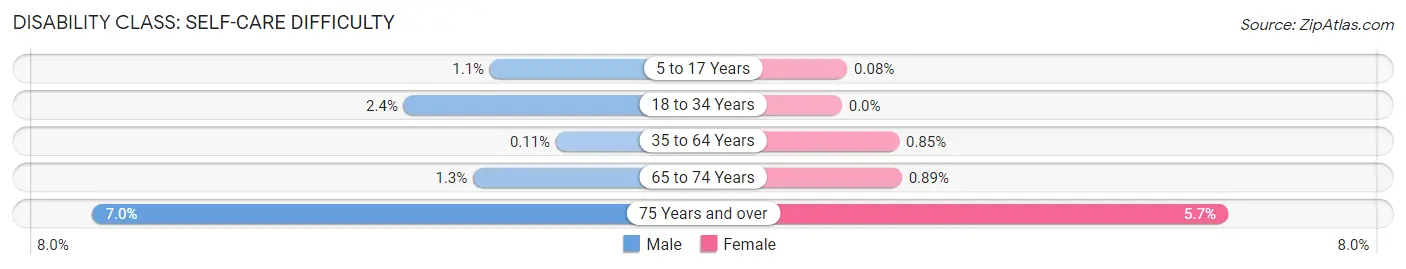
| Age Bracket | Male | Female |
| 5 to 17 Years | 30 (1.1%) | 2 (0.1%) |
| 18 to 34 Years | 55 (2.4%) | 0 (0.0%) |
| 35 to 64 Years | 6 (0.1%) | 49 (0.9%) |
| 65 to 74 Years | 13 (1.3%) | 12 (0.9%) |
| 75 Years and over | 46 (7.0%) | 45 (5.7%) |
Technology Access in Chanhassen
Computing Device Access in Chanhassen
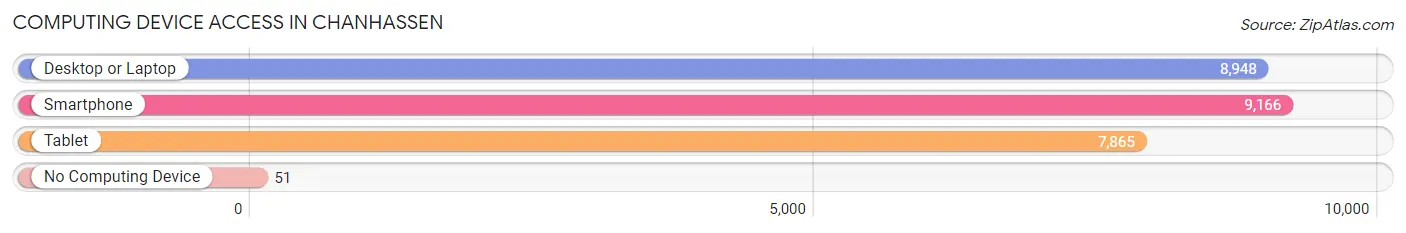
| Device Type | # Households | % Households |
| Desktop or Laptop | 8,948 | 93.4% |
| Smartphone | 9,166 | 95.7% |
| Tablet | 7,865 | 82.1% |
| No Computing Device | 51 | 0.5% |
| Total | 9,578 | 100.0% |
Internet Access in Chanhassen
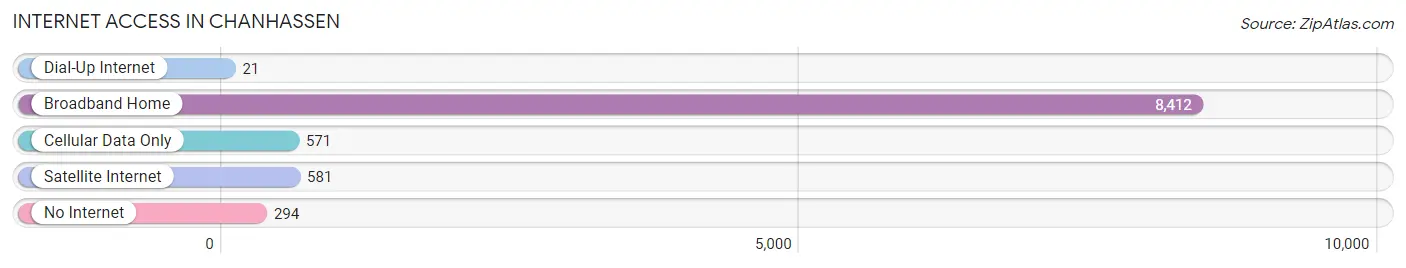
| Internet Type | # Households | % Households |
| Dial-Up Internet | 21 | 0.2% |
| Broadband Home | 8,412 | 87.8% |
| Cellular Data Only | 571 | 6.0% |
| Satellite Internet | 581 | 6.1% |
| No Internet | 294 | 3.1% |
| Total | 9,578 | 100.0% |
Chanhassen Summary
Chanhassen is a city located in Carver County, Minnesota, United States. The population was 22,952 at the 2010 census. It is the county seat of Carver County. Chanhassen is a southwestern suburb of the Twin Cities.
History
The area that is now Chanhassen was first settled in the early 1850s. The first settler was a man named John Blaisdell, who built a log cabin in the area in 1851. The area was originally known as Union Hill, and was later renamed to Chanhassen in 1858. The name Chanhassen is derived from the Dakota language, and means "sugar-maple tree".
The city was officially incorporated in 1972, and has since grown to become one of the largest cities in Carver County.
Geography
Chanhassen is located at the intersection of U.S. Highway 212 and Minnesota State Highway 5. It is located approximately 25 miles southwest of Minneapolis and St. Paul.
The city has a total area of 22.2 square miles, of which 21.9 square miles is land and 0.3 square miles is water.
Economy
The economy of Chanhassen is largely based on the service industry. The city is home to several large employers, including the Chanhassen Dinner Theatres, the Minnesota Landscape Arboretum, and the Chanhassen Recreation Center.
The city is also home to several large retail stores including Target Walmart and Kohl s
Demographics
As of the 2010 census, there were 22,952 people, 8,845 households, and 6,541 families residing in the city. The population density was 1,037.2 people per square mile. The racial makeup of the city was 90.2% White, 2.7% African American, 0.3% Native American, 4.2% Asian, 0.1% Pacific Islander, 1.2% from other races, and 1.4% from two or more races. Hispanic or Latino of any race were 3.2% of the population.
The median income for a household in the city was $76,845, and the median income for a family was $93,945. The per capita income for the city was $37,945. About 2.2% of families and 3.3% of the population were below the poverty line, including 3.7% of those under age 18 and 4.2% of those age 65 or over.
Common Questions
What is the Total Population of Chanhassen?
Total Population of Chanhassen is 25,868.
What is the Total Male Population of Chanhassen?
Total Male Population of Chanhassen is 12,892.
What is the Total Female Population of Chanhassen?
Total Female Population of Chanhassen is 12,976.
What is the Ratio of Males per 100 Females in Chanhassen?
There are 99.35 Males per 100 Females in Chanhassen.
What is the Ratio of Females per 100 Males in Chanhassen?
There are 100.65 Females per 100 Males in Chanhassen.
What is the Median Population Age in Chanhassen?
Median Population Age in Chanhassen is 40.6 Years.
What is the Average Family Size in Chanhassen
Average Family Size in Chanhassen is 3.2 People.
What is the Average Household Size in Chanhassen
Average Household Size in Chanhassen is 2.7 People.
What is Per Capita Income in Chanhassen?
Per Capita income in Chanhassen is $67,775.
What is the Median Family Income in Chanhassen?
Median Family Income in Chanhassen is $166,101.
What is the Median Household income in Chanhassen?
Median Household Income in Chanhassen is $131,633.
What is Income or Wage Gap in Chanhassen?
Income or Wage Gap in Chanhassen is 46.5%.
Women in Chanhassen earn 53.5 cents for every dollar earned by a man.
What is Family Income Deficit in Chanhassen?
Family Income Deficit in Chanhassen is $10,357.
Families that are below poverty line in Chanhassen earn $10,357 less on average than the poverty threshold level.
What is Inequality or Gini Index in Chanhassen?
Inequality or Gini Index in Chanhassen is 0.44.
How Large is the Labor Force in Chanhassen?
There are 13,926 People in the Labor Forcein in Chanhassen.
What is the Percentage of People in the Labor Force in Chanhassen?
69.8% of People are in the Labor Force in Chanhassen.
What is the Unemployment Rate in Chanhassen?
Unemployment Rate in Chanhassen is 3.5%.