Cities with the Lowest Poverty Level Among Seniors Over the Age of 75 in Minnesota
RELATED REPORTS & OPTIONS
Lowest Poverty | Seniors 75+
Minnesota
Compare Cities
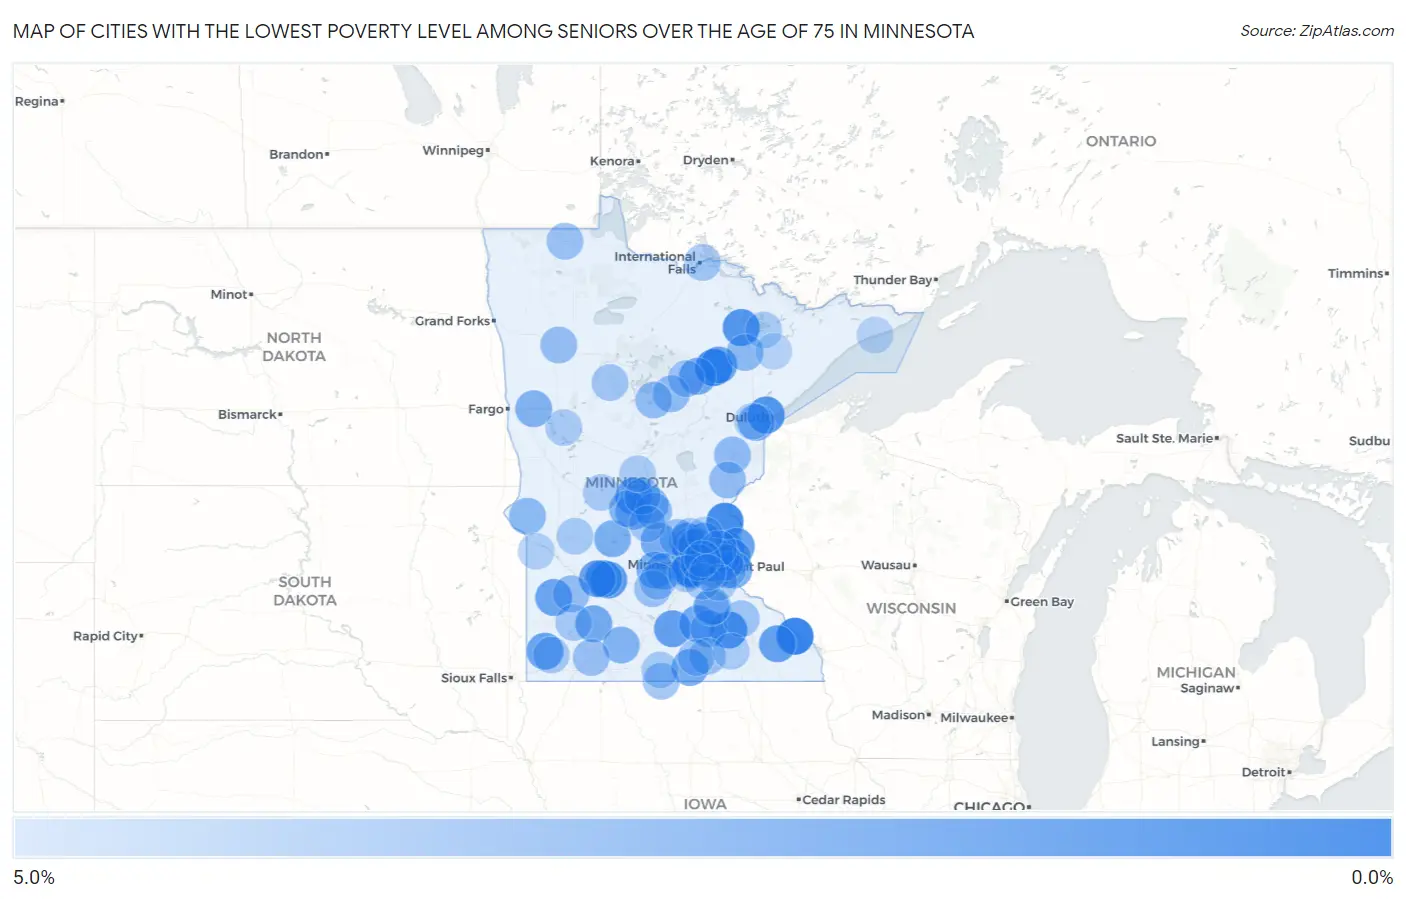
Map of Cities with the Lowest Poverty Level Among Seniors Over the Age of 75 in Minnesota
5.0%
0.0%
Cities with the Lowest Poverty Level Among Seniors Over the Age of 75 in Minnesota
| City | Senior Poverty | vs State | vs National | |
| 1. | Goodview | 0.42% | 9.5%(-9.07)#1 | 11.1%(-10.6)#40 |
| 2. | Nashwauk | 0.70% | 9.5%(-8.79)#2 | 11.1%(-10.4)#87 |
| 3. | North Branch | 0.90% | 9.5%(-8.59)#3 | 11.1%(-10.2)#125 |
| 4. | Cook | 1.4% | 9.5%(-8.12)#4 | 11.1%(-9.70)#246 |
| 5. | Hermantown | 1.4% | 9.5%(-8.11)#5 | 11.1%(-9.68)#250 |
| 6. | West Concord | 1.4% | 9.5%(-8.04)#6 | 11.1%(-9.62)#273 |
| 7. | Greenwood | 1.6% | 9.5%(-7.85)#7 | 11.1%(-9.43)#354 |
| 8. | Hugo | 1.7% | 9.5%(-7.84)#8 | 11.1%(-9.41)#360 |
| 9. | Falcon Heights | 1.7% | 9.5%(-7.81)#9 | 11.1%(-9.39)#374 |
| 10. | Olivia | 1.8% | 9.5%(-7.74)#10 | 11.1%(-9.31)#406 |
| 11. | Upsala | 1.8% | 9.5%(-7.71)#11 | 11.1%(-9.28)#419 |
| 12. | Marine On St Croix | 1.9% | 9.5%(-7.55)#12 | 11.1%(-9.13)#486 |
| 13. | Eagle Lake | 2.0% | 9.5%(-7.47)#13 | 11.1%(-9.05)#534 |
| 14. | Lauderdale | 2.0% | 9.5%(-7.46)#14 | 11.1%(-9.04)#540 |
| 15. | Danube | 2.0% | 9.5%(-7.45)#15 | 11.1%(-9.03)#551 |
| 16. | Renville | 2.1% | 9.5%(-7.43)#16 | 11.1%(-9.01)#563 |
| 17. | St Charles | 2.1% | 9.5%(-7.39)#17 | 11.1%(-8.96)#593 |
| 18. | Otsego | 2.2% | 9.5%(-7.29)#18 | 11.1%(-8.86)#658 |
| 19. | Keewatin | 2.3% | 9.5%(-7.24)#19 | 11.1%(-8.81)#690 |
| 20. | Minneota | 2.3% | 9.5%(-7.22)#20 | 11.1%(-8.79)#700 |
| 21. | Edgerton | 2.3% | 9.5%(-7.22)#21 | 11.1%(-8.79)#702 |
| 22. | Stillwater | 2.5% | 9.5%(-6.95)#22 | 11.1%(-8.53)#883 |
| 23. | Coleraine | 2.6% | 9.5%(-6.93)#23 | 11.1%(-8.50)#896 |
| 24. | Morristown | 2.6% | 9.5%(-6.93)#24 | 11.1%(-8.50)#899 |
| 25. | Lamberton | 2.6% | 9.5%(-6.93)#25 | 11.1%(-8.50)#900 |
| 26. | Andover | 2.6% | 9.5%(-6.87)#26 | 11.1%(-8.45)#941 |
| 27. | Deephaven | 2.6% | 9.5%(-6.86)#27 | 11.1%(-8.44)#949 |
| 28. | Afton | 2.7% | 9.5%(-6.79)#28 | 11.1%(-8.36)#991 |
| 29. | Alden | 2.7% | 9.5%(-6.79)#29 | 11.1%(-8.36)#1,001 |
| 30. | Annandale | 2.7% | 9.5%(-6.78)#30 | 11.1%(-8.36)#1,009 |
| 31. | Medford | 2.8% | 9.5%(-6.68)#31 | 11.1%(-8.25)#1,100 |
| 32. | Silver Lake | 2.8% | 9.5%(-6.68)#32 | 11.1%(-8.25)#1,102 |
| 33. | Shorewood | 2.8% | 9.5%(-6.67)#33 | 11.1%(-8.25)#1,105 |
| 34. | New London | 2.9% | 9.5%(-6.59)#34 | 11.1%(-8.16)#1,168 |
| 35. | St Stephen | 3.0% | 9.5%(-6.51)#35 | 11.1%(-8.08)#1,227 |
| 36. | Corcoran | 3.0% | 9.5%(-6.50)#36 | 11.1%(-8.08)#1,234 |
| 37. | Scanlon | 3.0% | 9.5%(-6.46)#37 | 11.1%(-8.04)#1,264 |
| 38. | Albany | 3.1% | 9.5%(-6.41)#38 | 11.1%(-7.99)#1,308 |
| 39. | Hawley | 3.1% | 9.5%(-6.41)#39 | 11.1%(-7.98)#1,312 |
| 40. | Butterfield | 3.2% | 9.5%(-6.32)#40 | 11.1%(-7.89)#1,389 |
| 41. | Lester Prairie | 3.2% | 9.5%(-6.30)#41 | 11.1%(-7.88)#1,396 |
| 42. | Freeport | 3.3% | 9.5%(-6.21)#42 | 11.1%(-7.79)#1,486 |
| 43. | Northfield | 3.3% | 9.5%(-6.16)#43 | 11.1%(-7.73)#1,537 |
| 44. | Graceville | 3.4% | 9.5%(-6.08)#44 | 11.1%(-7.66)#1,605 |
| 45. | Columbia Heights | 3.4% | 9.5%(-6.07)#45 | 11.1%(-7.65)#1,613 |
| 46. | Mountain Iron | 3.4% | 9.5%(-6.04)#46 | 11.1%(-7.62)#1,628 |
| 47. | Lilydale | 3.5% | 9.5%(-5.97)#47 | 11.1%(-7.54)#1,693 |
| 48. | Plymouth | 3.5% | 9.5%(-5.95)#48 | 11.1%(-7.52)#1,708 |
| 49. | Willow River | 3.6% | 9.5%(-5.92)#49 | 11.1%(-7.50)#1,757 |
| 50. | Remer | 3.6% | 9.5%(-5.92)#50 | 11.1%(-7.50)#1,758 |
| 51. | Sartell | 3.7% | 9.5%(-5.84)#51 | 11.1%(-7.41)#1,819 |
| 52. | Longville | 3.7% | 9.5%(-5.79)#52 | 11.1%(-7.36)#1,880 |
| 53. | Hinckley | 3.8% | 9.5%(-5.71)#53 | 11.1%(-7.28)#1,958 |
| 54. | Cottonwood | 3.8% | 9.5%(-5.70)#54 | 11.1%(-7.27)#1,973 |
| 55. | Tonka Bay | 3.8% | 9.5%(-5.65)#55 | 11.1%(-7.22)#2,006 |
| 56. | Mcintosh | 3.8% | 9.5%(-5.65)#56 | 11.1%(-7.22)#2,009 |
| 57. | Gem Lake | 3.8% | 9.5%(-5.65)#57 | 11.1%(-7.22)#2,017 |
| 58. | Bowlus | 3.8% | 9.5%(-5.65)#58 | 11.1%(-7.22)#2,027 |
| 59. | Rogers | 3.9% | 9.5%(-5.64)#59 | 11.1%(-7.22)#2,031 |
| 60. | Heron Lake | 3.9% | 9.5%(-5.60)#60 | 11.1%(-7.17)#2,070 |
| 61. | Monticello | 3.9% | 9.5%(-5.58)#61 | 11.1%(-7.15)#2,091 |
| 62. | Roseau | 4.0% | 9.5%(-5.49)#62 | 11.1%(-7.07)#2,172 |
| 63. | New Auburn | 4.0% | 9.5%(-5.49)#63 | 11.1%(-7.07)#2,182 |
| 64. | Elmore | 4.0% | 9.5%(-5.49)#64 | 11.1%(-7.07)#2,185 |
| 65. | Geneva | 4.0% | 9.5%(-5.49)#65 | 11.1%(-7.07)#2,190 |
| 66. | Woodbury | 4.0% | 9.5%(-5.47)#66 | 11.1%(-7.04)#2,197 |
| 67. | Cohasset | 4.1% | 9.5%(-5.41)#67 | 11.1%(-6.99)#2,254 |
| 68. | Zumbrota | 4.1% | 9.5%(-5.41)#68 | 11.1%(-6.98)#2,270 |
| 69. | Shoreview | 4.2% | 9.5%(-5.33)#69 | 11.1%(-6.90)#2,323 |
| 70. | Glencoe | 4.2% | 9.5%(-5.33)#70 | 11.1%(-6.90)#2,326 |
| 71. | Ranier | 4.2% | 9.5%(-5.33)#71 | 11.1%(-6.90)#2,342 |
| 72. | Hartland | 4.2% | 9.5%(-5.33)#72 | 11.1%(-6.90)#2,350 |
| 73. | Lake George | 4.2% | 9.5%(-5.33)#73 | 11.1%(-6.90)#2,354 |
| 74. | Dayton | 4.3% | 9.5%(-5.18)#74 | 11.1%(-6.76)#2,481 |
| 75. | Elk River | 4.3% | 9.5%(-5.16)#75 | 11.1%(-6.74)#2,499 |
| 76. | Tracy | 4.3% | 9.5%(-5.14)#76 | 11.1%(-6.72)#2,516 |
| 77. | Leota | 4.3% | 9.5%(-5.14)#77 | 11.1%(-6.72)#2,548 |
| 78. | Oakdale | 4.4% | 9.5%(-5.14)#78 | 11.1%(-6.71)#2,551 |
| 79. | Lino Lakes | 4.4% | 9.5%(-5.13)#79 | 11.1%(-6.71)#2,555 |
| 80. | Rockville | 4.4% | 9.5%(-5.12)#80 | 11.1%(-6.70)#2,561 |
| 81. | Benson | 4.4% | 9.5%(-5.10)#81 | 11.1%(-6.67)#2,577 |
| 82. | Victoria | 4.4% | 9.5%(-5.07)#82 | 11.1%(-6.64)#2,611 |
| 83. | Blue Earth | 4.4% | 9.5%(-5.06)#83 | 11.1%(-6.63)#2,622 |
| 84. | Dundas | 4.5% | 9.5%(-5.02)#84 | 11.1%(-6.59)#2,657 |
| 85. | Osakis | 4.5% | 9.5%(-4.98)#85 | 11.1%(-6.56)#2,693 |
| 86. | Savage | 4.5% | 9.5%(-4.96)#86 | 11.1%(-6.53)#2,712 |
| 87. | Randall | 4.5% | 9.5%(-4.95)#87 | 11.1%(-6.52)#2,739 |
| 88. | Tower | 4.5% | 9.5%(-4.95)#88 | 11.1%(-6.52)#2,749 |
| 89. | Vergas | 4.5% | 9.5%(-4.95)#89 | 11.1%(-6.52)#2,760 |
| 90. | Hayfield | 4.6% | 9.5%(-4.88)#90 | 11.1%(-6.45)#2,814 |
| 91. | Rosemount | 4.6% | 9.5%(-4.87)#91 | 11.1%(-6.45)#2,824 |
| 92. | St Anthony City Hennepin And Ramsey Counties | 4.6% | 9.5%(-4.87)#92 | 11.1%(-6.45)#2,826 |
| 93. | Cloquet | 4.7% | 9.5%(-4.75)#93 | 11.1%(-6.33)#2,916 |
| 94. | Medicine Lake | 4.8% | 9.5%(-4.73)#94 | 11.1%(-6.31)#2,956 |
| 95. | Bellingham | 4.8% | 9.5%(-4.73)#95 | 11.1%(-6.31)#2,970 |
| 96. | Oak Grove | 4.8% | 9.5%(-4.69)#96 | 11.1%(-6.27)#2,995 |
| 97. | Crystal | 4.9% | 9.5%(-4.56)#97 | 11.1%(-6.13)#3,125 |
| 98. | Richfield | 4.9% | 9.5%(-4.55)#98 | 11.1%(-6.13)#3,129 |
| 99. | Hoyt Lakes | 4.9% | 9.5%(-4.55)#99 | 11.1%(-6.12)#3,139 |
| 100. | Grand Marais | 5.0% | 9.5%(-4.53)#100 | 11.1%(-6.11)#3,158 |
Common Questions
What are the Top 10 Cities with the Lowest Poverty Level Among Seniors Over the Age of 75 in Minnesota?
Top 10 Cities with the Lowest Poverty Level Among Seniors Over the Age of 75 in Minnesota are:
#1
0.42%
#2
0.70%
#3
0.90%
#4
1.4%
#5
1.4%
#6
1.4%
#7
1.6%
#8
1.7%
#9
1.7%
#10
1.8%
What city has the Lowest Poverty Level Among Seniors Over the Age of 75 in Minnesota?
Goodview has the Lowest Poverty Level Among Seniors Over the Age of 75 in Minnesota with 0.42%.
What is the Poverty Level Among Seniors Over the Age of 75 in the State of Minnesota?
Poverty Level Among Seniors Over the Age of 75 in Minnesota is 9.5%.
What is the Poverty Level Among Seniors Over the Age of 75 in the United States?
Poverty Level Among Seniors Over the Age of 75 in the United States is 11.1%.