Cottage Grove, MN
Cottage Grove Map
Cottage Grove Overview
39,274
TOTAL POPULATION
19,296
MALE POPULATION
19,978
FEMALE POPULATION
96.59
MALES / 100 FEMALES
103.53
FEMALES / 100 MALES
36.8
MEDIAN AGE
3.3
AVG FAMILY SIZE
3.0
AVG HOUSEHOLD SIZE
$45,753
PER CAPITA INCOME
$127,091
AVG FAMILY INCOME
$117,673
AVG HOUSEHOLD INCOME
25.1%
WAGE / INCOME GAP [ % ]
74.9¢/ $1
WAGE / INCOME GAP [ $ ]
$12,976
FAMILY INCOME DEFICIT
0.34
INEQUALITY / GINI INDEX
21,997
LABOR FORCE [ PEOPLE ]
73.5%
PERCENT IN LABOR FORCE
2.7%
UNEMPLOYMENT RATE
Cottage Grove Zip Codes
Cottage Grove Area Codes
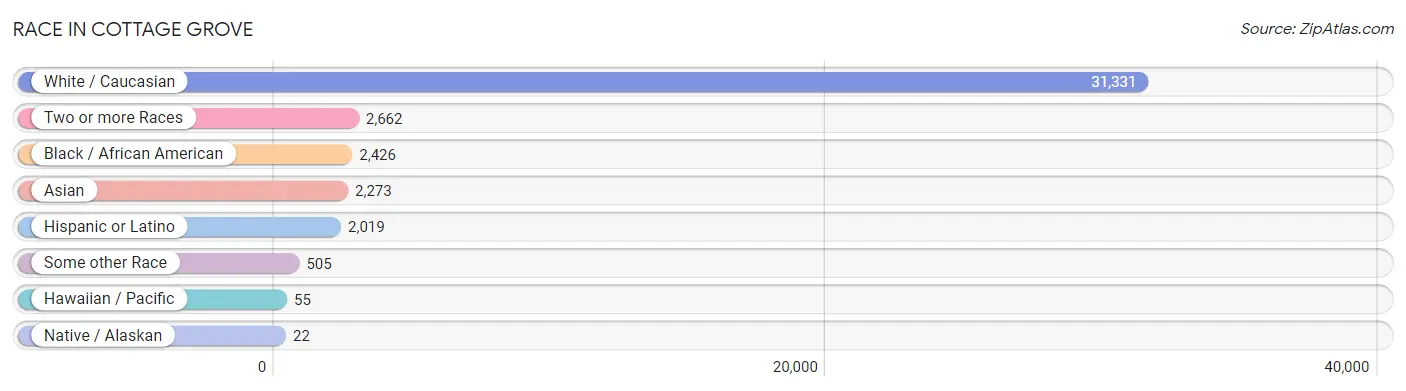
Race in Cottage Grove
The most populous races in Cottage Grove are White / Caucasian (31,331 | 79.8%), Two or more Races (2,662 | 6.8%), and Black / African American (2,426 | 6.2%).
| Race | # Population | % Population |
| Asian | 2,273 | 5.8% |
| Black / African American | 2,426 | 6.2% |
| Hawaiian / Pacific | 55 | 0.1% |
| Hispanic or Latino | 2,019 | 5.1% |
| Native / Alaskan | 22 | 0.1% |
| White / Caucasian | 31,331 | 79.8% |
| Two or more Races | 2,662 | 6.8% |
| Some other Race | 505 | 1.3% |
| Total | 39,274 | 100.0% |
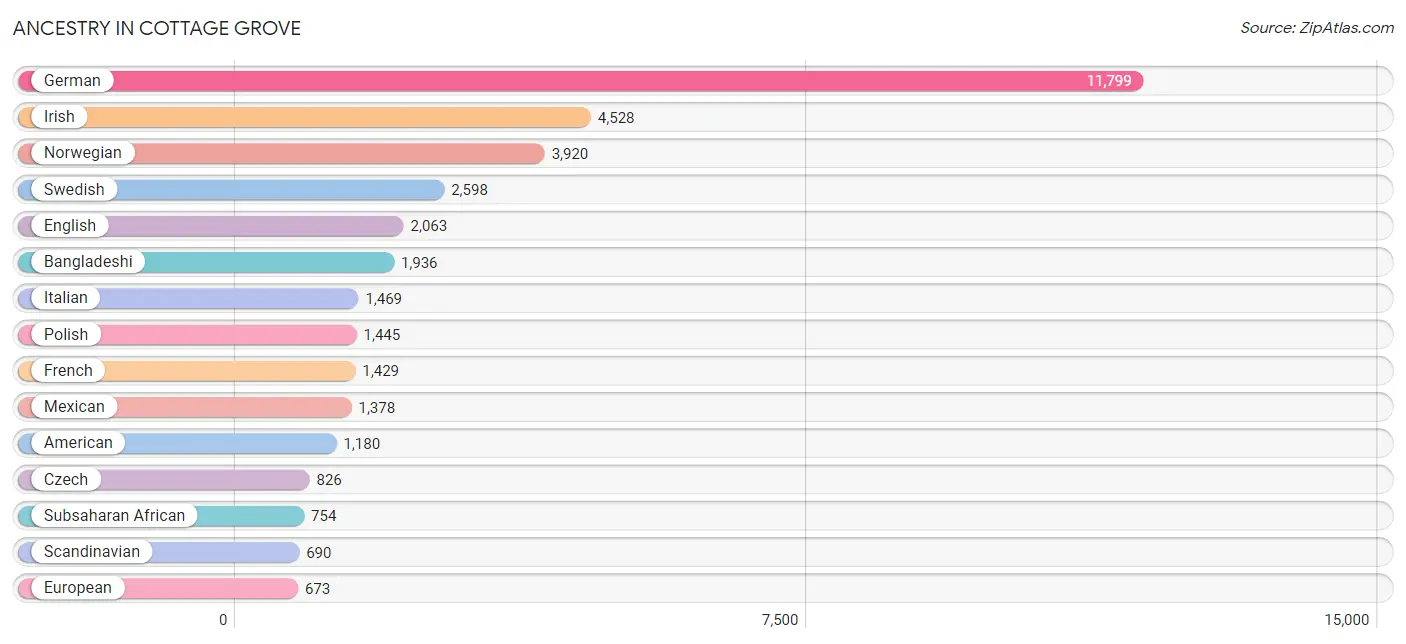
Ancestry in Cottage Grove
The most populous ancestries reported in Cottage Grove are German (11,799 | 30.0%), Irish (4,528 | 11.5%), Norwegian (3,920 | 10.0%), Swedish (2,598 | 6.6%), and English (2,063 | 5.2%), together accounting for 63.4% of all Cottage Grove residents.
| Ancestry | # Population | % Population |
| African | 143 | 0.4% |
| American | 1,180 | 3.0% |
| Arab | 126 | 0.3% |
| Austrian | 211 | 0.5% |
| Bangladeshi | 1,936 | 4.9% |
| Belgian | 38 | 0.1% |
| Bhutanese | 45 | 0.1% |
| Brazilian | 24 | 0.1% |
| British | 80 | 0.2% |
| Bulgarian | 11 | 0.0% |
| Burmese | 34 | 0.1% |
| Canadian | 82 | 0.2% |
| Central American | 362 | 0.9% |
| Cherokee | 28 | 0.1% |
| Chippewa | 103 | 0.3% |
| Colombian | 20 | 0.1% |
| Creek | 28 | 0.1% |
| Croatian | 113 | 0.3% |
| Cuban | 100 | 0.3% |
| Czech | 826 | 2.1% |
| Czechoslovakian | 53 | 0.1% |
| Danish | 452 | 1.1% |
| Dominican | 21 | 0.1% |
| Dutch | 328 | 0.8% |
| Eastern European | 85 | 0.2% |
| English | 2,063 | 5.2% |
| Estonian | 6 | 0.0% |
| Ethiopian | 348 | 0.9% |
| European | 673 | 1.7% |
| Finnish | 439 | 1.1% |
| French | 1,429 | 3.6% |
| French Canadian | 203 | 0.5% |
| German | 11,799 | 30.0% |
| Greek | 102 | 0.3% |
| Guatemalan | 105 | 0.3% |
| Hungarian | 314 | 0.8% |
| Indian (Asian) | 95 | 0.2% |
| Indonesian | 16 | 0.0% |
| Irish | 4,528 | 11.5% |
| Italian | 1,469 | 3.7% |
| Jamaican | 20 | 0.1% |
| Japanese | 107 | 0.3% |
| Korean | 323 | 0.8% |
| Latvian | 37 | 0.1% |
| Lebanese | 65 | 0.2% |
| Lithuanian | 34 | 0.1% |
| Lumbee | 4 | 0.0% |
| Luxembourger | 76 | 0.2% |
| Malaysian | 10 | 0.0% |
| Mexican | 1,378 | 3.5% |
| Mexican American Indian | 3 | 0.0% |
| Native Hawaiian | 52 | 0.1% |
| Nicaraguan | 257 | 0.6% |
| Nigerian | 199 | 0.5% |
| Northern European | 58 | 0.2% |
| Norwegian | 3,920 | 10.0% |
| Pakistani | 28 | 0.1% |
| Palestinian | 61 | 0.2% |
| Polish | 1,445 | 3.7% |
| Portuguese | 21 | 0.1% |
| Potawatomi | 10 | 0.0% |
| Puerto Rican | 78 | 0.2% |
| Romanian | 26 | 0.1% |
| Russian | 113 | 0.3% |
| Samoan | 28 | 0.1% |
| Scandinavian | 690 | 1.8% |
| Scotch-Irish | 76 | 0.2% |
| Scottish | 202 | 0.5% |
| Serbian | 65 | 0.2% |
| Slovene | 69 | 0.2% |
| Somali | 54 | 0.1% |
| South American | 20 | 0.1% |
| Spaniard | 21 | 0.1% |
| Spanish | 28 | 0.1% |
| Sri Lankan | 132 | 0.3% |
| Subsaharan African | 754 | 1.9% |
| Swedish | 2,598 | 6.6% |
| Swiss | 109 | 0.3% |
| Thai | 198 | 0.5% |
| Turkish | 63 | 0.2% |
| Ugandan | 10 | 0.0% |
| Ukrainian | 121 | 0.3% |
| Welsh | 45 | 0.1% | View All 83 Rows |
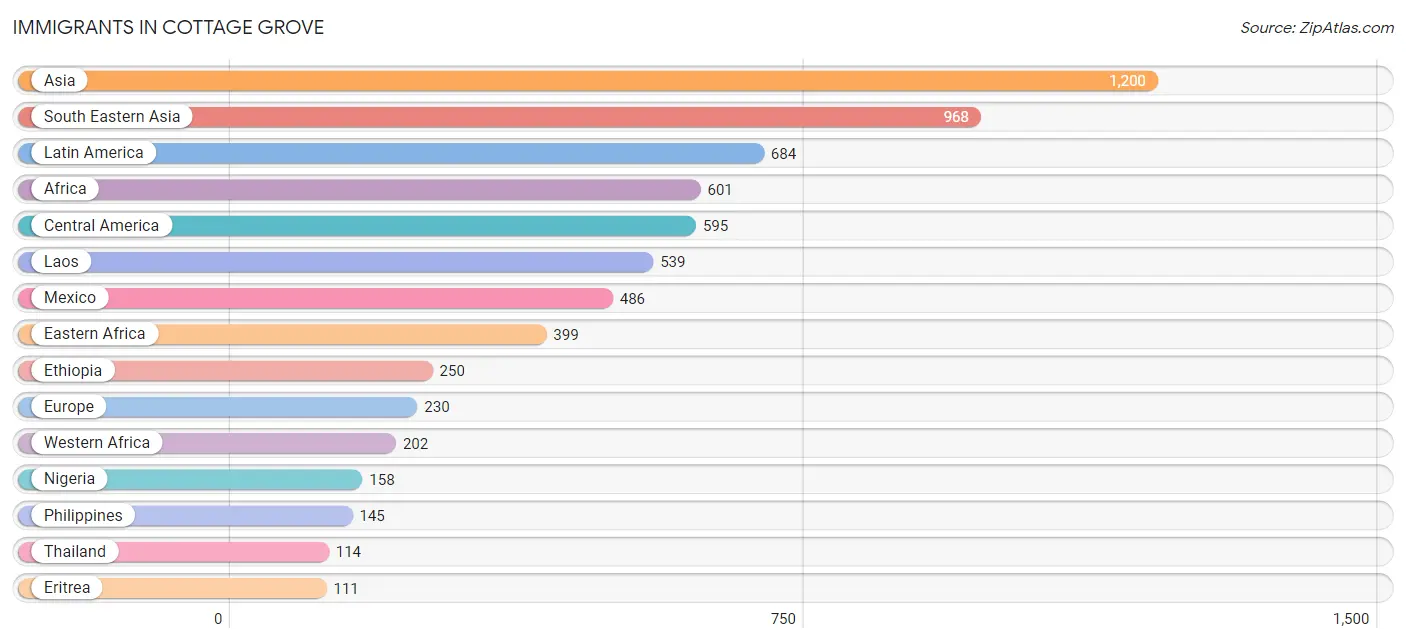
Immigrants in Cottage Grove
The most numerous immigrant groups reported in Cottage Grove came from Asia (1,200 | 3.1%), South Eastern Asia (968 | 2.5%), Latin America (684 | 1.7%), Africa (601 | 1.5%), and Central America (595 | 1.5%), together accounting for 10.3% of all Cottage Grove residents.
| Immigration Origin | # Population | % Population |
| Africa | 601 | 1.5% |
| Asia | 1,200 | 3.1% |
| Brazil | 12 | 0.0% |
| Cambodia | 60 | 0.2% |
| Canada | 102 | 0.3% |
| Caribbean | 43 | 0.1% |
| Central America | 595 | 1.5% |
| China | 9 | 0.0% |
| Colombia | 13 | 0.0% |
| Cuba | 23 | 0.1% |
| Czechoslovakia | 30 | 0.1% |
| Eastern Africa | 399 | 1.0% |
| Eastern Asia | 42 | 0.1% |
| Eastern Europe | 80 | 0.2% |
| England | 20 | 0.1% |
| Eritrea | 111 | 0.3% |
| Ethiopia | 250 | 0.6% |
| Europe | 230 | 0.6% |
| France | 10 | 0.0% |
| Germany | 90 | 0.2% |
| Guatemala | 35 | 0.1% |
| Guyana | 21 | 0.1% |
| India | 92 | 0.2% |
| Jamaica | 20 | 0.1% |
| Japan | 14 | 0.0% |
| Korea | 19 | 0.1% |
| Laos | 539 | 1.4% |
| Latin America | 684 | 1.7% |
| Liberia | 44 | 0.1% |
| Mexico | 486 | 1.2% |
| Netherlands | 7 | 0.0% |
| Nicaragua | 63 | 0.2% |
| Nigeria | 158 | 0.4% |
| Northern Europe | 39 | 0.1% |
| Oceania | 28 | 0.1% |
| Pakistan | 1 | 0.0% |
| Panama | 11 | 0.0% |
| Philippines | 145 | 0.4% |
| Romania | 44 | 0.1% |
| Somalia | 28 | 0.1% |
| South America | 46 | 0.1% |
| South Central Asia | 93 | 0.2% |
| South Eastern Asia | 968 | 2.5% |
| Southern Europe | 4 | 0.0% |
| Spain | 4 | 0.0% |
| Thailand | 114 | 0.3% |
| Turkey | 63 | 0.2% |
| Uganda | 10 | 0.0% |
| Vietnam | 94 | 0.2% |
| Western Africa | 202 | 0.5% |
| Western Asia | 89 | 0.2% |
| Western Europe | 107 | 0.3% | View All 52 Rows |
Sex and Age in Cottage Grove
Sex and Age in Cottage Grove
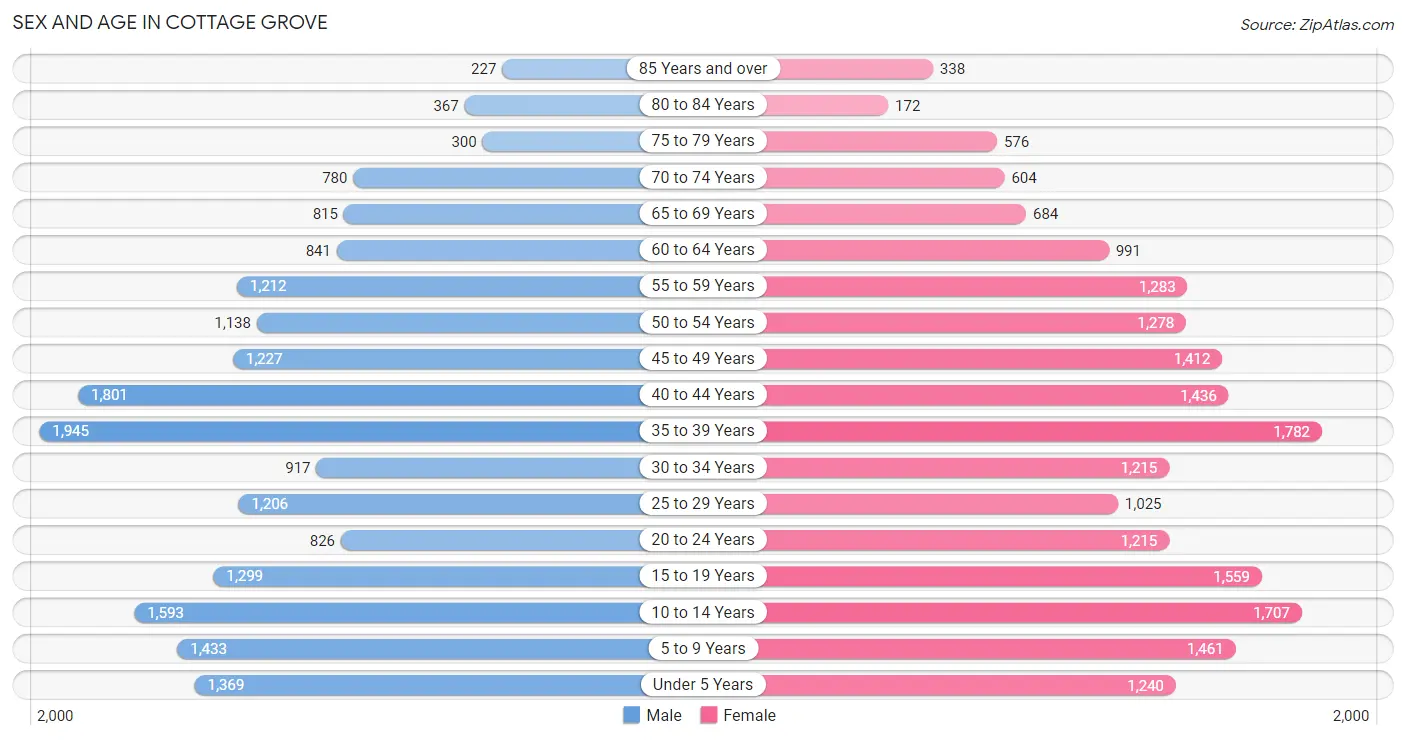
The most populous age groups in Cottage Grove are 35 to 39 Years (1,945 | 10.1%) for men and 35 to 39 Years (1,782 | 8.9%) for women.
| Age Bracket | Male | Female |
| Under 5 Years | 1,369 (7.1%) | 1,240 (6.2%) |
| 5 to 9 Years | 1,433 (7.4%) | 1,461 (7.3%) |
| 10 to 14 Years | 1,593 (8.3%) | 1,707 (8.5%) |
| 15 to 19 Years | 1,299 (6.7%) | 1,559 (7.8%) |
| 20 to 24 Years | 826 (4.3%) | 1,215 (6.1%) |
| 25 to 29 Years | 1,206 (6.2%) | 1,025 (5.1%) |
| 30 to 34 Years | 917 (4.8%) | 1,215 (6.1%) |
| 35 to 39 Years | 1,945 (10.1%) | 1,782 (8.9%) |
| 40 to 44 Years | 1,801 (9.3%) | 1,436 (7.2%) |
| 45 to 49 Years | 1,227 (6.4%) | 1,412 (7.1%) |
| 50 to 54 Years | 1,138 (5.9%) | 1,278 (6.4%) |
| 55 to 59 Years | 1,212 (6.3%) | 1,283 (6.4%) |
| 60 to 64 Years | 841 (4.4%) | 991 (5.0%) |
| 65 to 69 Years | 815 (4.2%) | 684 (3.4%) |
| 70 to 74 Years | 780 (4.0%) | 604 (3.0%) |
| 75 to 79 Years | 300 (1.5%) | 576 (2.9%) |
| 80 to 84 Years | 367 (1.9%) | 172 (0.9%) |
| 85 Years and over | 227 (1.2%) | 338 (1.7%) |
| Total | 19,296 (100.0%) | 19,978 (100.0%) |
Families and Households in Cottage Grove
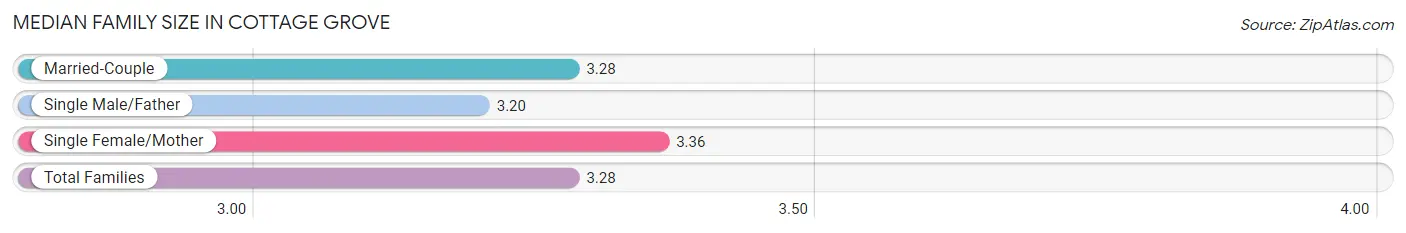
Median Family Size in Cottage Grove
The median family size in Cottage Grove is 3.28 persons per family, with single female/mother families (1,102 | 10.4%) accounting for the largest median family size of 3.36 persons per family. On the other hand, single male/father families (727 | 6.9%) represent the smallest median family size with 3.20 persons per family.
| Family Type | # Families | Family Size |
| Married-Couple | 8,719 (82.7%) | 3.28 |
| Single Male/Father | 727 (6.9%) | 3.20 |
| Single Female/Mother | 1,102 (10.4%) | 3.36 |
| Total Families | 10,548 (100.0%) | 3.28 |
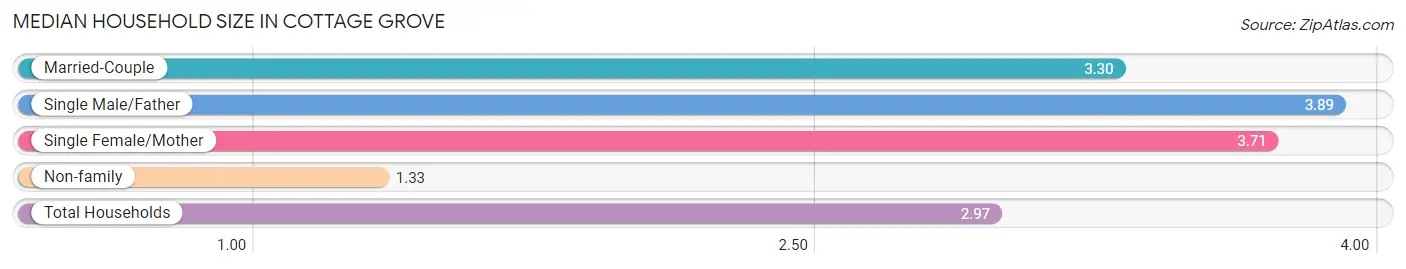
Median Household Size in Cottage Grove
The median household size in Cottage Grove is 2.97 persons per household, with single male/father households (727 | 5.5%) accounting for the largest median household size of 3.89 persons per household. non-family households (2,646 | 20.1%) represent the smallest median household size with 1.33 persons per household.
| Household Type | # Households | Household Size |
| Married-Couple | 8,719 (66.1%) | 3.30 |
| Single Male/Father | 727 (5.5%) | 3.89 |
| Single Female/Mother | 1,102 (8.4%) | 3.71 |
| Non-family | 2,646 (20.1%) | 1.33 |
| Total Households | 13,194 (100.0%) | 2.97 |
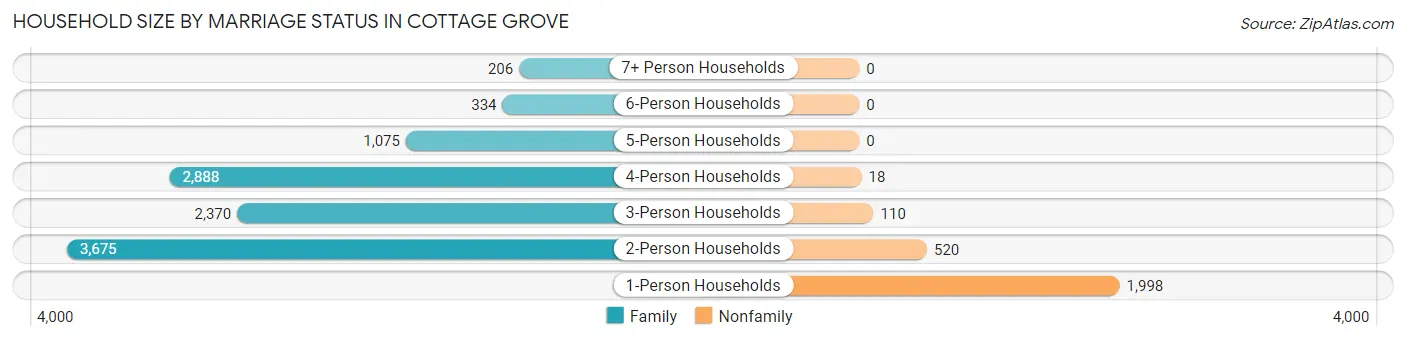
Household Size by Marriage Status in Cottage Grove
Out of a total of 13,194 households in Cottage Grove, 10,548 (79.9%) are family households, while 2,646 (20.1%) are nonfamily households. The most numerous type of family households are 2-person households, comprising 3,675, and the most common type of nonfamily households are 1-person households, comprising 1,998.
| Household Size | Family Households | Nonfamily Households |
| 1-Person Households | - | 1,998 (15.1%) |
| 2-Person Households | 3,675 (27.9%) | 520 (3.9%) |
| 3-Person Households | 2,370 (18.0%) | 110 (0.8%) |
| 4-Person Households | 2,888 (21.9%) | 18 (0.1%) |
| 5-Person Households | 1,075 (8.2%) | 0 (0.0%) |
| 6-Person Households | 334 (2.5%) | 0 (0.0%) |
| 7+ Person Households | 206 (1.6%) | 0 (0.0%) |
| Total | 10,548 (79.9%) | 2,646 (20.1%) |
Female Fertility in Cottage Grove
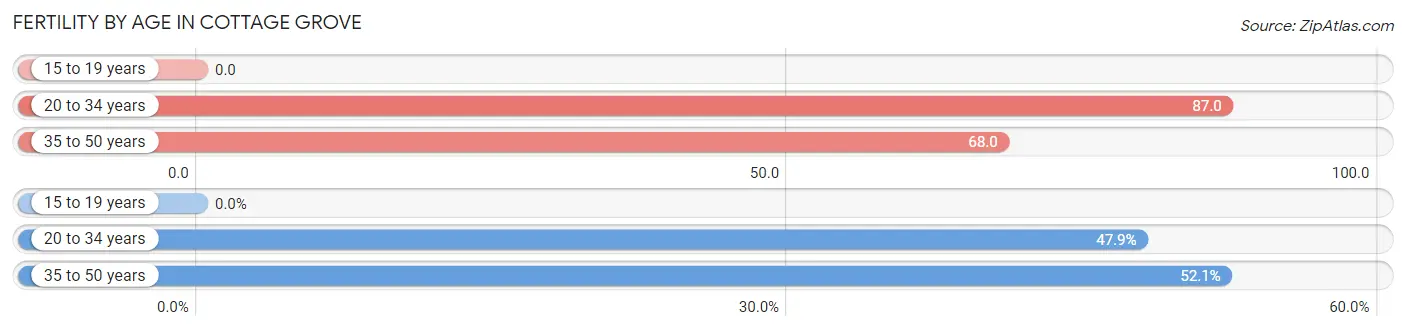
Fertility by Age in Cottage Grove
Average fertility rate in Cottage Grove is 64.0 births per 1,000 women. Women in the age bracket of 20 to 34 years have the highest fertility rate with 87.0 births per 1,000 women. Women in the age bracket of 35 to 50 years acount for 52.1% of all women with births.
| Age Bracket | Women with Births | Births / 1,000 Women |
| 15 to 19 years | 0 (0.0%) | 0.0 |
| 20 to 34 years | 302 (47.9%) | 87.0 |
| 35 to 50 years | 329 (52.1%) | 68.0 |
| Total | 631 (100.0%) | 64.0 |
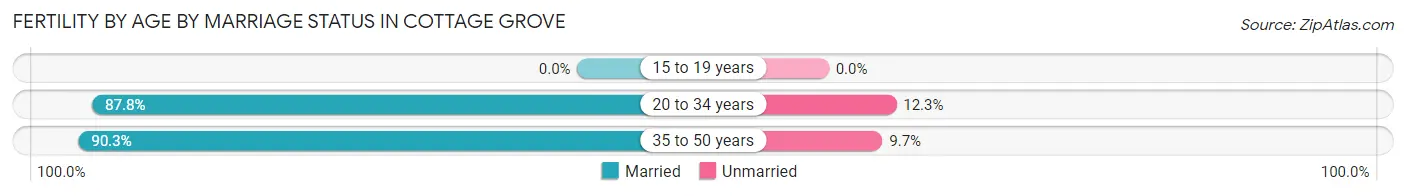
Fertility by Age by Marriage Status in Cottage Grove
89.1% of women with births (631) in Cottage Grove are married. The highest percentage of unmarried women with births falls into 20 to 34 years age bracket with 12.2% of them unmarried at the time of birth, while the lowest percentage of unmarried women with births belong to 35 to 50 years age bracket with 9.7% of them unmarried.
| Age Bracket | Married | Unmarried |
| 15 to 19 years | 0 (0.0%) | 0 (0.0%) |
| 20 to 34 years | 265 (87.7%) | 37 (12.2%) |
| 35 to 50 years | 297 (90.3%) | 32 (9.7%) |
| Total | 562 (89.1%) | 69 (10.9%) |
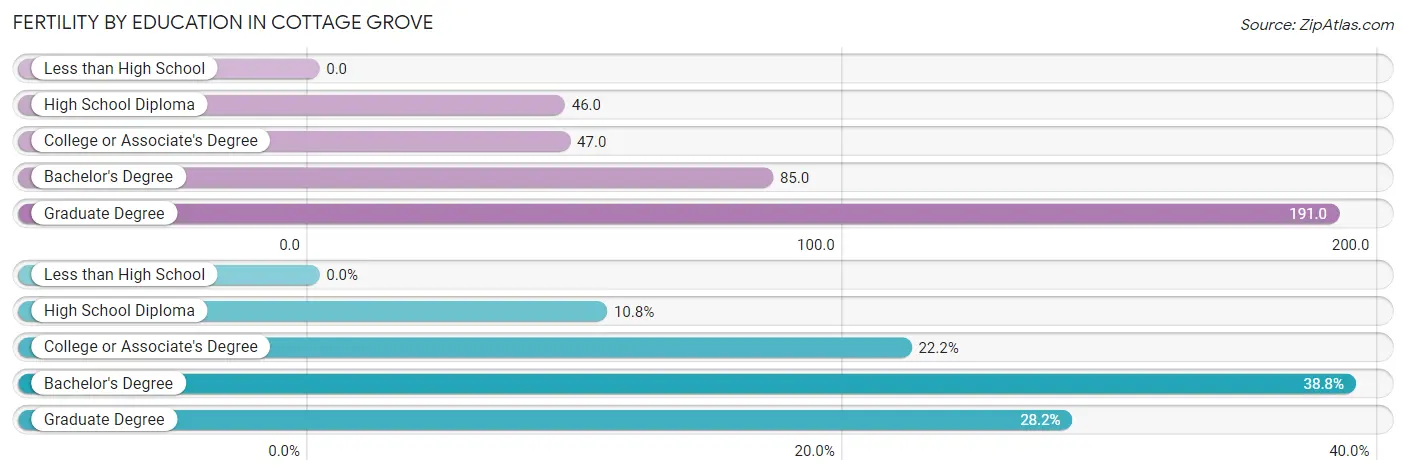
Fertility by Education in Cottage Grove
| Educational Attainment | Women with Births | Births / 1,000 Women |
| Less than High School | 0 (0.0%) | 0.0 |
| High School Diploma | 68 (10.8%) | 46.0 |
| College or Associate's Degree | 140 (22.2%) | 47.0 |
| Bachelor's Degree | 245 (38.8%) | 85.0 |
| Graduate Degree | 178 (28.2%) | 191.0 |
| Total | 631 (100.0%) | 64.0 |
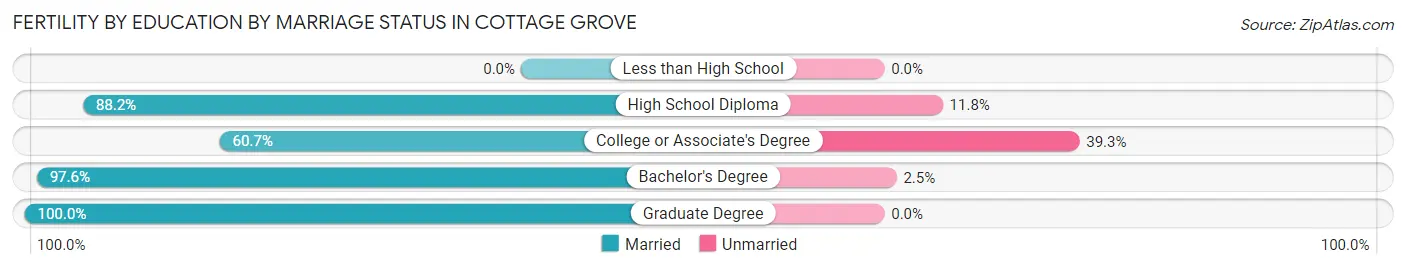
Fertility by Education by Marriage Status in Cottage Grove
10.9% of women with births in Cottage Grove are unmarried. Women with the educational attainment of graduate degree are most likely to be married with 100.0% of them married at childbirth, while women with the educational attainment of college or associate's degree are least likely to be married with 39.3% of them unmarried at childbirth.
| Educational Attainment | Married | Unmarried |
| Less than High School | 0 (0.0%) | 0 (0.0%) |
| High School Diploma | 60 (88.2%) | 8 (11.8%) |
| College or Associate's Degree | 85 (60.7%) | 55 (39.3%) |
| Bachelor's Degree | 239 (97.6%) | 6 (2.5%) |
| Graduate Degree | 178 (100.0%) | 0 (0.0%) |
| Total | 562 (89.1%) | 69 (10.9%) |
Income in Cottage Grove
Income Overview in Cottage Grove
Per Capita Income in Cottage Grove is $45,753, while median incomes of families and households are $127,091 and $117,673 respectively.
| Characteristic | Number | Measure |
| Per Capita Income | 39,274 | $45,753 |
| Median Family Income | 10,548 | $127,091 |
| Mean Family Income | 10,548 | $143,907 |
| Median Household Income | 13,194 | $117,673 |
| Mean Household Income | 13,194 | $135,336 |
| Income Deficit | 10,548 | $12,976 |
| Wage / Income Gap (%) | 39,274 | 25.14% |
| Wage / Income Gap ($) | 39,274 | 74.86¢ per $1 |
| Gini / Inequality Index | 39,274 | 0.34 |
Earnings by Sex in Cottage Grove
Average Earnings in Cottage Grove are $58,727, $66,616 for men and $49,869 for women, a difference of 25.1%.
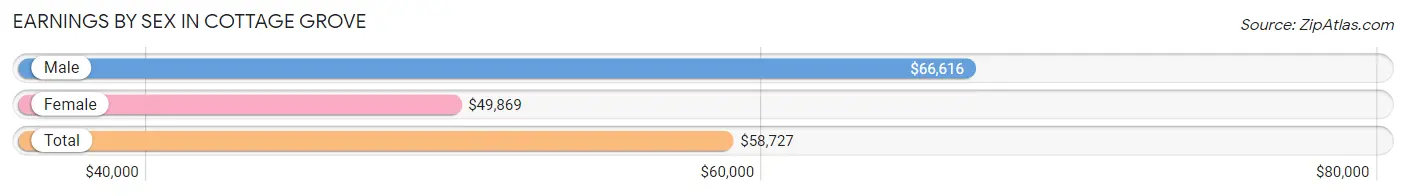
| Sex | Number | Average Earnings |
| Male | 11,736 (50.7%) | $66,616 |
| Female | 11,393 (49.3%) | $49,869 |
| Total | 23,129 (100.0%) | $58,727 |
Earnings by Sex by Income Bracket in Cottage Grove
The most common earnings brackets in Cottage Grove are $100,000+ for men (2,805 | 23.9%) and $75,000 to $99,999 for women (1,607 | 14.1%).
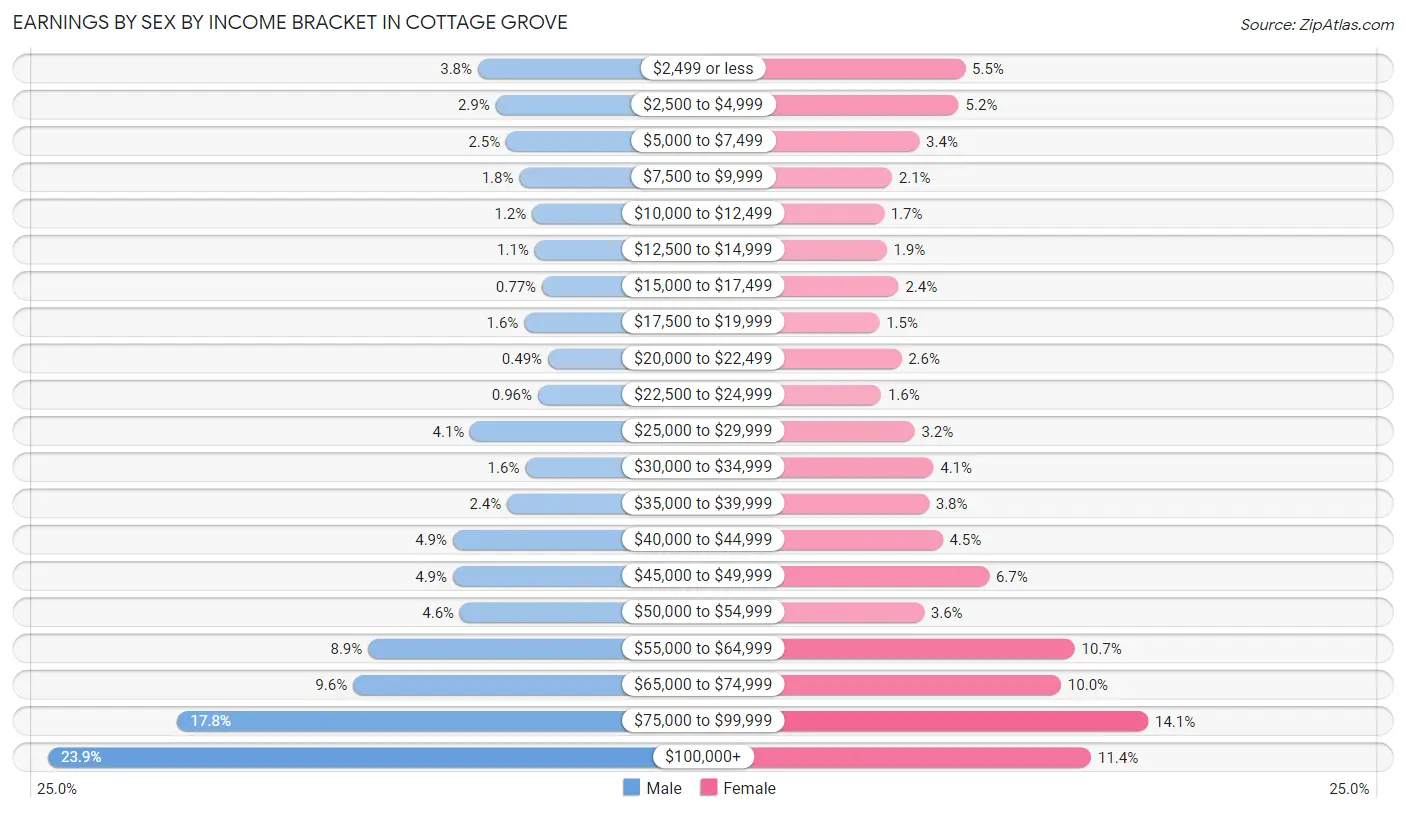
| Income | Male | Female |
| $2,499 or less | 442 (3.8%) | 631 (5.5%) |
| $2,500 to $4,999 | 345 (2.9%) | 597 (5.2%) |
| $5,000 to $7,499 | 288 (2.5%) | 386 (3.4%) |
| $7,500 to $9,999 | 215 (1.8%) | 240 (2.1%) |
| $10,000 to $12,499 | 144 (1.2%) | 197 (1.7%) |
| $12,500 to $14,999 | 130 (1.1%) | 212 (1.9%) |
| $15,000 to $17,499 | 90 (0.8%) | 276 (2.4%) |
| $17,500 to $19,999 | 188 (1.6%) | 173 (1.5%) |
| $20,000 to $22,499 | 58 (0.5%) | 290 (2.5%) |
| $22,500 to $24,999 | 113 (1.0%) | 182 (1.6%) |
| $25,000 to $29,999 | 485 (4.1%) | 361 (3.2%) |
| $30,000 to $34,999 | 182 (1.5%) | 461 (4.1%) |
| $35,000 to $39,999 | 282 (2.4%) | 438 (3.8%) |
| $40,000 to $44,999 | 580 (4.9%) | 510 (4.5%) |
| $45,000 to $49,999 | 580 (4.9%) | 759 (6.7%) |
| $50,000 to $54,999 | 541 (4.6%) | 411 (3.6%) |
| $55,000 to $64,999 | 1,046 (8.9%) | 1,216 (10.7%) |
| $65,000 to $74,999 | 1,129 (9.6%) | 1,143 (10.0%) |
| $75,000 to $99,999 | 2,093 (17.8%) | 1,607 (14.1%) |
| $100,000+ | 2,805 (23.9%) | 1,303 (11.4%) |
| Total | 11,736 (100.0%) | 11,393 (100.0%) |
Earnings by Sex by Educational Attainment in Cottage Grove
Average earnings in Cottage Grove are $72,124 for men and $58,662 for women, a difference of 18.7%. Men with an educational attainment of graduate degree enjoy the highest average annual earnings of $97,981, while those with high school diploma education earn the least with $54,167. Women with an educational attainment of graduate degree earn the most with the average annual earnings of $76,078, while those with less than high school education have the smallest earnings of $32,552.
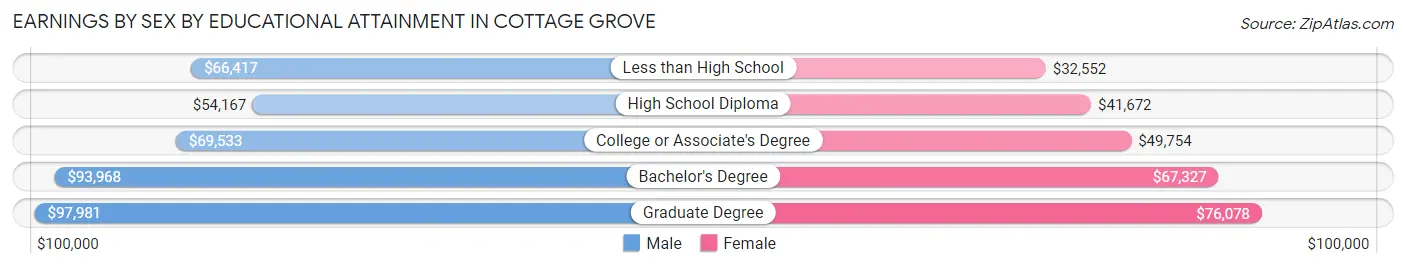
| Educational Attainment | Male Income | Female Income |
| Less than High School | $66,417 | $32,552 |
| High School Diploma | $54,167 | $41,672 |
| College or Associate's Degree | $69,533 | $49,754 |
| Bachelor's Degree | $93,968 | $67,327 |
| Graduate Degree | $97,981 | $76,078 |
| Total | $72,124 | $58,662 |
Family Income in Cottage Grove
Family Income Brackets in Cottage Grove
According to the Cottage Grove family income data, there are 3,249 families falling into the $100,000 to $149,999 income range, which is the most common income bracket and makes up 30.8% of all families. Conversely, the $10,000 to $14,999 income bracket is the least frequent group with only 84 families (0.8%) belonging to this category.
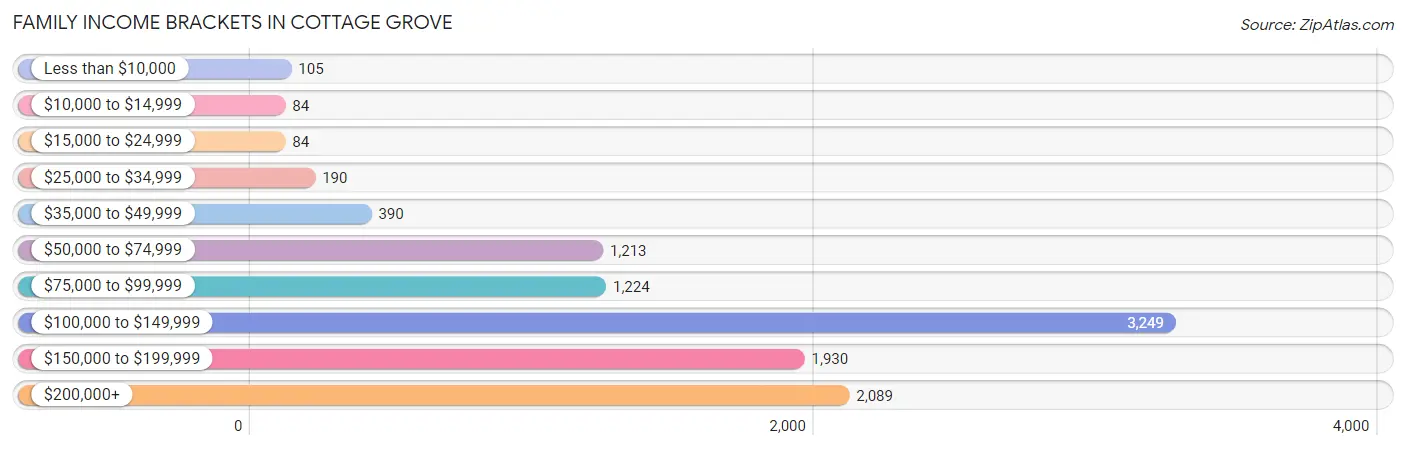
| Income Bracket | # Families | % Families |
| Less than $10,000 | 105 | 1.0% |
| $10,000 to $14,999 | 84 | 0.8% |
| $15,000 to $24,999 | 84 | 0.8% |
| $25,000 to $34,999 | 190 | 1.8% |
| $35,000 to $49,999 | 390 | 3.7% |
| $50,000 to $74,999 | 1,213 | 11.5% |
| $75,000 to $99,999 | 1,224 | 11.6% |
| $100,000 to $149,999 | 3,249 | 30.8% |
| $150,000 to $199,999 | 1,930 | 18.3% |
| $200,000+ | 2,089 | 19.8% |
Family Income by Famaliy Size in Cottage Grove
7+ person families (137 | 1.3%) account for the highest median family income in Cottage Grove with $195,580 per family, while 2-person families (4,014 | 38.1%) have the highest median income of $52,166 per family member.
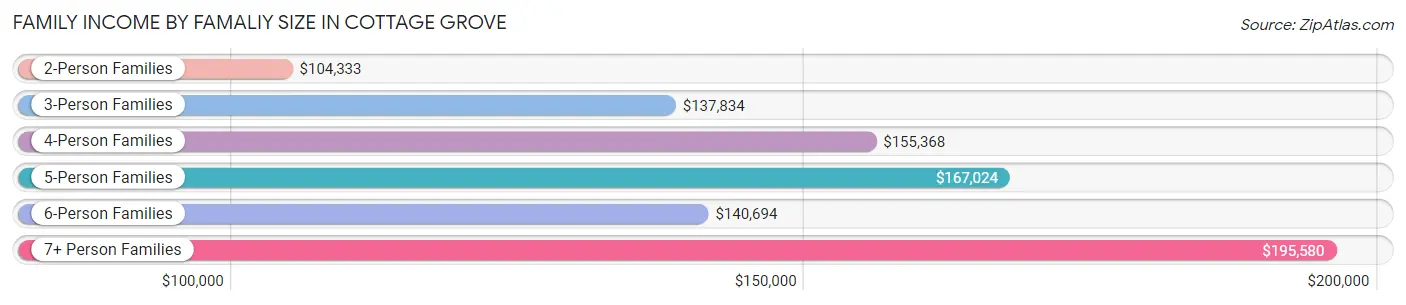
| Income Bracket | # Families | Median Income |
| 2-Person Families | 4,014 (38.1%) | $104,333 |
| 3-Person Families | 2,301 (21.8%) | $137,834 |
| 4-Person Families | 2,805 (26.6%) | $155,368 |
| 5-Person Families | 916 (8.7%) | $167,024 |
| 6-Person Families | 375 (3.6%) | $140,694 |
| 7+ Person Families | 137 (1.3%) | $195,580 |
| Total | 10,548 (100.0%) | $127,091 |
Family Income by Number of Earners in Cottage Grove
The median family income in Cottage Grove is $127,091, with families comprising 3+ earners (2,136) having the highest median family income of $176,775, while families with no earners (1,211) have the lowest median family income of $77,899, accounting for 20.3% and 11.5% of families, respectively.
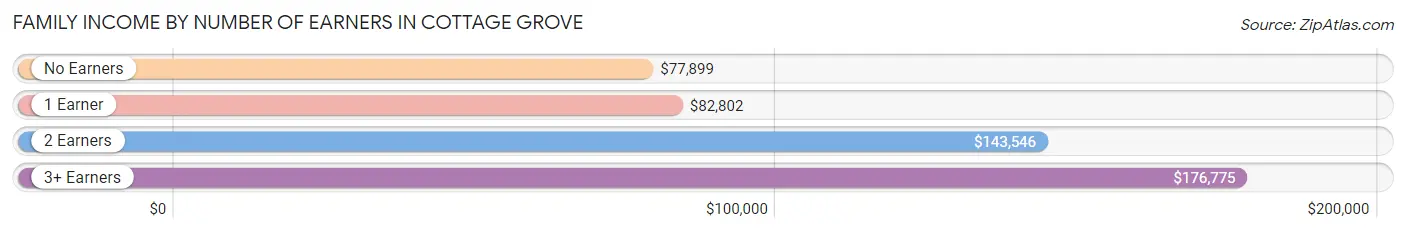
| Number of Earners | # Families | Median Income |
| No Earners | 1,211 (11.5%) | $77,899 |
| 1 Earner | 2,099 (19.9%) | $82,802 |
| 2 Earners | 5,102 (48.4%) | $143,546 |
| 3+ Earners | 2,136 (20.3%) | $176,775 |
| Total | 10,548 (100.0%) | $127,091 |
Household Income in Cottage Grove
Household Income Brackets in Cottage Grove
With 3,839 households falling in the category, the $100,000 to $149,999 income range is the most frequent in Cottage Grove, accounting for 29.1% of all households. In contrast, only 106 households (0.8%) fall into the less than $10,000 income bracket, making it the least populous group.
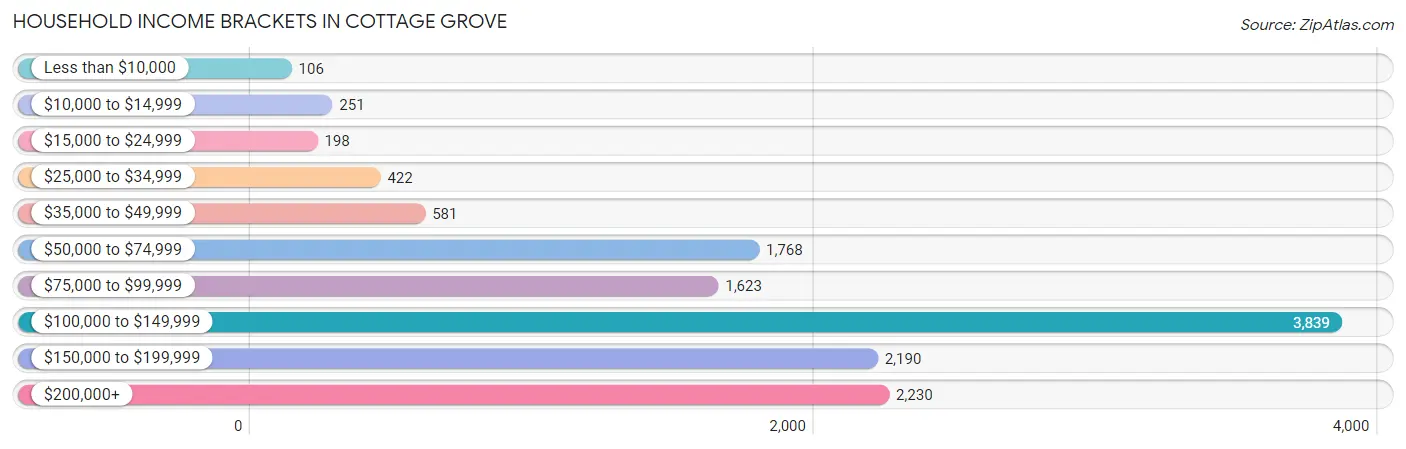
| Income Bracket | # Households | % Households |
| Less than $10,000 | 106 | 0.8% |
| $10,000 to $14,999 | 251 | 1.9% |
| $15,000 to $24,999 | 198 | 1.5% |
| $25,000 to $34,999 | 422 | 3.2% |
| $35,000 to $49,999 | 581 | 4.4% |
| $50,000 to $74,999 | 1,768 | 13.4% |
| $75,000 to $99,999 | 1,623 | 12.3% |
| $100,000 to $149,999 | 3,839 | 29.1% |
| $150,000 to $199,999 | 2,190 | 16.6% |
| $200,000+ | 2,230 | 16.9% |
Household Income by Householder Age in Cottage Grove
The median household income in Cottage Grove is $117,673, with the highest median household income of $136,226 found in the 45 to 64 years age bracket for the primary householder. A total of 5,250 households (39.8%) fall into this category. Meanwhile, the 15 to 24 years age bracket for the primary householder has the lowest median household income of $0, with 98 households (0.7%) in this group.
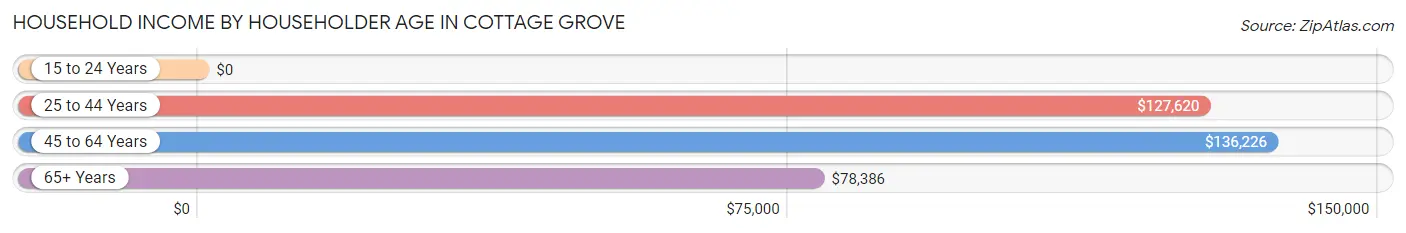
| Income Bracket | # Households | Median Income |
| 15 to 24 Years | 98 (0.7%) | $0 |
| 25 to 44 Years | 5,047 (38.3%) | $127,620 |
| 45 to 64 Years | 5,250 (39.8%) | $136,226 |
| 65+ Years | 2,799 (21.2%) | $78,386 |
| Total | 13,194 (100.0%) | $117,673 |
Poverty in Cottage Grove
Income Below Poverty by Sex and Age in Cottage Grove
With 2.9% poverty level for males and 5.3% for females among the residents of Cottage Grove, 12 to 14 year old males and 75 year old and over females are the most vulnerable to poverty, with 74 males (8.8%) and 129 females (12.2%) in their respective age groups living below the poverty level.
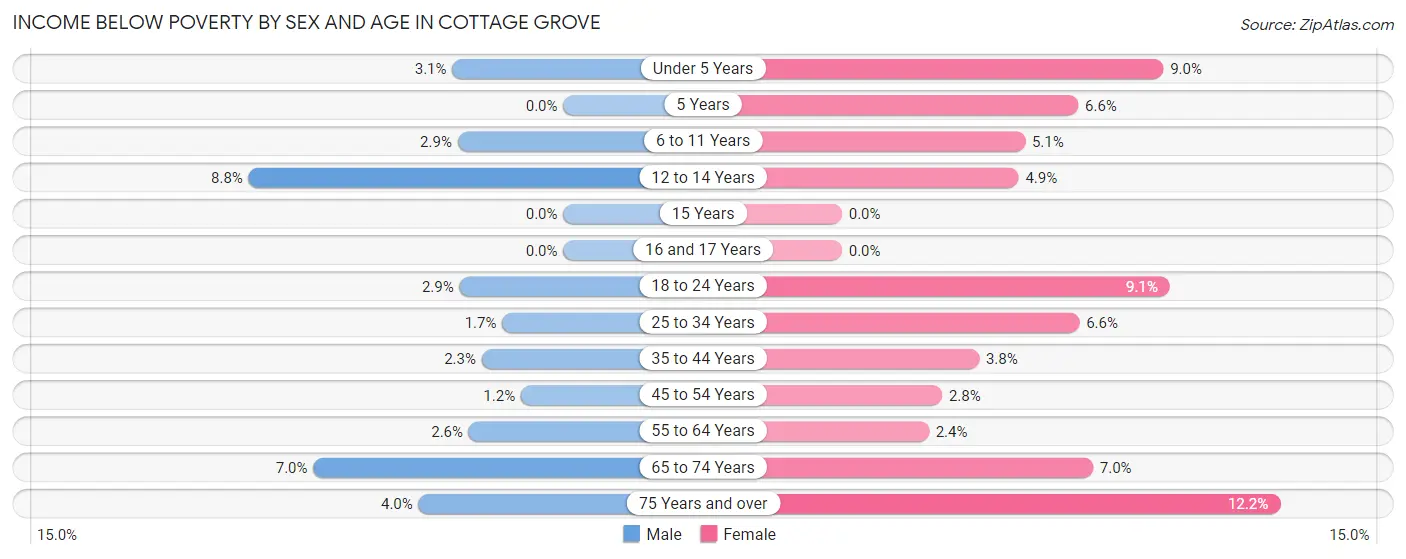
| Age Bracket | Male | Female |
| Under 5 Years | 42 (3.1%) | 111 (8.9%) |
| 5 Years | 0 (0.0%) | 25 (6.6%) |
| 6 to 11 Years | 49 (2.9%) | 93 (5.1%) |
| 12 to 14 Years | 74 (8.8%) | 44 (4.9%) |
| 15 Years | 0 (0.0%) | 0 (0.0%) |
| 16 and 17 Years | 0 (0.0%) | 0 (0.0%) |
| 18 to 24 Years | 41 (2.9%) | 154 (9.1%) |
| 25 to 34 Years | 36 (1.7%) | 148 (6.6%) |
| 35 to 44 Years | 85 (2.3%) | 123 (3.8%) |
| 45 to 54 Years | 28 (1.2%) | 75 (2.8%) |
| 55 to 64 Years | 54 (2.6%) | 55 (2.4%) |
| 65 to 74 Years | 111 (7.0%) | 90 (7.0%) |
| 75 Years and over | 36 (4.0%) | 129 (12.2%) |
| Total | 556 (2.9%) | 1,047 (5.3%) |
Income Above Poverty by Sex and Age in Cottage Grove
According to the poverty statistics in Cottage Grove, males aged 5 years and females aged 15 years are the age groups that are most secure financially, with 100.0% of males and 100.0% of females in these age groups living above the poverty line.
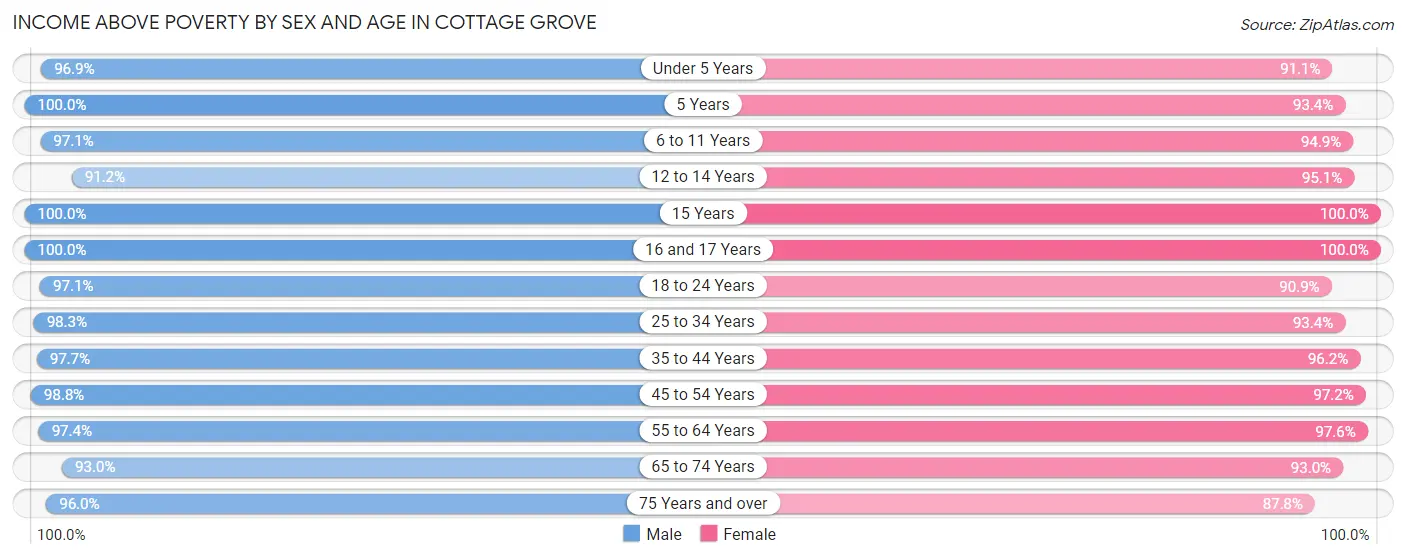
| Age Bracket | Male | Female |
| Under 5 Years | 1,319 (96.9%) | 1,129 (91.0%) |
| 5 Years | 422 (100.0%) | 355 (93.4%) |
| 6 to 11 Years | 1,617 (97.1%) | 1,732 (94.9%) |
| 12 to 14 Years | 771 (91.2%) | 851 (95.1%) |
| 15 Years | 211 (100.0%) | 332 (100.0%) |
| 16 and 17 Years | 493 (100.0%) | 755 (100.0%) |
| 18 to 24 Years | 1,380 (97.1%) | 1,533 (90.9%) |
| 25 to 34 Years | 2,087 (98.3%) | 2,092 (93.4%) |
| 35 to 44 Years | 3,661 (97.7%) | 3,094 (96.2%) |
| 45 to 54 Years | 2,337 (98.8%) | 2,615 (97.2%) |
| 55 to 64 Years | 1,998 (97.4%) | 2,216 (97.6%) |
| 65 to 74 Years | 1,484 (93.0%) | 1,198 (93.0%) |
| 75 Years and over | 858 (96.0%) | 928 (87.8%) |
| Total | 18,638 (97.1%) | 18,830 (94.7%) |
Income Below Poverty Among Married-Couple Families in Cottage Grove
The poverty statistics for married-couple families in Cottage Grove show that 2.1% or 182 of the total 8,719 families live below the poverty line. Families with 1 or 2 children have the highest poverty rate of 2.4%, comprising of 77 families. On the other hand, families with 5 or more children have the lowest poverty rate of 0.0%, which includes 0 families.
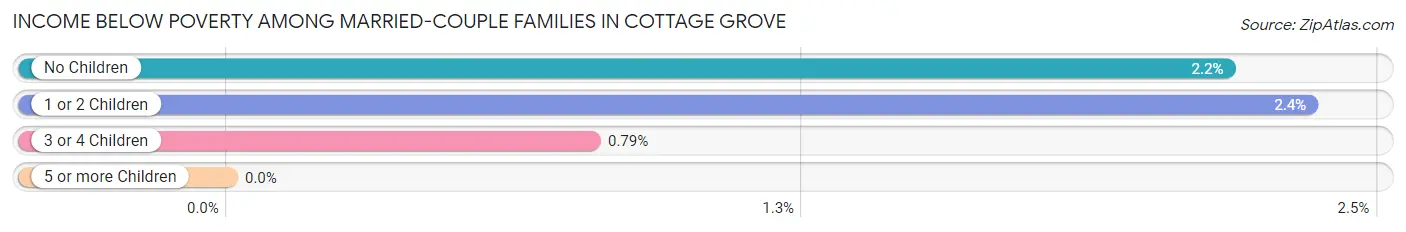
| Children | Above Poverty | Below Poverty |
| No Children | 4,428 (97.8%) | 98 (2.2%) |
| 1 or 2 Children | 3,201 (97.7%) | 77 (2.4%) |
| 3 or 4 Children | 882 (99.2%) | 7 (0.8%) |
| 5 or more Children | 26 (100.0%) | 0 (0.0%) |
| Total | 8,537 (97.9%) | 182 (2.1%) |
Income Below Poverty Among Single-Parent Households in Cottage Grove
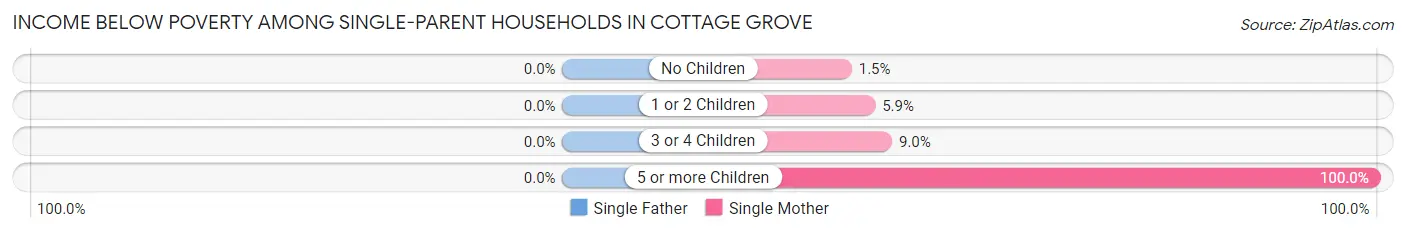
| Children | Single Father | Single Mother |
| No Children | 0 (0.0%) | 6 (1.5%) |
| 1 or 2 Children | 0 (0.0%) | 33 (5.9%) |
| 3 or 4 Children | 0 (0.0%) | 10 (9.0%) |
| 5 or more Children | 0 (0.0%) | 32 (100.0%) |
| Total | 0 (0.0%) | 81 (7.3%) |
Income Below Poverty Among Married-Couple vs Single-Parent Households in Cottage Grove
The poverty data for Cottage Grove shows that 182 of the married-couple family households (2.1%) and 81 of the single-parent households (4.4%) are living below the poverty level. Within the married-couple family households, those with 1 or 2 children have the highest poverty rate, with 77 households (2.4%) falling below the poverty line. Among the single-parent households, those with 5 or more children have the highest poverty rate, with 32 household (100.0%) living below poverty.
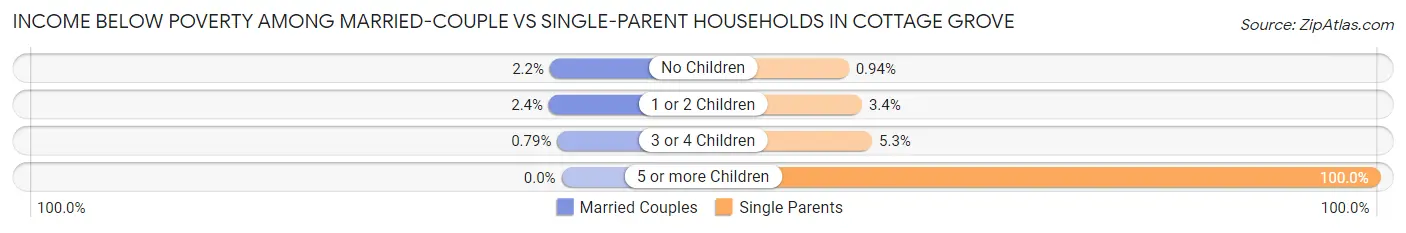
| Children | Married-Couple Families | Single-Parent Households |
| No Children | 98 (2.2%) | 6 (0.9%) |
| 1 or 2 Children | 77 (2.4%) | 33 (3.4%) |
| 3 or 4 Children | 7 (0.8%) | 10 (5.3%) |
| 5 or more Children | 0 (0.0%) | 32 (100.0%) |
| Total | 182 (2.1%) | 81 (4.4%) |
Employment Characteristics in Cottage Grove
Employment by Class of Employer in Cottage Grove
Among the 20,930 employed individuals in Cottage Grove, private company employees (13,574 | 64.8%), not-for-profit organizations (2,611 | 12.5%), and local government employees (1,996 | 9.5%) make up the most common classes of employment.
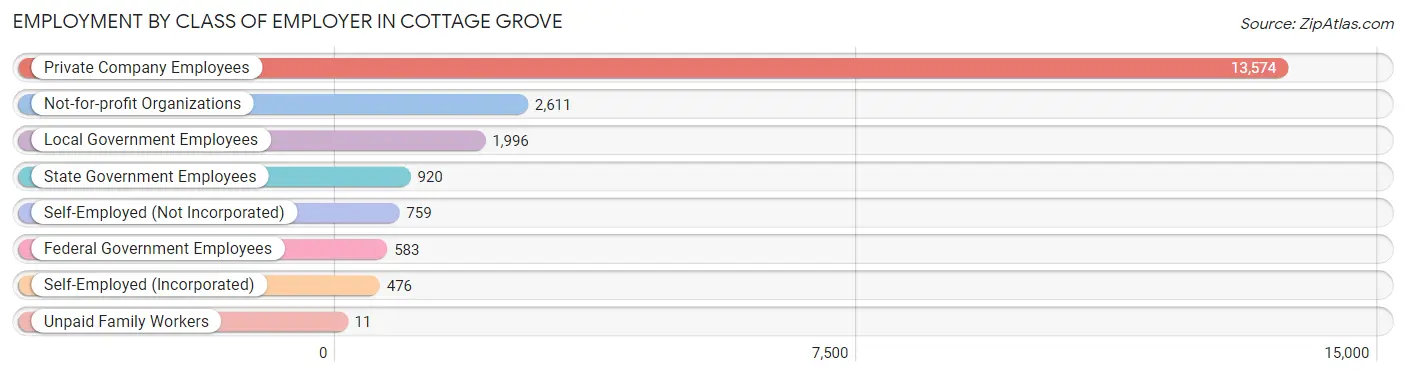
| Employer Class | # Employees | % Employees |
| Private Company Employees | 13,574 | 64.8% |
| Self-Employed (Incorporated) | 476 | 2.3% |
| Self-Employed (Not Incorporated) | 759 | 3.6% |
| Not-for-profit Organizations | 2,611 | 12.5% |
| Local Government Employees | 1,996 | 9.5% |
| State Government Employees | 920 | 4.4% |
| Federal Government Employees | 583 | 2.8% |
| Unpaid Family Workers | 11 | 0.1% |
| Total | 20,930 | 100.0% |
Employment Status by Age in Cottage Grove
According to the labor force statistics for Cottage Grove, out of the total population over 16 years of age (29,928), 73.5% or 21,997 individuals are in the labor force, with 2.7% or 594 of them unemployed. The age group with the highest labor force participation rate is 35 to 44 years, with 94.1% or 6,553 individuals in the labor force. Within the labor force, the 20 to 24 years age range has the highest percentage of unemployed individuals, with 10.5% or 168 of them being unemployed.
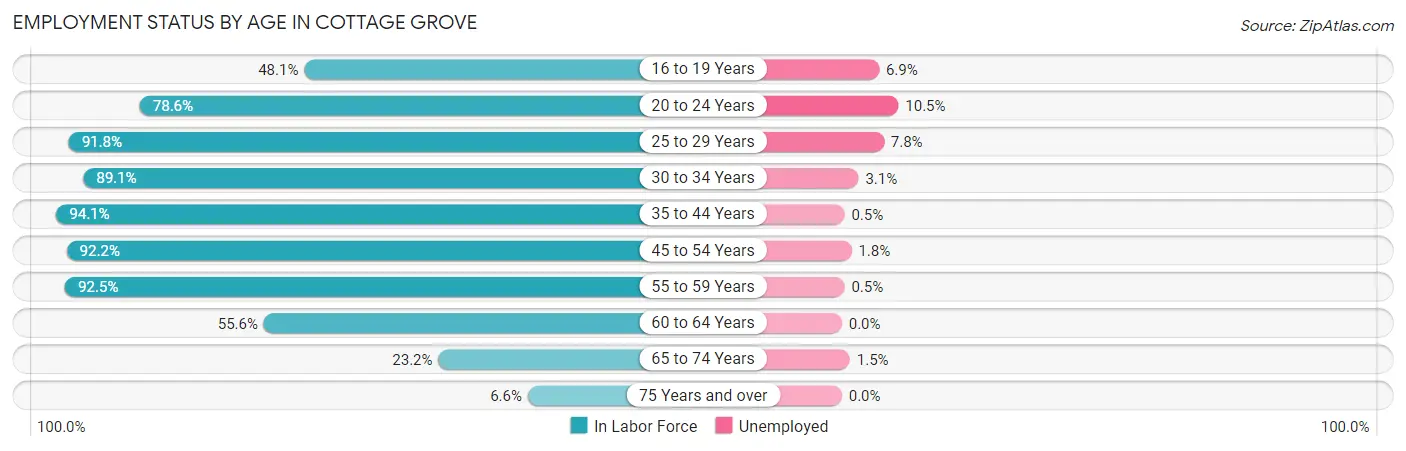
| Age Bracket | In Labor Force | Unemployed |
| 16 to 19 Years | 1,114 (48.1%) | 77 (6.9%) |
| 20 to 24 Years | 1,604 (78.6%) | 168 (10.5%) |
| 25 to 29 Years | 2,048 (91.8%) | 160 (7.8%) |
| 30 to 34 Years | 1,900 (89.1%) | 59 (3.1%) |
| 35 to 44 Years | 6,553 (94.1%) | 33 (0.5%) |
| 45 to 54 Years | 4,661 (92.2%) | 84 (1.8%) |
| 55 to 59 Years | 2,308 (92.5%) | 12 (0.5%) |
| 60 to 64 Years | 1,019 (55.6%) | 0 (0.0%) |
| 65 to 74 Years | 669 (23.2%) | 10 (1.5%) |
| 75 Years and over | 131 (6.6%) | 0 (0.0%) |
| Total | 21,997 (73.5%) | 594 (2.7%) |
Employment Status by Educational Attainment in Cottage Grove
According to labor force statistics for Cottage Grove, 89.3% of individuals (18,493) out of the total population between 25 and 64 years of age (20,709) are in the labor force, with 1.9% or 351 of them being unemployed. The group with the highest labor force participation rate are those with the educational attainment of bachelor's degree or higher, with 93.9% or 7,944 individuals in the labor force. Within the labor force, individuals with less than high school education have the highest percentage of unemployment, with 3.1% or 20 of them being unemployed.
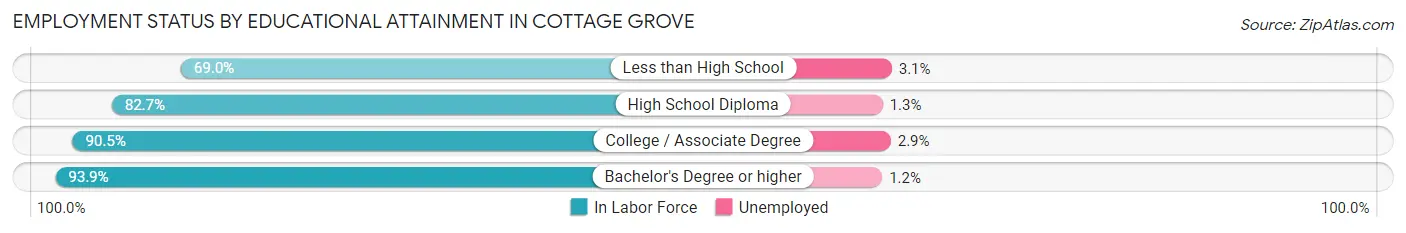
| Educational Attainment | In Labor Force | Unemployed |
| Less than High School | 637 (69.0%) | 29 (3.1%) |
| High School Diploma | 3,593 (82.7%) | 56 (1.3%) |
| College / Associate Degree | 6,318 (90.5%) | 202 (2.9%) |
| Bachelor's Degree or higher | 7,944 (93.9%) | 102 (1.2%) |
| Total | 18,493 (89.3%) | 393 (1.9%) |
Employment Occupations by Sex in Cottage Grove
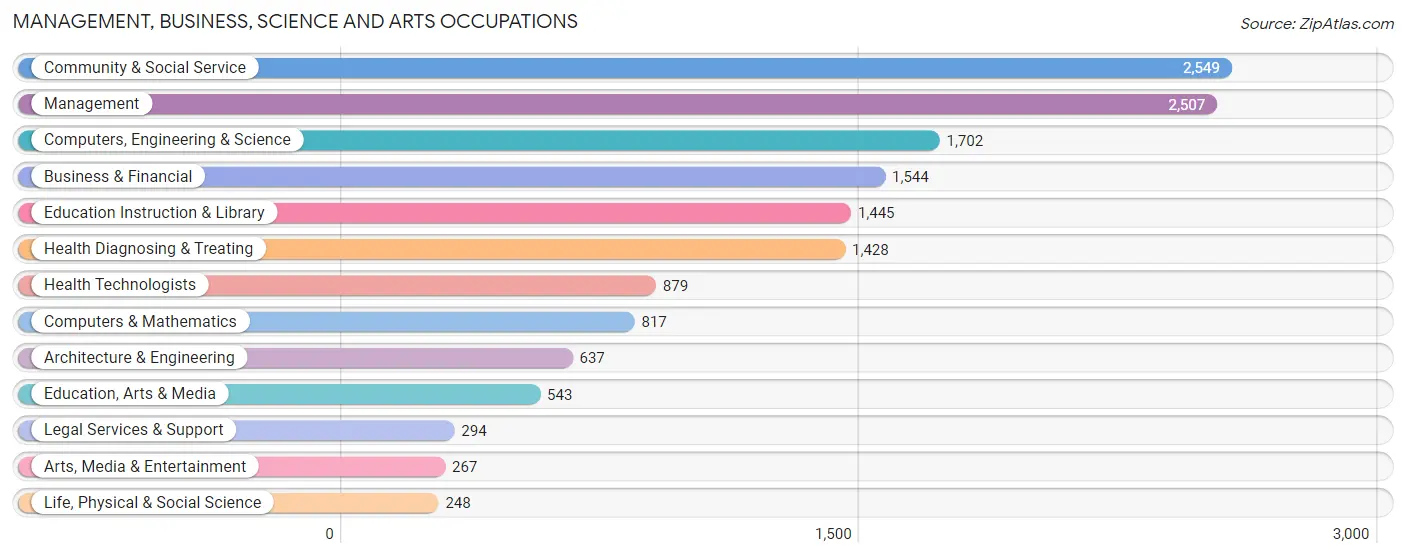
Management, Business, Science and Arts Occupations
The most common Management, Business, Science and Arts occupations in Cottage Grove are Community & Social Service (2,549 | 11.9%), Management (2,507 | 11.8%), Computers, Engineering & Science (1,702 | 8.0%), Business & Financial (1,544 | 7.2%), and Education Instruction & Library (1,445 | 6.8%).
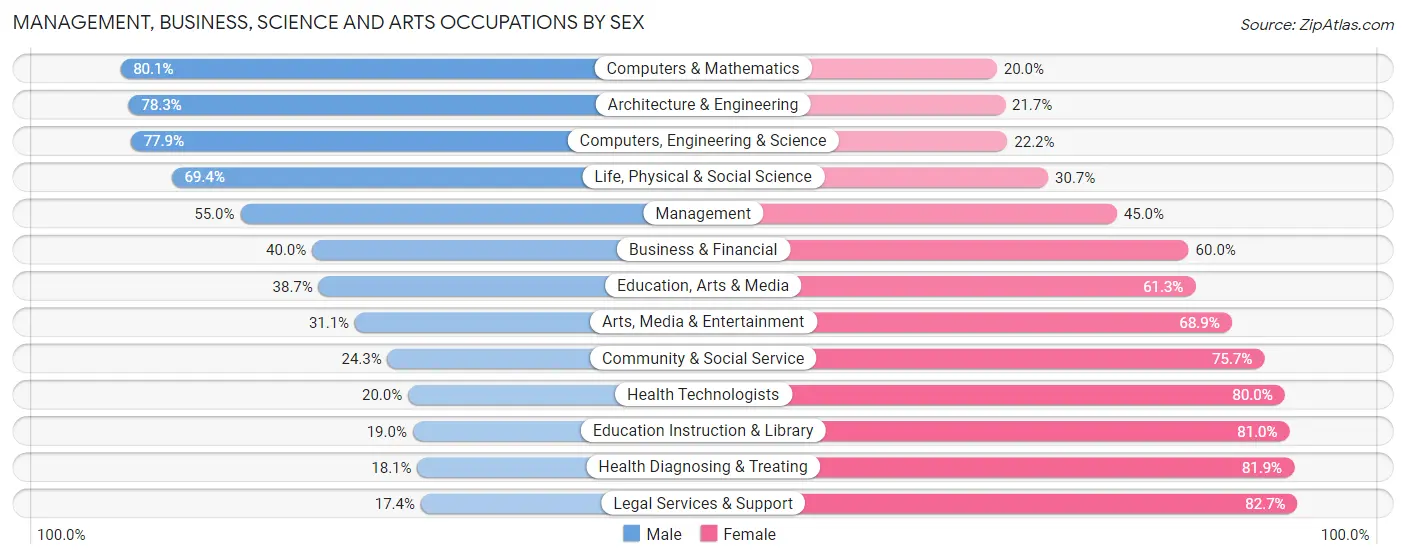
Management, Business, Science and Arts Occupations by Sex
Within the Management, Business, Science and Arts occupations in Cottage Grove, the most male-oriented occupations are Computers & Mathematics (80.0%), Architecture & Engineering (78.3%), and Computers, Engineering & Science (77.8%), while the most female-oriented occupations are Legal Services & Support (82.7%), Health Diagnosing & Treating (81.9%), and Education Instruction & Library (81.0%).
| Occupation | Male | Female |
| Management | 1,379 (55.0%) | 1,128 (45.0%) |
| Business & Financial | 618 (40.0%) | 926 (60.0%) |
| Computers, Engineering & Science | 1,325 (77.8%) | 377 (22.2%) |
| Computers & Mathematics | 654 (80.0%) | 163 (20.0%) |
| Architecture & Engineering | 499 (78.3%) | 138 (21.7%) |
| Life, Physical & Social Science | 172 (69.4%) | 76 (30.6%) |
| Community & Social Service | 619 (24.3%) | 1,930 (75.7%) |
| Education, Arts & Media | 210 (38.7%) | 333 (61.3%) |
| Legal Services & Support | 51 (17.3%) | 243 (82.7%) |
| Education Instruction & Library | 275 (19.0%) | 1,170 (81.0%) |
| Arts, Media & Entertainment | 83 (31.1%) | 184 (68.9%) |
| Health Diagnosing & Treating | 258 (18.1%) | 1,170 (81.9%) |
| Health Technologists | 176 (20.0%) | 703 (80.0%) |
| Total (Category) | 4,199 (43.2%) | 5,531 (56.8%) |
| Total (Overall) | 10,779 (50.5%) | 10,543 (49.4%) |
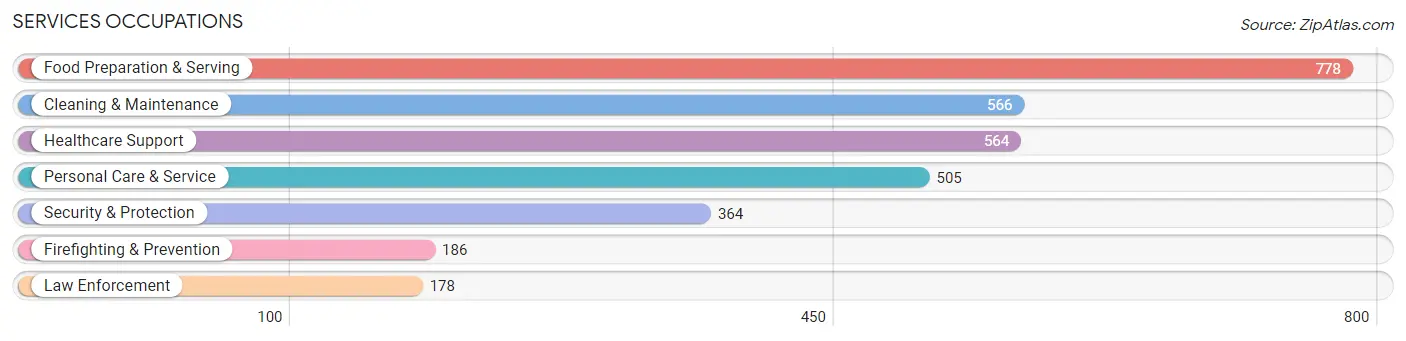
Services Occupations
The most common Services occupations in Cottage Grove are Food Preparation & Serving (778 | 3.6%), Cleaning & Maintenance (566 | 2.6%), Healthcare Support (564 | 2.6%), Personal Care & Service (505 | 2.4%), and Security & Protection (364 | 1.7%).
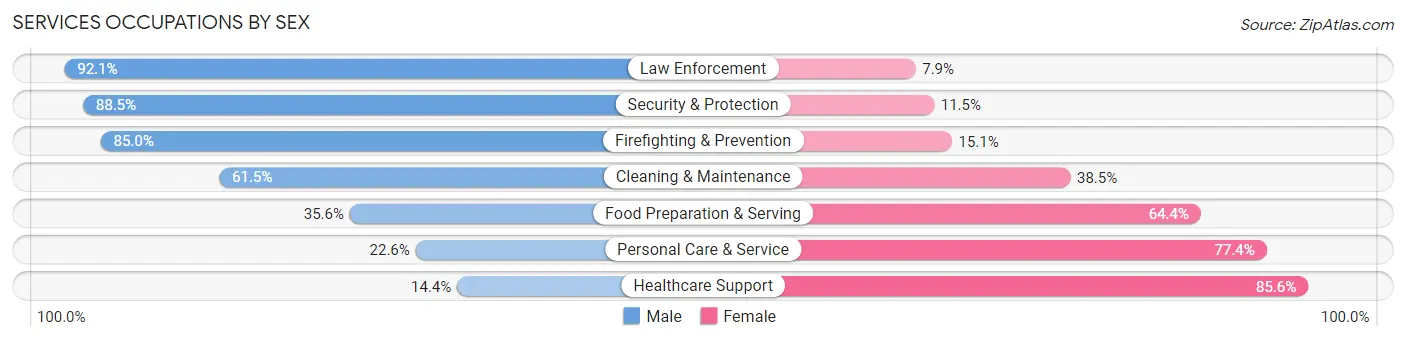
Services Occupations by Sex
Within the Services occupations in Cottage Grove, the most male-oriented occupations are Law Enforcement (92.1%), Security & Protection (88.5%), and Firefighting & Prevention (85.0%), while the most female-oriented occupations are Healthcare Support (85.6%), Personal Care & Service (77.4%), and Food Preparation & Serving (64.4%).
| Occupation | Male | Female |
| Healthcare Support | 81 (14.4%) | 483 (85.6%) |
| Security & Protection | 322 (88.5%) | 42 (11.5%) |
| Firefighting & Prevention | 158 (85.0%) | 28 (15.0%) |
| Law Enforcement | 164 (92.1%) | 14 (7.9%) |
| Food Preparation & Serving | 277 (35.6%) | 501 (64.4%) |
| Cleaning & Maintenance | 348 (61.5%) | 218 (38.5%) |
| Personal Care & Service | 114 (22.6%) | 391 (77.4%) |
| Total (Category) | 1,142 (41.1%) | 1,635 (58.9%) |
| Total (Overall) | 10,779 (50.5%) | 10,543 (49.4%) |
Sales and Office Occupations
The most common Sales and Office occupations in Cottage Grove are Office & Administration (2,573 | 12.1%), and Sales & Related (2,099 | 9.8%).

Sales and Office Occupations by Sex
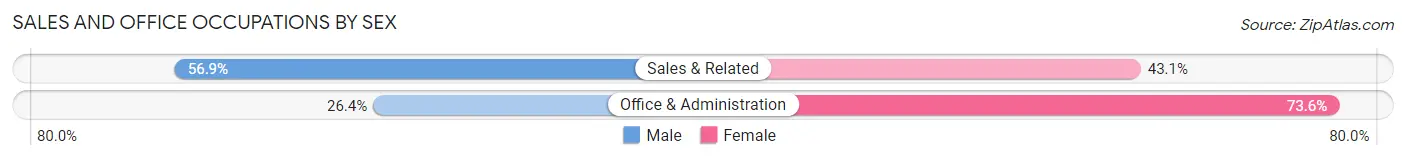
| Occupation | Male | Female |
| Sales & Related | 1,194 (56.9%) | 905 (43.1%) |
| Office & Administration | 679 (26.4%) | 1,894 (73.6%) |
| Total (Category) | 1,873 (40.1%) | 2,799 (59.9%) |
| Total (Overall) | 10,779 (50.5%) | 10,543 (49.4%) |
Natural Resources, Construction and Maintenance Occupations
The most common Natural Resources, Construction and Maintenance occupations in Cottage Grove are Construction & Extraction (831 | 3.9%), Installation, Maintenance & Repair (691 | 3.2%), and Farming, Fishing & Forestry (41 | 0.2%).

Natural Resources, Construction and Maintenance Occupations by Sex

| Occupation | Male | Female |
| Farming, Fishing & Forestry | 34 (82.9%) | 7 (17.1%) |
| Construction & Extraction | 802 (96.5%) | 29 (3.5%) |
| Installation, Maintenance & Repair | 691 (100.0%) | 0 (0.0%) |
| Total (Category) | 1,527 (97.7%) | 36 (2.3%) |
| Total (Overall) | 10,779 (50.5%) | 10,543 (49.4%) |
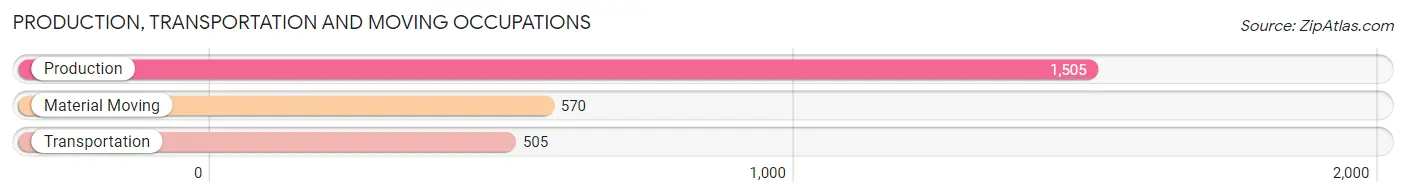
Production, Transportation and Moving Occupations
The most common Production, Transportation and Moving occupations in Cottage Grove are Production (1,505 | 7.1%), Material Moving (570 | 2.7%), and Transportation (505 | 2.4%).
Production, Transportation and Moving Occupations by Sex
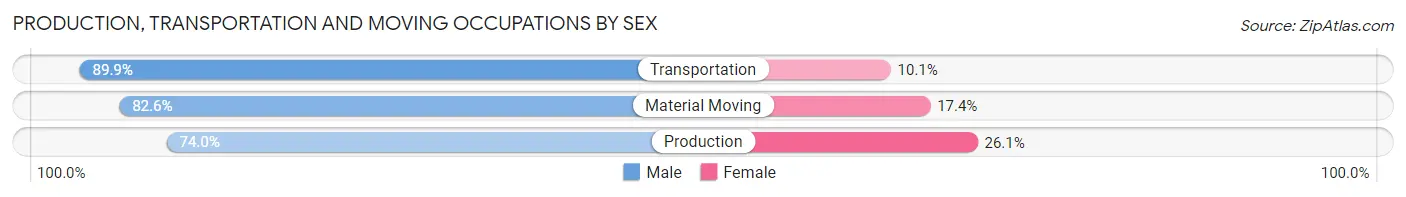
| Occupation | Male | Female |
| Production | 1,113 (74.0%) | 392 (26.1%) |
| Transportation | 454 (89.9%) | 51 (10.1%) |
| Material Moving | 471 (82.6%) | 99 (17.4%) |
| Total (Category) | 2,038 (79.0%) | 542 (21.0%) |
| Total (Overall) | 10,779 (50.5%) | 10,543 (49.4%) |
Employment Industries by Sex in Cottage Grove
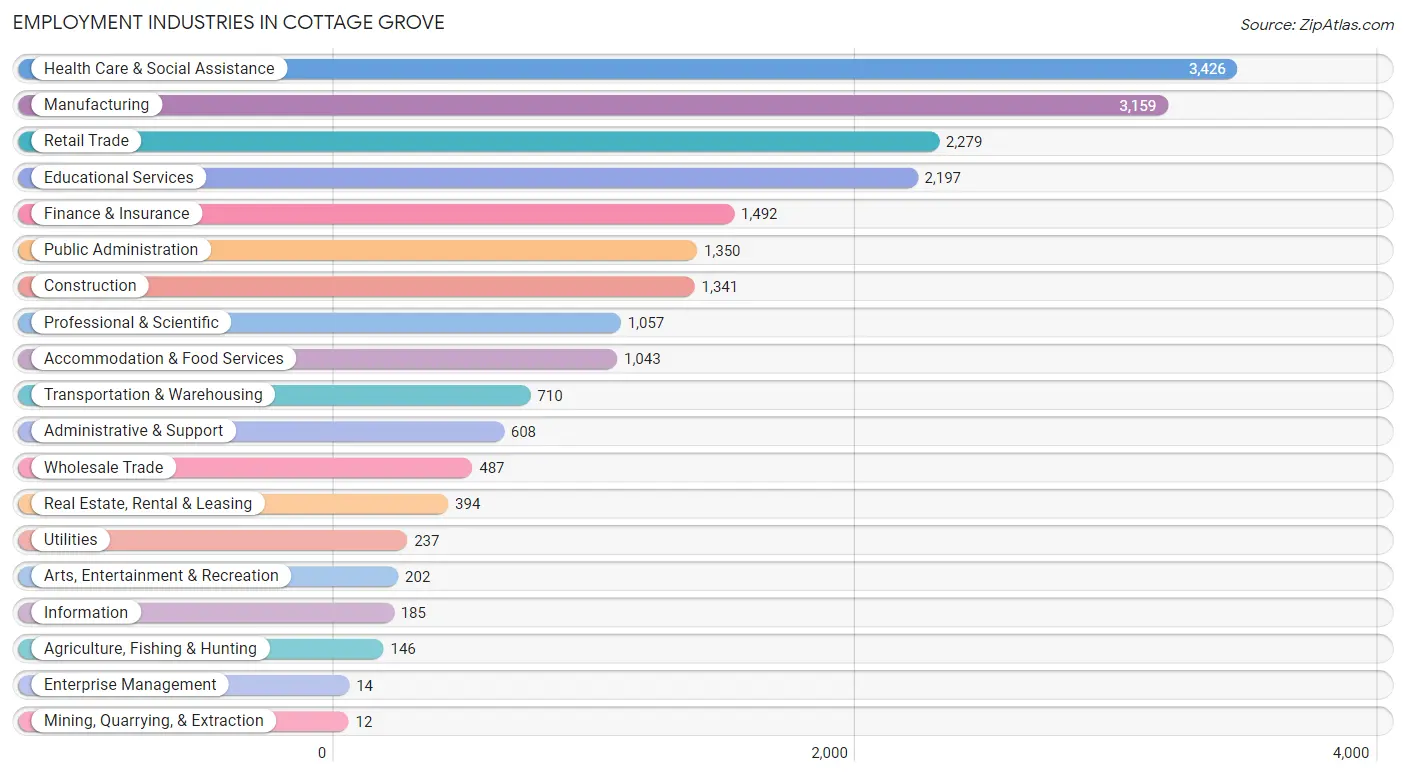
Employment Industries in Cottage Grove
The major employment industries in Cottage Grove include Health Care & Social Assistance (3,426 | 16.1%), Manufacturing (3,159 | 14.8%), Retail Trade (2,279 | 10.7%), Educational Services (2,197 | 10.3%), and Finance & Insurance (1,492 | 7.0%).
Employment Industries by Sex in Cottage Grove
The Cottage Grove industries that see more men than women are Mining, Quarrying, & Extraction (100.0%), Enterprise Management (100.0%), and Transportation & Warehousing (85.4%), whereas the industries that tend to have a higher number of women are Health Care & Social Assistance (81.2%), Educational Services (80.2%), and Real Estate, Rental & Leasing (61.9%).
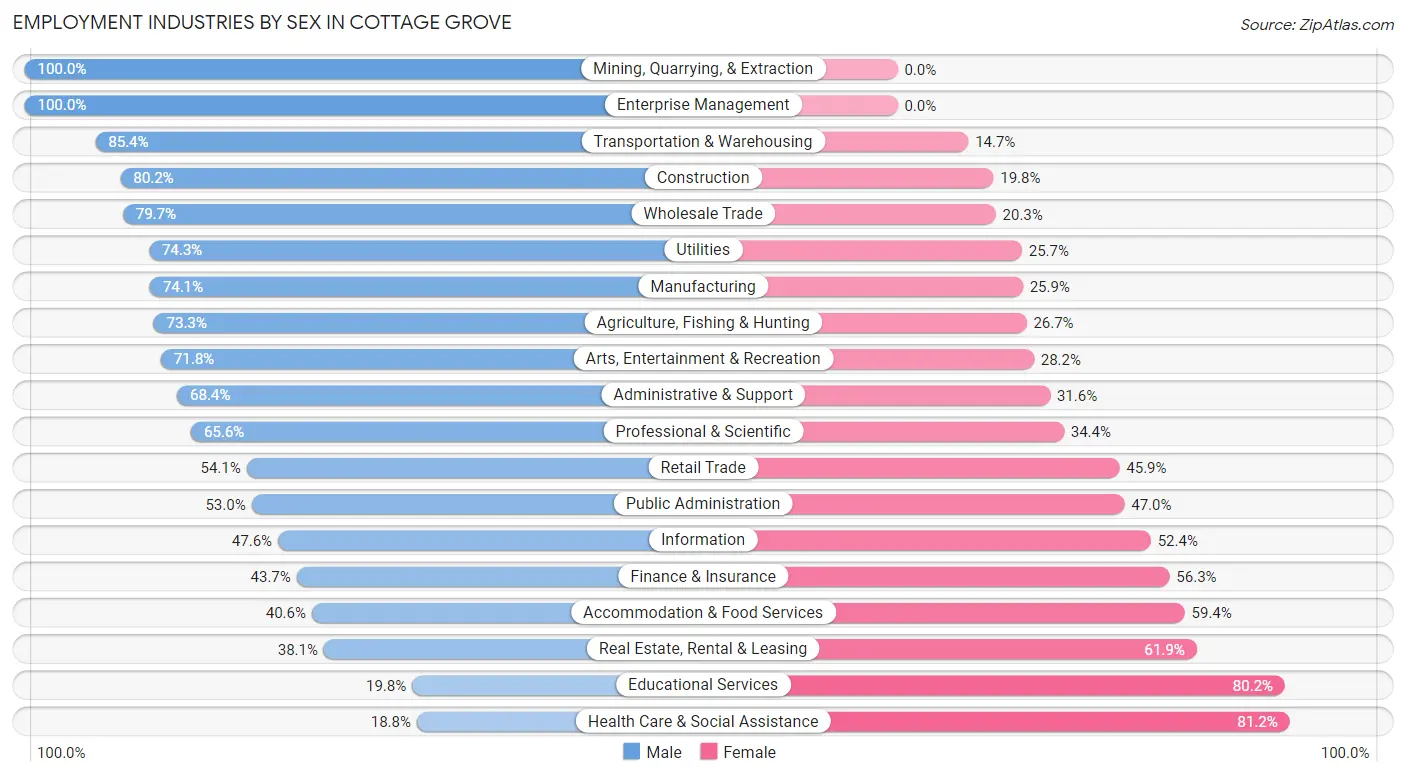
| Industry | Male | Female |
| Agriculture, Fishing & Hunting | 107 (73.3%) | 39 (26.7%) |
| Mining, Quarrying, & Extraction | 12 (100.0%) | 0 (0.0%) |
| Construction | 1,075 (80.2%) | 266 (19.8%) |
| Manufacturing | 2,340 (74.1%) | 819 (25.9%) |
| Wholesale Trade | 388 (79.7%) | 99 (20.3%) |
| Retail Trade | 1,232 (54.1%) | 1,047 (45.9%) |
| Transportation & Warehousing | 606 (85.4%) | 104 (14.6%) |
| Utilities | 176 (74.3%) | 61 (25.7%) |
| Information | 88 (47.6%) | 97 (52.4%) |
| Finance & Insurance | 652 (43.7%) | 840 (56.3%) |
| Real Estate, Rental & Leasing | 150 (38.1%) | 244 (61.9%) |
| Professional & Scientific | 693 (65.6%) | 364 (34.4%) |
| Enterprise Management | 14 (100.0%) | 0 (0.0%) |
| Administrative & Support | 416 (68.4%) | 192 (31.6%) |
| Educational Services | 435 (19.8%) | 1,762 (80.2%) |
| Health Care & Social Assistance | 645 (18.8%) | 2,781 (81.2%) |
| Arts, Entertainment & Recreation | 145 (71.8%) | 57 (28.2%) |
| Accommodation & Food Services | 423 (40.6%) | 620 (59.4%) |
| Public Administration | 716 (53.0%) | 634 (47.0%) |
| Total | 10,779 (50.5%) | 10,543 (49.4%) |
Education in Cottage Grove
School Enrollment in Cottage Grove
The most common levels of schooling among the 10,347 students in Cottage Grove are middle school (2,560 | 24.7%), high school (2,445 | 23.6%), and elementary school (2,117 | 20.5%).
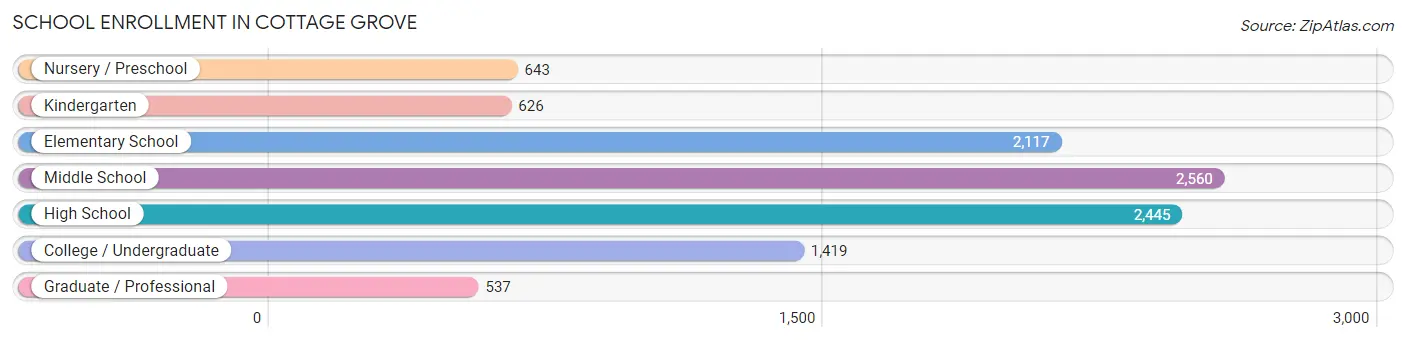
| School Level | # Students | % Students |
| Nursery / Preschool | 643 | 6.2% |
| Kindergarten | 626 | 6.0% |
| Elementary School | 2,117 | 20.5% |
| Middle School | 2,560 | 24.7% |
| High School | 2,445 | 23.6% |
| College / Undergraduate | 1,419 | 13.7% |
| Graduate / Professional | 537 | 5.2% |
| Total | 10,347 | 100.0% |
School Enrollment by Age by Funding Source in Cottage Grove
Out of a total of 10,347 students who are enrolled in schools in Cottage Grove, 1,418 (13.7%) attend a private institution, while the remaining 8,929 (86.3%) are enrolled in public schools. The age group of 35 years and over has the highest likelihood of being enrolled in private schools, with 247 (43.2% in the age bracket) enrolled. Conversely, the age group of 10 to 14 year olds has the lowest likelihood of being enrolled in a private school, with 2,854 (93.1% in the age bracket) attending a public institution.
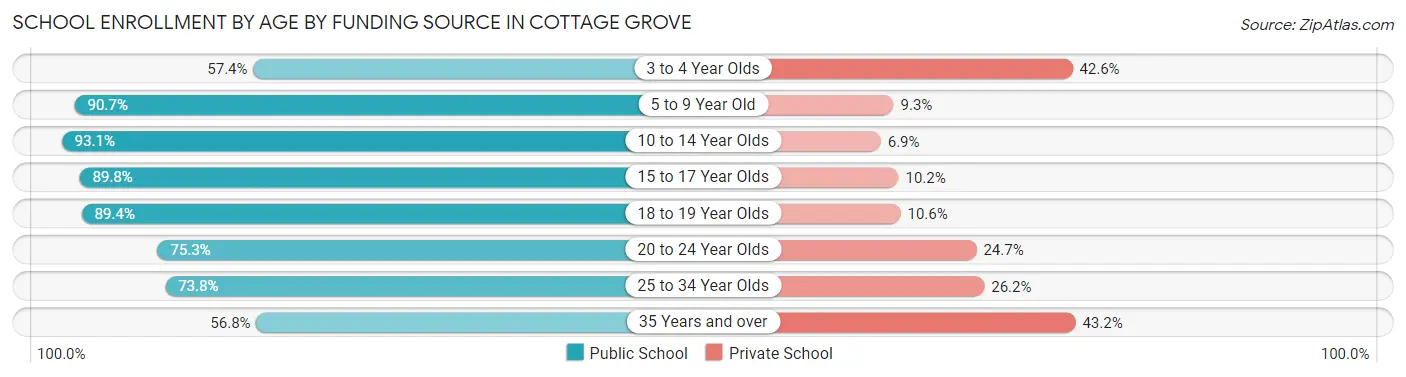
| Age Bracket | Public School | Private School |
| 3 to 4 Year Olds | 268 (57.4%) | 199 (42.6%) |
| 5 to 9 Year Old | 2,410 (90.7%) | 247 (9.3%) |
| 10 to 14 Year Olds | 2,854 (93.1%) | 212 (6.9%) |
| 15 to 17 Year Olds | 1,599 (89.8%) | 182 (10.2%) |
| 18 to 19 Year Olds | 751 (89.4%) | 89 (10.6%) |
| 20 to 24 Year Olds | 441 (75.3%) | 145 (24.7%) |
| 25 to 34 Year Olds | 279 (73.8%) | 99 (26.2%) |
| 35 Years and over | 325 (56.8%) | 247 (43.2%) |
| Total | 8,929 (86.3%) | 1,418 (13.7%) |
Educational Attainment by Field of Study in Cottage Grove
Business (2,391 | 21.8%), education (1,522 | 13.9%), science & technology (1,187 | 10.8%), arts & humanities (935 | 8.5%), and social sciences (776 | 7.1%) are the most common fields of study among 10,964 individuals in Cottage Grove who have obtained a bachelor's degree or higher.
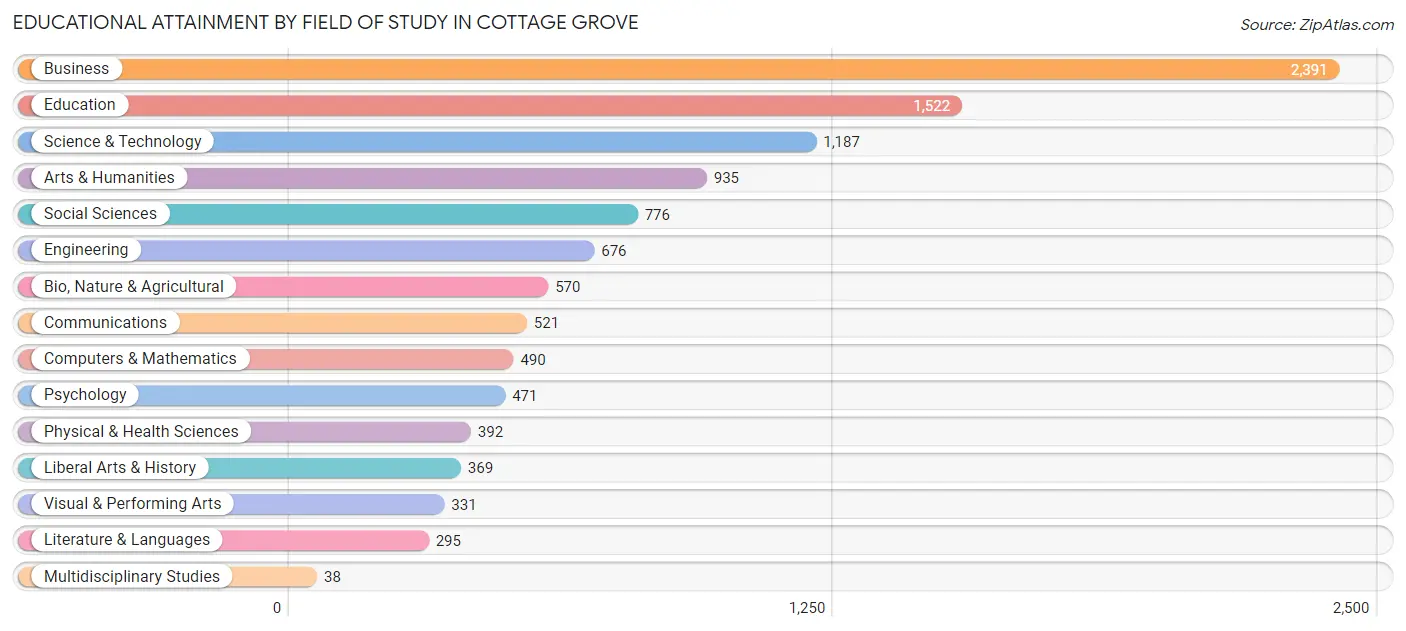
| Field of Study | # Graduates | % Graduates |
| Computers & Mathematics | 490 | 4.5% |
| Bio, Nature & Agricultural | 570 | 5.2% |
| Physical & Health Sciences | 392 | 3.6% |
| Psychology | 471 | 4.3% |
| Social Sciences | 776 | 7.1% |
| Engineering | 676 | 6.2% |
| Multidisciplinary Studies | 38 | 0.4% |
| Science & Technology | 1,187 | 10.8% |
| Business | 2,391 | 21.8% |
| Education | 1,522 | 13.9% |
| Literature & Languages | 295 | 2.7% |
| Liberal Arts & History | 369 | 3.4% |
| Visual & Performing Arts | 331 | 3.0% |
| Communications | 521 | 4.8% |
| Arts & Humanities | 935 | 8.5% |
| Total | 10,964 | 100.0% |
Transportation & Commute in Cottage Grove
Vehicle Availability by Sex in Cottage Grove
The most prevalent vehicle ownership categories in Cottage Grove are males with 2 vehicles (4,898, accounting for 45.7%) and females with 2 vehicles (4,764, making up 48.0%).
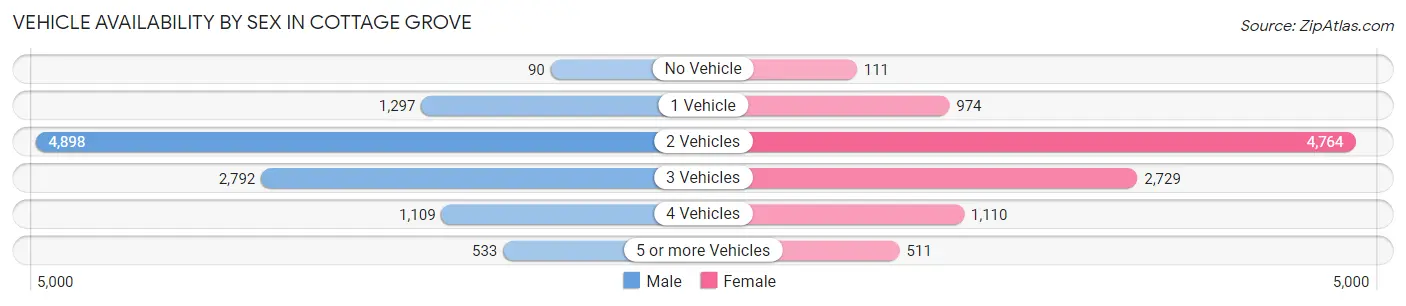
| Vehicles Available | Male | Female |
| No Vehicle | 90 (0.8%) | 111 (1.1%) |
| 1 Vehicle | 1,297 (12.1%) | 974 (9.6%) |
| 2 Vehicles | 4,898 (45.7%) | 4,764 (46.7%) |
| 3 Vehicles | 2,792 (26.1%) | 2,729 (26.8%) |
| 4 Vehicles | 1,109 (10.3%) | 1,110 (10.9%) |
| 5 or more Vehicles | 533 (5.0%) | 511 (5.0%) |
| Total | 10,719 (100.0%) | 10,199 (100.0%) |
Commute Time in Cottage Grove
The most frequently occuring commute durations in Cottage Grove are 30 to 34 minutes (2,855 commuters, 16.2%), 20 to 24 minutes (2,770 commuters, 15.7%), and 25 to 29 minutes (2,073 commuters, 11.8%).
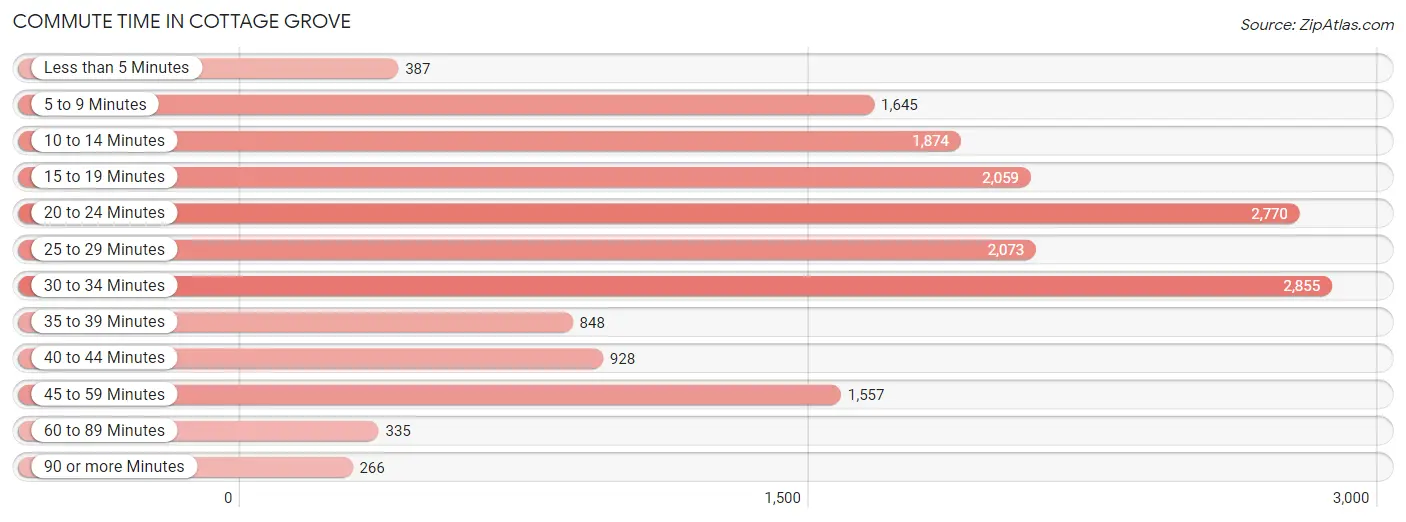
| Commute Time | # Commuters | % Commuters |
| Less than 5 Minutes | 387 | 2.2% |
| 5 to 9 Minutes | 1,645 | 9.3% |
| 10 to 14 Minutes | 1,874 | 10.6% |
| 15 to 19 Minutes | 2,059 | 11.7% |
| 20 to 24 Minutes | 2,770 | 15.7% |
| 25 to 29 Minutes | 2,073 | 11.8% |
| 30 to 34 Minutes | 2,855 | 16.2% |
| 35 to 39 Minutes | 848 | 4.8% |
| 40 to 44 Minutes | 928 | 5.3% |
| 45 to 59 Minutes | 1,557 | 8.8% |
| 60 to 89 Minutes | 335 | 1.9% |
| 90 or more Minutes | 266 | 1.5% |
Commute Time by Sex in Cottage Grove
The most common commute times in Cottage Grove are 30 to 34 minutes (1,649 commuters, 17.9%) for males and 20 to 24 minutes (1,585 commuters, 18.9%) for females.
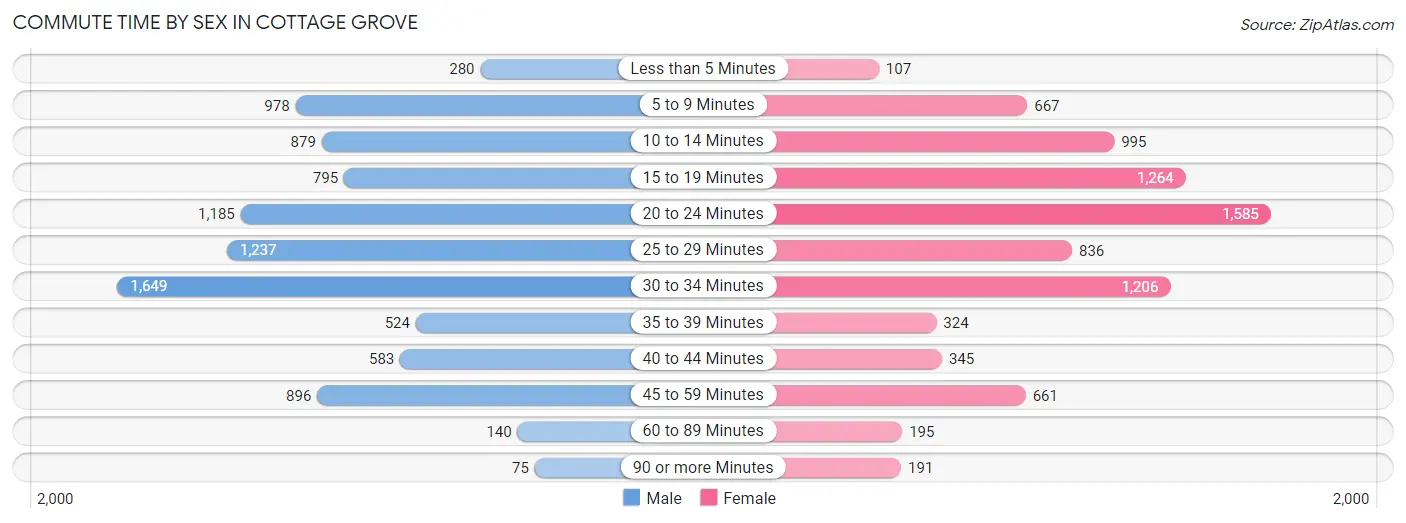
| Commute Time | Male | Female |
| Less than 5 Minutes | 280 (3.0%) | 107 (1.3%) |
| 5 to 9 Minutes | 978 (10.6%) | 667 (8.0%) |
| 10 to 14 Minutes | 879 (9.5%) | 995 (11.9%) |
| 15 to 19 Minutes | 795 (8.6%) | 1,264 (15.1%) |
| 20 to 24 Minutes | 1,185 (12.9%) | 1,585 (18.9%) |
| 25 to 29 Minutes | 1,237 (13.4%) | 836 (10.0%) |
| 30 to 34 Minutes | 1,649 (17.9%) | 1,206 (14.4%) |
| 35 to 39 Minutes | 524 (5.7%) | 324 (3.9%) |
| 40 to 44 Minutes | 583 (6.3%) | 345 (4.1%) |
| 45 to 59 Minutes | 896 (9.7%) | 661 (7.9%) |
| 60 to 89 Minutes | 140 (1.5%) | 195 (2.3%) |
| 90 or more Minutes | 75 (0.8%) | 191 (2.3%) |
Time of Departure to Work by Sex in Cottage Grove
The most frequent times of departure to work in Cottage Grove are 6:30 AM to 6:59 AM (1,362, 14.8%) for males and 7:00 AM to 7:29 AM (1,769, 21.1%) for females.
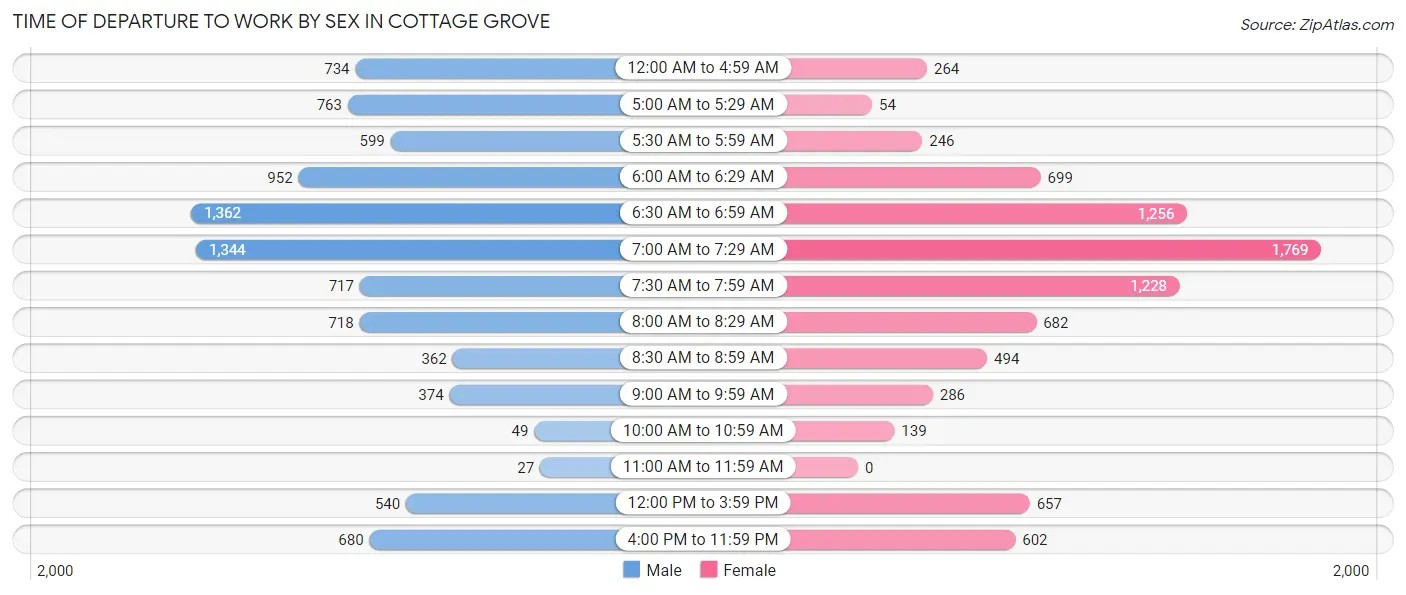
| Time of Departure | Male | Female |
| 12:00 AM to 4:59 AM | 734 (8.0%) | 264 (3.2%) |
| 5:00 AM to 5:29 AM | 763 (8.3%) | 54 (0.6%) |
| 5:30 AM to 5:59 AM | 599 (6.5%) | 246 (2.9%) |
| 6:00 AM to 6:29 AM | 952 (10.3%) | 699 (8.4%) |
| 6:30 AM to 6:59 AM | 1,362 (14.8%) | 1,256 (15.0%) |
| 7:00 AM to 7:29 AM | 1,344 (14.6%) | 1,769 (21.1%) |
| 7:30 AM to 7:59 AM | 717 (7.8%) | 1,228 (14.7%) |
| 8:00 AM to 8:29 AM | 718 (7.8%) | 682 (8.1%) |
| 8:30 AM to 8:59 AM | 362 (3.9%) | 494 (5.9%) |
| 9:00 AM to 9:59 AM | 374 (4.1%) | 286 (3.4%) |
| 10:00 AM to 10:59 AM | 49 (0.5%) | 139 (1.7%) |
| 11:00 AM to 11:59 AM | 27 (0.3%) | 0 (0.0%) |
| 12:00 PM to 3:59 PM | 540 (5.9%) | 657 (7.8%) |
| 4:00 PM to 11:59 PM | 680 (7.4%) | 602 (7.2%) |
| Total | 9,221 (100.0%) | 8,376 (100.0%) |
Housing Occupancy in Cottage Grove
Occupancy by Ownership in Cottage Grove
Of the total 13,194 dwellings in Cottage Grove, owner-occupied units account for 11,624 (88.1%), while renter-occupied units make up 1,570 (11.9%).
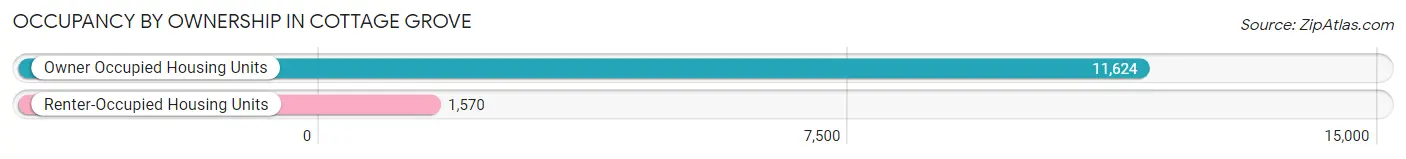
| Occupancy | # Housing Units | % Housing Units |
| Owner Occupied Housing Units | 11,624 | 88.1% |
| Renter-Occupied Housing Units | 1,570 | 11.9% |
| Total Occupied Housing Units | 13,194 | 100.0% |
Occupancy by Household Size in Cottage Grove
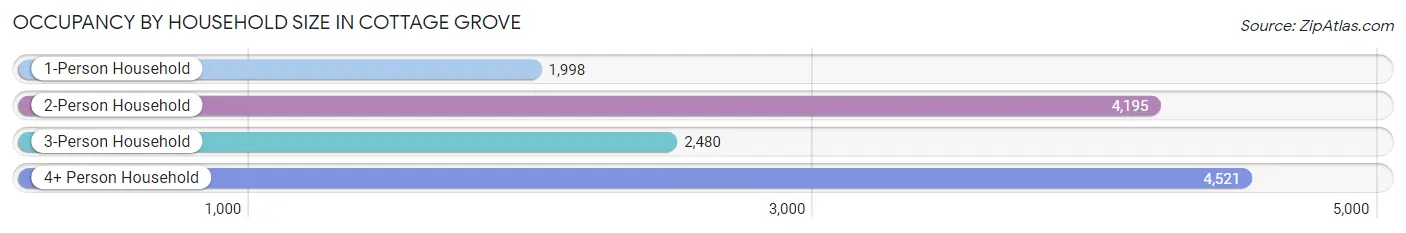
| Household Size | # Housing Units | % Housing Units |
| 1-Person Household | 1,998 | 15.1% |
| 2-Person Household | 4,195 | 31.8% |
| 3-Person Household | 2,480 | 18.8% |
| 4+ Person Household | 4,521 | 34.3% |
| Total Housing Units | 13,194 | 100.0% |
Occupancy by Ownership by Household Size in Cottage Grove
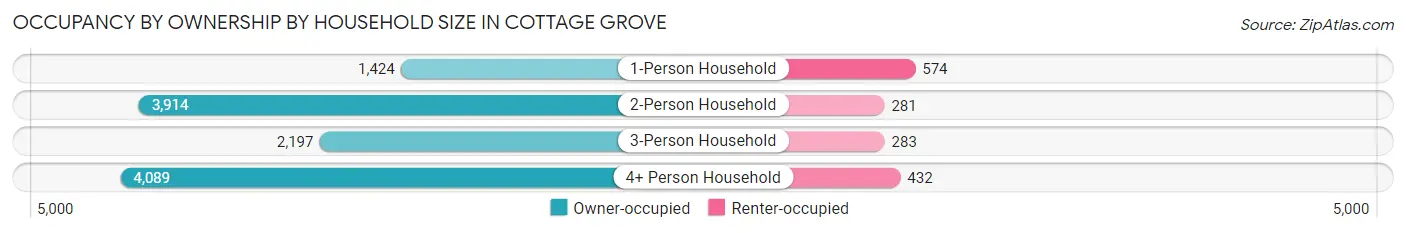
| Household Size | Owner-occupied | Renter-occupied |
| 1-Person Household | 1,424 (71.3%) | 574 (28.7%) |
| 2-Person Household | 3,914 (93.3%) | 281 (6.7%) |
| 3-Person Household | 2,197 (88.6%) | 283 (11.4%) |
| 4+ Person Household | 4,089 (90.4%) | 432 (9.6%) |
| Total Housing Units | 11,624 (88.1%) | 1,570 (11.9%) |
Occupancy by Educational Attainment in Cottage Grove
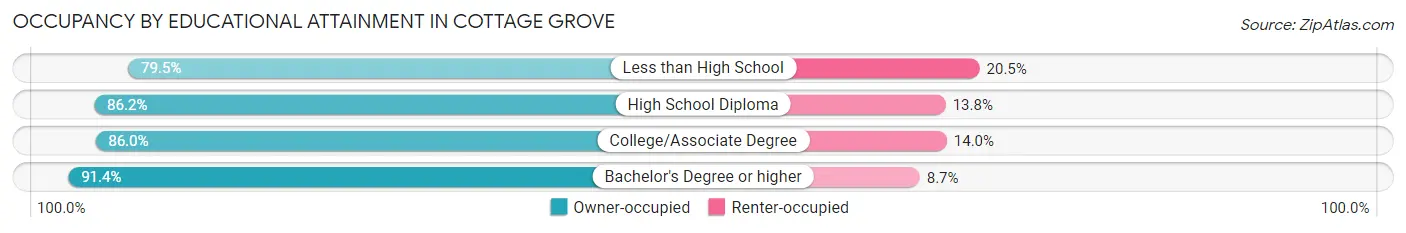
| Household Size | Owner-occupied | Renter-occupied |
| Less than High School | 314 (79.5%) | 81 (20.5%) |
| High School Diploma | 2,238 (86.2%) | 358 (13.8%) |
| College/Associate Degree | 3,980 (86.0%) | 649 (14.0%) |
| Bachelor's Degree or higher | 5,092 (91.3%) | 482 (8.6%) |
Occupancy by Age of Householder in Cottage Grove
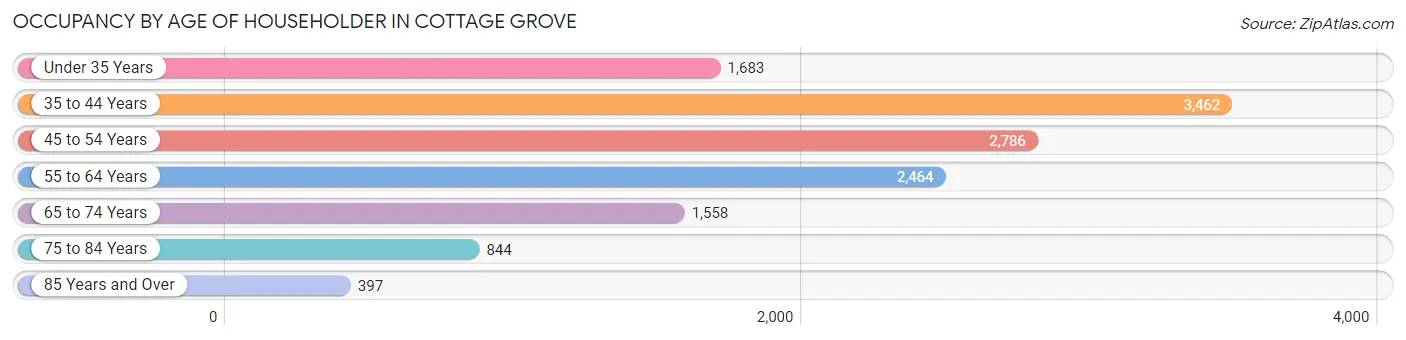
| Age Bracket | # Households | % Households |
| Under 35 Years | 1,683 | 12.8% |
| 35 to 44 Years | 3,462 | 26.2% |
| 45 to 54 Years | 2,786 | 21.1% |
| 55 to 64 Years | 2,464 | 18.7% |
| 65 to 74 Years | 1,558 | 11.8% |
| 75 to 84 Years | 844 | 6.4% |
| 85 Years and Over | 397 | 3.0% |
| Total | 13,194 | 100.0% |
Housing Finances in Cottage Grove
Median Income by Occupancy in Cottage Grove
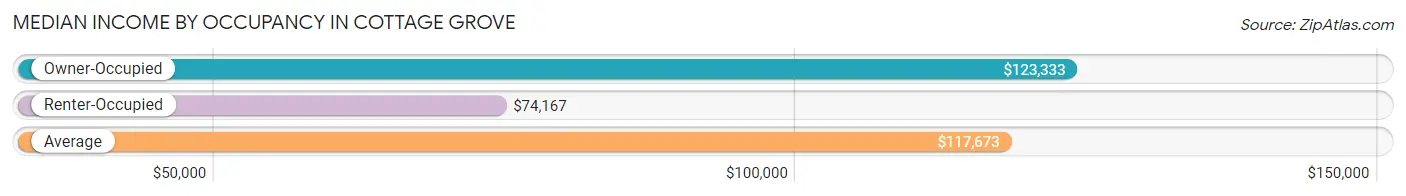
| Occupancy Type | # Households | Median Income |
| Owner-Occupied | 11,624 (88.1%) | $123,333 |
| Renter-Occupied | 1,570 (11.9%) | $74,167 |
| Average | 13,194 (100.0%) | $117,673 |
Occupancy by Householder Income Bracket in Cottage Grove
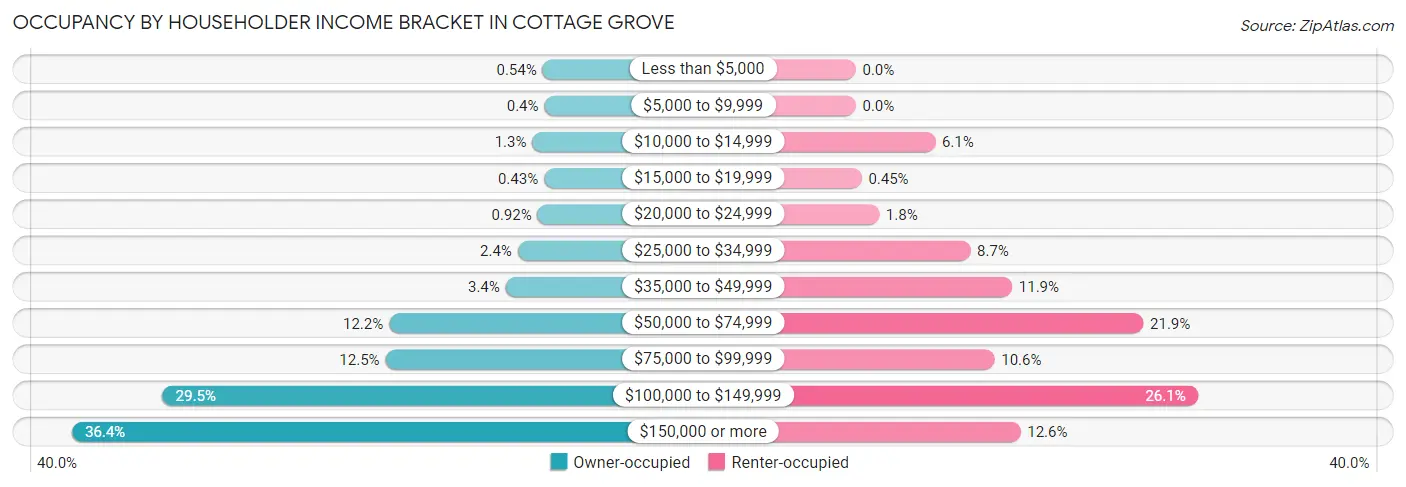
| Income Bracket | Owner-occupied | Renter-occupied |
| Less than $5,000 | 63 (0.5%) | 0 (0.0%) |
| $5,000 to $9,999 | 46 (0.4%) | 0 (0.0%) |
| $10,000 to $14,999 | 153 (1.3%) | 95 (6.0%) |
| $15,000 to $19,999 | 50 (0.4%) | 7 (0.4%) |
| $20,000 to $24,999 | 107 (0.9%) | 28 (1.8%) |
| $25,000 to $34,999 | 283 (2.4%) | 137 (8.7%) |
| $35,000 to $49,999 | 389 (3.4%) | 187 (11.9%) |
| $50,000 to $74,999 | 1,422 (12.2%) | 344 (21.9%) |
| $75,000 to $99,999 | 1,454 (12.5%) | 166 (10.6%) |
| $100,000 to $149,999 | 3,427 (29.5%) | 409 (26.1%) |
| $150,000 or more | 4,230 (36.4%) | 197 (12.6%) |
| Total | 11,624 (100.0%) | 1,570 (100.0%) |
Monthly Housing Cost Tiers in Cottage Grove
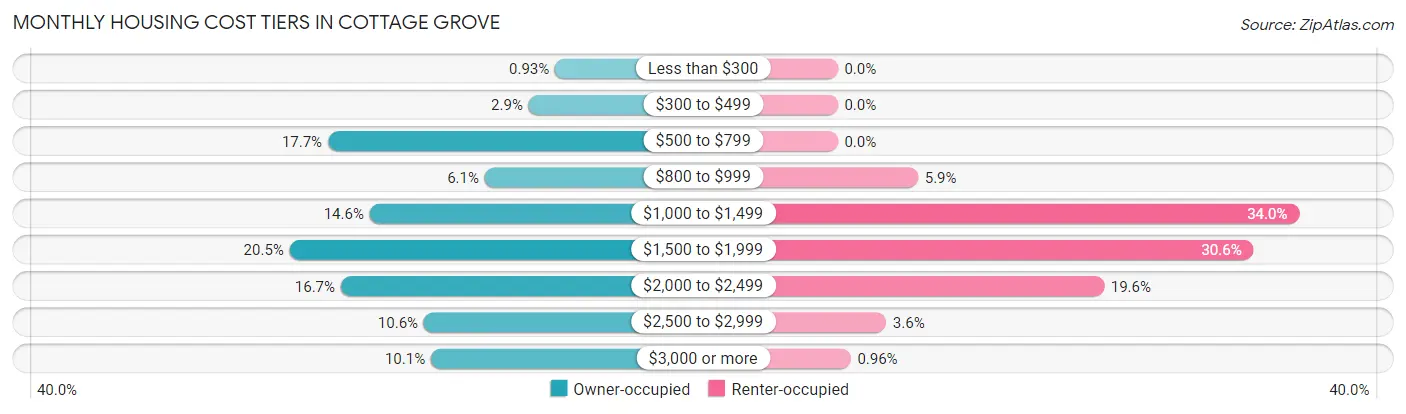
| Monthly Cost | Owner-occupied | Renter-occupied |
| Less than $300 | 108 (0.9%) | 0 (0.0%) |
| $300 to $499 | 334 (2.9%) | 0 (0.0%) |
| $500 to $799 | 2,053 (17.7%) | 0 (0.0%) |
| $800 to $999 | 710 (6.1%) | 93 (5.9%) |
| $1,000 to $1,499 | 1,695 (14.6%) | 534 (34.0%) |
| $1,500 to $1,999 | 2,381 (20.5%) | 481 (30.6%) |
| $2,000 to $2,499 | 1,942 (16.7%) | 308 (19.6%) |
| $2,500 to $2,999 | 1,231 (10.6%) | 56 (3.6%) |
| $3,000 or more | 1,170 (10.1%) | 15 (1.0%) |
| Total | 11,624 (100.0%) | 1,570 (100.0%) |
Physical Housing Characteristics in Cottage Grove
Housing Structures in Cottage Grove
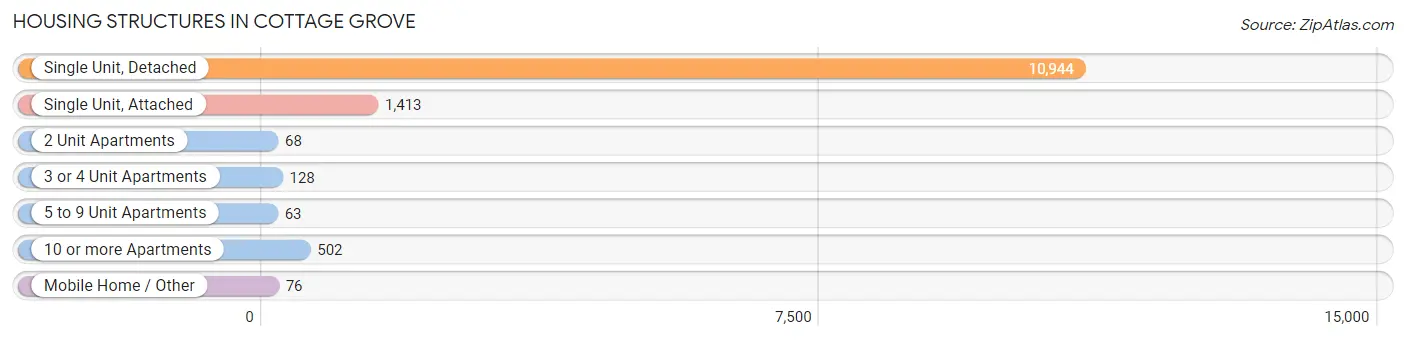
| Structure Type | # Housing Units | % Housing Units |
| Single Unit, Detached | 10,944 | 83.0% |
| Single Unit, Attached | 1,413 | 10.7% |
| 2 Unit Apartments | 68 | 0.5% |
| 3 or 4 Unit Apartments | 128 | 1.0% |
| 5 to 9 Unit Apartments | 63 | 0.5% |
| 10 or more Apartments | 502 | 3.8% |
| Mobile Home / Other | 76 | 0.6% |
| Total | 13,194 | 100.0% |
Housing Structures by Occupancy in Cottage Grove
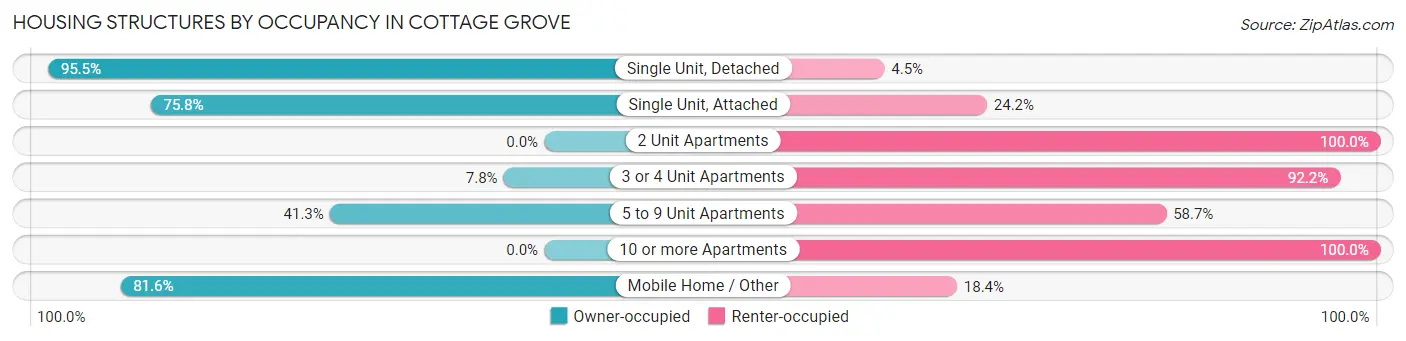
| Structure Type | Owner-occupied | Renter-occupied |
| Single Unit, Detached | 10,455 (95.5%) | 489 (4.5%) |
| Single Unit, Attached | 1,071 (75.8%) | 342 (24.2%) |
| 2 Unit Apartments | 0 (0.0%) | 68 (100.0%) |
| 3 or 4 Unit Apartments | 10 (7.8%) | 118 (92.2%) |
| 5 to 9 Unit Apartments | 26 (41.3%) | 37 (58.7%) |
| 10 or more Apartments | 0 (0.0%) | 502 (100.0%) |
| Mobile Home / Other | 62 (81.6%) | 14 (18.4%) |
| Total | 11,624 (88.1%) | 1,570 (11.9%) |
Housing Structures by Number of Rooms in Cottage Grove
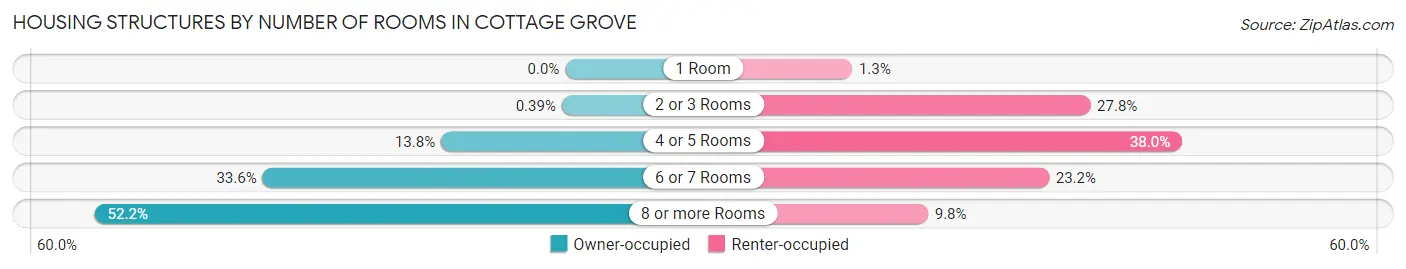
| Number of Rooms | Owner-occupied | Renter-occupied |
| 1 Room | 0 (0.0%) | 21 (1.3%) |
| 2 or 3 Rooms | 45 (0.4%) | 436 (27.8%) |
| 4 or 5 Rooms | 1,603 (13.8%) | 596 (38.0%) |
| 6 or 7 Rooms | 3,906 (33.6%) | 364 (23.2%) |
| 8 or more Rooms | 6,070 (52.2%) | 153 (9.8%) |
| Total | 11,624 (100.0%) | 1,570 (100.0%) |
Housing Structure by Heating Type in Cottage Grove
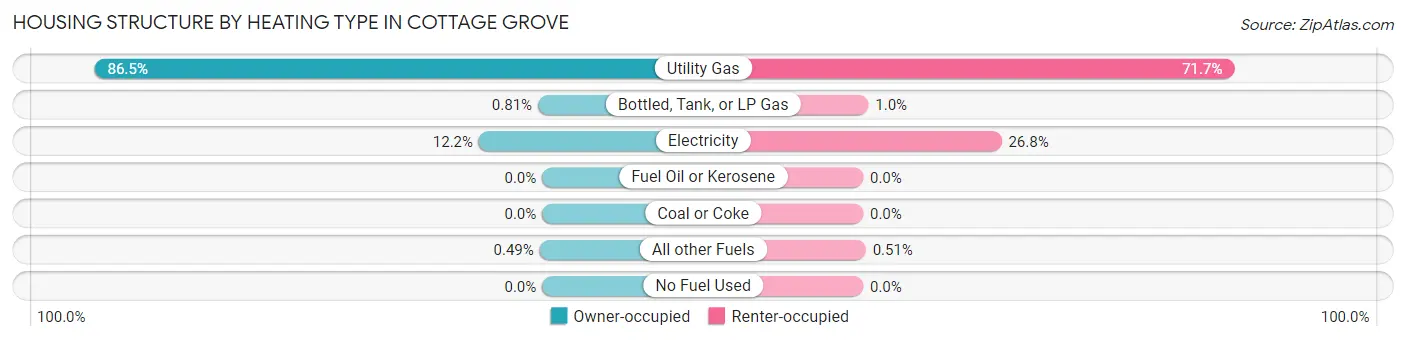
| Heating Type | Owner-occupied | Renter-occupied |
| Utility Gas | 10,052 (86.5%) | 1,126 (71.7%) |
| Bottled, Tank, or LP Gas | 94 (0.8%) | 16 (1.0%) |
| Electricity | 1,421 (12.2%) | 420 (26.8%) |
| Fuel Oil or Kerosene | 0 (0.0%) | 0 (0.0%) |
| Coal or Coke | 0 (0.0%) | 0 (0.0%) |
| All other Fuels | 57 (0.5%) | 8 (0.5%) |
| No Fuel Used | 0 (0.0%) | 0 (0.0%) |
| Total | 11,624 (100.0%) | 1,570 (100.0%) |
Household Vehicle Usage in Cottage Grove
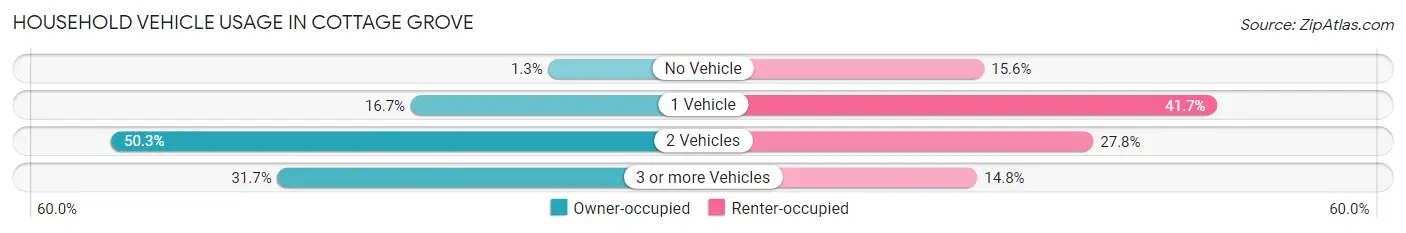
| Vehicles per Household | Owner-occupied | Renter-occupied |
| No Vehicle | 152 (1.3%) | 245 (15.6%) |
| 1 Vehicle | 1,943 (16.7%) | 655 (41.7%) |
| 2 Vehicles | 5,848 (50.3%) | 437 (27.8%) |
| 3 or more Vehicles | 3,681 (31.7%) | 233 (14.8%) |
| Total | 11,624 (100.0%) | 1,570 (100.0%) |
Real Estate & Mortgages in Cottage Grove
Real Estate and Mortgage Overview in Cottage Grove
| Characteristic | Without Mortgage | With Mortgage |
| Housing Units | 3,272 | 8,352 |
| Median Property Value | $329,400 | $339,600 |
| Median Household Income | $107,978 | $3,378 |
| Monthly Housing Costs | $691 | $1,170 |
| Real Estate Taxes | $3,723 | $163 |
Property Value by Mortgage Status in Cottage Grove
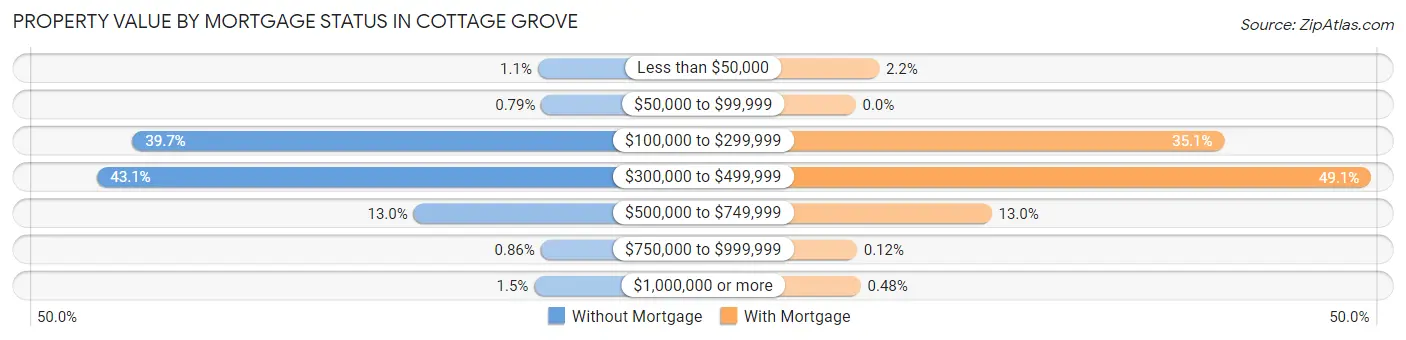
| Property Value | Without Mortgage | With Mortgage |
| Less than $50,000 | 37 (1.1%) | 186 (2.2%) |
| $50,000 to $99,999 | 26 (0.8%) | 0 (0.0%) |
| $100,000 to $299,999 | 1,300 (39.7%) | 2,933 (35.1%) |
| $300,000 to $499,999 | 1,409 (43.1%) | 4,101 (49.1%) |
| $500,000 to $749,999 | 424 (13.0%) | 1,082 (13.0%) |
| $750,000 to $999,999 | 28 (0.9%) | 10 (0.1%) |
| $1,000,000 or more | 48 (1.5%) | 40 (0.5%) |
| Total | 3,272 (100.0%) | 8,352 (100.0%) |
Household Income by Mortgage Status in Cottage Grove
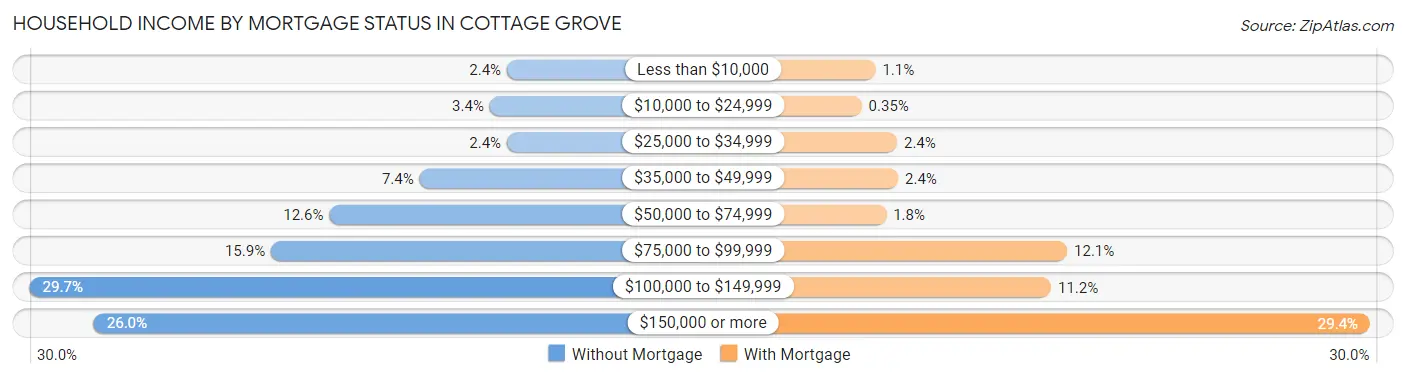
| Household Income | Without Mortgage | With Mortgage |
| Less than $10,000 | 80 (2.4%) | 95 (1.1%) |
| $10,000 to $24,999 | 112 (3.4%) | 29 (0.4%) |
| $25,000 to $34,999 | 80 (2.4%) | 198 (2.4%) |
| $35,000 to $49,999 | 243 (7.4%) | 203 (2.4%) |
| $50,000 to $74,999 | 412 (12.6%) | 146 (1.8%) |
| $75,000 to $99,999 | 521 (15.9%) | 1,010 (12.1%) |
| $100,000 to $149,999 | 972 (29.7%) | 933 (11.2%) |
| $150,000 or more | 852 (26.0%) | 2,455 (29.4%) |
| Total | 3,272 (100.0%) | 8,352 (100.0%) |
Property Value to Household Income Ratio in Cottage Grove
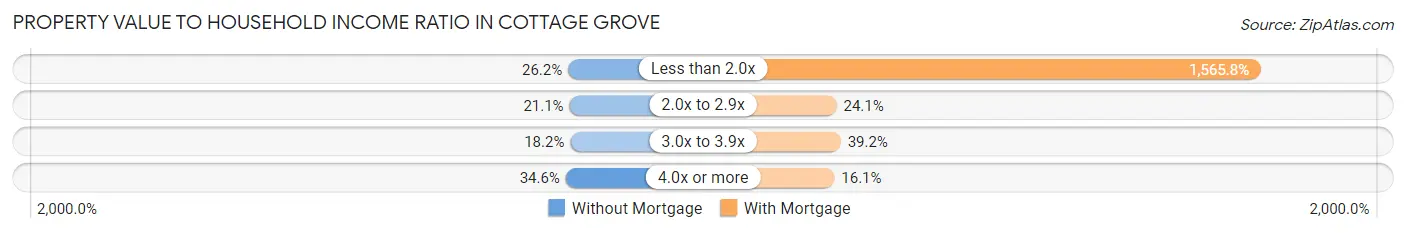
| Value-to-Income Ratio | Without Mortgage | With Mortgage |
| Less than 2.0x | 857 (26.2%) | 130,778 (1,565.8%) |
| 2.0x to 2.9x | 689 (21.1%) | 2,016 (24.1%) |
| 3.0x to 3.9x | 595 (18.2%) | 3,270 (39.2%) |
| 4.0x or more | 1,131 (34.6%) | 1,342 (16.1%) |
| Total | 3,272 (100.0%) | 8,352 (100.0%) |
Real Estate Taxes by Mortgage Status in Cottage Grove

| Property Taxes | Without Mortgage | With Mortgage |
| Less than $800 | 117 (3.6%) | 7 (0.1%) |
| $800 to $1,499 | 73 (2.2%) | 182 (2.2%) |
| $800 to $1,499 | 2,991 (91.4%) | 248 (3.0%) |
| Total | 3,272 (100.0%) | 8,352 (100.0%) |
Health & Disability in Cottage Grove
Health Insurance Coverage by Age in Cottage Grove
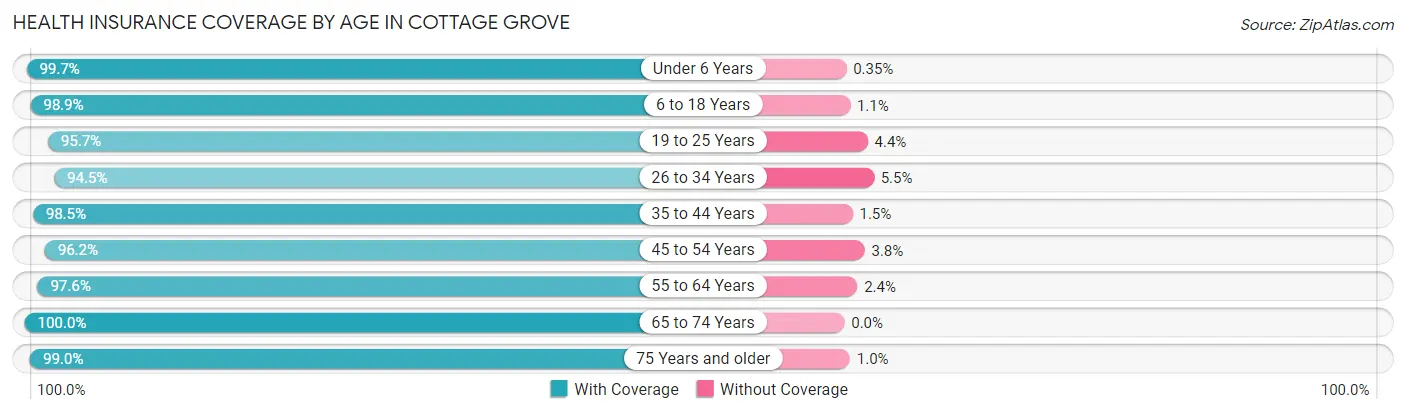
| Age Bracket | With Coverage | Without Coverage |
| Under 6 Years | 3,399 (99.7%) | 12 (0.4%) |
| 6 to 18 Years | 7,682 (98.9%) | 82 (1.1%) |
| 19 to 25 Years | 2,861 (95.7%) | 130 (4.3%) |
| 26 to 34 Years | 3,685 (94.5%) | 214 (5.5%) |
| 35 to 44 Years | 6,776 (98.5%) | 105 (1.5%) |
| 45 to 54 Years | 4,864 (96.2%) | 191 (3.8%) |
| 55 to 64 Years | 4,219 (97.6%) | 104 (2.4%) |
| 65 to 74 Years | 2,883 (100.0%) | 0 (0.0%) |
| 75 Years and older | 1,931 (99.0%) | 20 (1.0%) |
| Total | 38,300 (97.8%) | 858 (2.2%) |
Health Insurance Coverage by Citizenship Status in Cottage Grove

| Citizenship Status | With Coverage | Without Coverage |
| Native Born | 3,399 (99.7%) | 12 (0.4%) |
| Foreign Born, Citizen | 7,682 (98.9%) | 82 (1.1%) |
| Foreign Born, not a Citizen | 2,861 (95.7%) | 130 (4.3%) |
Health Insurance Coverage by Household Income in Cottage Grove
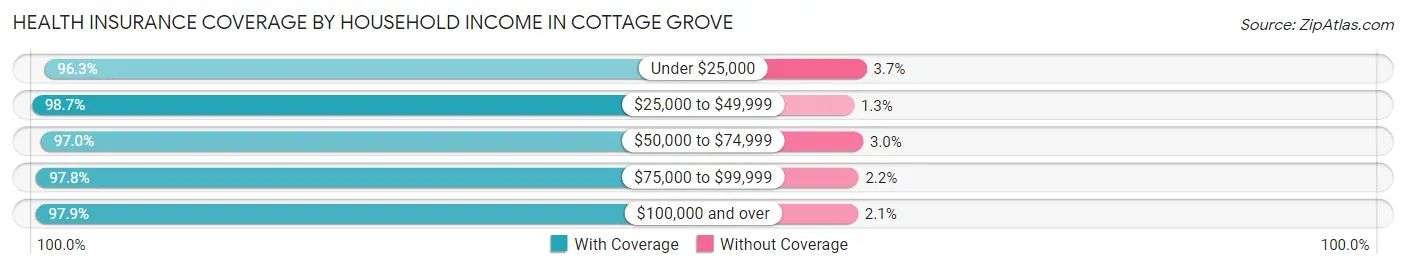
| Household Income | With Coverage | Without Coverage |
| Under $25,000 | 888 (96.3%) | 34 (3.7%) |
| $25,000 to $49,999 | 1,840 (98.7%) | 25 (1.3%) |
| $50,000 to $74,999 | 3,859 (97.0%) | 121 (3.0%) |
| $75,000 to $99,999 | 4,560 (97.8%) | 102 (2.2%) |
| $100,000 and over | 27,093 (97.9%) | 575 (2.1%) |
Public vs Private Health Insurance Coverage by Age in Cottage Grove
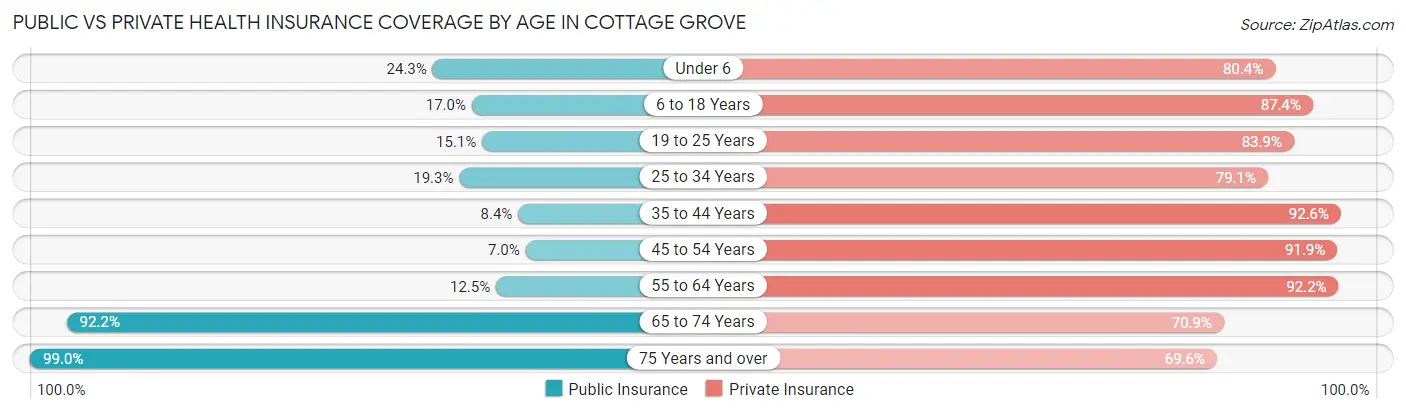
| Age Bracket | Public Insurance | Private Insurance |
| Under 6 | 828 (24.3%) | 2,743 (80.4%) |
| 6 to 18 Years | 1,320 (17.0%) | 6,787 (87.4%) |
| 19 to 25 Years | 451 (15.1%) | 2,509 (83.9%) |
| 25 to 34 Years | 753 (19.3%) | 3,083 (79.1%) |
| 35 to 44 Years | 577 (8.4%) | 6,374 (92.6%) |
| 45 to 54 Years | 355 (7.0%) | 4,647 (91.9%) |
| 55 to 64 Years | 540 (12.5%) | 3,985 (92.2%) |
| 65 to 74 Years | 2,658 (92.2%) | 2,044 (70.9%) |
| 75 Years and over | 1,931 (99.0%) | 1,358 (69.6%) |
| Total | 9,413 (24.0%) | 33,530 (85.6%) |
Disability Status by Sex by Age in Cottage Grove
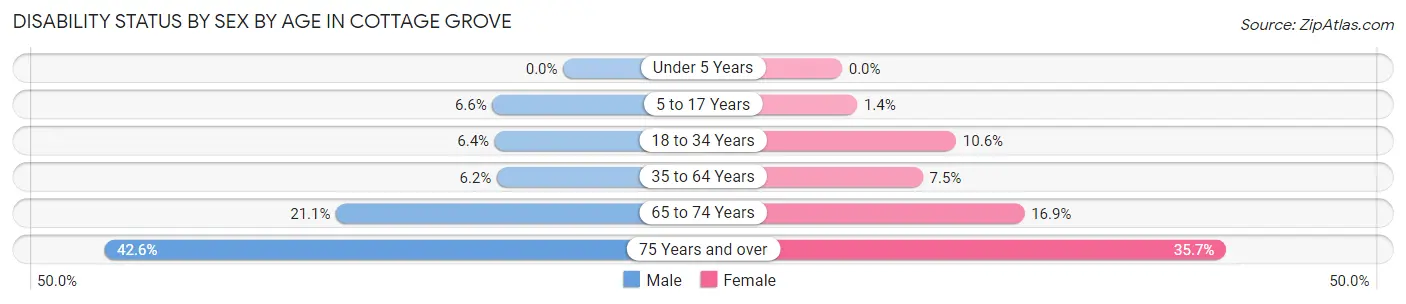
| Age Bracket | Male | Female |
| Under 5 Years | 0 (0.0%) | 0 (0.0%) |
| 5 to 17 Years | 245 (6.6%) | 60 (1.4%) |
| 18 to 34 Years | 225 (6.4%) | 416 (10.6%) |
| 35 to 64 Years | 497 (6.1%) | 613 (7.5%) |
| 65 to 74 Years | 336 (21.1%) | 218 (16.9%) |
| 75 Years and over | 381 (42.6%) | 377 (35.7%) |
Disability Class by Sex by Age in Cottage Grove
Disability Class: Hearing Difficulty
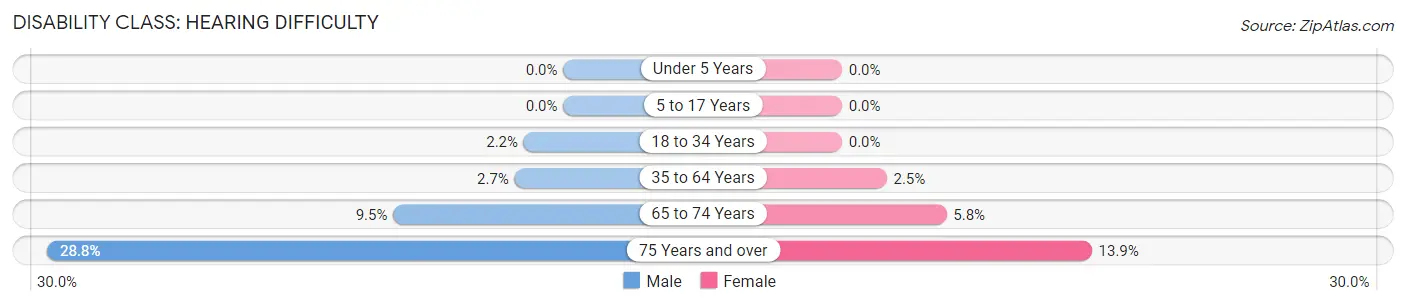
| Age Bracket | Male | Female |
| Under 5 Years | 0 (0.0%) | 0 (0.0%) |
| 5 to 17 Years | 0 (0.0%) | 0 (0.0%) |
| 18 to 34 Years | 78 (2.2%) | 0 (0.0%) |
| 35 to 64 Years | 219 (2.7%) | 204 (2.5%) |
| 65 to 74 Years | 151 (9.5%) | 75 (5.8%) |
| 75 Years and over | 257 (28.7%) | 147 (13.9%) |
Disability Class: Vision Difficulty
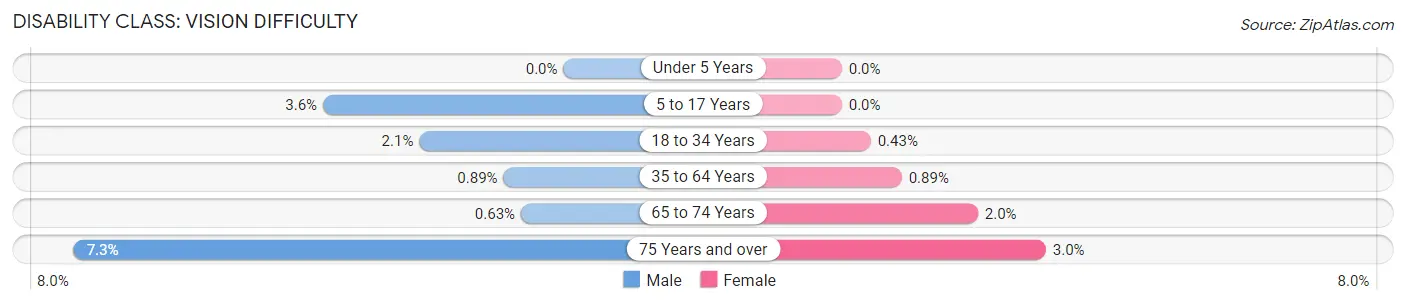
| Age Bracket | Male | Female |
| Under 5 Years | 0 (0.0%) | 0 (0.0%) |
| 5 to 17 Years | 133 (3.6%) | 0 (0.0%) |
| 18 to 34 Years | 76 (2.1%) | 17 (0.4%) |
| 35 to 64 Years | 72 (0.9%) | 73 (0.9%) |
| 65 to 74 Years | 10 (0.6%) | 26 (2.0%) |
| 75 Years and over | 65 (7.3%) | 32 (3.0%) |
Disability Class: Cognitive Difficulty
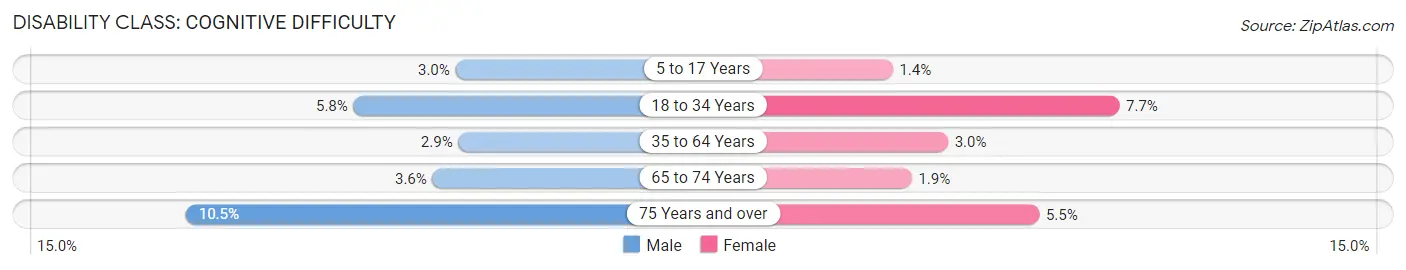
| Age Bracket | Male | Female |
| 5 to 17 Years | 112 (3.0%) | 60 (1.4%) |
| 18 to 34 Years | 207 (5.8%) | 303 (7.7%) |
| 35 to 64 Years | 236 (2.9%) | 241 (2.9%) |
| 65 to 74 Years | 58 (3.6%) | 25 (1.9%) |
| 75 Years and over | 94 (10.5%) | 58 (5.5%) |
Disability Class: Ambulatory Difficulty
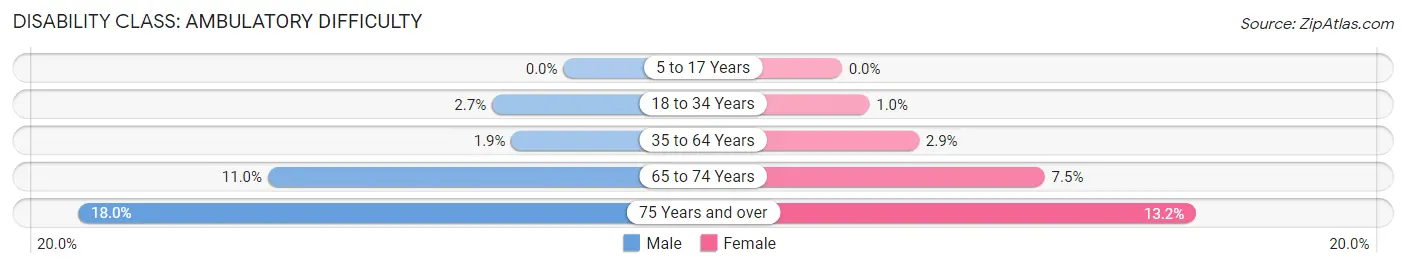
| Age Bracket | Male | Female |
| 5 to 17 Years | 0 (0.0%) | 0 (0.0%) |
| 18 to 34 Years | 94 (2.6%) | 40 (1.0%) |
| 35 to 64 Years | 156 (1.9%) | 234 (2.9%) |
| 65 to 74 Years | 175 (11.0%) | 97 (7.5%) |
| 75 Years and over | 161 (18.0%) | 139 (13.2%) |
Disability Class: Self-Care Difficulty
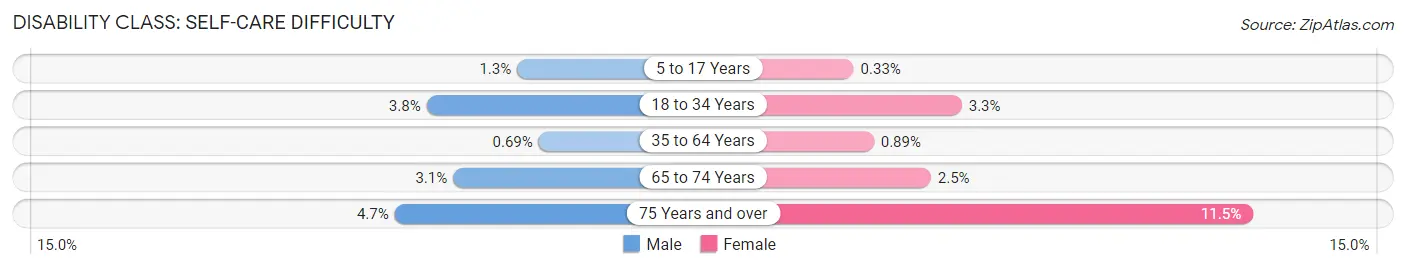
| Age Bracket | Male | Female |
| 5 to 17 Years | 48 (1.3%) | 14 (0.3%) |
| 18 to 34 Years | 135 (3.8%) | 131 (3.3%) |
| 35 to 64 Years | 56 (0.7%) | 73 (0.9%) |
| 65 to 74 Years | 49 (3.1%) | 32 (2.5%) |
| 75 Years and over | 42 (4.7%) | 121 (11.5%) |
Technology Access in Cottage Grove
Computing Device Access in Cottage Grove
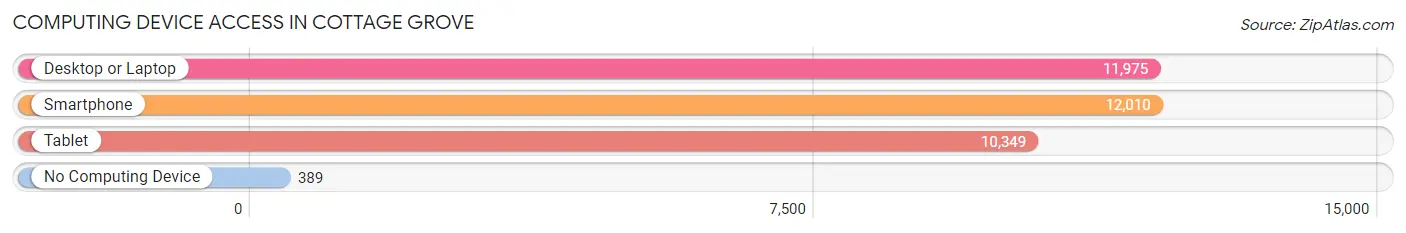
| Device Type | # Households | % Households |
| Desktop or Laptop | 11,975 | 90.8% |
| Smartphone | 12,010 | 91.0% |
| Tablet | 10,349 | 78.4% |
| No Computing Device | 389 | 2.9% |
| Total | 13,194 | 100.0% |
Internet Access in Cottage Grove
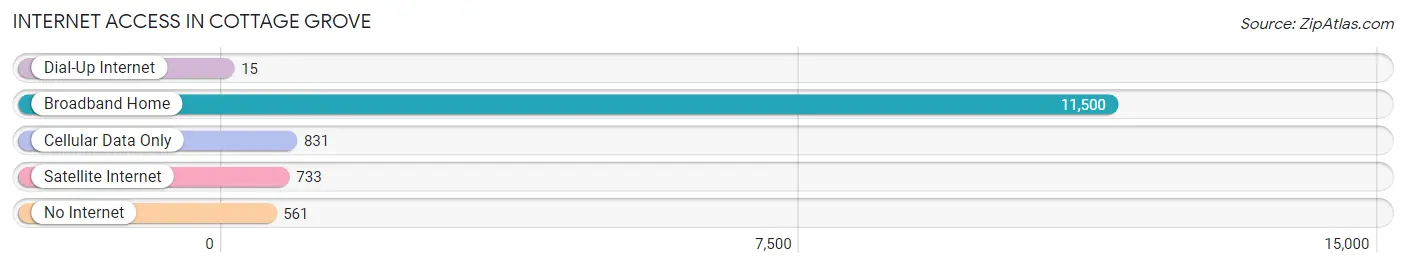
| Internet Type | # Households | % Households |
| Dial-Up Internet | 15 | 0.1% |
| Broadband Home | 11,500 | 87.2% |
| Cellular Data Only | 831 | 6.3% |
| Satellite Internet | 733 | 5.6% |
| No Internet | 561 | 4.3% |
| Total | 13,194 | 100.0% |
Cottage Grove Summary
Cottage Grove is a city located in Washington County, Minnesota, United States. The population was 34,589 at the 2010 census. It is a suburb of the Twin Cities metropolitan area.
History
Cottage Grove was first settled in 1844 by a group of settlers from New England. The town was originally called Grey Cloud Island, after the nearby island in the Mississippi River. The name was changed to Cottage Grove in 1858. The town was incorporated in 1872.
Cottage Grove was a rural farming community until the 1950s, when it began to experience rapid growth due to its proximity to the Twin Cities. The population grew from 1,000 in 1950 to over 34,000 in 2010.
Geography
Cottage Grove is located in Washington County, Minnesota, about 20 miles southeast of Minneapolis. It is situated on the east bank of the Mississippi River, just south of the confluence of the St. Croix and Mississippi Rivers.
The city has a total area of 22.2 square miles, of which 21.9 square miles is land and 0.3 square miles is water.
Economy
Cottage Grove is a bedroom community for the Twin Cities metropolitan area. The city's economy is largely based on retail, services, and light manufacturing. The city is home to several large employers, including 3M, Andersen Windows, and the Minnesota Department of Transportation.
Demographics
As of the 2010 census, there were 34,589 people, 12,845 households, and 9,072 families residing in the city. The population density was 1,569.2 people per square mile. The racial makeup of the city was 87.2% White, 4.3% African American, 0.5% Native American, 3.2% Asian, 2.2% from other races, and 2.6% from two or more races. Hispanic or Latino of any race were 5.2% of the population.
The median income for a household in the city was $63,945, and the median income for a family was $76,945. The per capita income for the city was $27,945. About 3.2% of families and 4.7% of the population were below the poverty line, including 5.3% of those under age 18 and 4.2% of those age 65 or over.
Common Questions
What is the Total Population of Cottage Grove?
Total Population of Cottage Grove is 39,274.
What is the Total Male Population of Cottage Grove?
Total Male Population of Cottage Grove is 19,296.
What is the Total Female Population of Cottage Grove?
Total Female Population of Cottage Grove is 19,978.
What is the Ratio of Males per 100 Females in Cottage Grove?
There are 96.59 Males per 100 Females in Cottage Grove.
What is the Ratio of Females per 100 Males in Cottage Grove?
There are 103.53 Females per 100 Males in Cottage Grove.
What is the Median Population Age in Cottage Grove?
Median Population Age in Cottage Grove is 36.8 Years.
What is the Average Family Size in Cottage Grove
Average Family Size in Cottage Grove is 3.3 People.
What is the Average Household Size in Cottage Grove
Average Household Size in Cottage Grove is 3.0 People.
What is Per Capita Income in Cottage Grove?
Per Capita income in Cottage Grove is $45,753.
What is the Median Family Income in Cottage Grove?
Median Family Income in Cottage Grove is $127,091.
What is the Median Household income in Cottage Grove?
Median Household Income in Cottage Grove is $117,673.
What is Income or Wage Gap in Cottage Grove?
Income or Wage Gap in Cottage Grove is 25.1%.
Women in Cottage Grove earn 74.9 cents for every dollar earned by a man.
What is Family Income Deficit in Cottage Grove?
Family Income Deficit in Cottage Grove is $12,976.
Families that are below poverty line in Cottage Grove earn $12,976 less on average than the poverty threshold level.
What is Inequality or Gini Index in Cottage Grove?
Inequality or Gini Index in Cottage Grove is 0.34.
How Large is the Labor Force in Cottage Grove?
There are 21,997 People in the Labor Forcein in Cottage Grove.
What is the Percentage of People in the Labor Force in Cottage Grove?
73.5% of People are in the Labor Force in Cottage Grove.
What is the Unemployment Rate in Cottage Grove?
Unemployment Rate in Cottage Grove is 2.7%.