Cities with the Highest Percentage of Families with Income Below $10,000 in Minnesota
RELATED REPORTS & OPTIONS
Family Income | $0-10k
Minnesota
Compare Cities
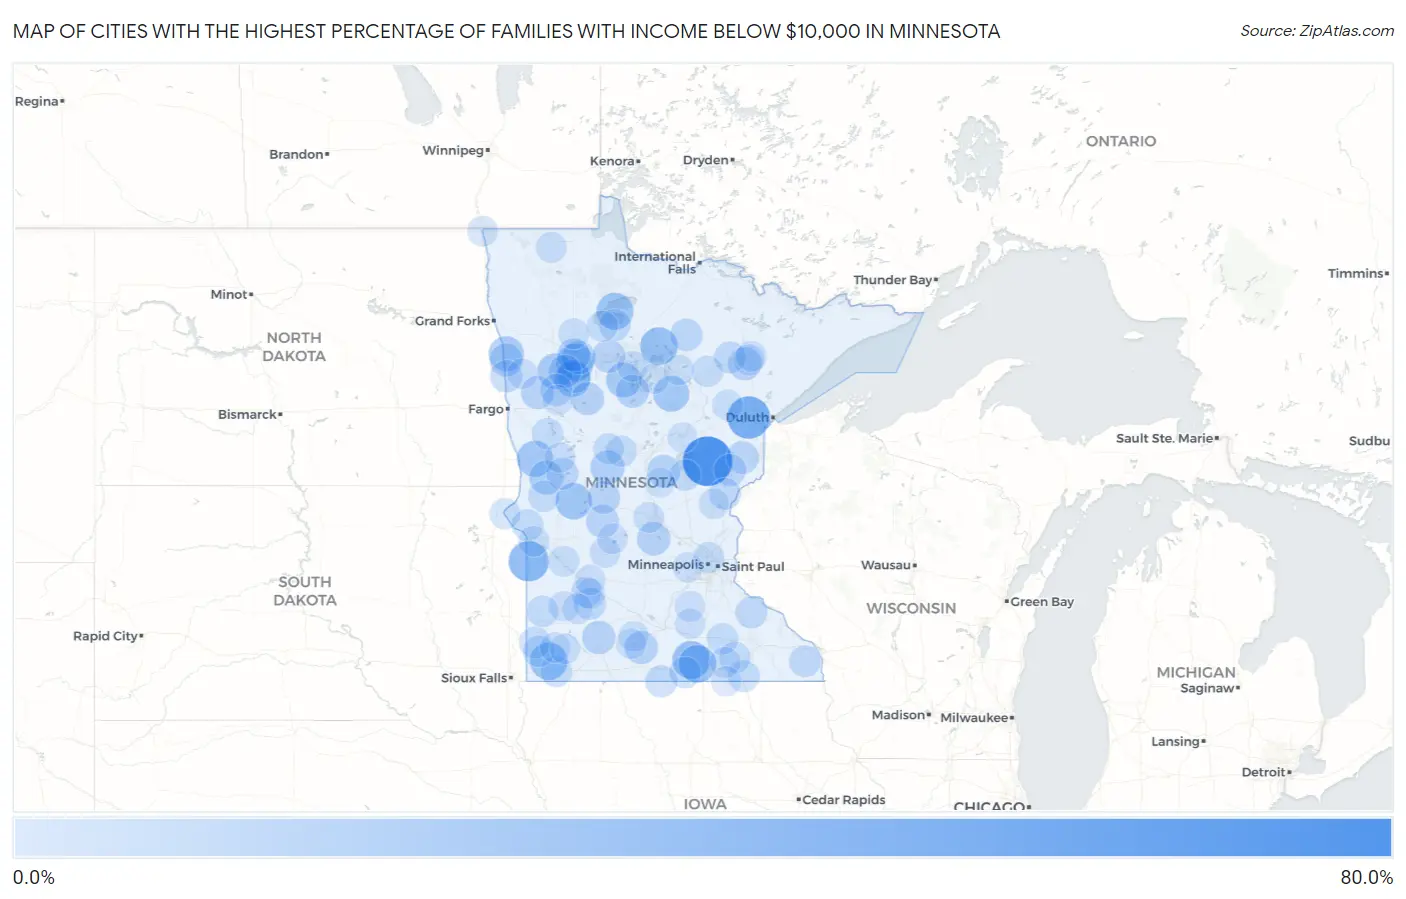
Map of Cities with the Highest Percentage of Families with Income Below $10,000 in Minnesota
0.0%
80.0%
Cities with the Highest Percentage of Families with Income Below $10,000 in Minnesota
| City | Families with Income < $10k | vs State | vs National | |
| 1. | Mcgrath | 66.7% | 1.8%(+64.9)#1 | 3.1%(+63.6)#69 |
| 2. | Mahnomen | 44.1% | 1.8%(+42.3)#2 | 3.1%(+41.0)#172 |
| 3. | Marietta | 37.1% | 1.8%(+35.3)#3 | 3.1%(+34.0)#258 |
| 4. | Freeborn | 29.3% | 1.8%(+27.5)#4 | 3.1%(+26.2)#425 |
| 5. | Squaw Lake | 29.2% | 1.8%(+27.4)#5 | 3.1%(+26.1)#428 |
| 6. | Kenneth | 28.6% | 1.8%(+26.8)#6 | 3.1%(+25.5)#448 |
| 7. | Manchester | 28.6% | 1.8%(+26.8)#7 | 3.1%(+25.5)#449 |
| 8. | Pine Bend | 28.6% | 1.8%(+26.8)#8 | 3.1%(+25.5)#453 |
| 9. | Ponemah | 26.5% | 1.8%(+24.7)#9 | 3.1%(+23.4)#522 |
| 10. | Farwell | 25.0% | 1.8%(+23.2)#10 | 3.1%(+21.9)#602 |
| 11. | Foxhome | 24.1% | 1.8%(+22.3)#11 | 3.1%(+21.0)#642 |
| 12. | Twin Lakes | 23.7% | 1.8%(+21.9)#12 | 3.1%(+20.6)#664 |
| 13. | Remer | 23.5% | 1.8%(+21.7)#13 | 3.1%(+20.4)#669 |
| 14. | Riverland | 22.2% | 1.8%(+20.4)#14 | 3.1%(+19.1)#745 |
| 15. | Laporte | 21.1% | 1.8%(+19.3)#15 | 3.1%(+18.0)#819 |
| 16. | Nielsville | 20.8% | 1.8%(+19.0)#16 | 3.1%(+17.7)#836 |
| 17. | Eagle Bend | 18.0% | 1.8%(+16.2)#17 | 3.1%(+14.9)#1,108 |
| 18. | Wendell | 17.9% | 1.8%(+16.1)#18 | 3.1%(+14.8)#1,122 |
| 19. | Naytahwaush | 16.8% | 1.8%(+15.0)#19 | 3.1%(+13.7)#1,231 |
| 20. | South Haven | 15.9% | 1.8%(+14.1)#20 | 3.1%(+12.8)#1,342 |
| 21. | Ebro | 15.8% | 1.8%(+14.0)#21 | 3.1%(+12.7)#1,351 |
| 22. | Jeffers | 15.6% | 1.8%(+13.8)#22 | 3.1%(+12.5)#1,375 |
| 23. | Iron Junction | 15.0% | 1.8%(+13.2)#23 | 3.1%(+11.9)#1,467 |
| 24. | Shelly | 14.9% | 1.8%(+13.1)#24 | 3.1%(+11.8)#1,488 |
| 25. | Lewisville | 14.8% | 1.8%(+13.0)#25 | 3.1%(+11.7)#1,499 |
| 26. | Ulen | 14.7% | 1.8%(+12.9)#26 | 3.1%(+11.6)#1,520 |
| 27. | Pine Point | 14.7% | 1.8%(+12.9)#27 | 3.1%(+11.6)#1,522 |
| 28. | Harding | 14.7% | 1.8%(+12.9)#28 | 3.1%(+11.6)#1,524 |
| 29. | Walker | 14.6% | 1.8%(+12.8)#29 | 3.1%(+11.5)#1,538 |
| 30. | Wilton | 14.5% | 1.8%(+12.7)#30 | 3.1%(+11.4)#1,557 |
| 31. | Brooten | 14.4% | 1.8%(+12.6)#31 | 3.1%(+11.3)#1,575 |
| 32. | Lengby | 14.3% | 1.8%(+12.5)#32 | 3.1%(+11.2)#1,620 |
| 33. | Midway | 14.3% | 1.8%(+12.5)#33 | 3.1%(+11.2)#1,624 |
| 34. | Hubbard | 14.3% | 1.8%(+12.5)#34 | 3.1%(+11.2)#1,625 |
| 35. | West Union | 13.6% | 1.8%(+11.8)#35 | 3.1%(+10.5)#1,756 |
| 36. | Bruno | 13.3% | 1.8%(+11.5)#36 | 3.1%(+10.2)#1,826 |
| 37. | Bigfork | 13.0% | 1.8%(+11.2)#37 | 3.1%(+9.90)#1,883 |
| 38. | Ogema | 12.5% | 1.8%(+10.7)#38 | 3.1%(+9.40)#2,002 |
| 39. | Sandstone | 12.4% | 1.8%(+10.6)#39 | 3.1%(+9.30)#2,025 |
| 40. | Hendrum | 12.2% | 1.8%(+10.4)#40 | 3.1%(+9.10)#2,089 |
| 41. | Ashby | 11.8% | 1.8%(+10.00)#41 | 3.1%(+8.70)#2,196 |
| 42. | Elmore | 11.5% | 1.8%(+9.70)#42 | 3.1%(+8.40)#2,299 |
| 43. | Chisholm | 11.2% | 1.8%(+9.40)#43 | 3.1%(+8.10)#2,385 |
| 44. | Seaforth | 11.1% | 1.8%(+9.30)#44 | 3.1%(+8.00)#2,449 |
| 45. | Pine City | 10.8% | 1.8%(+9.00)#45 | 3.1%(+7.70)#2,517 |
| 46. | Houston | 10.8% | 1.8%(+9.00)#46 | 3.1%(+7.70)#2,529 |
| 47. | Redby | 10.7% | 1.8%(+8.90)#47 | 3.1%(+7.60)#2,560 |
| 48. | Bellechester | 10.6% | 1.8%(+8.80)#48 | 3.1%(+7.50)#2,620 |
| 49. | Walters | 10.5% | 1.8%(+8.70)#49 | 3.1%(+7.40)#2,664 |
| 50. | Adrian | 10.4% | 1.8%(+8.60)#50 | 3.1%(+7.30)#2,678 |
| 51. | Clinton | 10.3% | 1.8%(+8.50)#51 | 3.1%(+7.20)#2,734 |
| 52. | Pipestone | 10.1% | 1.8%(+8.30)#52 | 3.1%(+7.00)#2,794 |
| 53. | Trosky | 10.0% | 1.8%(+8.20)#53 | 3.1%(+6.90)#2,884 |
| 54. | Arco | 10.0% | 1.8%(+8.20)#54 | 3.1%(+6.90)#2,886 |
| 55. | Taopi | 10.0% | 1.8%(+8.20)#55 | 3.1%(+6.90)#2,890 |
| 56. | Sargeant | 10.0% | 1.8%(+8.20)#56 | 3.1%(+6.90)#2,893 |
| 57. | Onamia | 9.9% | 1.8%(+8.10)#57 | 3.1%(+6.80)#2,914 |
| 58. | Herman | 9.9% | 1.8%(+8.10)#58 | 3.1%(+6.80)#2,918 |
| 59. | Staples | 9.5% | 1.8%(+7.70)#59 | 3.1%(+6.40)#3,078 |
| 60. | Calumet | 9.4% | 1.8%(+7.60)#60 | 3.1%(+6.30)#3,159 |
| 61. | Hilltop | 9.3% | 1.8%(+7.50)#61 | 3.1%(+6.20)#3,193 |
| 62. | Pelican Rapids | 9.2% | 1.8%(+7.40)#62 | 3.1%(+6.10)#3,235 |
| 63. | Little Rock | 8.9% | 1.8%(+7.10)#63 | 3.1%(+5.80)#3,411 |
| 64. | Claremont | 8.9% | 1.8%(+7.10)#64 | 3.1%(+5.80)#3,417 |
| 65. | Browns Valley | 8.9% | 1.8%(+7.10)#65 | 3.1%(+5.80)#3,420 |
| 66. | Verndale | 8.7% | 1.8%(+6.90)#66 | 3.1%(+5.60)#3,532 |
| 67. | Eveleth | 8.4% | 1.8%(+6.60)#67 | 3.1%(+5.30)#3,668 |
| 68. | Watson | 8.3% | 1.8%(+6.50)#68 | 3.1%(+5.20)#3,747 |
| 69. | Gully | 8.3% | 1.8%(+6.50)#69 | 3.1%(+5.20)#3,758 |
| 70. | Badger | 8.1% | 1.8%(+6.30)#70 | 3.1%(+5.00)#3,864 |
| 71. | Echo | 8.1% | 1.8%(+6.30)#71 | 3.1%(+5.00)#3,871 |
| 72. | Cass Lake | 8.0% | 1.8%(+6.20)#72 | 3.1%(+4.90)#3,921 |
| 73. | Lansing | 7.9% | 1.8%(+6.10)#73 | 3.1%(+4.80)#4,004 |
| 74. | St Joseph | 7.8% | 1.8%(+6.00)#74 | 3.1%(+4.70)#4,019 |
| 75. | Willmar | 7.7% | 1.8%(+5.90)#75 | 3.1%(+4.60)#4,076 |
| 76. | Odessa | 7.7% | 1.8%(+5.90)#76 | 3.1%(+4.60)#4,142 |
| 77. | Montgomery | 7.5% | 1.8%(+5.70)#77 | 3.1%(+4.40)#4,227 |
| 78. | Belview | 7.5% | 1.8%(+5.70)#78 | 3.1%(+4.40)#4,269 |
| 79. | New London | 7.4% | 1.8%(+5.60)#79 | 3.1%(+4.30)#4,314 |
| 80. | Marshall | 7.3% | 1.8%(+5.50)#80 | 3.1%(+4.20)#4,367 |
| 81. | Virginia | 7.3% | 1.8%(+5.50)#81 | 3.1%(+4.20)#4,372 |
| 82. | Floodwood | 7.3% | 1.8%(+5.50)#82 | 3.1%(+4.20)#4,424 |
| 83. | Ada | 7.2% | 1.8%(+5.40)#83 | 3.1%(+4.10)#4,479 |
| 84. | Chandler | 7.1% | 1.8%(+5.30)#84 | 3.1%(+4.00)#4,575 |
| 85. | Deer River | 7.0% | 1.8%(+5.20)#85 | 3.1%(+3.90)#4,661 |
| 86. | Sacred Heart | 6.9% | 1.8%(+5.10)#86 | 3.1%(+3.80)#4,763 |
| 87. | Underwood | 6.9% | 1.8%(+5.10)#87 | 3.1%(+3.80)#4,768 |
| 88. | Milroy | 6.9% | 1.8%(+5.10)#88 | 3.1%(+3.80)#4,776 |
| 89. | Iona | 6.8% | 1.8%(+5.00)#89 | 3.1%(+3.70)#4,861 |
| 90. | La Salle | 6.7% | 1.8%(+4.90)#90 | 3.1%(+3.60)#4,951 |
| 91. | St Vincent | 6.7% | 1.8%(+4.90)#91 | 3.1%(+3.60)#4,953 |
| 92. | Waterville | 6.6% | 1.8%(+4.80)#92 | 3.1%(+3.50)#4,999 |
| 93. | Braham | 6.6% | 1.8%(+4.80)#93 | 3.1%(+3.50)#5,000 |
| 94. | Aitkin | 6.5% | 1.8%(+4.70)#94 | 3.1%(+3.40)#5,093 |
| 95. | Federal Dam | 6.5% | 1.8%(+4.70)#95 | 3.1%(+3.40)#5,148 |
| 96. | St James | 6.4% | 1.8%(+4.60)#96 | 3.1%(+3.30)#5,196 |
| 97. | Spring Park | 6.4% | 1.8%(+4.60)#97 | 3.1%(+3.30)#5,214 |
| 98. | Callaway | 6.3% | 1.8%(+4.50)#98 | 3.1%(+3.20)#5,347 |
| 99. | Pierz | 6.0% | 1.8%(+4.20)#99 | 3.1%(+2.90)#5,644 |
| 100. | Lyle | 6.0% | 1.8%(+4.20)#100 | 3.1%(+2.90)#5,678 |
Common Questions
What are the Top 10 Cities with the Highest Percentage of Families with Income Below $10,000 in Minnesota?
Top 10 Cities with the Highest Percentage of Families with Income Below $10,000 in Minnesota are:
#1
66.7%
#2
44.1%
#3
37.1%
#4
29.3%
#5
29.2%
#6
28.6%
#7
28.6%
#8
28.6%
#9
26.5%
#10
25.0%
What city has the Highest Percentage of Families with Income Below $10,000 in Minnesota?
McGrath has the Highest Percentage of Families with Income Below $10,000 in Minnesota with 66.7%.
What is the Percentage of Families with Income Below $10,000 in the State of Minnesota?
Percentage of Families with Income Below $10,000 in Minnesota is 1.8%.
What is the Percentage of Families with Income Below $10,000 in the United States?
Percentage of Families with Income Below $10,000 in the United States is 3.1%.