Saxon, SC
Saxon Map
Saxon Overview
4,171
TOTAL POPULATION
1,946
MALE POPULATION
2,225
FEMALE POPULATION
87.46
MALES / 100 FEMALES
114.34
FEMALES / 100 MALES
27.1
MEDIAN AGE
3.4
AVG FAMILY SIZE
2.8
AVG HOUSEHOLD SIZE
$13,759
PER CAPITA INCOME
$25,709
AVG FAMILY INCOME
$25,231
AVG HOUSEHOLD INCOME
64.7%
WAGE / INCOME GAP [ % ]
35.3¢/ $1
WAGE / INCOME GAP [ $ ]
0.49
INEQUALITY / GINI INDEX
1,779
LABOR FORCE [ PEOPLE ]
56.3%
PERCENT IN LABOR FORCE
11.6%
UNEMPLOYMENT RATE
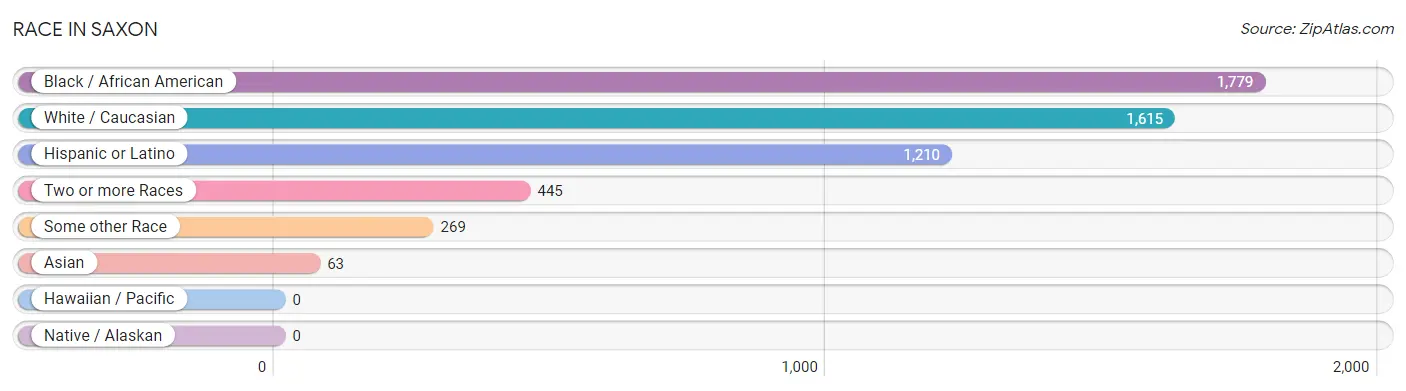
Race in Saxon
The most populous races in Saxon are Black / African American (1,779 | 42.6%), White / Caucasian (1,615 | 38.7%), and Hispanic or Latino (1,210 | 29.0%).
| Race | # Population | % Population |
| Asian | 63 | 1.5% |
| Black / African American | 1,779 | 42.6% |
| Hawaiian / Pacific | 0 | 0.0% |
| Hispanic or Latino | 1,210 | 29.0% |
| Native / Alaskan | 0 | 0.0% |
| White / Caucasian | 1,615 | 38.7% |
| Two or more Races | 445 | 10.7% |
| Some other Race | 269 | 6.5% |
| Total | 4,171 | 100.0% |
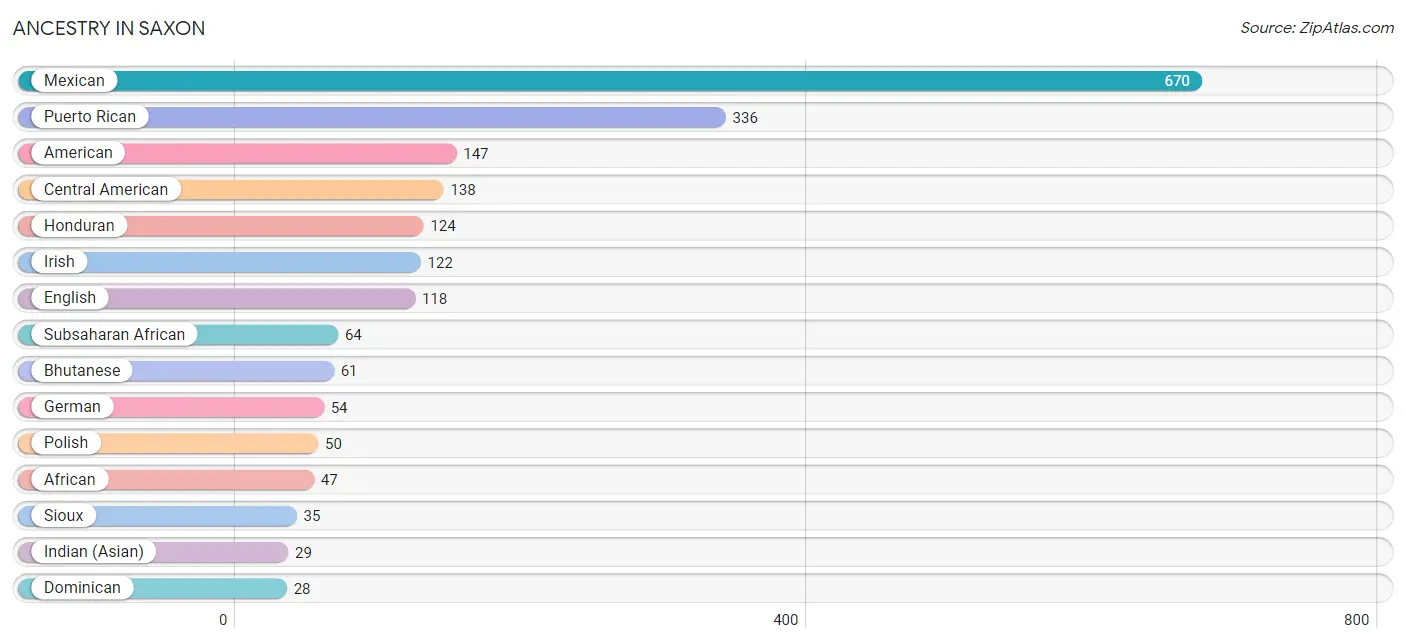
Ancestry in Saxon
The most populous ancestries reported in Saxon are Mexican (670 | 16.1%), Puerto Rican (336 | 8.1%), American (147 | 3.5%), Central American (138 | 3.3%), and Honduran (124 | 3.0%), together accounting for 33.9% of all Saxon residents.
| Ancestry | # Population | % Population |
| African | 47 | 1.1% |
| American | 147 | 3.5% |
| Bhutanese | 61 | 1.5% |
| Central American | 138 | 3.3% |
| Colombian | 16 | 0.4% |
| Dominican | 28 | 0.7% |
| English | 118 | 2.8% |
| Ethiopian | 6 | 0.1% |
| European | 7 | 0.2% |
| French | 12 | 0.3% |
| German | 54 | 1.3% |
| Guatemalan | 14 | 0.3% |
| Honduran | 124 | 3.0% |
| Hungarian | 3 | 0.1% |
| Indian (Asian) | 29 | 0.7% |
| Irish | 122 | 2.9% |
| Italian | 20 | 0.5% |
| Kenyan | 11 | 0.3% |
| Korean | 23 | 0.5% |
| Mexican | 670 | 16.1% |
| Pakistani | 8 | 0.2% |
| Polish | 50 | 1.2% |
| Puerto Rican | 336 | 8.1% |
| Russian | 2 | 0.1% |
| Scotch-Irish | 8 | 0.2% |
| Scottish | 4 | 0.1% |
| Seminole | 11 | 0.3% |
| Sioux | 35 | 0.8% |
| South American | 16 | 0.4% |
| Subsaharan African | 64 | 1.5% |
| Swedish | 7 | 0.2% | View All 31 Rows |
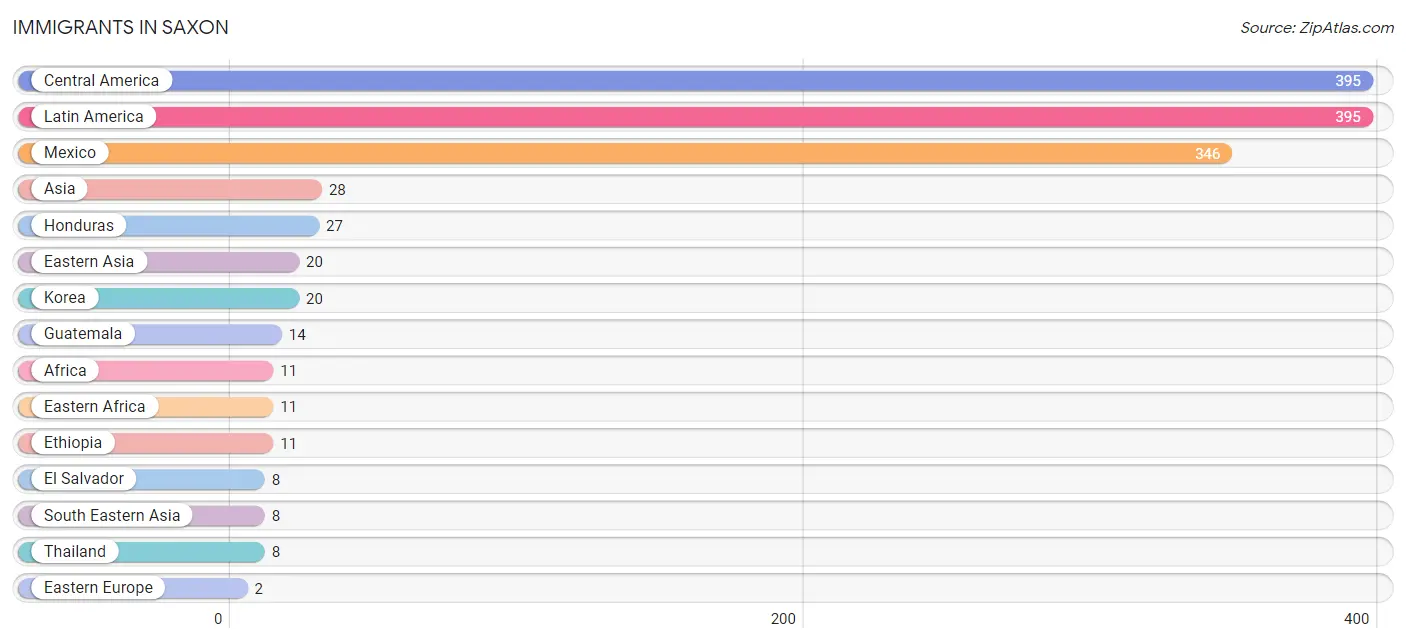
Immigrants in Saxon
The most numerous immigrant groups reported in Saxon came from Central America (395 | 9.5%), Latin America (395 | 9.5%), Mexico (346 | 8.3%), Asia (28 | 0.7%), and Honduras (27 | 0.6%), together accounting for 28.6% of all Saxon residents.
| Immigration Origin | # Population | % Population |
| Africa | 11 | 0.3% |
| Asia | 28 | 0.7% |
| Central America | 395 | 9.5% |
| Eastern Africa | 11 | 0.3% |
| Eastern Asia | 20 | 0.5% |
| Eastern Europe | 2 | 0.1% |
| El Salvador | 8 | 0.2% |
| Ethiopia | 11 | 0.3% |
| Europe | 2 | 0.1% |
| Guatemala | 14 | 0.3% |
| Honduras | 27 | 0.6% |
| Korea | 20 | 0.5% |
| Latin America | 395 | 9.5% |
| Mexico | 346 | 8.3% |
| Russia | 2 | 0.1% |
| South Eastern Asia | 8 | 0.2% |
| Thailand | 8 | 0.2% | View All 17 Rows |
Sex and Age in Saxon
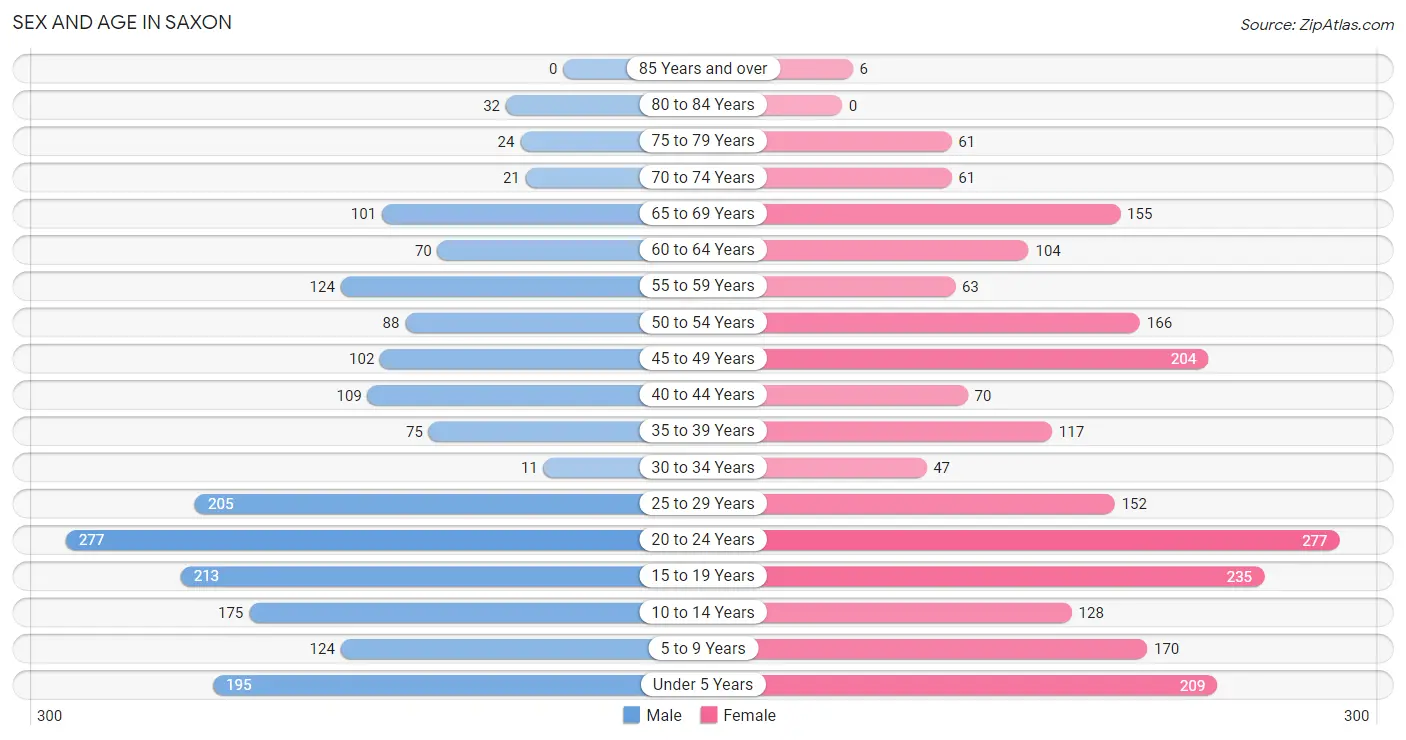
Sex and Age in Saxon
The most populous age groups in Saxon are 20 to 24 Years (277 | 14.2%) for men and 20 to 24 Years (277 | 12.4%) for women.
| Age Bracket | Male | Female |
| Under 5 Years | 195 (10.0%) | 209 (9.4%) |
| 5 to 9 Years | 124 (6.4%) | 170 (7.6%) |
| 10 to 14 Years | 175 (9.0%) | 128 (5.8%) |
| 15 to 19 Years | 213 (11.0%) | 235 (10.6%) |
| 20 to 24 Years | 277 (14.2%) | 277 (12.4%) |
| 25 to 29 Years | 205 (10.5%) | 152 (6.8%) |
| 30 to 34 Years | 11 (0.6%) | 47 (2.1%) |
| 35 to 39 Years | 75 (3.8%) | 117 (5.3%) |
| 40 to 44 Years | 109 (5.6%) | 70 (3.2%) |
| 45 to 49 Years | 102 (5.2%) | 204 (9.2%) |
| 50 to 54 Years | 88 (4.5%) | 166 (7.5%) |
| 55 to 59 Years | 124 (6.4%) | 63 (2.8%) |
| 60 to 64 Years | 70 (3.6%) | 104 (4.7%) |
| 65 to 69 Years | 101 (5.2%) | 155 (7.0%) |
| 70 to 74 Years | 21 (1.1%) | 61 (2.7%) |
| 75 to 79 Years | 24 (1.2%) | 61 (2.7%) |
| 80 to 84 Years | 32 (1.6%) | 0 (0.0%) |
| 85 Years and over | 0 (0.0%) | 6 (0.3%) |
| Total | 1,946 (100.0%) | 2,225 (100.0%) |
Families and Households in Saxon
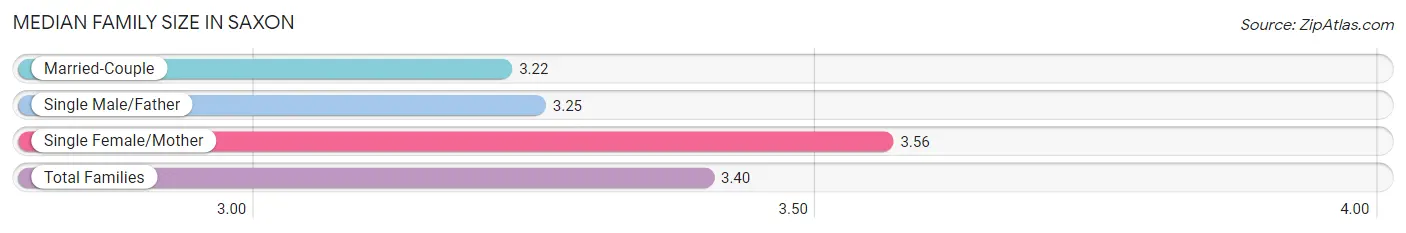
Median Family Size in Saxon
The median family size in Saxon is 3.40 persons per family, with single female/mother families (454 | 52.4%) accounting for the largest median family size of 3.56 persons per family. On the other hand, married-couple families (299 | 34.5%) represent the smallest median family size with 3.22 persons per family.
| Family Type | # Families | Family Size |
| Married-Couple | 299 (34.5%) | 3.22 |
| Single Male/Father | 113 (13.1%) | 3.25 |
| Single Female/Mother | 454 (52.4%) | 3.56 |
| Total Families | 866 (100.0%) | 3.40 |
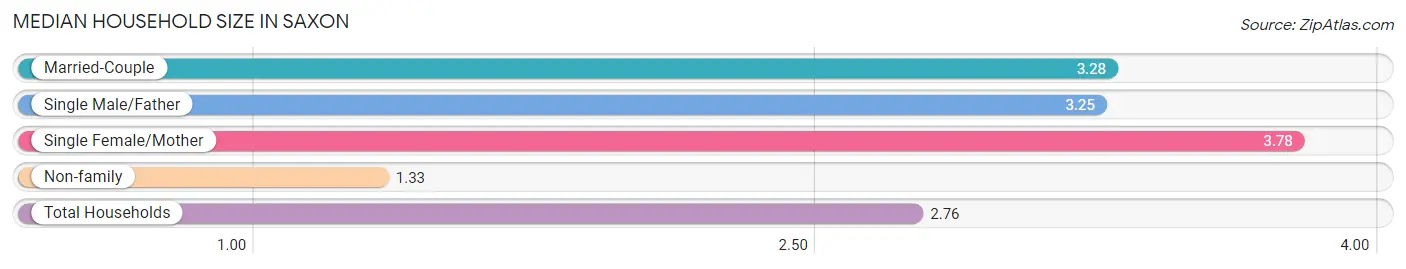
Median Household Size in Saxon
The median household size in Saxon is 2.76 persons per household, with single female/mother households (454 | 33.9%) accounting for the largest median household size of 3.78 persons per household. non-family households (474 | 35.4%) represent the smallest median household size with 1.33 persons per household.
| Household Type | # Households | Household Size |
| Married-Couple | 299 (22.3%) | 3.28 |
| Single Male/Father | 113 (8.4%) | 3.25 |
| Single Female/Mother | 454 (33.9%) | 3.78 |
| Non-family | 474 (35.4%) | 1.33 |
| Total Households | 1,340 (100.0%) | 2.76 |
Household Size by Marriage Status in Saxon
Out of a total of 1,340 households in Saxon, 866 (64.6%) are family households, while 474 (35.4%) are nonfamily households. The most numerous type of family households are 3-person households, comprising 278, and the most common type of nonfamily households are 1-person households, comprising 345.

| Household Size | Family Households | Nonfamily Households |
| 1-Person Households | - | 345 (25.8%) |
| 2-Person Households | 236 (17.6%) | 97 (7.2%) |
| 3-Person Households | 278 (20.7%) | 32 (2.4%) |
| 4-Person Households | 143 (10.7%) | 0 (0.0%) |
| 5-Person Households | 188 (14.0%) | 0 (0.0%) |
| 6-Person Households | 21 (1.6%) | 0 (0.0%) |
| 7+ Person Households | 0 (0.0%) | 0 (0.0%) |
| Total | 866 (64.6%) | 474 (35.4%) |
Female Fertility in Saxon
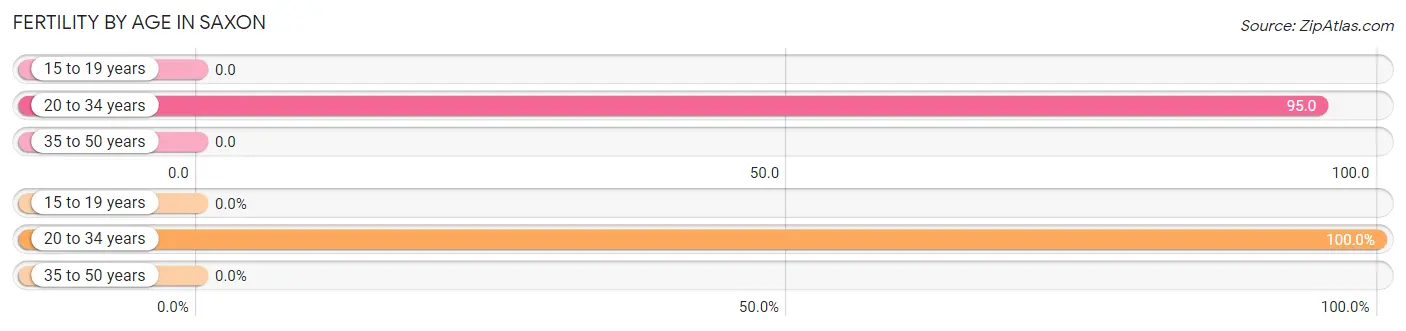
Fertility by Age in Saxon
Average fertility rate in Saxon is 41.0 births per 1,000 women. Women in the age bracket of 20 to 34 years have the highest fertility rate with 95.0 births per 1,000 women. Women in the age bracket of 20 to 34 years acount for 100.0% of all women with births.
| Age Bracket | Women with Births | Births / 1,000 Women |
| 15 to 19 years | 0 (0.0%) | 0.0 |
| 20 to 34 years | 45 (100.0%) | 95.0 |
| 35 to 50 years | 0 (0.0%) | 0.0 |
| Total | 45 (100.0%) | 41.0 |
Fertility by Age by Marriage Status in Saxon
24.4% of women with births (45) in Saxon are married. The highest percentage of unmarried women with births falls into 20 to 34 years age bracket with 75.6% of them unmarried at the time of birth, while the lowest percentage of unmarried women with births belong to 20 to 34 years age bracket with 75.6% of them unmarried.
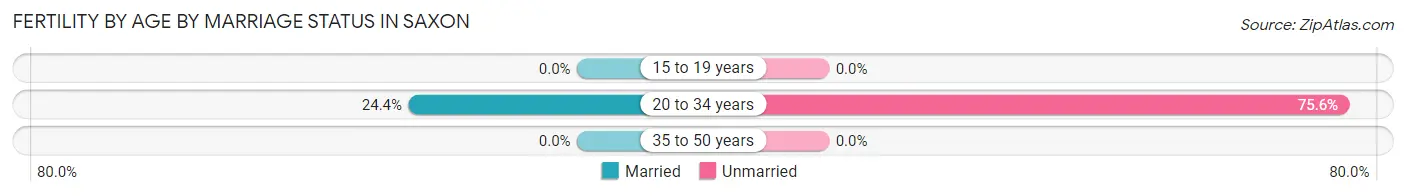
| Age Bracket | Married | Unmarried |
| 15 to 19 years | 0 (0.0%) | 0 (0.0%) |
| 20 to 34 years | 11 (24.4%) | 34 (75.6%) |
| 35 to 50 years | 0 (0.0%) | 0 (0.0%) |
| Total | 11 (24.4%) | 34 (75.6%) |
Fertility by Education in Saxon
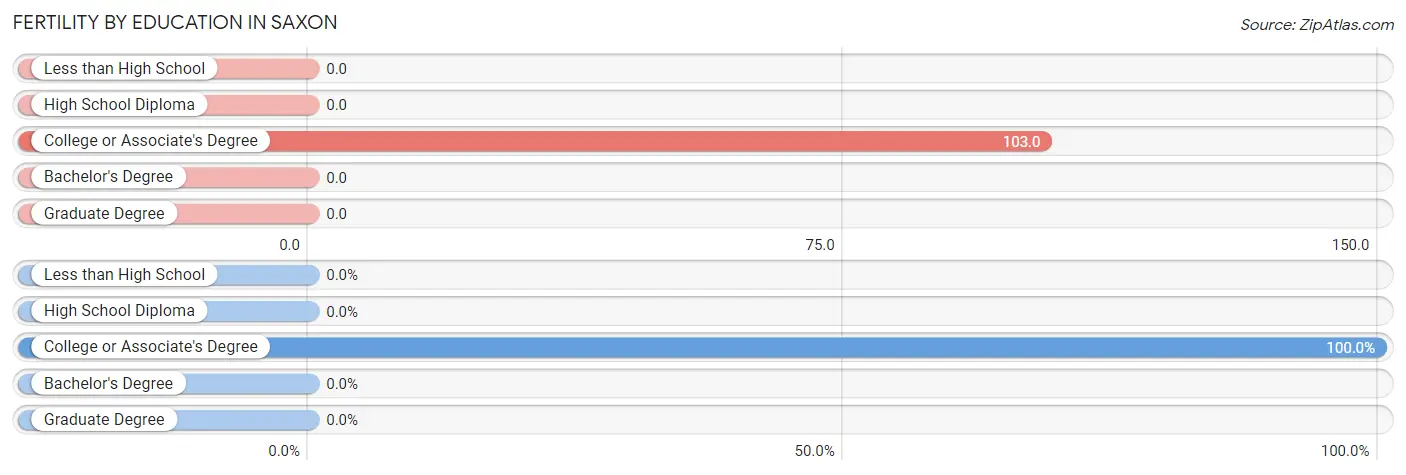
| Educational Attainment | Women with Births | Births / 1,000 Women |
| Less than High School | 0 (0.0%) | 0.0 |
| High School Diploma | 0 (0.0%) | 0.0 |
| College or Associate's Degree | 45 (100.0%) | 103.0 |
| Bachelor's Degree | 0 (0.0%) | 0.0 |
| Graduate Degree | 0 (0.0%) | 0.0 |
| Total | 45 (100.0%) | 41.0 |
Fertility by Education by Marriage Status in Saxon
75.6% of women with births in Saxon are unmarried. Women with the educational attainment of college or associate's degree are most likely to be married with 24.4% of them married at childbirth, while women with the educational attainment of college or associate's degree are least likely to be married with 75.6% of them unmarried at childbirth.
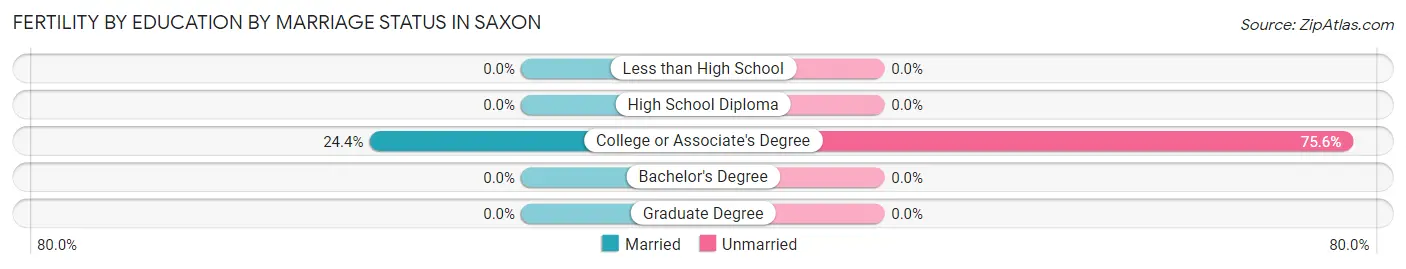
| Educational Attainment | Married | Unmarried |
| Less than High School | 0 (0.0%) | 0 (0.0%) |
| High School Diploma | 0 (0.0%) | 0 (0.0%) |
| College or Associate's Degree | 11 (24.4%) | 34 (75.6%) |
| Bachelor's Degree | 0 (0.0%) | 0 (0.0%) |
| Graduate Degree | 0 (0.0%) | 0 (0.0%) |
| Total | 11 (24.4%) | 34 (75.6%) |
Income in Saxon
Income Overview in Saxon
Per Capita Income in Saxon is $13,759, while median incomes of families and households are $25,709 and $25,231 respectively.
| Characteristic | Number | Measure |
| Per Capita Income | 4,171 | $13,759 |
| Median Family Income | 866 | $25,709 |
| Mean Family Income | 866 | $42,830 |
| Median Household Income | 1,340 | $25,231 |
| Mean Household Income | 1,340 | $38,903 |
| Income Deficit | 866 | $0 |
| Wage / Income Gap (%) | 4,171 | 64.69% |
| Wage / Income Gap ($) | 4,171 | 35.31¢ per $1 |
| Gini / Inequality Index | 4,171 | 0.49 |
Earnings by Sex in Saxon
Average Earnings in Saxon are $15,652, $27,125 for men and $9,578 for women, a difference of 64.7%.

| Sex | Number | Average Earnings |
| Male | 931 (48.6%) | $27,125 |
| Female | 983 (51.4%) | $9,578 |
| Total | 1,914 (100.0%) | $15,652 |
Earnings by Sex by Income Bracket in Saxon
The most common earnings brackets in Saxon are $30,000 to $34,999 for men (123 | 13.2%) and $7,500 to $9,999 for women (216 | 22.0%).
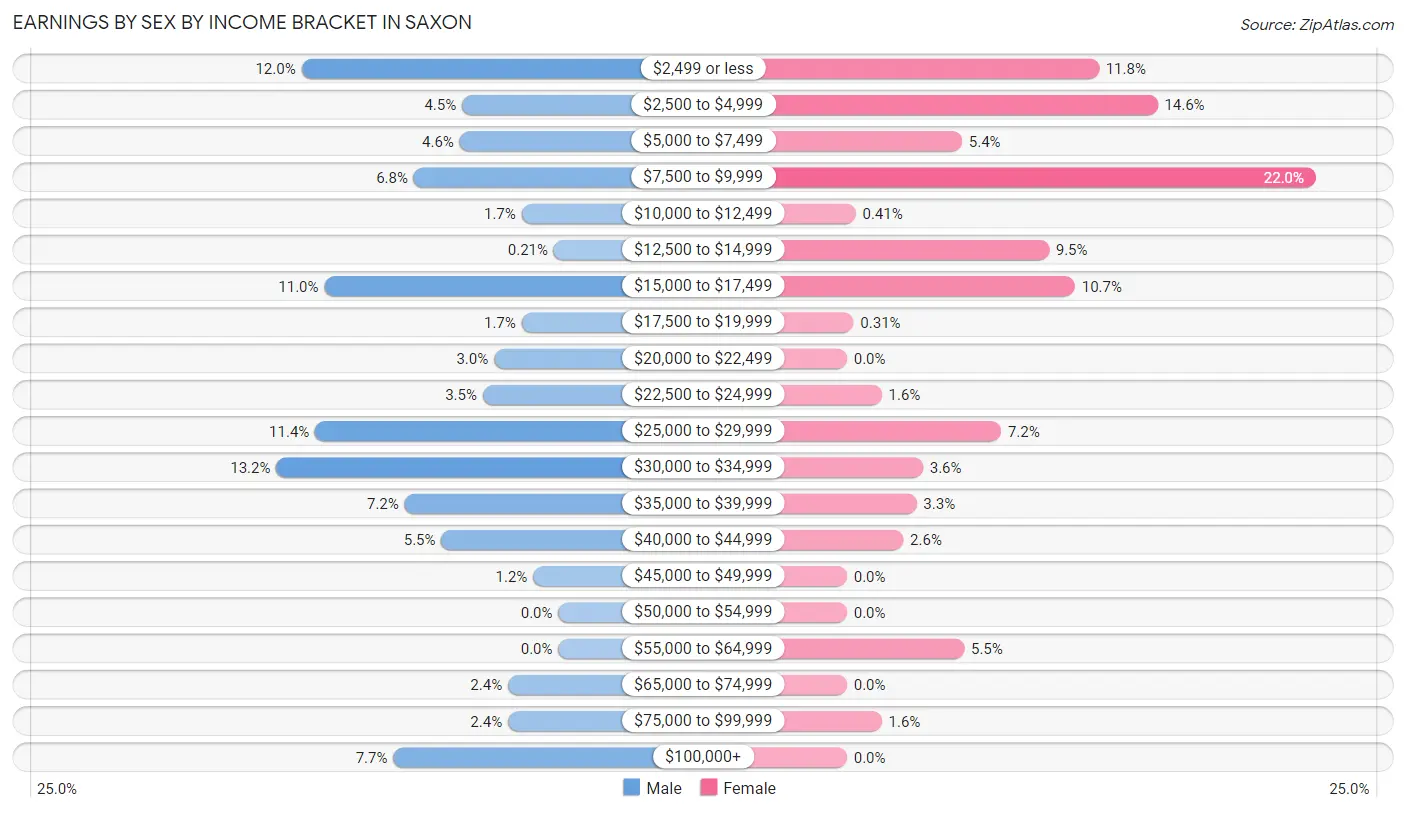
| Income | Male | Female |
| $2,499 or less | 112 (12.0%) | 116 (11.8%) |
| $2,500 to $4,999 | 42 (4.5%) | 143 (14.5%) |
| $5,000 to $7,499 | 43 (4.6%) | 53 (5.4%) |
| $7,500 to $9,999 | 63 (6.8%) | 216 (22.0%) |
| $10,000 to $12,499 | 16 (1.7%) | 4 (0.4%) |
| $12,500 to $14,999 | 2 (0.2%) | 93 (9.5%) |
| $15,000 to $17,499 | 102 (11.0%) | 105 (10.7%) |
| $17,500 to $19,999 | 16 (1.7%) | 3 (0.3%) |
| $20,000 to $22,499 | 28 (3.0%) | 0 (0.0%) |
| $22,500 to $24,999 | 33 (3.5%) | 16 (1.6%) |
| $25,000 to $29,999 | 106 (11.4%) | 71 (7.2%) |
| $30,000 to $34,999 | 123 (13.2%) | 35 (3.6%) |
| $35,000 to $39,999 | 67 (7.2%) | 32 (3.3%) |
| $40,000 to $44,999 | 51 (5.5%) | 26 (2.6%) |
| $45,000 to $49,999 | 11 (1.2%) | 0 (0.0%) |
| $50,000 to $54,999 | 0 (0.0%) | 0 (0.0%) |
| $55,000 to $64,999 | 0 (0.0%) | 54 (5.5%) |
| $65,000 to $74,999 | 22 (2.4%) | 0 (0.0%) |
| $75,000 to $99,999 | 22 (2.4%) | 16 (1.6%) |
| $100,000+ | 72 (7.7%) | 0 (0.0%) |
| Total | 931 (100.0%) | 983 (100.0%) |
Earnings by Sex by Educational Attainment in Saxon
Average earnings in Saxon are $32,550 for men and $15,488 for women, a difference of 52.4%. Men with an educational attainment of bachelor's degree enjoy the highest average annual earnings of $38,641, while those with college or associate's degree education earn the least with $28,086. Women with an educational attainment of less than high school earn the most with the average annual earnings of $35,990, while those with high school diploma education have the smallest earnings of $16,298.
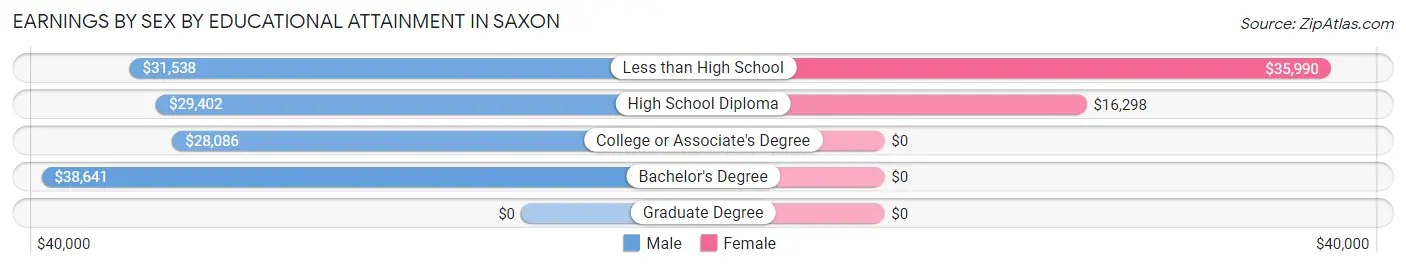
| Educational Attainment | Male Income | Female Income |
| Less than High School | $31,538 | $35,990 |
| High School Diploma | $29,402 | $16,298 |
| College or Associate's Degree | $28,086 | $0 |
| Bachelor's Degree | $38,641 | $0 |
| Graduate Degree | - | - |
| Total | $32,550 | $15,488 |
Family Income in Saxon
Family Income Brackets in Saxon
According to the Saxon family income data, there are 237 families falling into the $15,000 to $24,999 income range, which is the most common income bracket and makes up 27.4% of all families. Conversely, the $10,000 to $14,999 income bracket is the least frequent group with only 11 families (1.3%) belonging to this category.
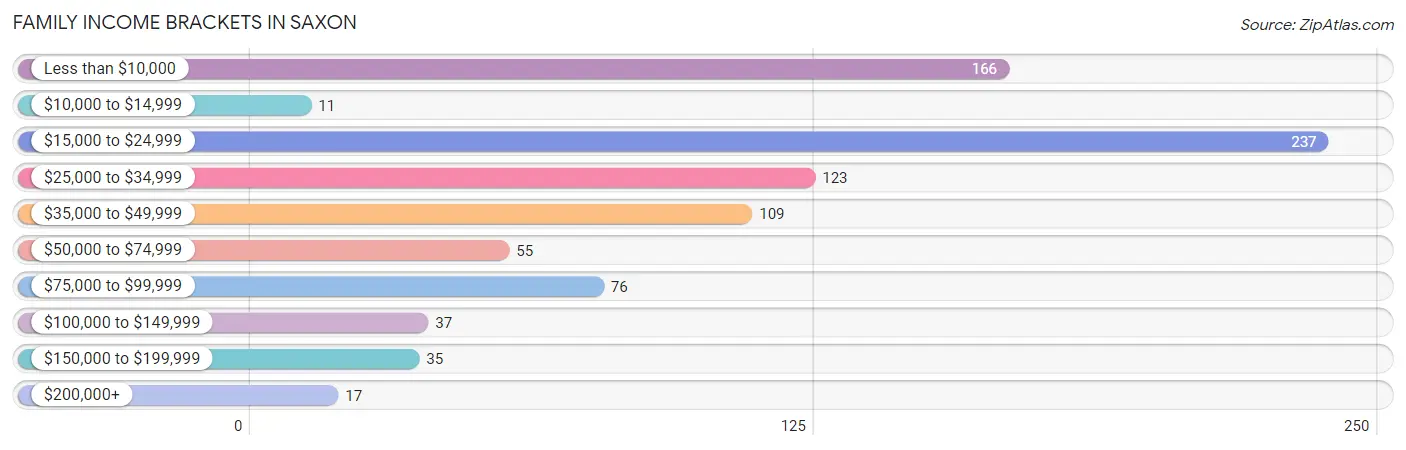
| Income Bracket | # Families | % Families |
| Less than $10,000 | 166 | 19.2% |
| $10,000 to $14,999 | 11 | 1.3% |
| $15,000 to $24,999 | 237 | 27.4% |
| $25,000 to $34,999 | 123 | 14.2% |
| $35,000 to $49,999 | 109 | 12.6% |
| $50,000 to $74,999 | 55 | 6.4% |
| $75,000 to $99,999 | 76 | 8.8% |
| $100,000 to $149,999 | 37 | 4.3% |
| $150,000 to $199,999 | 35 | 4.0% |
| $200,000+ | 17 | 2.0% |
Family Income by Famaliy Size in Saxon
5-person families (152 | 17.5%) account for the highest median family income in Saxon with $37,931 per family, while 2-person families (262 | 30.2%) have the highest median income of $11,081 per family member.
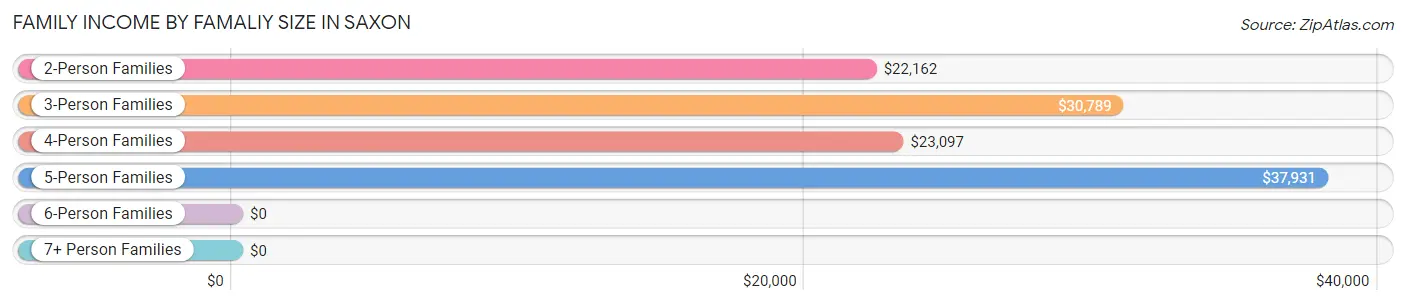
| Income Bracket | # Families | Median Income |
| 2-Person Families | 262 (30.2%) | $22,162 |
| 3-Person Families | 276 (31.9%) | $30,789 |
| 4-Person Families | 168 (19.4%) | $23,097 |
| 5-Person Families | 152 (17.5%) | $37,931 |
| 6-Person Families | 8 (0.9%) | $0 |
| 7+ Person Families | 0 (0.0%) | $0 |
| Total | 866 (100.0%) | $25,709 |
Family Income by Number of Earners in Saxon
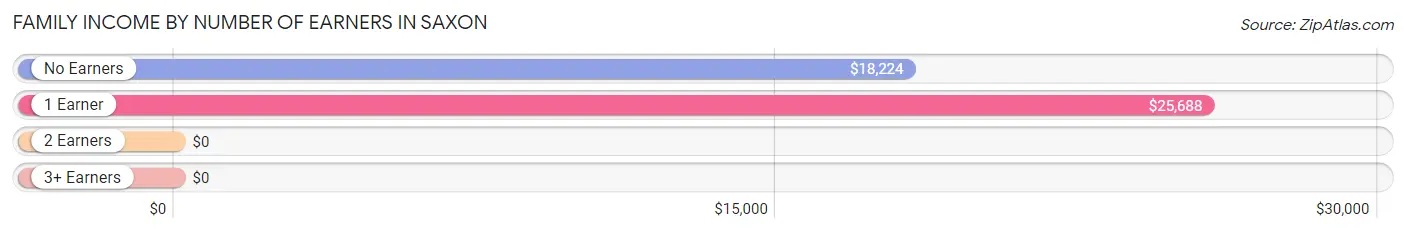
| Number of Earners | # Families | Median Income |
| No Earners | 167 (19.3%) | $18,224 |
| 1 Earner | 397 (45.8%) | $25,688 |
| 2 Earners | 255 (29.4%) | $0 |
| 3+ Earners | 47 (5.4%) | $0 |
| Total | 866 (100.0%) | $25,709 |
Household Income in Saxon
Household Income Brackets in Saxon
With 311 households falling in the category, the $15,000 to $24,999 income range is the most frequent in Saxon, accounting for 23.2% of all households. In contrast, only 17 households (1.3%) fall into the $200,000+ income bracket, making it the least populous group.
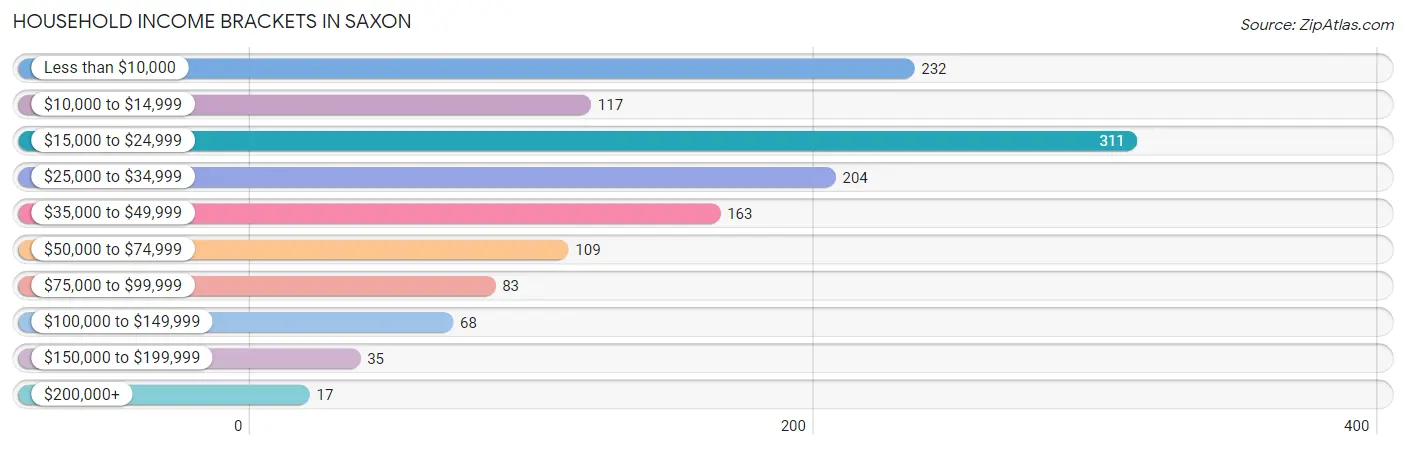
| Income Bracket | # Households | % Households |
| Less than $10,000 | 232 | 17.3% |
| $10,000 to $14,999 | 117 | 8.7% |
| $15,000 to $24,999 | 311 | 23.2% |
| $25,000 to $34,999 | 204 | 15.2% |
| $35,000 to $49,999 | 163 | 12.2% |
| $50,000 to $74,999 | 109 | 8.1% |
| $75,000 to $99,999 | 83 | 6.2% |
| $100,000 to $149,999 | 68 | 5.1% |
| $150,000 to $199,999 | 35 | 2.6% |
| $200,000+ | 17 | 1.3% |
Household Income by Householder Age in Saxon
The median household income in Saxon is $25,231, with the highest median household income of $25,824 found in the 25 to 44 years age bracket for the primary householder. A total of 408 households (30.4%) fall into this category. Meanwhile, the 15 to 24 years age bracket for the primary householder has the lowest median household income of $0, with 55 households (4.1%) in this group.
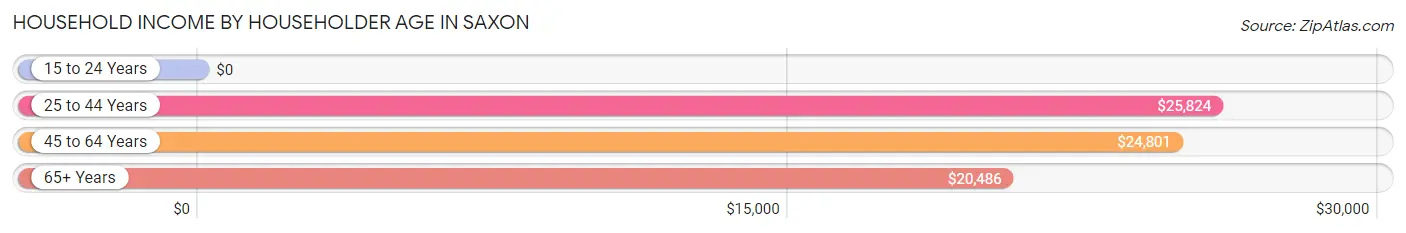
| Income Bracket | # Households | Median Income |
| 15 to 24 Years | 55 (4.1%) | $0 |
| 25 to 44 Years | 408 (30.4%) | $25,824 |
| 45 to 64 Years | 606 (45.2%) | $24,801 |
| 65+ Years | 271 (20.2%) | $20,486 |
| Total | 1,340 (100.0%) | $25,231 |
Poverty in Saxon
Income Below Poverty by Sex and Age in Saxon
With 34.0% poverty level for males and 60.5% for females among the residents of Saxon, 12 to 14 year old males and under 5 year old females are the most vulnerable to poverty, with 96 males (75.0%) and 209 females (100.0%) in their respective age groups living below the poverty level.
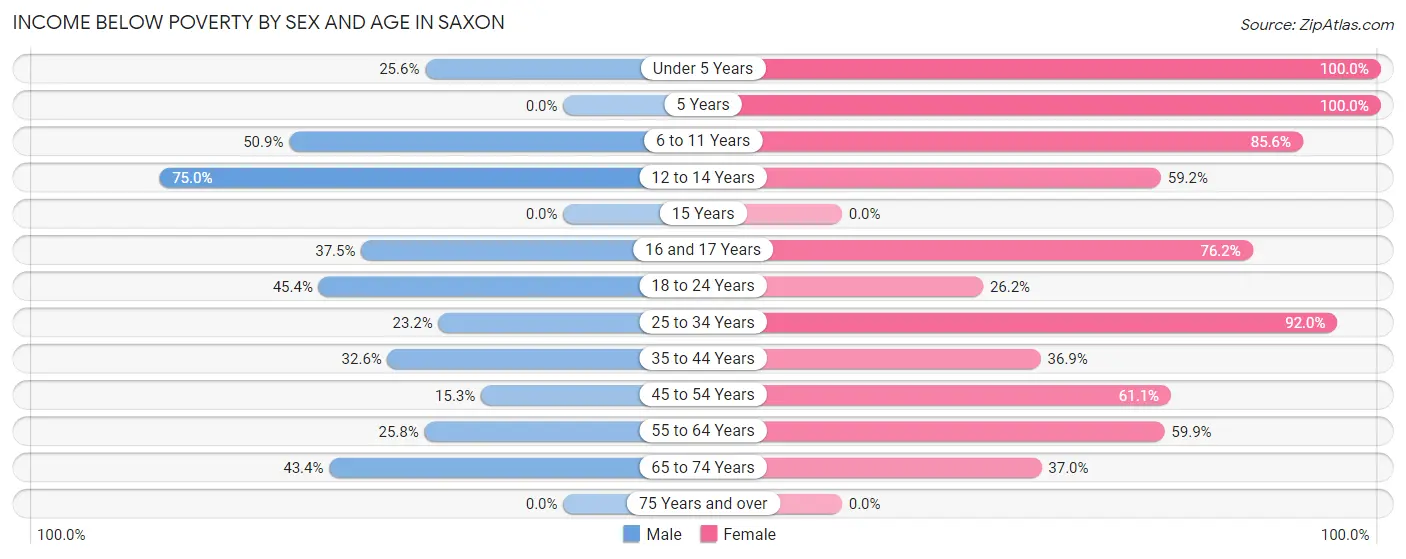
| Age Bracket | Male | Female |
| Under 5 Years | 50 (25.6%) | 209 (100.0%) |
| 5 Years | 0 (0.0%) | 21 (100.0%) |
| 6 to 11 Years | 87 (50.9%) | 172 (85.6%) |
| 12 to 14 Years | 96 (75.0%) | 45 (59.2%) |
| 15 Years | 0 (0.0%) | 0 (0.0%) |
| 16 and 17 Years | 9 (37.5%) | 77 (76.2%) |
| 18 to 24 Years | 74 (45.4%) | 60 (26.2%) |
| 25 to 34 Years | 50 (23.2%) | 183 (92.0%) |
| 35 to 44 Years | 60 (32.6%) | 69 (36.9%) |
| 45 to 54 Years | 29 (15.3%) | 226 (61.1%) |
| 55 to 64 Years | 50 (25.8%) | 100 (59.9%) |
| 65 to 74 Years | 53 (43.4%) | 80 (37.0%) |
| 75 Years and over | 0 (0.0%) | 0 (0.0%) |
| Total | 558 (34.0%) | 1,242 (60.5%) |
Income Above Poverty by Sex and Age in Saxon
According to the poverty statistics in Saxon, males aged 75 years and over and females aged 15 years are the age groups that are most secure financially, with 100.0% of males and 100.0% of females in these age groups living above the poverty line.
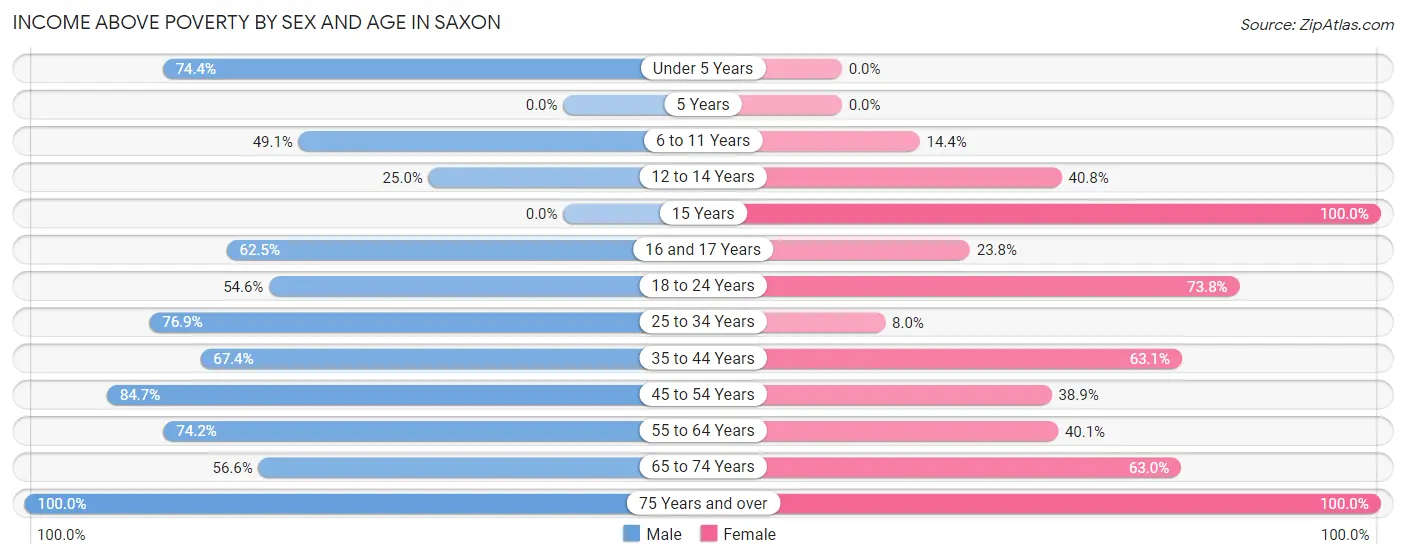
| Age Bracket | Male | Female |
| Under 5 Years | 145 (74.4%) | 0 (0.0%) |
| 5 Years | 0 (0.0%) | 0 (0.0%) |
| 6 to 11 Years | 84 (49.1%) | 29 (14.4%) |
| 12 to 14 Years | 32 (25.0%) | 31 (40.8%) |
| 15 Years | 0 (0.0%) | 11 (100.0%) |
| 16 and 17 Years | 15 (62.5%) | 24 (23.8%) |
| 18 to 24 Years | 89 (54.6%) | 169 (73.8%) |
| 25 to 34 Years | 166 (76.8%) | 16 (8.0%) |
| 35 to 44 Years | 124 (67.4%) | 118 (63.1%) |
| 45 to 54 Years | 161 (84.7%) | 144 (38.9%) |
| 55 to 64 Years | 144 (74.2%) | 67 (40.1%) |
| 65 to 74 Years | 69 (56.6%) | 136 (63.0%) |
| 75 Years and over | 56 (100.0%) | 67 (100.0%) |
| Total | 1,085 (66.0%) | 812 (39.5%) |
Income Below Poverty Among Married-Couple Families in Saxon
The poverty statistics for married-couple families in Saxon show that 8.4% or 25 of the total 299 families live below the poverty line. Families with no children have the highest poverty rate of 12.5%, comprising of 14 families. On the other hand, families with 3 or 4 children have the lowest poverty rate of 0.0%, which includes 0 families.
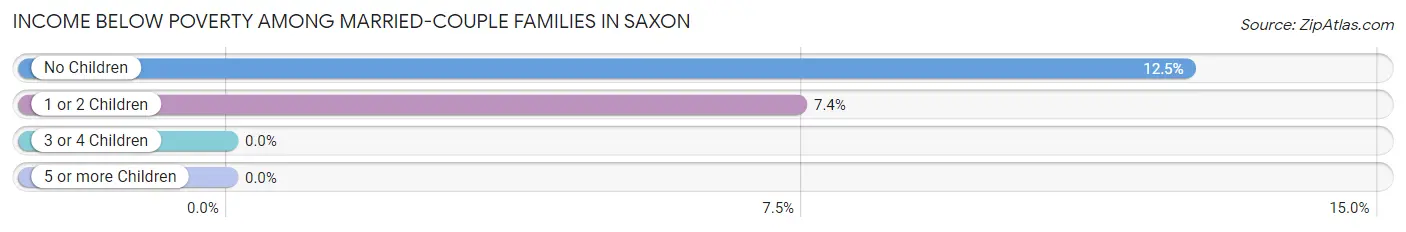
| Children | Above Poverty | Below Poverty |
| No Children | 98 (87.5%) | 14 (12.5%) |
| 1 or 2 Children | 137 (92.6%) | 11 (7.4%) |
| 3 or 4 Children | 39 (100.0%) | 0 (0.0%) |
| 5 or more Children | 0 (0.0%) | 0 (0.0%) |
| Total | 274 (91.6%) | 25 (8.4%) |
Income Below Poverty Among Single-Parent Households in Saxon
According to the poverty data in Saxon, 35.4% or 40 single-father households and 68.7% or 312 single-mother households are living below the poverty line. Among single-father households, those with 1 or 2 children have the highest poverty rate, with 33 households (66.0%) experiencing poverty. Likewise, among single-mother households, those with 3 or 4 children have the highest poverty rate, with 98 households (83.1%) falling below the poverty line.
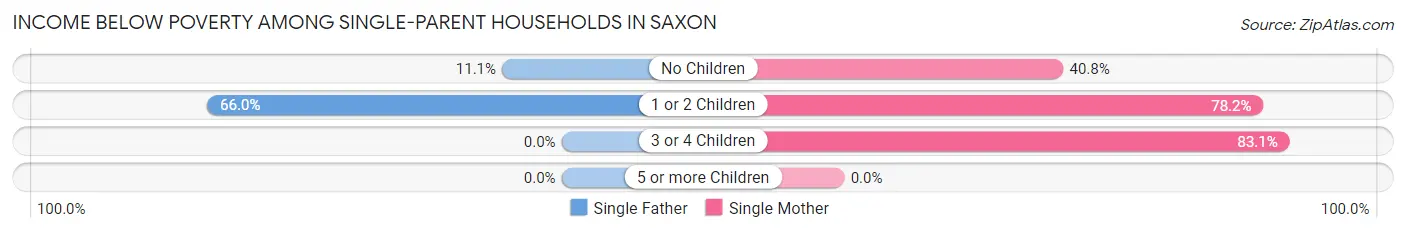
| Children | Single Father | Single Mother |
| No Children | 7 (11.1%) | 53 (40.8%) |
| 1 or 2 Children | 33 (66.0%) | 161 (78.2%) |
| 3 or 4 Children | 0 (0.0%) | 98 (83.1%) |
| 5 or more Children | 0 (0.0%) | 0 (0.0%) |
| Total | 40 (35.4%) | 312 (68.7%) |
Income Below Poverty Among Married-Couple vs Single-Parent Households in Saxon
The poverty data for Saxon shows that 25 of the married-couple family households (8.4%) and 352 of the single-parent households (62.1%) are living below the poverty level. Within the married-couple family households, those with no children have the highest poverty rate, with 14 households (12.5%) falling below the poverty line. Among the single-parent households, those with 3 or 4 children have the highest poverty rate, with 98 household (83.1%) living below poverty.

| Children | Married-Couple Families | Single-Parent Households |
| No Children | 14 (12.5%) | 60 (31.1%) |
| 1 or 2 Children | 11 (7.4%) | 194 (75.8%) |
| 3 or 4 Children | 0 (0.0%) | 98 (83.1%) |
| 5 or more Children | 0 (0.0%) | 0 (0.0%) |
| Total | 25 (8.4%) | 352 (62.1%) |
Employment Characteristics in Saxon
Employment by Class of Employer in Saxon
Among the 1,561 employed individuals in Saxon, private company employees (1,340 | 85.8%), state government employees (58 | 3.7%), and local government employees (54 | 3.5%) make up the most common classes of employment.
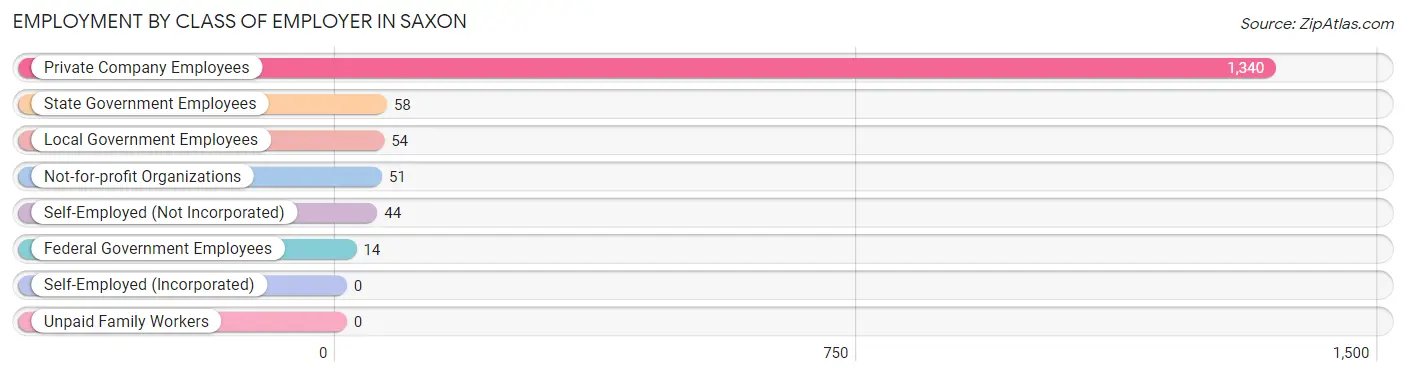
| Employer Class | # Employees | % Employees |
| Private Company Employees | 1,340 | 85.8% |
| Self-Employed (Incorporated) | 0 | 0.0% |
| Self-Employed (Not Incorporated) | 44 | 2.8% |
| Not-for-profit Organizations | 51 | 3.3% |
| Local Government Employees | 54 | 3.5% |
| State Government Employees | 58 | 3.7% |
| Federal Government Employees | 14 | 0.9% |
| Unpaid Family Workers | 0 | 0.0% |
| Total | 1,561 | 100.0% |
Employment Status by Age in Saxon
According to the labor force statistics for Saxon, out of the total population over 16 years of age (3,159), 56.3% or 1,779 individuals are in the labor force, with 11.6% or 206 of them unemployed. The age group with the highest labor force participation rate is 25 to 29 years, with 91.6% or 327 individuals in the labor force. Within the labor force, the 25 to 29 years age range has the highest percentage of unemployed individuals, with 22.0% or 72 of them being unemployed.
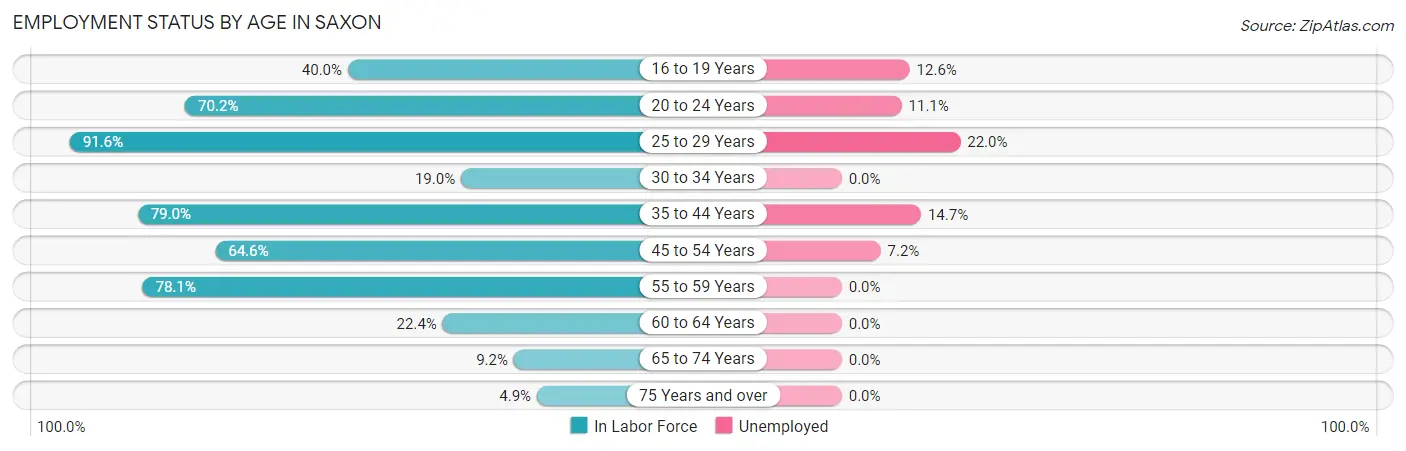
| Age Bracket | In Labor Force | Unemployed |
| 16 to 19 Years | 175 (40.0%) | 22 (12.6%) |
| 20 to 24 Years | 389 (70.2%) | 43 (11.1%) |
| 25 to 29 Years | 327 (91.6%) | 72 (22.0%) |
| 30 to 34 Years | 11 (19.0%) | 0 (0.0%) |
| 35 to 44 Years | 293 (79.0%) | 43 (14.7%) |
| 45 to 54 Years | 362 (64.6%) | 26 (7.2%) |
| 55 to 59 Years | 146 (78.1%) | 0 (0.0%) |
| 60 to 64 Years | 39 (22.4%) | 0 (0.0%) |
| 65 to 74 Years | 31 (9.2%) | 0 (0.0%) |
| 75 Years and over | 6 (4.9%) | 0 (0.0%) |
| Total | 1,779 (56.3%) | 206 (11.6%) |
Employment Status by Educational Attainment in Saxon
According to labor force statistics for Saxon, 69.0% of individuals (1,178) out of the total population between 25 and 64 years of age (1,707) are in the labor force, with 12.0% or 141 of them being unemployed. The group with the highest labor force participation rate are those with the educational attainment of bachelor's degree or higher, with 100.0% or 211 individuals in the labor force. Within the labor force, individuals with bachelor's degree or higher education have the highest percentage of unemployment, with 28.4% or 60 of them being unemployed.
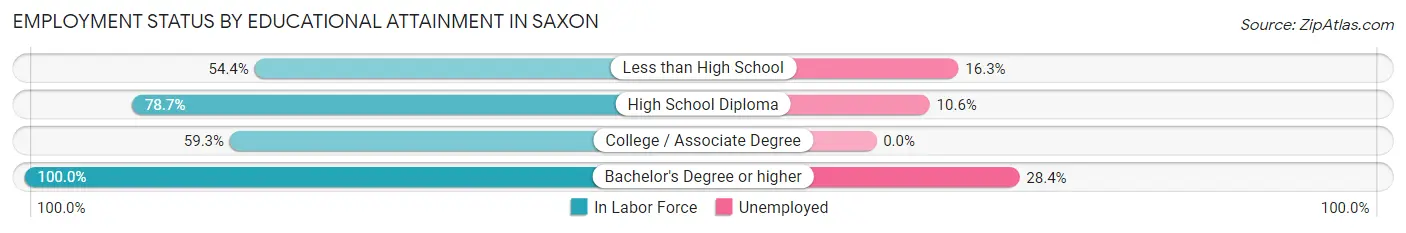
| Educational Attainment | In Labor Force | Unemployed |
| Less than High School | 233 (54.4%) | 70 (16.3%) |
| High School Diploma | 407 (78.7%) | 55 (10.6%) |
| College / Associate Degree | 327 (59.3%) | 0 (0.0%) |
| Bachelor's Degree or higher | 211 (100.0%) | 60 (28.4%) |
| Total | 1,178 (69.0%) | 205 (12.0%) |
Employment Occupations by Sex in Saxon
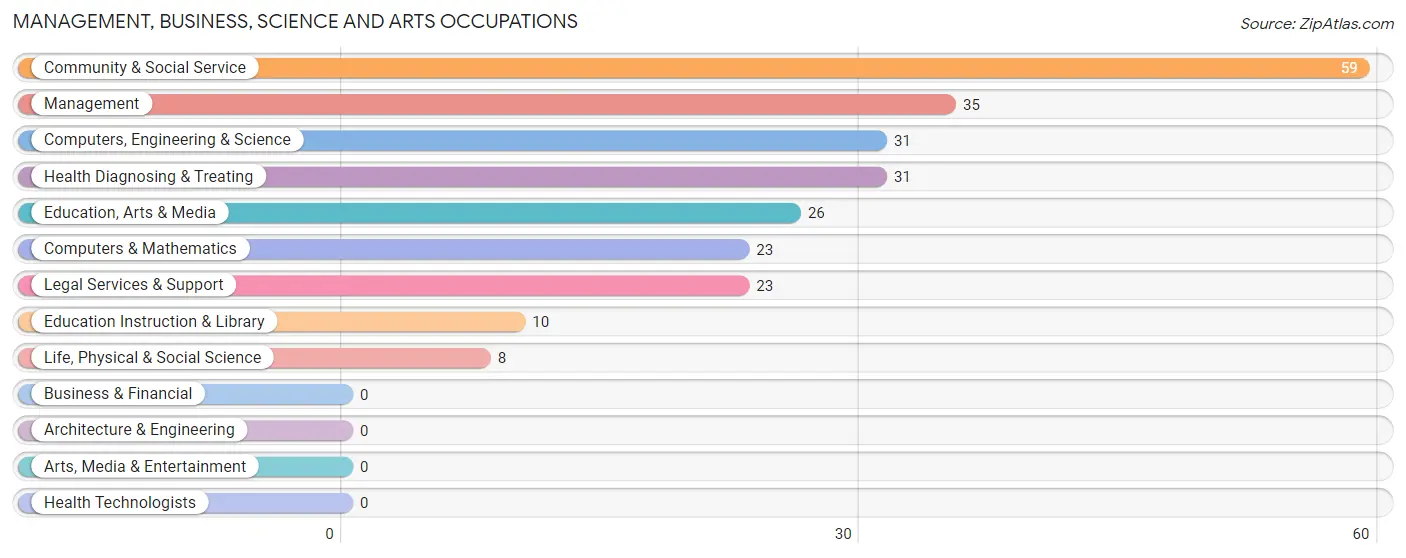
Management, Business, Science and Arts Occupations
The most common Management, Business, Science and Arts occupations in Saxon are Community & Social Service (59 | 3.7%), Management (35 | 2.2%), Computers, Engineering & Science (31 | 2.0%), Health Diagnosing & Treating (31 | 2.0%), and Education, Arts & Media (26 | 1.7%).
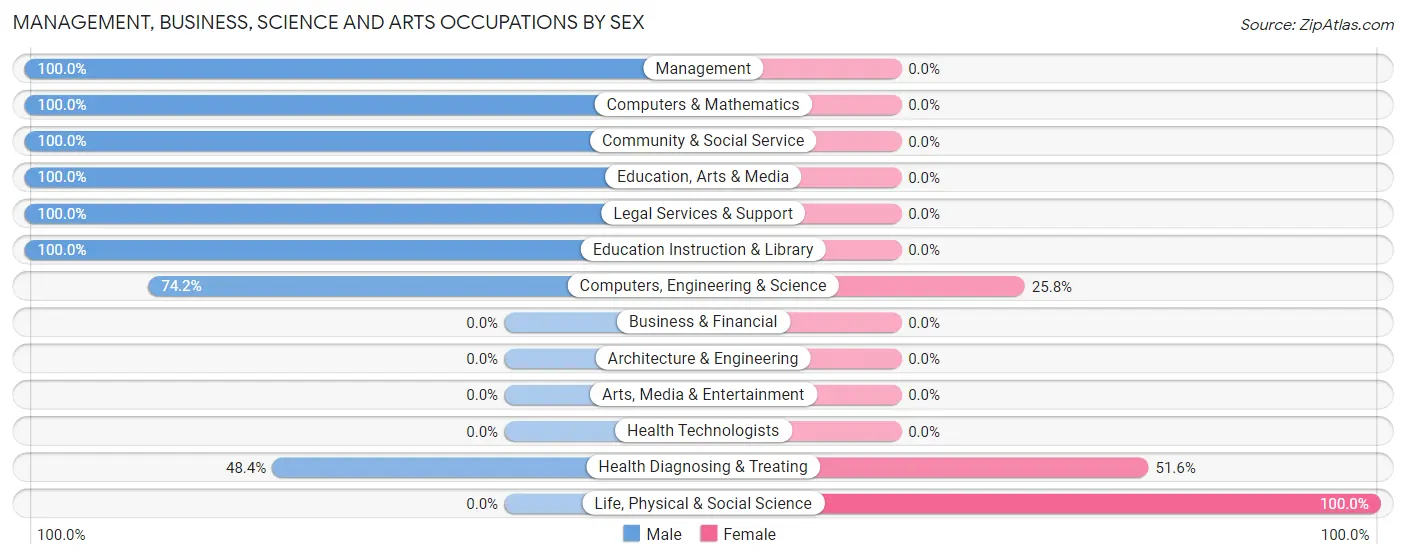
Management, Business, Science and Arts Occupations by Sex
Within the Management, Business, Science and Arts occupations in Saxon, the most male-oriented occupations are Management (100.0%), Computers & Mathematics (100.0%), and Community & Social Service (100.0%), while the most female-oriented occupations are Life, Physical & Social Science (100.0%), Health Diagnosing & Treating (51.6%), and Computers, Engineering & Science (25.8%).
| Occupation | Male | Female |
| Management | 35 (100.0%) | 0 (0.0%) |
| Business & Financial | 0 (0.0%) | 0 (0.0%) |
| Computers, Engineering & Science | 23 (74.2%) | 8 (25.8%) |
| Computers & Mathematics | 23 (100.0%) | 0 (0.0%) |
| Architecture & Engineering | 0 (0.0%) | 0 (0.0%) |
| Life, Physical & Social Science | 0 (0.0%) | 8 (100.0%) |
| Community & Social Service | 59 (100.0%) | 0 (0.0%) |
| Education, Arts & Media | 26 (100.0%) | 0 (0.0%) |
| Legal Services & Support | 23 (100.0%) | 0 (0.0%) |
| Education Instruction & Library | 10 (100.0%) | 0 (0.0%) |
| Arts, Media & Entertainment | 0 (0.0%) | 0 (0.0%) |
| Health Diagnosing & Treating | 15 (48.4%) | 16 (51.6%) |
| Health Technologists | 0 (0.0%) | 0 (0.0%) |
| Total (Category) | 132 (84.6%) | 24 (15.4%) |
| Total (Overall) | 791 (50.3%) | 782 (49.7%) |
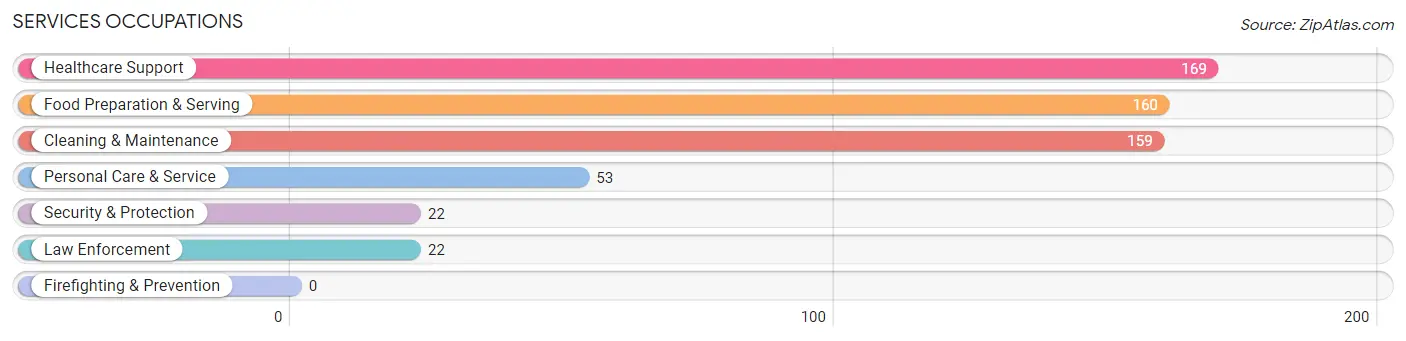
Services Occupations
The most common Services occupations in Saxon are Healthcare Support (169 | 10.7%), Food Preparation & Serving (160 | 10.2%), Cleaning & Maintenance (159 | 10.1%), Personal Care & Service (53 | 3.4%), and Security & Protection (22 | 1.4%).
Services Occupations by Sex
Within the Services occupations in Saxon, the most male-oriented occupations are Security & Protection (100.0%), Law Enforcement (100.0%), and Cleaning & Maintenance (86.8%), while the most female-oriented occupations are Healthcare Support (100.0%), Food Preparation & Serving (61.3%), and Personal Care & Service (52.8%).
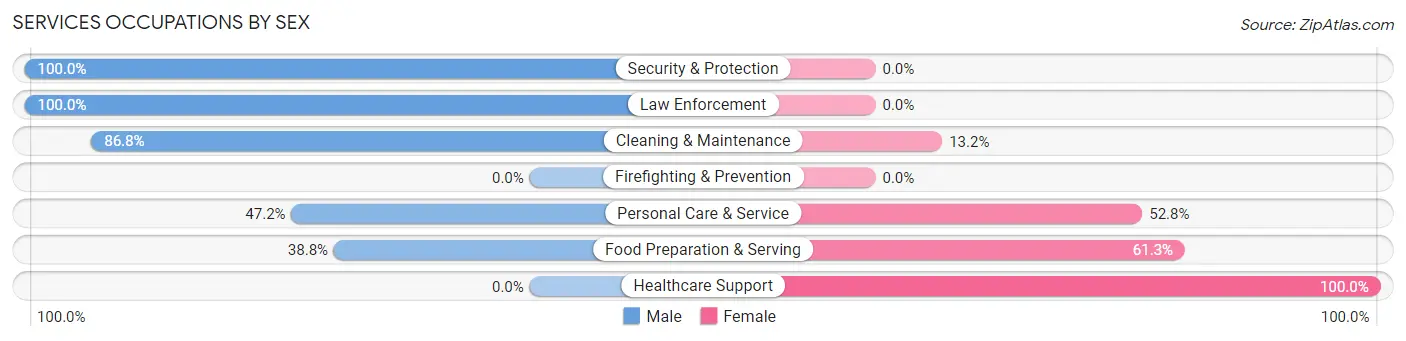
| Occupation | Male | Female |
| Healthcare Support | 0 (0.0%) | 169 (100.0%) |
| Security & Protection | 22 (100.0%) | 0 (0.0%) |
| Firefighting & Prevention | 0 (0.0%) | 0 (0.0%) |
| Law Enforcement | 22 (100.0%) | 0 (0.0%) |
| Food Preparation & Serving | 62 (38.8%) | 98 (61.3%) |
| Cleaning & Maintenance | 138 (86.8%) | 21 (13.2%) |
| Personal Care & Service | 25 (47.2%) | 28 (52.8%) |
| Total (Category) | 247 (43.9%) | 316 (56.1%) |
| Total (Overall) | 791 (50.3%) | 782 (49.7%) |
Sales and Office Occupations
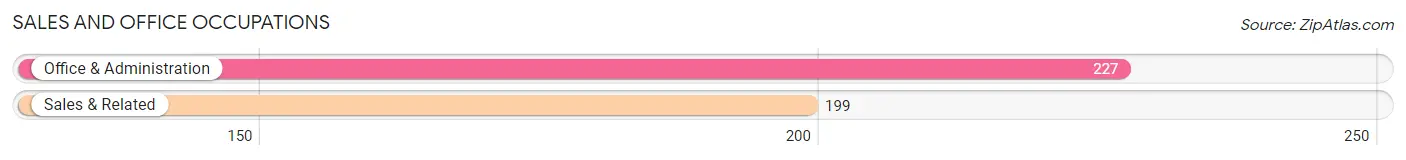
The most common Sales and Office occupations in Saxon are Office & Administration (227 | 14.4%), and Sales & Related (199 | 12.7%).
Sales and Office Occupations by Sex
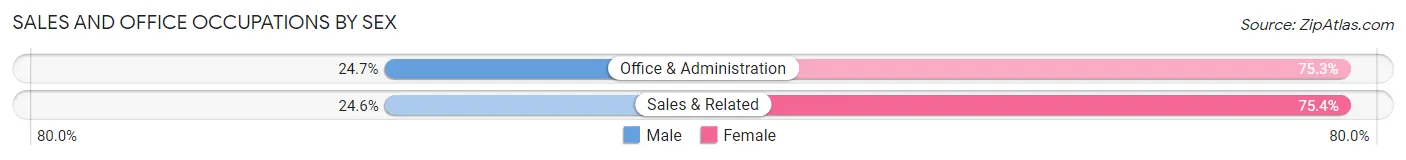
| Occupation | Male | Female |
| Sales & Related | 49 (24.6%) | 150 (75.4%) |
| Office & Administration | 56 (24.7%) | 171 (75.3%) |
| Total (Category) | 105 (24.6%) | 321 (75.3%) |
| Total (Overall) | 791 (50.3%) | 782 (49.7%) |
Natural Resources, Construction and Maintenance Occupations
The most common Natural Resources, Construction and Maintenance occupations in Saxon are Construction & Extraction (78 | 5.0%), Installation, Maintenance & Repair (44 | 2.8%), and Farming, Fishing & Forestry (35 | 2.2%).
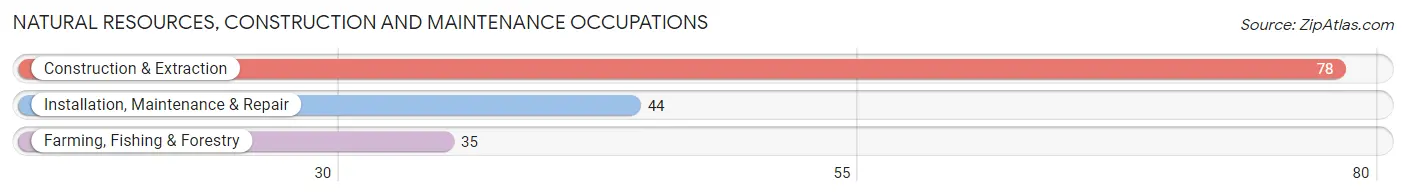
Natural Resources, Construction and Maintenance Occupations by Sex
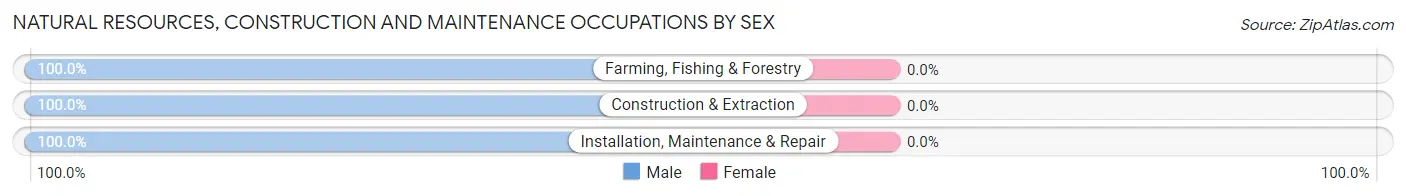
| Occupation | Male | Female |
| Farming, Fishing & Forestry | 35 (100.0%) | 0 (0.0%) |
| Construction & Extraction | 78 (100.0%) | 0 (0.0%) |
| Installation, Maintenance & Repair | 44 (100.0%) | 0 (0.0%) |
| Total (Category) | 157 (100.0%) | 0 (0.0%) |
| Total (Overall) | 791 (50.3%) | 782 (49.7%) |
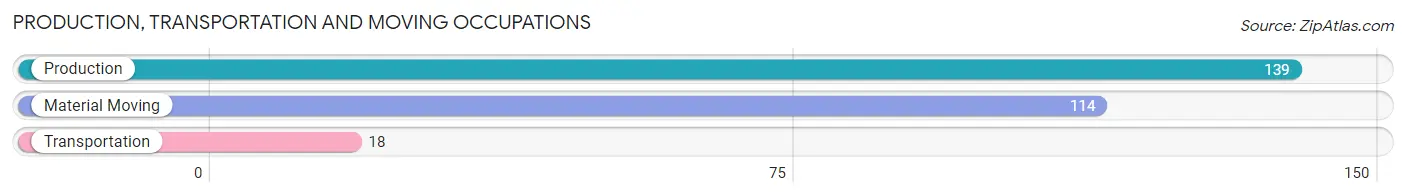
Production, Transportation and Moving Occupations
The most common Production, Transportation and Moving occupations in Saxon are Production (139 | 8.8%), Material Moving (114 | 7.2%), and Transportation (18 | 1.1%).
Production, Transportation and Moving Occupations by Sex
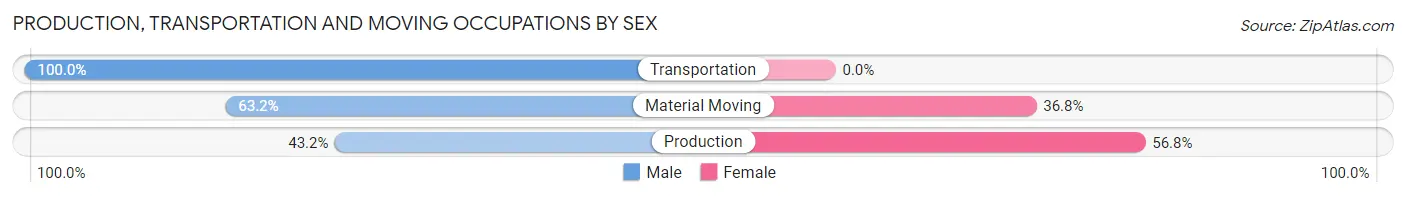
| Occupation | Male | Female |
| Production | 60 (43.2%) | 79 (56.8%) |
| Transportation | 18 (100.0%) | 0 (0.0%) |
| Material Moving | 72 (63.2%) | 42 (36.8%) |
| Total (Category) | 150 (55.3%) | 121 (44.7%) |
| Total (Overall) | 791 (50.3%) | 782 (49.7%) |
Employment Industries by Sex in Saxon
Employment Industries in Saxon
The major employment industries in Saxon include Manufacturing (290 | 18.4%), Health Care & Social Assistance (227 | 14.4%), Accommodation & Food Services (152 | 9.7%), Educational Services (128 | 8.1%), and Transportation & Warehousing (126 | 8.0%).

Employment Industries by Sex in Saxon
The Saxon industries that see more men than women are Agriculture, Fishing & Hunting (100.0%), Construction (100.0%), and Real Estate, Rental & Leasing (100.0%), whereas the industries that tend to have a higher number of women are Wholesale Trade (100.0%), Professional & Scientific (100.0%), and Health Care & Social Assistance (93.4%).
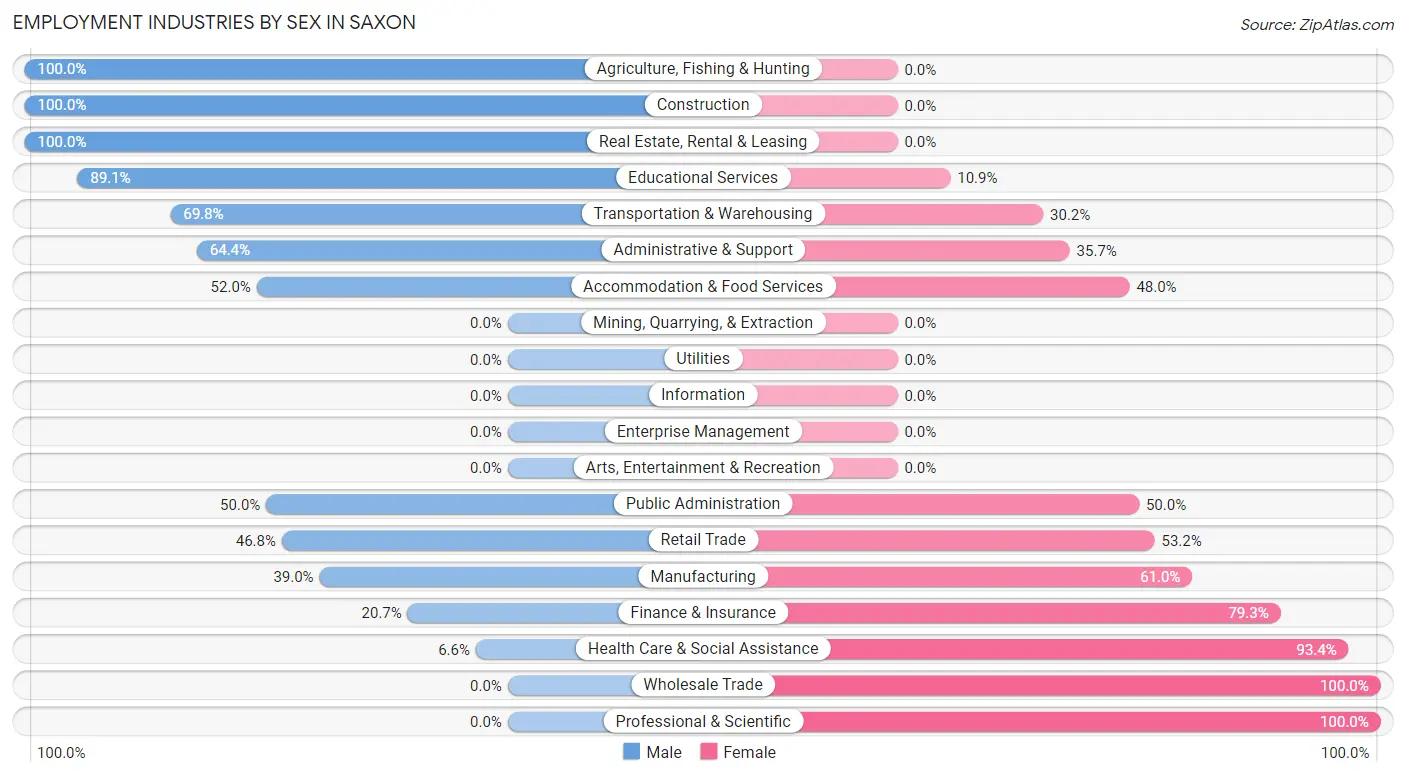
| Industry | Male | Female |
| Agriculture, Fishing & Hunting | 35 (100.0%) | 0 (0.0%) |
| Mining, Quarrying, & Extraction | 0 (0.0%) | 0 (0.0%) |
| Construction | 124 (100.0%) | 0 (0.0%) |
| Manufacturing | 113 (39.0%) | 177 (61.0%) |
| Wholesale Trade | 0 (0.0%) | 24 (100.0%) |
| Retail Trade | 58 (46.8%) | 66 (53.2%) |
| Transportation & Warehousing | 88 (69.8%) | 38 (30.2%) |
| Utilities | 0 (0.0%) | 0 (0.0%) |
| Information | 0 (0.0%) | 0 (0.0%) |
| Finance & Insurance | 23 (20.7%) | 88 (79.3%) |
| Real Estate, Rental & Leasing | 40 (100.0%) | 0 (0.0%) |
| Professional & Scientific | 0 (0.0%) | 12 (100.0%) |
| Enterprise Management | 0 (0.0%) | 0 (0.0%) |
| Administrative & Support | 74 (64.3%) | 41 (35.6%) |
| Educational Services | 114 (89.1%) | 14 (10.9%) |
| Health Care & Social Assistance | 15 (6.6%) | 212 (93.4%) |
| Arts, Entertainment & Recreation | 0 (0.0%) | 0 (0.0%) |
| Accommodation & Food Services | 79 (52.0%) | 73 (48.0%) |
| Public Administration | 22 (50.0%) | 22 (50.0%) |
| Total | 791 (50.3%) | 782 (49.7%) |
Education in Saxon
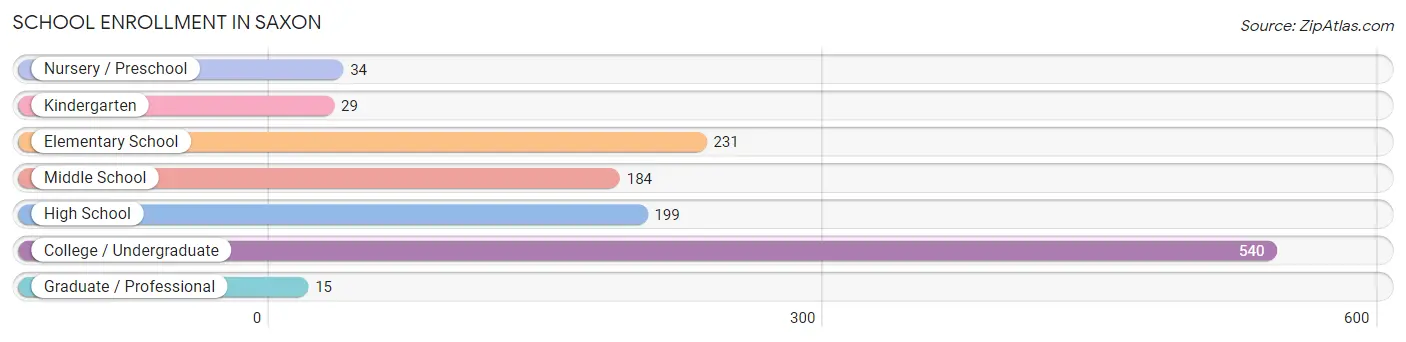
School Enrollment in Saxon
The most common levels of schooling among the 1,232 students in Saxon are college / undergraduate (540 | 43.8%), elementary school (231 | 18.8%), and high school (199 | 16.2%).
| School Level | # Students | % Students |
| Nursery / Preschool | 34 | 2.8% |
| Kindergarten | 29 | 2.4% |
| Elementary School | 231 | 18.8% |
| Middle School | 184 | 14.9% |
| High School | 199 | 16.2% |
| College / Undergraduate | 540 | 43.8% |
| Graduate / Professional | 15 | 1.2% |
| Total | 1,232 | 100.0% |
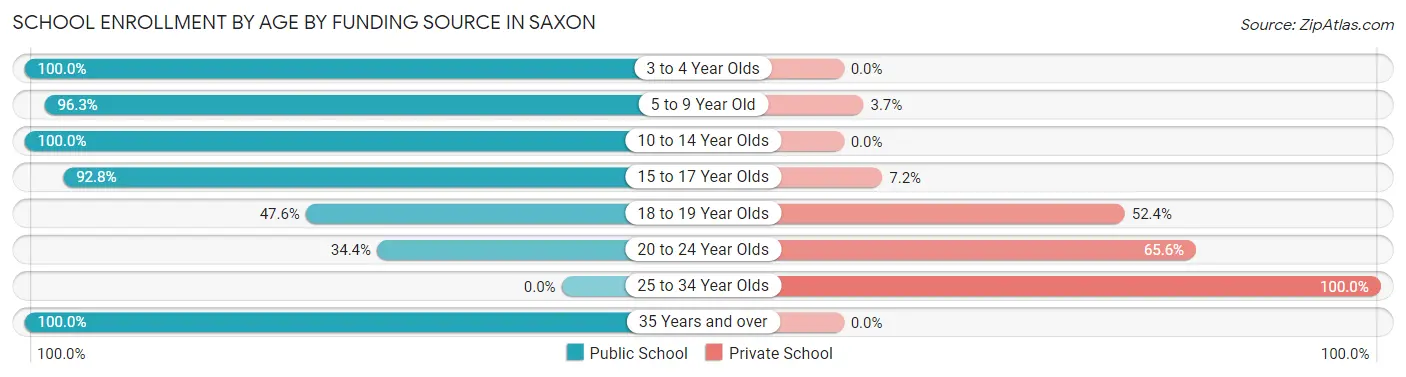
School Enrollment by Age by Funding Source in Saxon
Out of a total of 1,232 students who are enrolled in schools in Saxon, 341 (27.7%) attend a private institution, while the remaining 891 (72.3%) are enrolled in public schools. The age group of 25 to 34 year olds has the highest likelihood of being enrolled in private schools, with 15 (100.0% in the age bracket) enrolled. Conversely, the age group of 3 to 4 year olds has the lowest likelihood of being enrolled in a private school, with 34 (100.0% in the age bracket) attending a public institution.
| Age Bracket | Public School | Private School |
| 3 to 4 Year Olds | 34 (100.0%) | 0 (0.0%) |
| 5 to 9 Year Old | 208 (96.3%) | 8 (3.7%) |
| 10 to 14 Year Olds | 296 (100.0%) | 0 (0.0%) |
| 15 to 17 Year Olds | 116 (92.8%) | 9 (7.2%) |
| 18 to 19 Year Olds | 111 (47.6%) | 122 (52.4%) |
| 20 to 24 Year Olds | 98 (34.4%) | 187 (65.6%) |
| 25 to 34 Year Olds | 0 (0.0%) | 15 (100.0%) |
| 35 Years and over | 28 (100.0%) | 0 (0.0%) |
| Total | 891 (72.3%) | 341 (27.7%) |
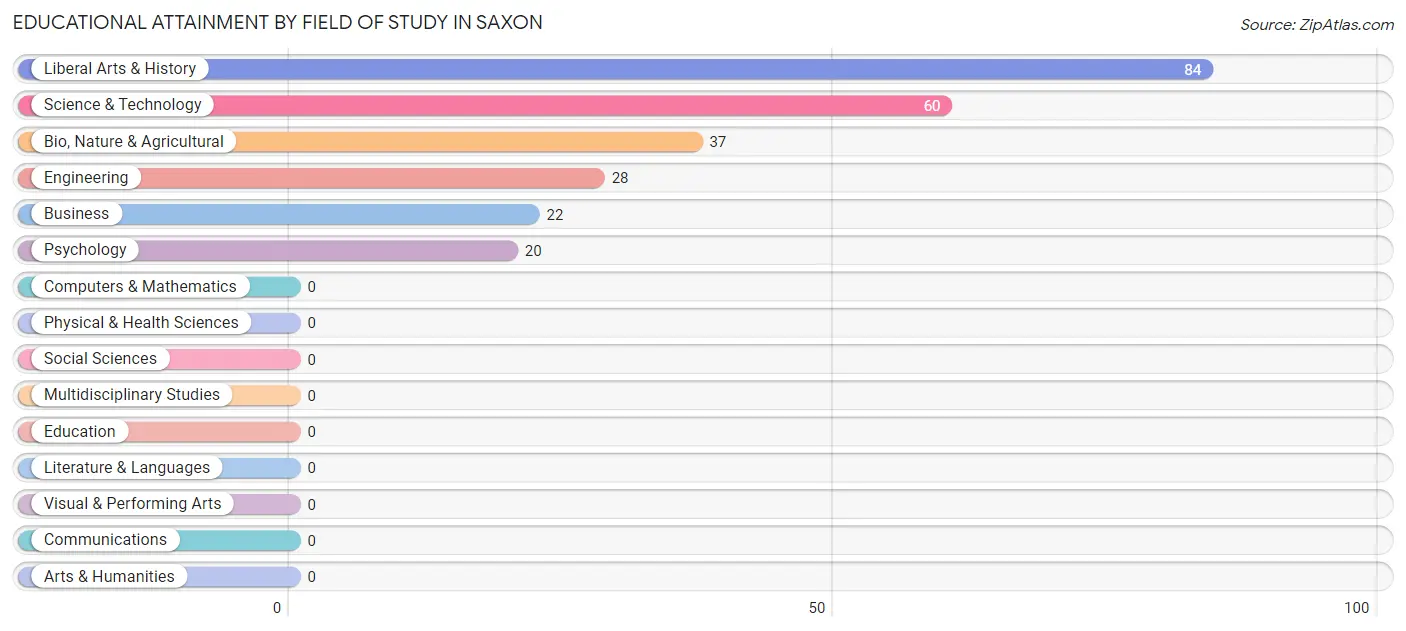
Educational Attainment by Field of Study in Saxon
Liberal arts & history (84 | 33.5%), science & technology (60 | 23.9%), bio, nature & agricultural (37 | 14.7%), engineering (28 | 11.2%), and business (22 | 8.8%) are the most common fields of study among 251 individuals in Saxon who have obtained a bachelor's degree or higher.
| Field of Study | # Graduates | % Graduates |
| Computers & Mathematics | 0 | 0.0% |
| Bio, Nature & Agricultural | 37 | 14.7% |
| Physical & Health Sciences | 0 | 0.0% |
| Psychology | 20 | 8.0% |
| Social Sciences | 0 | 0.0% |
| Engineering | 28 | 11.2% |
| Multidisciplinary Studies | 0 | 0.0% |
| Science & Technology | 60 | 23.9% |
| Business | 22 | 8.8% |
| Education | 0 | 0.0% |
| Literature & Languages | 0 | 0.0% |
| Liberal Arts & History | 84 | 33.5% |
| Visual & Performing Arts | 0 | 0.0% |
| Communications | 0 | 0.0% |
| Arts & Humanities | 0 | 0.0% |
| Total | 251 | 100.0% |
Transportation & Commute in Saxon
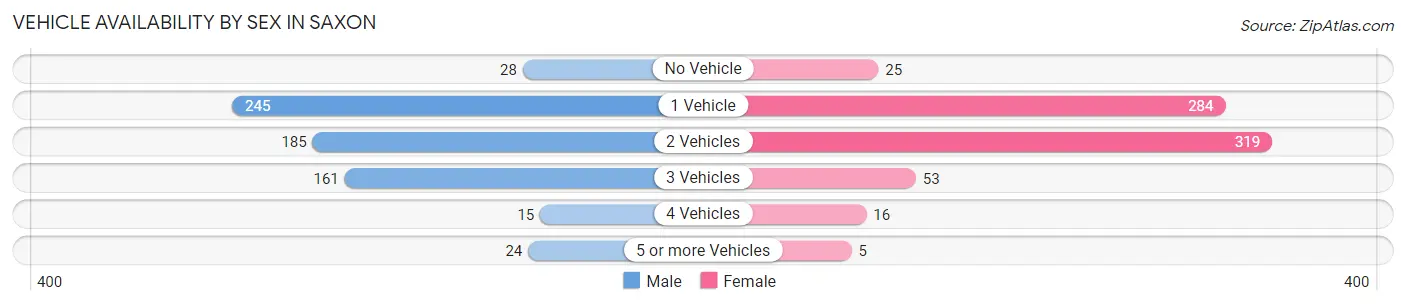
Vehicle Availability by Sex in Saxon
The most prevalent vehicle ownership categories in Saxon are males with 1 vehicle (245, accounting for 37.2%) and females with 1 vehicle (284, making up 34.9%).
| Vehicles Available | Male | Female |
| No Vehicle | 28 (4.3%) | 25 (3.6%) |
| 1 Vehicle | 245 (37.2%) | 284 (40.5%) |
| 2 Vehicles | 185 (28.1%) | 319 (45.4%) |
| 3 Vehicles | 161 (24.5%) | 53 (7.5%) |
| 4 Vehicles | 15 (2.3%) | 16 (2.3%) |
| 5 or more Vehicles | 24 (3.6%) | 5 (0.7%) |
| Total | 658 (100.0%) | 702 (100.0%) |
Commute Time in Saxon
The most frequently occuring commute durations in Saxon are 10 to 14 minutes (572 commuters, 37.6%), 20 to 24 minutes (326 commuters, 21.4%), and 15 to 19 minutes (297 commuters, 19.5%).
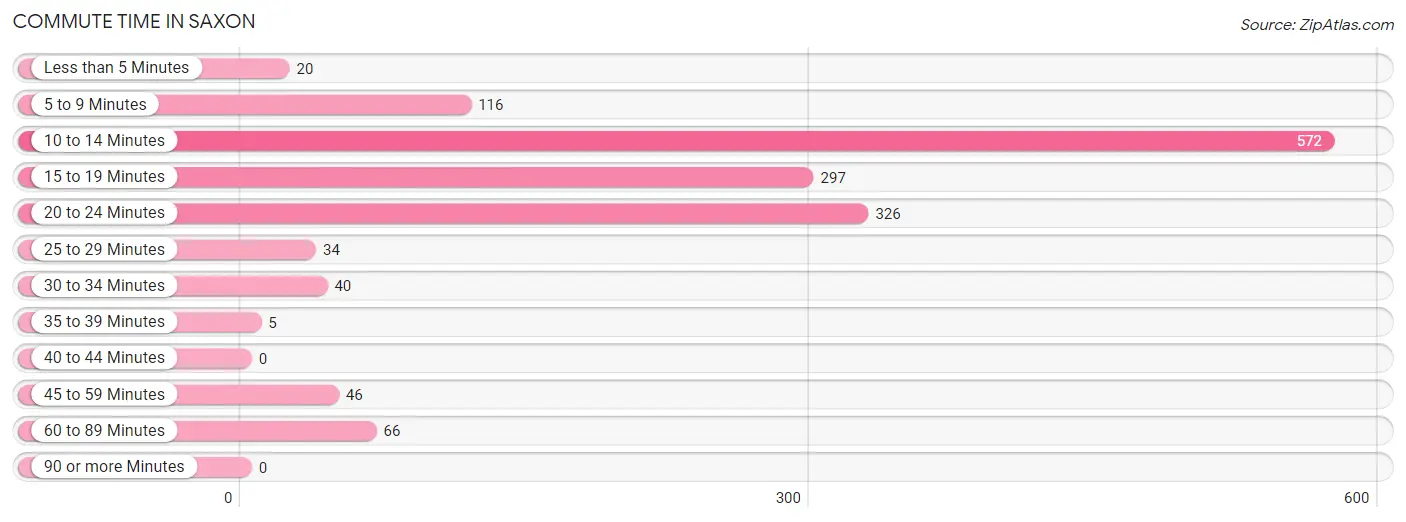
| Commute Time | # Commuters | % Commuters |
| Less than 5 Minutes | 20 | 1.3% |
| 5 to 9 Minutes | 116 | 7.6% |
| 10 to 14 Minutes | 572 | 37.6% |
| 15 to 19 Minutes | 297 | 19.5% |
| 20 to 24 Minutes | 326 | 21.4% |
| 25 to 29 Minutes | 34 | 2.2% |
| 30 to 34 Minutes | 40 | 2.6% |
| 35 to 39 Minutes | 5 | 0.3% |
| 40 to 44 Minutes | 0 | 0.0% |
| 45 to 59 Minutes | 46 | 3.0% |
| 60 to 89 Minutes | 66 | 4.3% |
| 90 or more Minutes | 0 | 0.0% |
Commute Time by Sex in Saxon
The most common commute times in Saxon are 10 to 14 minutes (217 commuters, 27.9%) for males and 10 to 14 minutes (355 commuters, 47.6%) for females.
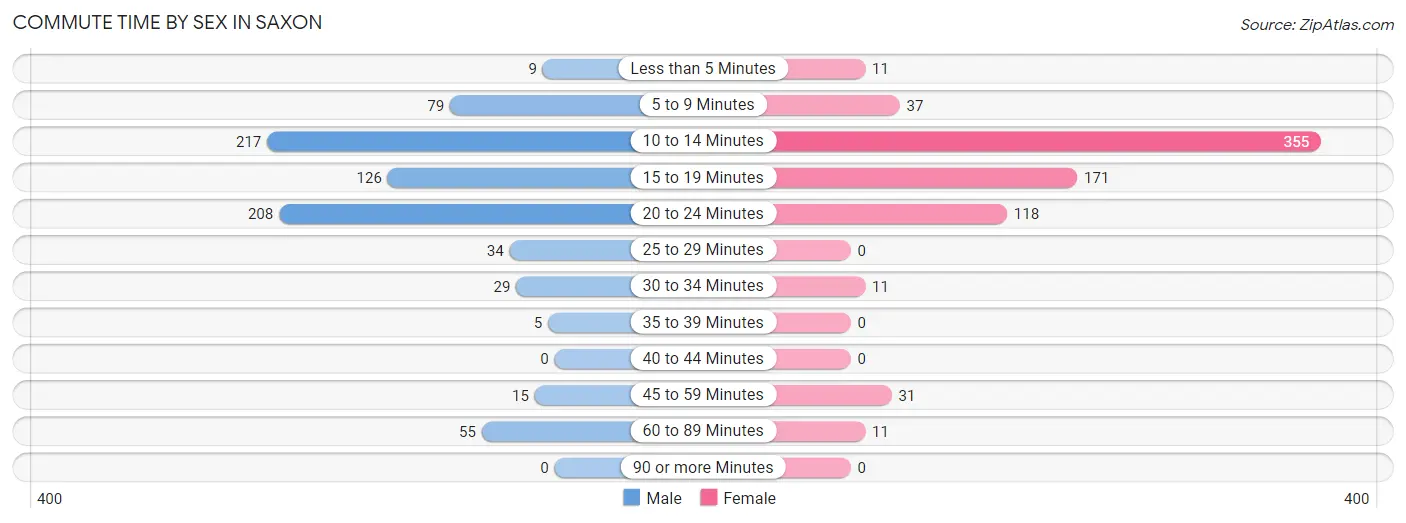
| Commute Time | Male | Female |
| Less than 5 Minutes | 9 (1.2%) | 11 (1.5%) |
| 5 to 9 Minutes | 79 (10.2%) | 37 (5.0%) |
| 10 to 14 Minutes | 217 (27.9%) | 355 (47.6%) |
| 15 to 19 Minutes | 126 (16.2%) | 171 (23.0%) |
| 20 to 24 Minutes | 208 (26.8%) | 118 (15.8%) |
| 25 to 29 Minutes | 34 (4.4%) | 0 (0.0%) |
| 30 to 34 Minutes | 29 (3.7%) | 11 (1.5%) |
| 35 to 39 Minutes | 5 (0.6%) | 0 (0.0%) |
| 40 to 44 Minutes | 0 (0.0%) | 0 (0.0%) |
| 45 to 59 Minutes | 15 (1.9%) | 31 (4.2%) |
| 60 to 89 Minutes | 55 (7.1%) | 11 (1.5%) |
| 90 or more Minutes | 0 (0.0%) | 0 (0.0%) |
Time of Departure to Work by Sex in Saxon
The most frequent times of departure to work in Saxon are 7:00 AM to 7:29 AM (106, 13.6%) for males and 7:30 AM to 7:59 AM (213, 28.6%) for females.
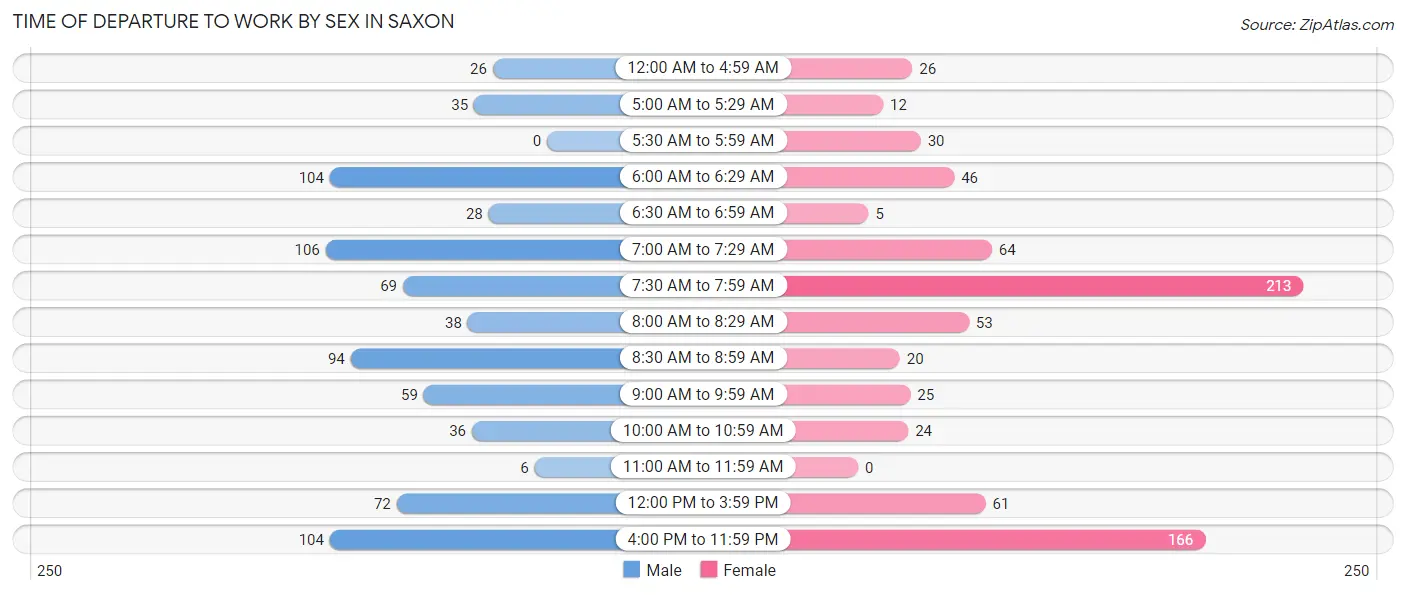
| Time of Departure | Male | Female |
| 12:00 AM to 4:59 AM | 26 (3.4%) | 26 (3.5%) |
| 5:00 AM to 5:29 AM | 35 (4.5%) | 12 (1.6%) |
| 5:30 AM to 5:59 AM | 0 (0.0%) | 30 (4.0%) |
| 6:00 AM to 6:29 AM | 104 (13.4%) | 46 (6.2%) |
| 6:30 AM to 6:59 AM | 28 (3.6%) | 5 (0.7%) |
| 7:00 AM to 7:29 AM | 106 (13.6%) | 64 (8.6%) |
| 7:30 AM to 7:59 AM | 69 (8.9%) | 213 (28.6%) |
| 8:00 AM to 8:29 AM | 38 (4.9%) | 53 (7.1%) |
| 8:30 AM to 8:59 AM | 94 (12.1%) | 20 (2.7%) |
| 9:00 AM to 9:59 AM | 59 (7.6%) | 25 (3.4%) |
| 10:00 AM to 10:59 AM | 36 (4.6%) | 24 (3.2%) |
| 11:00 AM to 11:59 AM | 6 (0.8%) | 0 (0.0%) |
| 12:00 PM to 3:59 PM | 72 (9.3%) | 61 (8.2%) |
| 4:00 PM to 11:59 PM | 104 (13.4%) | 166 (22.3%) |
| Total | 777 (100.0%) | 745 (100.0%) |
Housing Occupancy in Saxon
Occupancy by Ownership in Saxon
Of the total 1,340 dwellings in Saxon, owner-occupied units account for 489 (36.5%), while renter-occupied units make up 851 (63.5%).
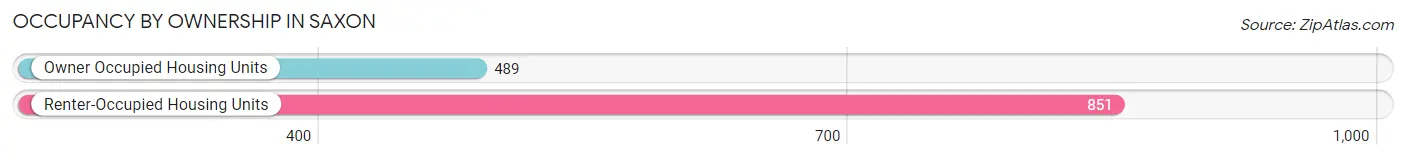
| Occupancy | # Housing Units | % Housing Units |
| Owner Occupied Housing Units | 489 | 36.5% |
| Renter-Occupied Housing Units | 851 | 63.5% |
| Total Occupied Housing Units | 1,340 | 100.0% |
Occupancy by Household Size in Saxon
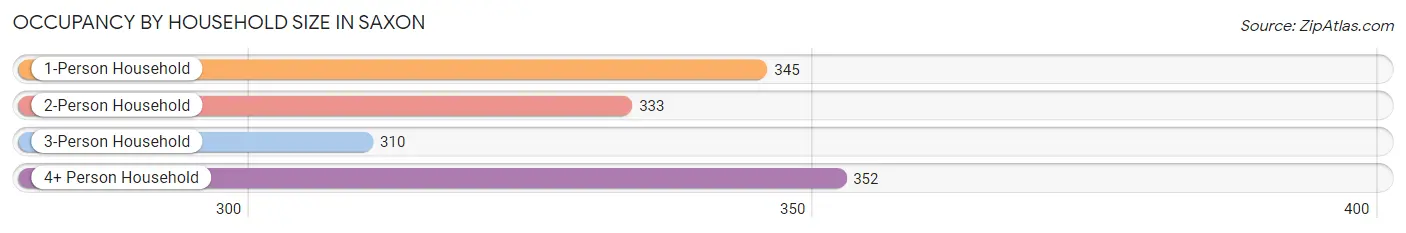
| Household Size | # Housing Units | % Housing Units |
| 1-Person Household | 345 | 25.8% |
| 2-Person Household | 333 | 24.8% |
| 3-Person Household | 310 | 23.1% |
| 4+ Person Household | 352 | 26.3% |
| Total Housing Units | 1,340 | 100.0% |
Occupancy by Ownership by Household Size in Saxon
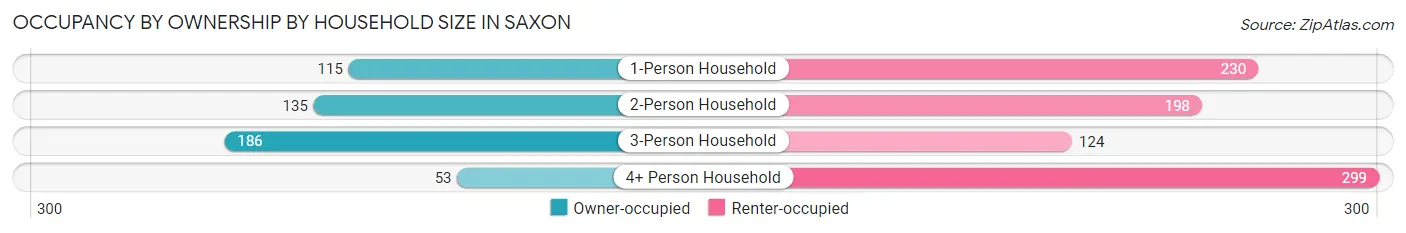
| Household Size | Owner-occupied | Renter-occupied |
| 1-Person Household | 115 (33.3%) | 230 (66.7%) |
| 2-Person Household | 135 (40.5%) | 198 (59.5%) |
| 3-Person Household | 186 (60.0%) | 124 (40.0%) |
| 4+ Person Household | 53 (15.1%) | 299 (84.9%) |
| Total Housing Units | 489 (36.5%) | 851 (63.5%) |
Occupancy by Educational Attainment in Saxon
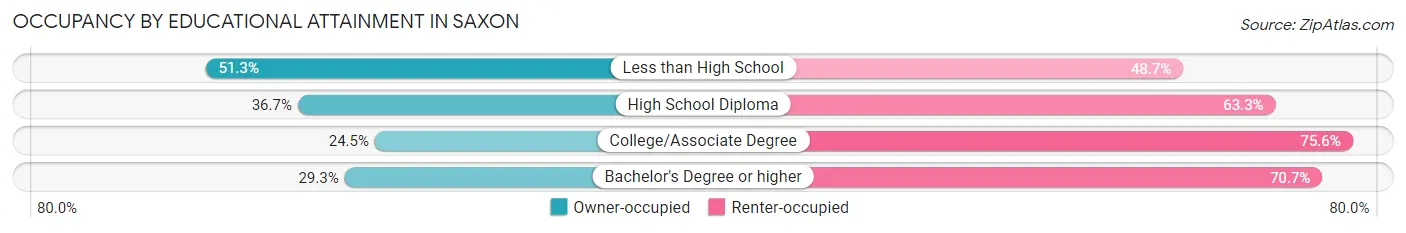
| Household Size | Owner-occupied | Renter-occupied |
| Less than High School | 177 (51.3%) | 168 (48.7%) |
| High School Diploma | 179 (36.7%) | 309 (63.3%) |
| College/Associate Degree | 78 (24.4%) | 241 (75.5%) |
| Bachelor's Degree or higher | 55 (29.3%) | 133 (70.7%) |
Occupancy by Age of Householder in Saxon
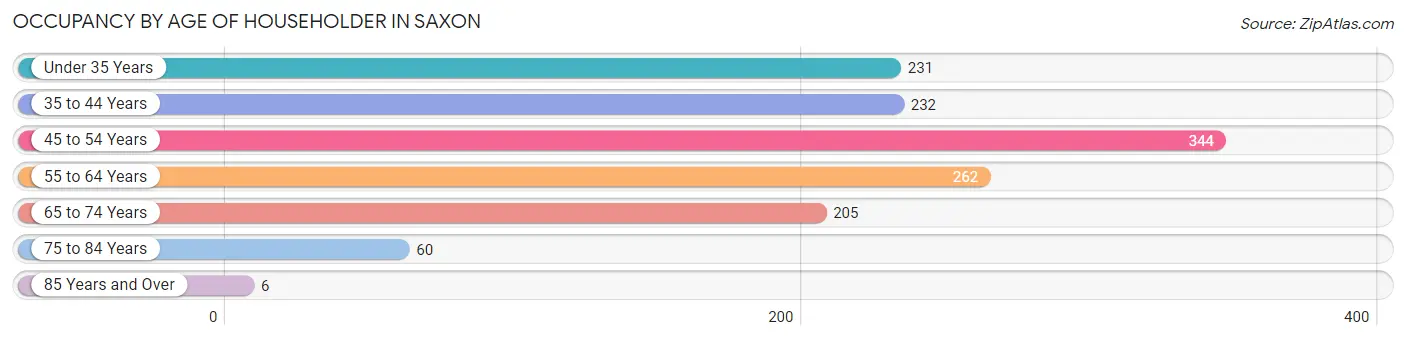
| Age Bracket | # Households | % Households |
| Under 35 Years | 231 | 17.2% |
| 35 to 44 Years | 232 | 17.3% |
| 45 to 54 Years | 344 | 25.7% |
| 55 to 64 Years | 262 | 19.6% |
| 65 to 74 Years | 205 | 15.3% |
| 75 to 84 Years | 60 | 4.5% |
| 85 Years and Over | 6 | 0.4% |
| Total | 1,340 | 100.0% |
Housing Finances in Saxon
Median Income by Occupancy in Saxon
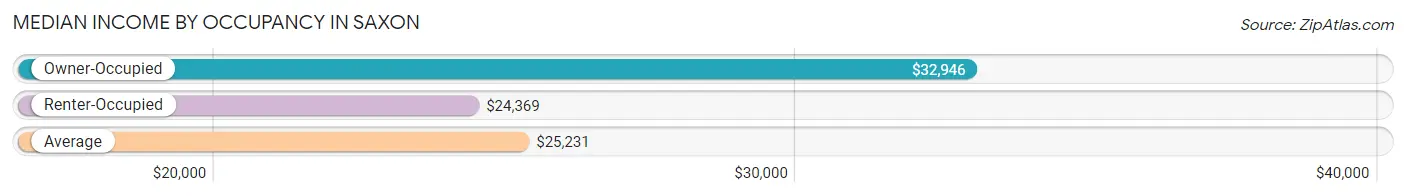
| Occupancy Type | # Households | Median Income |
| Owner-Occupied | 489 (36.5%) | $32,946 |
| Renter-Occupied | 851 (63.5%) | $24,369 |
| Average | 1,340 (100.0%) | $25,231 |
Occupancy by Householder Income Bracket in Saxon
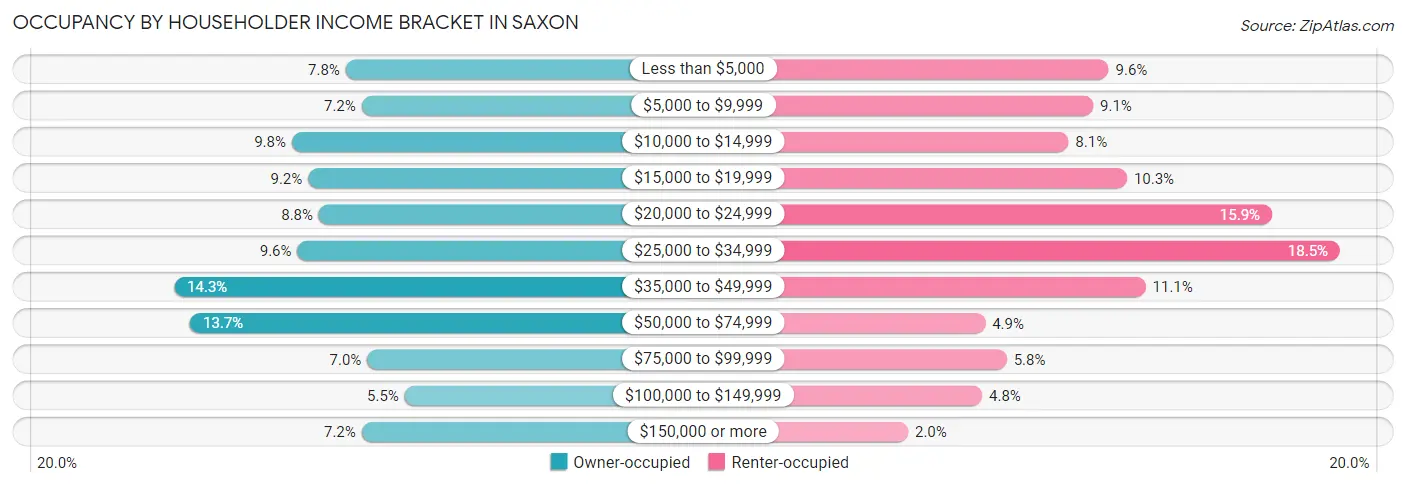
| Income Bracket | Owner-occupied | Renter-occupied |
| Less than $5,000 | 38 (7.8%) | 82 (9.6%) |
| $5,000 to $9,999 | 35 (7.2%) | 77 (9.0%) |
| $10,000 to $14,999 | 48 (9.8%) | 69 (8.1%) |
| $15,000 to $19,999 | 45 (9.2%) | 88 (10.3%) |
| $20,000 to $24,999 | 43 (8.8%) | 135 (15.9%) |
| $25,000 to $34,999 | 47 (9.6%) | 157 (18.4%) |
| $35,000 to $49,999 | 70 (14.3%) | 94 (11.1%) |
| $50,000 to $74,999 | 67 (13.7%) | 42 (4.9%) |
| $75,000 to $99,999 | 34 (7.0%) | 49 (5.8%) |
| $100,000 to $149,999 | 27 (5.5%) | 41 (4.8%) |
| $150,000 or more | 35 (7.2%) | 17 (2.0%) |
| Total | 489 (100.0%) | 851 (100.0%) |
Monthly Housing Cost Tiers in Saxon
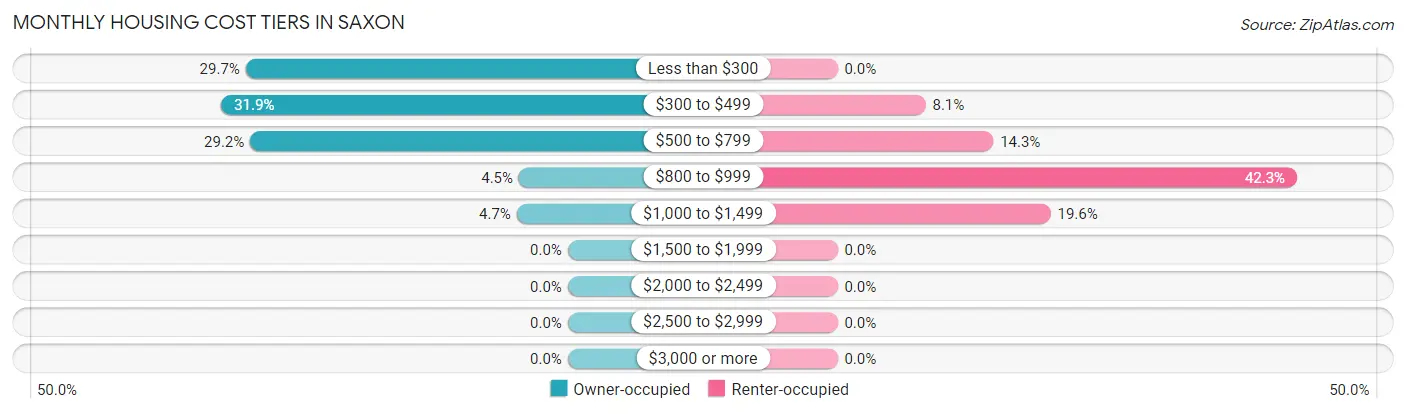
| Monthly Cost | Owner-occupied | Renter-occupied |
| Less than $300 | 145 (29.6%) | 0 (0.0%) |
| $300 to $499 | 156 (31.9%) | 69 (8.1%) |
| $500 to $799 | 143 (29.2%) | 122 (14.3%) |
| $800 to $999 | 22 (4.5%) | 360 (42.3%) |
| $1,000 to $1,499 | 23 (4.7%) | 167 (19.6%) |
| $1,500 to $1,999 | 0 (0.0%) | 0 (0.0%) |
| $2,000 to $2,499 | 0 (0.0%) | 0 (0.0%) |
| $2,500 to $2,999 | 0 (0.0%) | 0 (0.0%) |
| $3,000 or more | 0 (0.0%) | 0 (0.0%) |
| Total | 489 (100.0%) | 851 (100.0%) |
Physical Housing Characteristics in Saxon
Housing Structures in Saxon
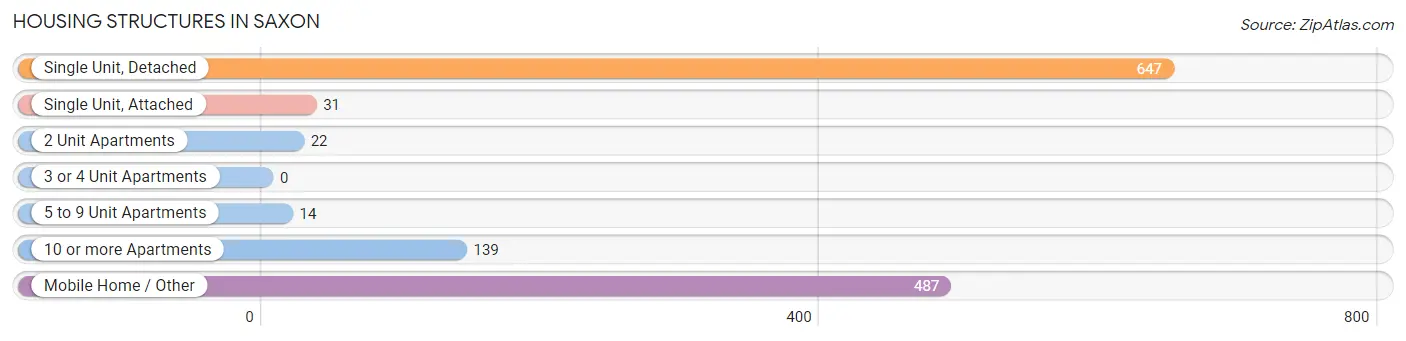
| Structure Type | # Housing Units | % Housing Units |
| Single Unit, Detached | 647 | 48.3% |
| Single Unit, Attached | 31 | 2.3% |
| 2 Unit Apartments | 22 | 1.6% |
| 3 or 4 Unit Apartments | 0 | 0.0% |
| 5 to 9 Unit Apartments | 14 | 1.0% |
| 10 or more Apartments | 139 | 10.4% |
| Mobile Home / Other | 487 | 36.3% |
| Total | 1,340 | 100.0% |
Housing Structures by Occupancy in Saxon
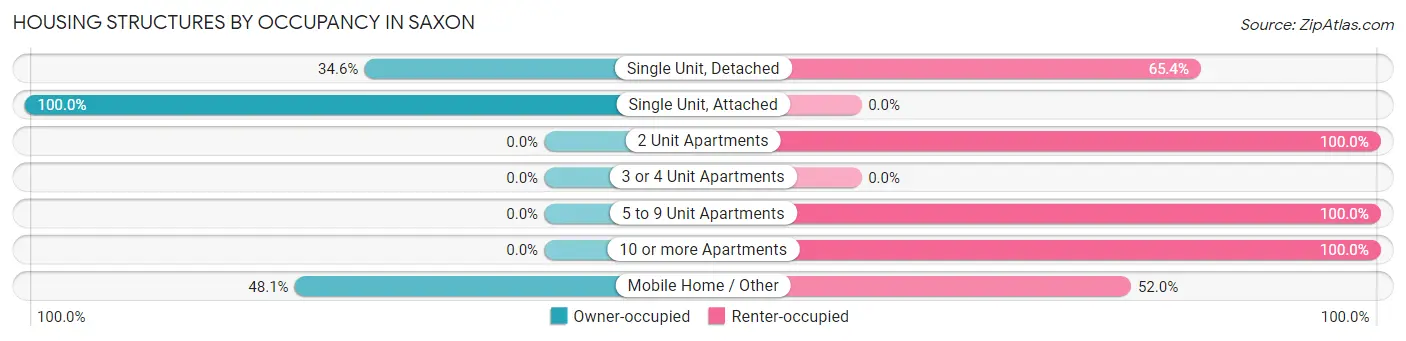
| Structure Type | Owner-occupied | Renter-occupied |
| Single Unit, Detached | 224 (34.6%) | 423 (65.4%) |
| Single Unit, Attached | 31 (100.0%) | 0 (0.0%) |
| 2 Unit Apartments | 0 (0.0%) | 22 (100.0%) |
| 3 or 4 Unit Apartments | 0 (0.0%) | 0 (0.0%) |
| 5 to 9 Unit Apartments | 0 (0.0%) | 14 (100.0%) |
| 10 or more Apartments | 0 (0.0%) | 139 (100.0%) |
| Mobile Home / Other | 234 (48.0%) | 253 (51.9%) |
| Total | 489 (36.5%) | 851 (63.5%) |
Housing Structures by Number of Rooms in Saxon
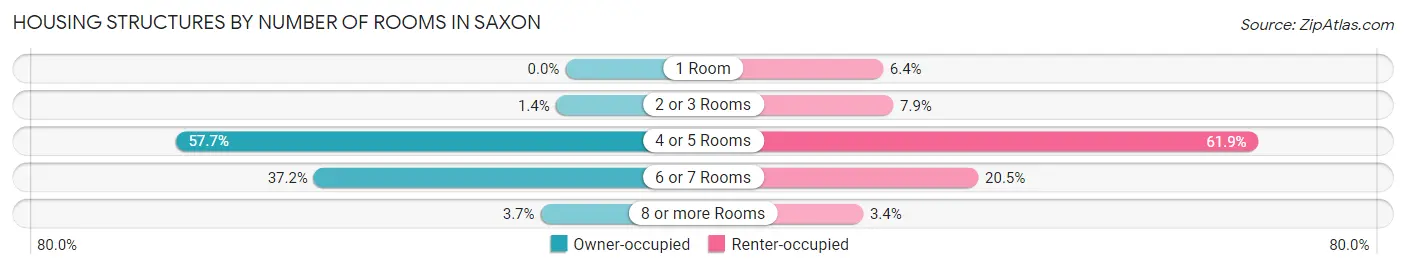
| Number of Rooms | Owner-occupied | Renter-occupied |
| 1 Room | 0 (0.0%) | 54 (6.4%) |
| 2 or 3 Rooms | 7 (1.4%) | 67 (7.9%) |
| 4 or 5 Rooms | 282 (57.7%) | 527 (61.9%) |
| 6 or 7 Rooms | 182 (37.2%) | 174 (20.4%) |
| 8 or more Rooms | 18 (3.7%) | 29 (3.4%) |
| Total | 489 (100.0%) | 851 (100.0%) |
Housing Structure by Heating Type in Saxon
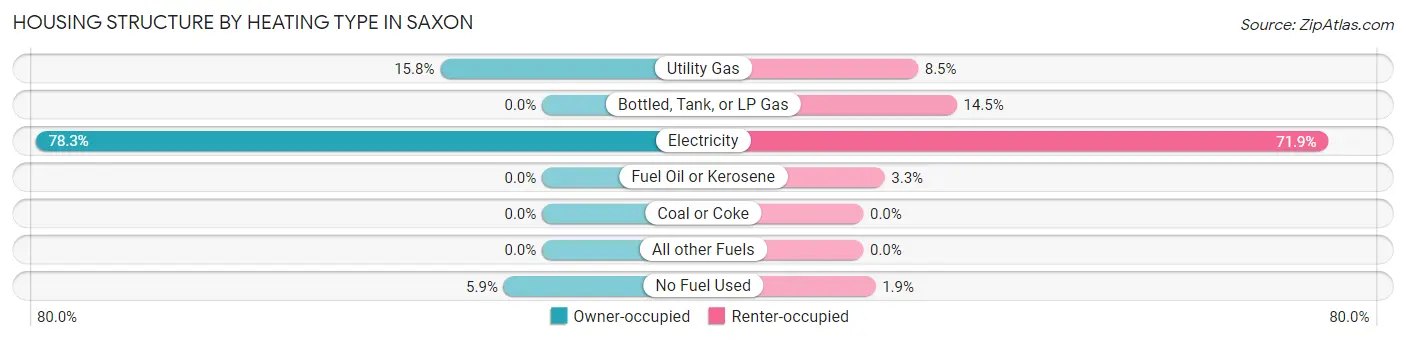
| Heating Type | Owner-occupied | Renter-occupied |
| Utility Gas | 77 (15.8%) | 72 (8.5%) |
| Bottled, Tank, or LP Gas | 0 (0.0%) | 123 (14.4%) |
| Electricity | 383 (78.3%) | 612 (71.9%) |
| Fuel Oil or Kerosene | 0 (0.0%) | 28 (3.3%) |
| Coal or Coke | 0 (0.0%) | 0 (0.0%) |
| All other Fuels | 0 (0.0%) | 0 (0.0%) |
| No Fuel Used | 29 (5.9%) | 16 (1.9%) |
| Total | 489 (100.0%) | 851 (100.0%) |
Household Vehicle Usage in Saxon
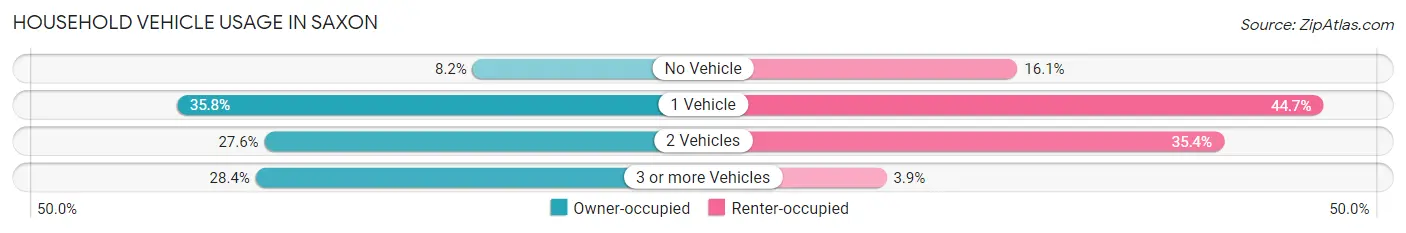
| Vehicles per Household | Owner-occupied | Renter-occupied |
| No Vehicle | 40 (8.2%) | 137 (16.1%) |
| 1 Vehicle | 175 (35.8%) | 380 (44.7%) |
| 2 Vehicles | 135 (27.6%) | 301 (35.4%) |
| 3 or more Vehicles | 139 (28.4%) | 33 (3.9%) |
| Total | 489 (100.0%) | 851 (100.0%) |
Real Estate & Mortgages in Saxon
Real Estate and Mortgage Overview in Saxon
| Characteristic | Without Mortgage | With Mortgage |
| Housing Units | 347 | 142 |
| Median Property Value | - | - |
| Median Household Income | $21,250 | $0 |
| Monthly Housing Costs | $345 | $0 |
| Real Estate Taxes | $243 | $29 |
Property Value by Mortgage Status in Saxon
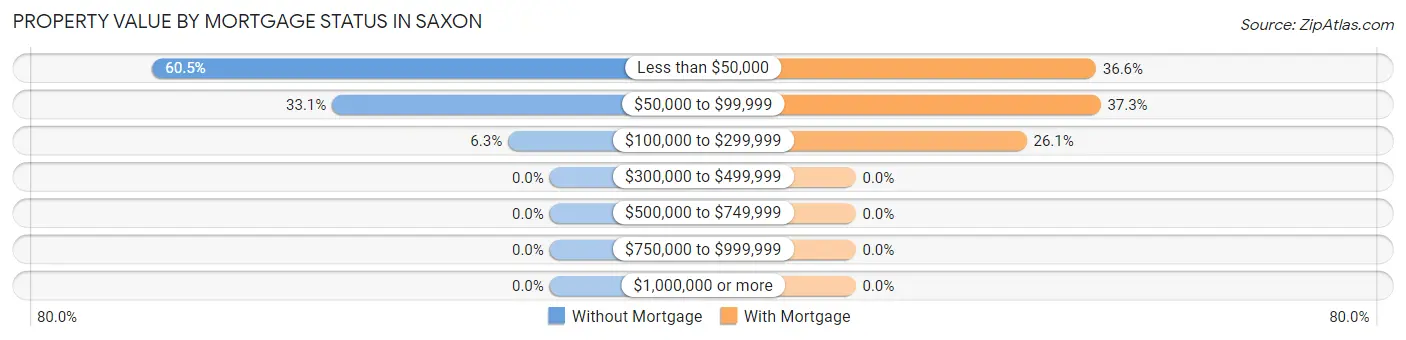
| Property Value | Without Mortgage | With Mortgage |
| Less than $50,000 | 210 (60.5%) | 52 (36.6%) |
| $50,000 to $99,999 | 115 (33.1%) | 53 (37.3%) |
| $100,000 to $299,999 | 22 (6.3%) | 37 (26.1%) |
| $300,000 to $499,999 | 0 (0.0%) | 0 (0.0%) |
| $500,000 to $749,999 | 0 (0.0%) | 0 (0.0%) |
| $750,000 to $999,999 | 0 (0.0%) | 0 (0.0%) |
| $1,000,000 or more | 0 (0.0%) | 0 (0.0%) |
| Total | 347 (100.0%) | 142 (100.0%) |
Household Income by Mortgage Status in Saxon
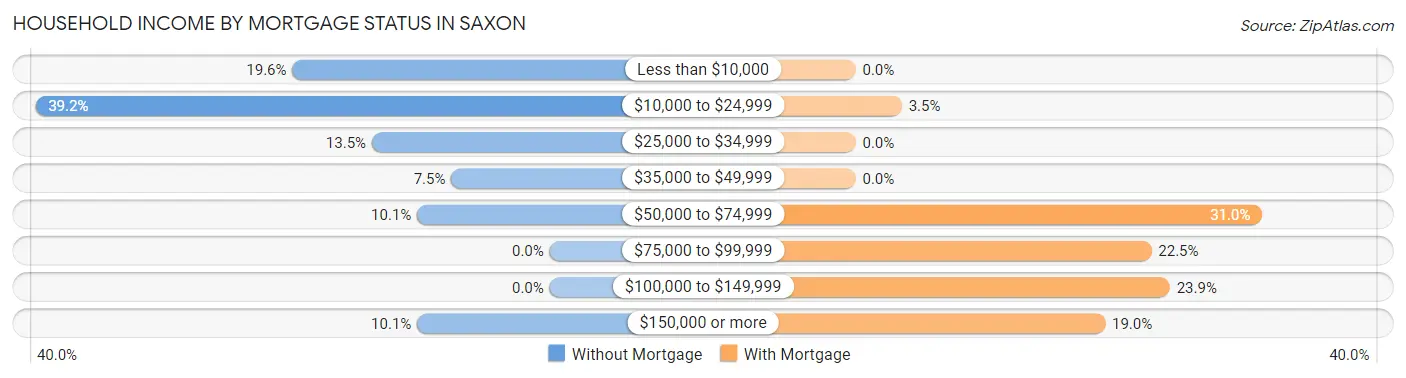
| Household Income | Without Mortgage | With Mortgage |
| Less than $10,000 | 68 (19.6%) | 0 (0.0%) |
| $10,000 to $24,999 | 136 (39.2%) | 5 (3.5%) |
| $25,000 to $34,999 | 47 (13.5%) | 0 (0.0%) |
| $35,000 to $49,999 | 26 (7.5%) | 0 (0.0%) |
| $50,000 to $74,999 | 35 (10.1%) | 44 (31.0%) |
| $75,000 to $99,999 | 0 (0.0%) | 32 (22.5%) |
| $100,000 to $149,999 | 0 (0.0%) | 34 (23.9%) |
| $150,000 or more | 35 (10.1%) | 27 (19.0%) |
| Total | 347 (100.0%) | 142 (100.0%) |
Property Value to Household Income Ratio in Saxon
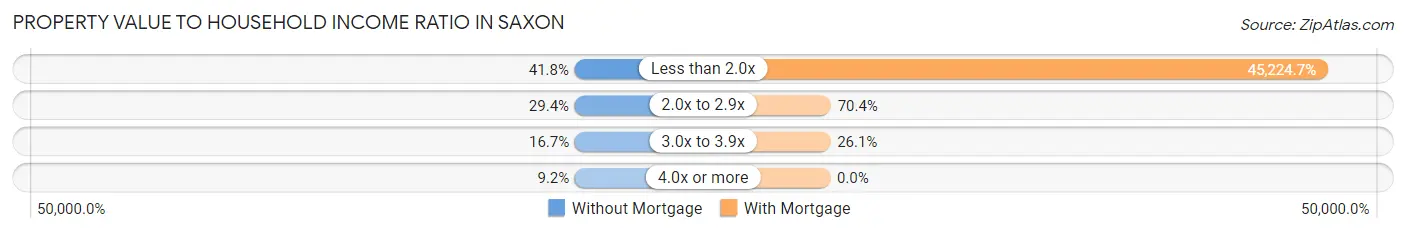
| Value-to-Income Ratio | Without Mortgage | With Mortgage |
| Less than 2.0x | 145 (41.8%) | 64,219 (45,224.7%) |
| 2.0x to 2.9x | 102 (29.4%) | 100 (70.4%) |
| 3.0x to 3.9x | 58 (16.7%) | 37 (26.1%) |
| 4.0x or more | 32 (9.2%) | 0 (0.0%) |
| Total | 347 (100.0%) | 142 (100.0%) |
Real Estate Taxes by Mortgage Status in Saxon
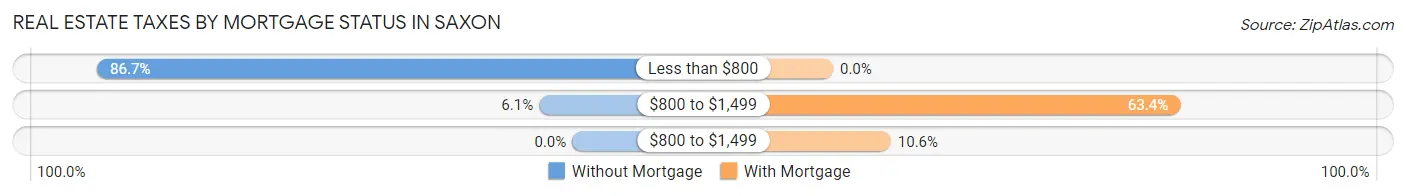
| Property Taxes | Without Mortgage | With Mortgage |
| Less than $800 | 301 (86.7%) | 0 (0.0%) |
| $800 to $1,499 | 21 (6.0%) | 90 (63.4%) |
| $800 to $1,499 | 0 (0.0%) | 15 (10.6%) |
| Total | 347 (100.0%) | 142 (100.0%) |
Health & Disability in Saxon
Health Insurance Coverage by Age in Saxon
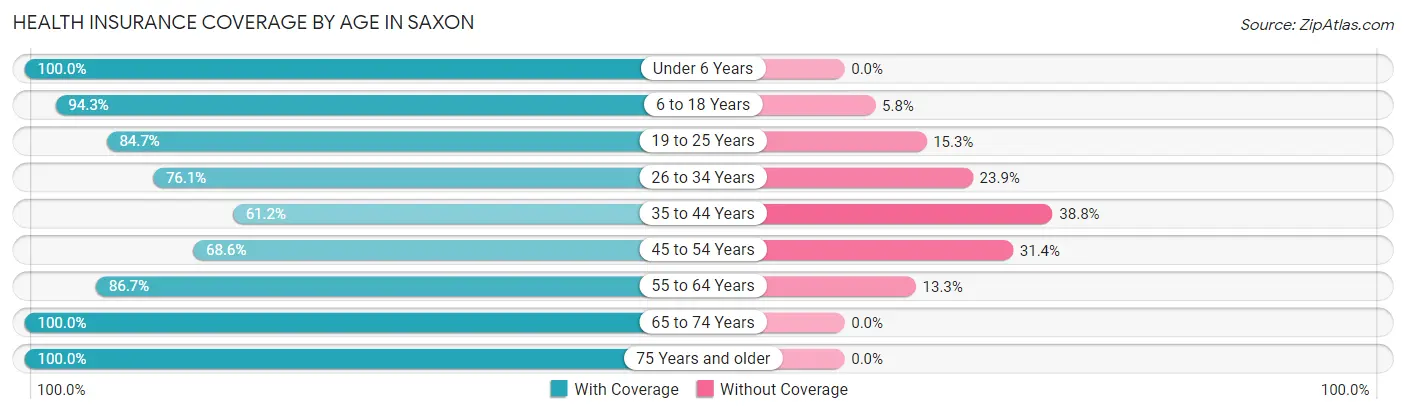
| Age Bracket | With Coverage | Without Coverage |
| Under 6 Years | 425 (100.0%) | 0 (0.0%) |
| 6 to 18 Years | 754 (94.3%) | 46 (5.8%) |
| 19 to 25 Years | 710 (84.7%) | 128 (15.3%) |
| 26 to 34 Years | 270 (76.1%) | 85 (23.9%) |
| 35 to 44 Years | 227 (61.2%) | 144 (38.8%) |
| 45 to 54 Years | 384 (68.6%) | 176 (31.4%) |
| 55 to 64 Years | 313 (86.7%) | 48 (13.3%) |
| 65 to 74 Years | 338 (100.0%) | 0 (0.0%) |
| 75 Years and older | 123 (100.0%) | 0 (0.0%) |
| Total | 3,544 (85.0%) | 627 (15.0%) |
Health Insurance Coverage by Citizenship Status in Saxon

| Citizenship Status | With Coverage | Without Coverage |
| Native Born | 425 (100.0%) | 0 (0.0%) |
| Foreign Born, Citizen | 754 (94.3%) | 46 (5.8%) |
| Foreign Born, not a Citizen | 710 (84.7%) | 128 (15.3%) |
Health Insurance Coverage by Household Income in Saxon
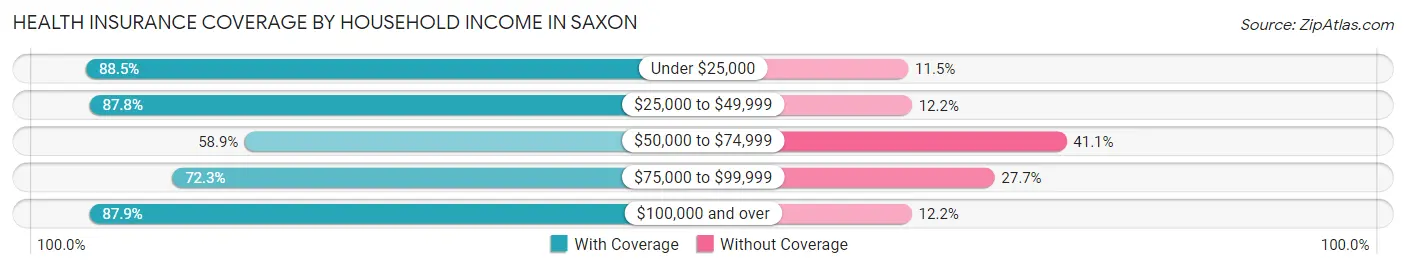
| Household Income | With Coverage | Without Coverage |
| Under $25,000 | 1,508 (88.5%) | 196 (11.5%) |
| $25,000 to $49,999 | 794 (87.8%) | 110 (12.2%) |
| $50,000 to $74,999 | 176 (58.9%) | 123 (41.1%) |
| $75,000 to $99,999 | 238 (72.3%) | 91 (27.7%) |
| $100,000 and over | 405 (87.8%) | 56 (12.1%) |
Public vs Private Health Insurance Coverage by Age in Saxon
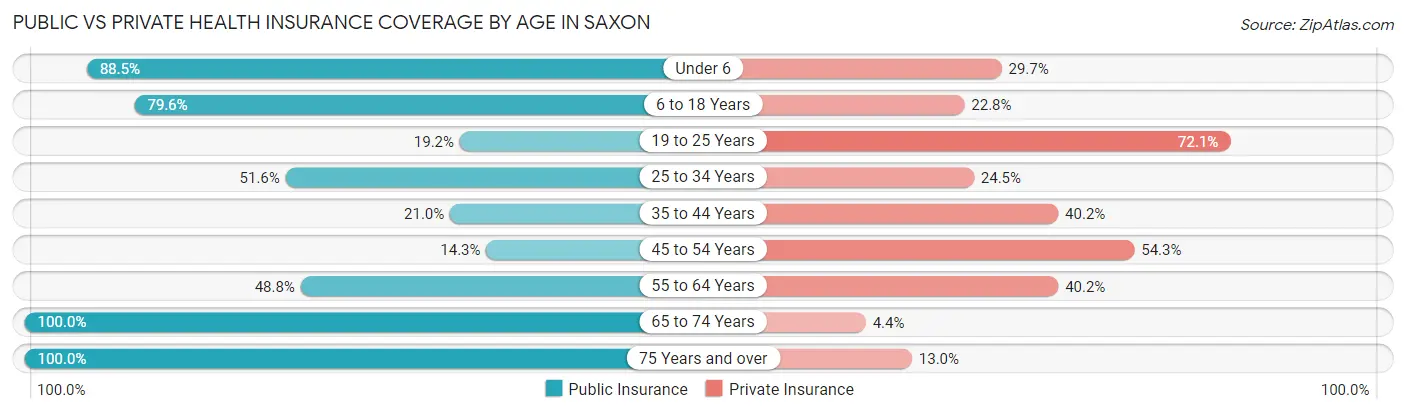
| Age Bracket | Public Insurance | Private Insurance |
| Under 6 | 376 (88.5%) | 126 (29.6%) |
| 6 to 18 Years | 637 (79.6%) | 182 (22.8%) |
| 19 to 25 Years | 161 (19.2%) | 604 (72.1%) |
| 25 to 34 Years | 183 (51.5%) | 87 (24.5%) |
| 35 to 44 Years | 78 (21.0%) | 149 (40.2%) |
| 45 to 54 Years | 80 (14.3%) | 304 (54.3%) |
| 55 to 64 Years | 176 (48.7%) | 145 (40.2%) |
| 65 to 74 Years | 338 (100.0%) | 15 (4.4%) |
| 75 Years and over | 123 (100.0%) | 16 (13.0%) |
| Total | 2,152 (51.6%) | 1,628 (39.0%) |
Disability Status by Sex by Age in Saxon
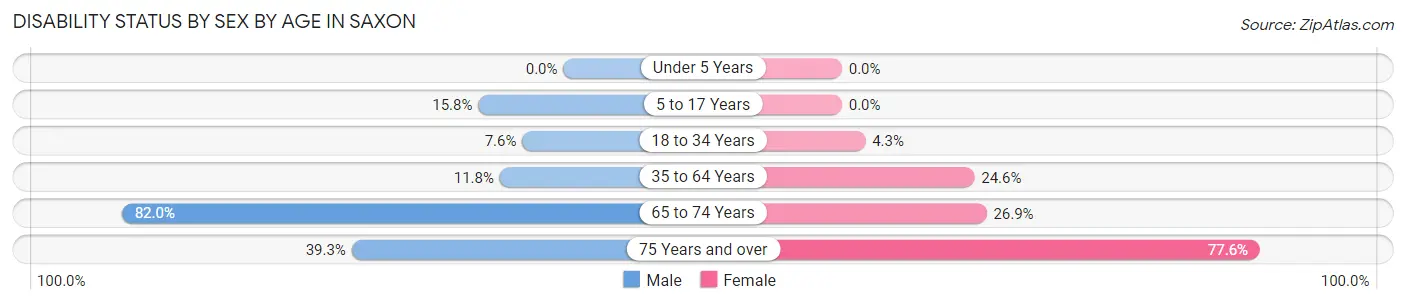
| Age Bracket | Male | Female |
| Under 5 Years | 0 (0.0%) | 0 (0.0%) |
| 5 to 17 Years | 51 (15.8%) | 0 (0.0%) |
| 18 to 34 Years | 52 (7.6%) | 26 (4.3%) |
| 35 to 64 Years | 67 (11.8%) | 178 (24.6%) |
| 65 to 74 Years | 100 (82.0%) | 58 (26.9%) |
| 75 Years and over | 22 (39.3%) | 52 (77.6%) |
Disability Class by Sex by Age in Saxon
Disability Class: Hearing Difficulty
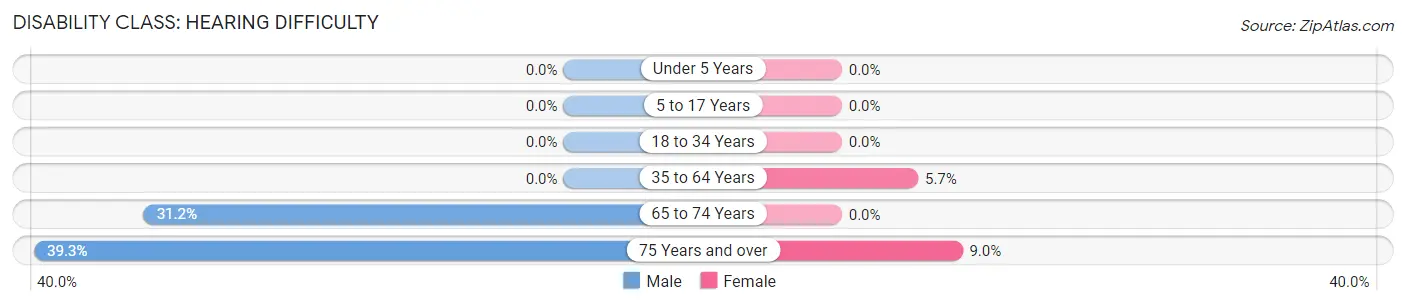
| Age Bracket | Male | Female |
| Under 5 Years | 0 (0.0%) | 0 (0.0%) |
| 5 to 17 Years | 0 (0.0%) | 0 (0.0%) |
| 18 to 34 Years | 0 (0.0%) | 0 (0.0%) |
| 35 to 64 Years | 0 (0.0%) | 41 (5.7%) |
| 65 to 74 Years | 38 (31.1%) | 0 (0.0%) |
| 75 Years and over | 22 (39.3%) | 6 (9.0%) |
Disability Class: Vision Difficulty
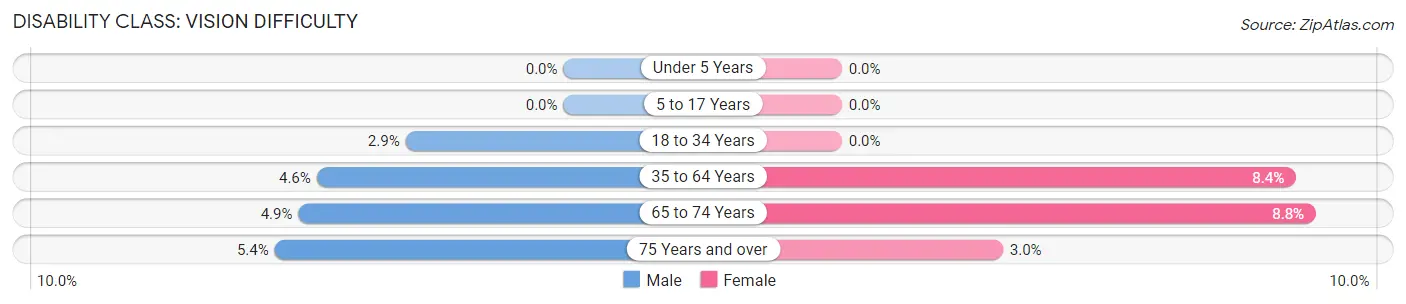
| Age Bracket | Male | Female |
| Under 5 Years | 0 (0.0%) | 0 (0.0%) |
| 5 to 17 Years | 0 (0.0%) | 0 (0.0%) |
| 18 to 34 Years | 20 (2.9%) | 0 (0.0%) |
| 35 to 64 Years | 26 (4.6%) | 61 (8.4%) |
| 65 to 74 Years | 6 (4.9%) | 19 (8.8%) |
| 75 Years and over | 3 (5.4%) | 2 (3.0%) |
Disability Class: Cognitive Difficulty
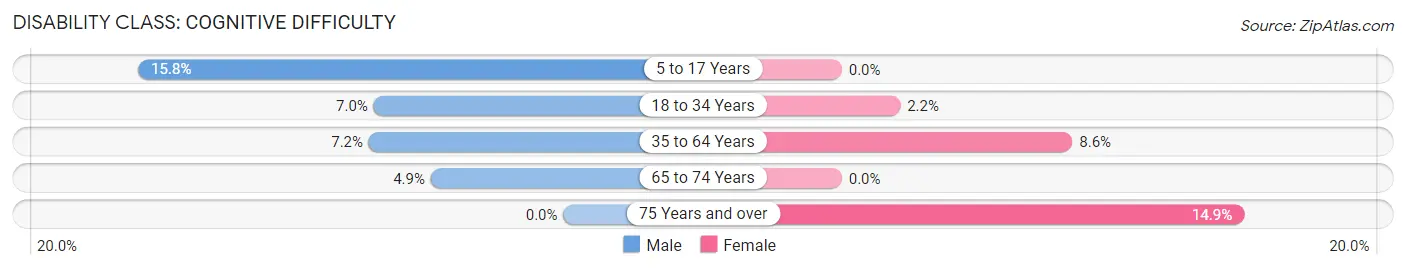
| Age Bracket | Male | Female |
| 5 to 17 Years | 51 (15.8%) | 0 (0.0%) |
| 18 to 34 Years | 48 (7.0%) | 13 (2.2%) |
| 35 to 64 Years | 41 (7.2%) | 62 (8.6%) |
| 65 to 74 Years | 6 (4.9%) | 0 (0.0%) |
| 75 Years and over | 0 (0.0%) | 10 (14.9%) |
Disability Class: Ambulatory Difficulty
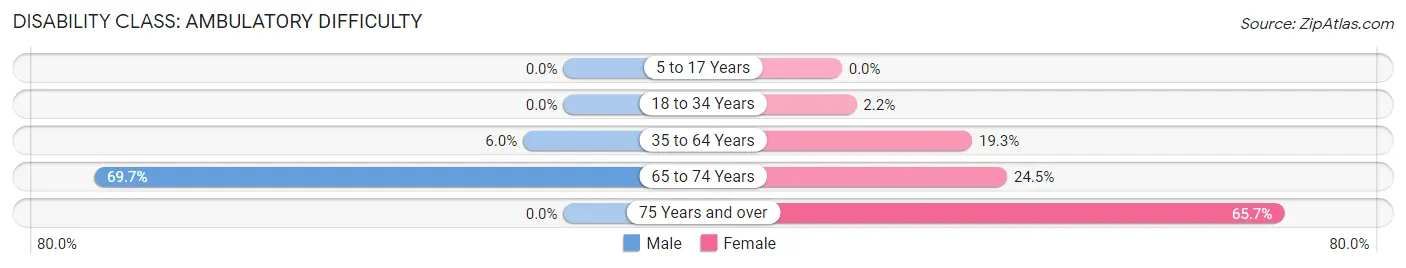
| Age Bracket | Male | Female |
| 5 to 17 Years | 0 (0.0%) | 0 (0.0%) |
| 18 to 34 Years | 0 (0.0%) | 13 (2.2%) |
| 35 to 64 Years | 34 (6.0%) | 140 (19.3%) |
| 65 to 74 Years | 85 (69.7%) | 53 (24.5%) |
| 75 Years and over | 0 (0.0%) | 44 (65.7%) |
Disability Class: Self-Care Difficulty
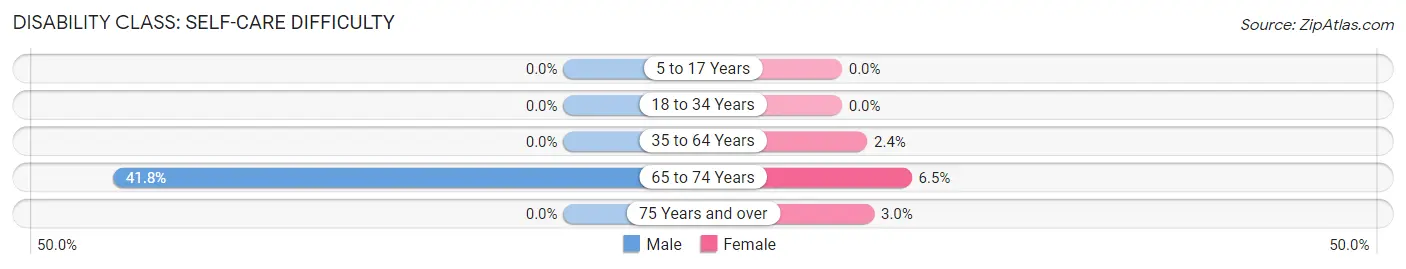
| Age Bracket | Male | Female |
| 5 to 17 Years | 0 (0.0%) | 0 (0.0%) |
| 18 to 34 Years | 0 (0.0%) | 0 (0.0%) |
| 35 to 64 Years | 0 (0.0%) | 17 (2.4%) |
| 65 to 74 Years | 51 (41.8%) | 14 (6.5%) |
| 75 Years and over | 0 (0.0%) | 2 (3.0%) |
Technology Access in Saxon
Computing Device Access in Saxon
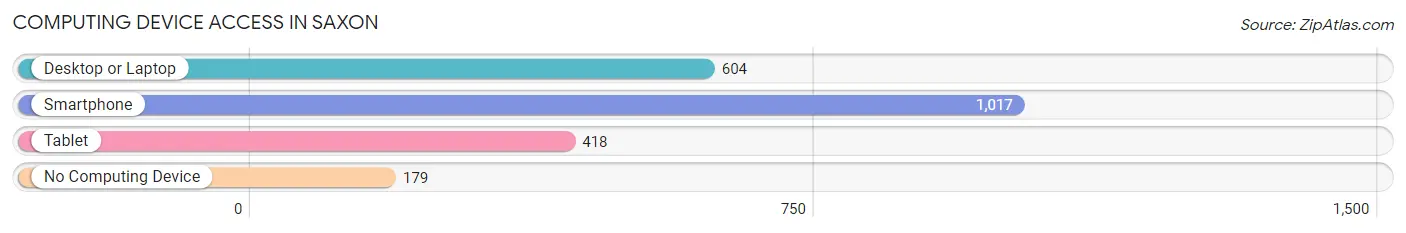
| Device Type | # Households | % Households |
| Desktop or Laptop | 604 | 45.1% |
| Smartphone | 1,017 | 75.9% |
| Tablet | 418 | 31.2% |
| No Computing Device | 179 | 13.4% |
| Total | 1,340 | 100.0% |
Internet Access in Saxon

| Internet Type | # Households | % Households |
| Dial-Up Internet | 0 | 0.0% |
| Broadband Home | 648 | 48.4% |
| Cellular Data Only | 148 | 11.0% |
| Satellite Internet | 74 | 5.5% |
| No Internet | 494 | 36.9% |
| Total | 1,340 | 100.0% |
Saxon Summary
The Anglo-Saxon period in England is a period of history that began in the 5th century and lasted until the Norman Conquest in 1066. It is a period of great cultural and political change, and it is during this period that the English language and culture developed. The Anglo-Saxon period is divided into three distinct phases: the Early Anglo-Saxon period (5th-7th centuries), the Middle Anglo-Saxon period (8th-10th centuries), and the Late Anglo-Saxon period (11th century).
Geography
The geography of the Anglo-Saxon period was largely determined by the physical geography of the British Isles. The main geographical features of the period were the rivers, mountains, and coasts of the British Isles. The rivers were important for transportation and communication, and the mountains and coasts provided natural barriers to invasion.
The main rivers of the period were the Thames, the Severn, and the Humber. The Thames was the most important river of the period, as it was the main route of communication between the south and the north of England. The Severn and the Humber were also important rivers, as they provided access to the sea and allowed for trade with other countries.
The main mountain ranges of the period were the Pennines, the Cotswolds, and the Welsh Mountains. These mountain ranges provided natural barriers to invasion and also provided a source of natural resources such as timber and stone.
The coasts of the British Isles were also important during the Anglo-Saxon period. The coasts provided access to the sea and allowed for trade with other countries. The main ports of the period were London, Dover, and Southampton.
Economy
The economy of the Anglo-Saxon period was largely based on agriculture. The main crops grown during this period were wheat, barley, oats, and rye. These crops were used to make bread, beer, and other foodstuffs.
The main sources of income for the Anglo-Saxons were farming, fishing, and trading. Fishing was an important source of income, as the rivers and coasts of the British Isles provided a plentiful supply of fish. Trading was also important, as the Anglo-Saxons traded with other countries for goods such as wine, spices, and cloth.
The main industries of the period were metalworking, woodworking, and pottery. Metalworking was important for making tools and weapons, while woodworking was important for making furniture and other items. Pottery was important for making containers for food and drink.
Demographics
The population of the Anglo-Saxon period was largely made up of Anglo-Saxons, who were a Germanic people. The population also included Britons, who were the native inhabitants of the British Isles, and other ethnic groups such as the Jutes, the Frisians, and the Danes.
The population of the Anglo-Saxon period was largely rural, with most people living in small villages and farming the land. The population was also largely illiterate, as literacy was not widespread during this period.
Conclusion
The Anglo-Saxon period was a period of great cultural and political change in England. The geography, economy, and demographics of the period were largely determined by the physical geography of the British Isles and the cultural and political changes that occurred during this period. The main rivers, mountains, and coasts of the British Isles provided natural barriers to invasion and also provided a source of natural resources. The main sources of income for the Anglo-Saxons were farming, fishing, and trading. The main industries of the period were metalworking, woodworking, and pottery. The population of the Anglo-Saxon period was largely made up of Anglo-Saxons, Britons, and other ethnic groups.
Common Questions
What is the Total Population of Saxon?
Total Population of Saxon is 4,171.
What is the Total Male Population of Saxon?
Total Male Population of Saxon is 1,946.
What is the Total Female Population of Saxon?
Total Female Population of Saxon is 2,225.
What is the Ratio of Males per 100 Females in Saxon?
There are 87.46 Males per 100 Females in Saxon.
What is the Ratio of Females per 100 Males in Saxon?
There are 114.34 Females per 100 Males in Saxon.
What is the Median Population Age in Saxon?
Median Population Age in Saxon is 27.1 Years.
What is the Average Family Size in Saxon
Average Family Size in Saxon is 3.4 People.
What is the Average Household Size in Saxon
Average Household Size in Saxon is 2.8 People.
What is Per Capita Income in Saxon?
Per Capita income in Saxon is $13,759.
What is the Median Family Income in Saxon?
Median Family Income in Saxon is $25,709.
What is the Median Household income in Saxon?
Median Household Income in Saxon is $25,231.
What is Income or Wage Gap in Saxon?
Income or Wage Gap in Saxon is 64.7%.
Women in Saxon earn 35.3 cents for every dollar earned by a man.
What is Inequality or Gini Index in Saxon?
Inequality or Gini Index in Saxon is 0.49.
How Large is the Labor Force in Saxon?
There are 1,779 People in the Labor Forcein in Saxon.
What is the Percentage of People in the Labor Force in Saxon?
56.3% of People are in the Labor Force in Saxon.
What is the Unemployment Rate in Saxon?
Unemployment Rate in Saxon is 11.6%.