Centerville, SC
Centerville Map
Centerville Overview
7,217
TOTAL POPULATION
3,428
MALE POPULATION
3,789
FEMALE POPULATION
90.47
MALES / 100 FEMALES
110.53
FEMALES / 100 MALES
40.8
MEDIAN AGE
2.9
AVG FAMILY SIZE
2.3
AVG HOUSEHOLD SIZE
$35,987
PER CAPITA INCOME
$86,625
AVG FAMILY INCOME
$71,292
AVG HOUSEHOLD INCOME
29.7%
WAGE / INCOME GAP [ % ]
70.3¢/ $1
WAGE / INCOME GAP [ $ ]
$13,575
FAMILY INCOME DEFICIT
0.38
INEQUALITY / GINI INDEX
4,202
LABOR FORCE [ PEOPLE ]
71.7%
PERCENT IN LABOR FORCE
1.6%
UNEMPLOYMENT RATE
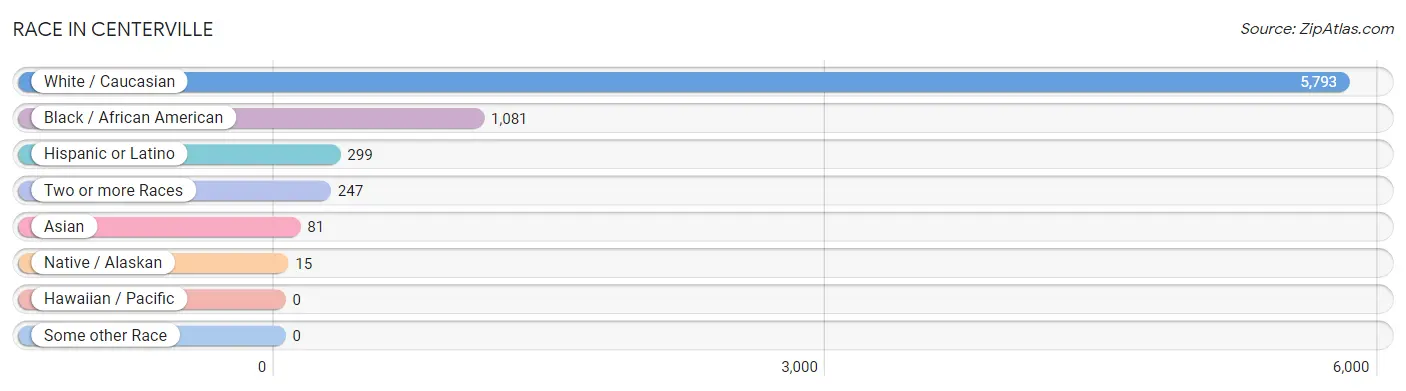
Race in Centerville
The most populous races in Centerville are White / Caucasian (5,793 | 80.3%), Black / African American (1,081 | 15.0%), and Hispanic or Latino (299 | 4.1%).
| Race | # Population | % Population |
| Asian | 81 | 1.1% |
| Black / African American | 1,081 | 15.0% |
| Hawaiian / Pacific | 0 | 0.0% |
| Hispanic or Latino | 299 | 4.1% |
| Native / Alaskan | 15 | 0.2% |
| White / Caucasian | 5,793 | 80.3% |
| Two or more Races | 247 | 3.4% |
| Some other Race | 0 | 0.0% |
| Total | 7,217 | 100.0% |
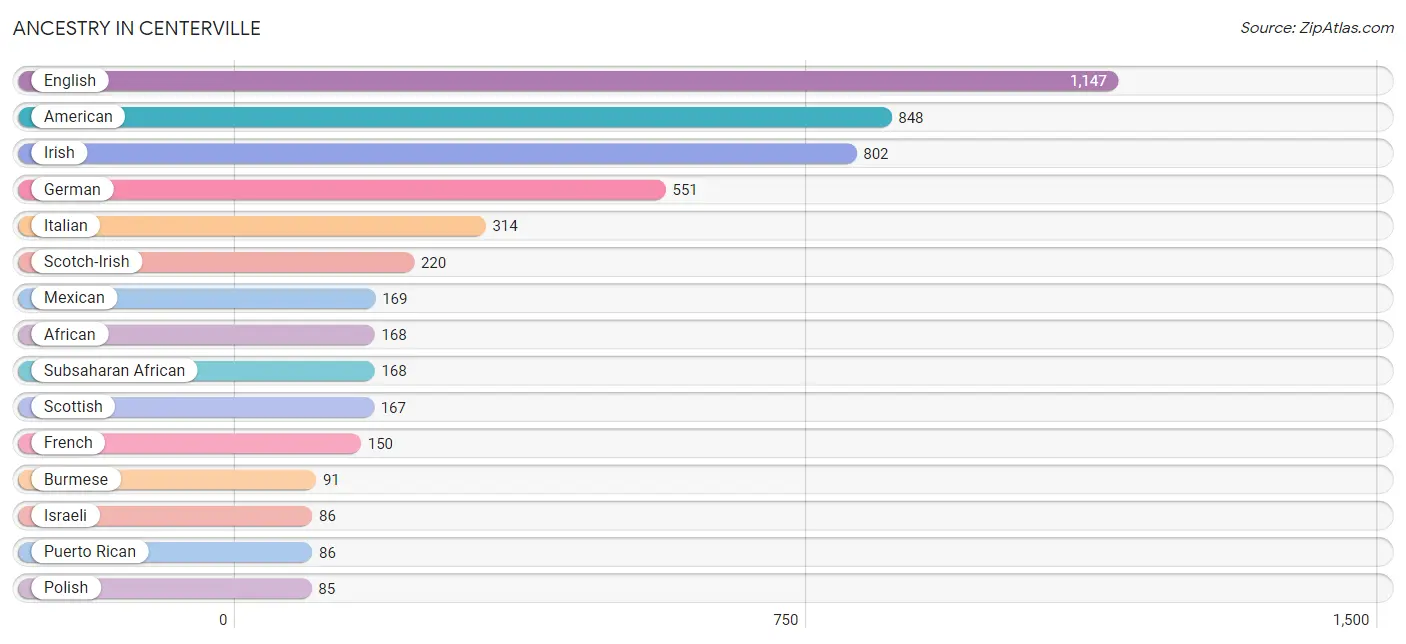
Ancestry in Centerville
The most populous ancestries reported in Centerville are English (1,147 | 15.9%), American (848 | 11.7%), Irish (802 | 11.1%), German (551 | 7.6%), and Italian (314 | 4.3%), together accounting for 50.7% of all Centerville residents.
| Ancestry | # Population | % Population |
| African | 168 | 2.3% |
| American | 848 | 11.7% |
| Austrian | 7 | 0.1% |
| Bhutanese | 12 | 0.2% |
| British | 66 | 0.9% |
| Burmese | 91 | 1.3% |
| Central American | 15 | 0.2% |
| Central American Indian | 15 | 0.2% |
| Dutch | 32 | 0.4% |
| English | 1,147 | 15.9% |
| Finnish | 29 | 0.4% |
| French | 150 | 2.1% |
| German | 551 | 7.6% |
| Greek | 14 | 0.2% |
| Guatemalan | 15 | 0.2% |
| Hungarian | 8 | 0.1% |
| Iranian | 4 | 0.1% |
| Irish | 802 | 11.1% |
| Israeli | 86 | 1.2% |
| Italian | 314 | 4.3% |
| Korean | 12 | 0.2% |
| Mexican | 169 | 2.3% |
| Polish | 85 | 1.2% |
| Portuguese | 24 | 0.3% |
| Puerto Rican | 86 | 1.2% |
| Scotch-Irish | 220 | 3.0% |
| Scottish | 167 | 2.3% |
| Spanish | 29 | 0.4% |
| Subsaharan African | 168 | 2.3% |
| Swedish | 80 | 1.1% |
| Welsh | 7 | 0.1% | View All 31 Rows |
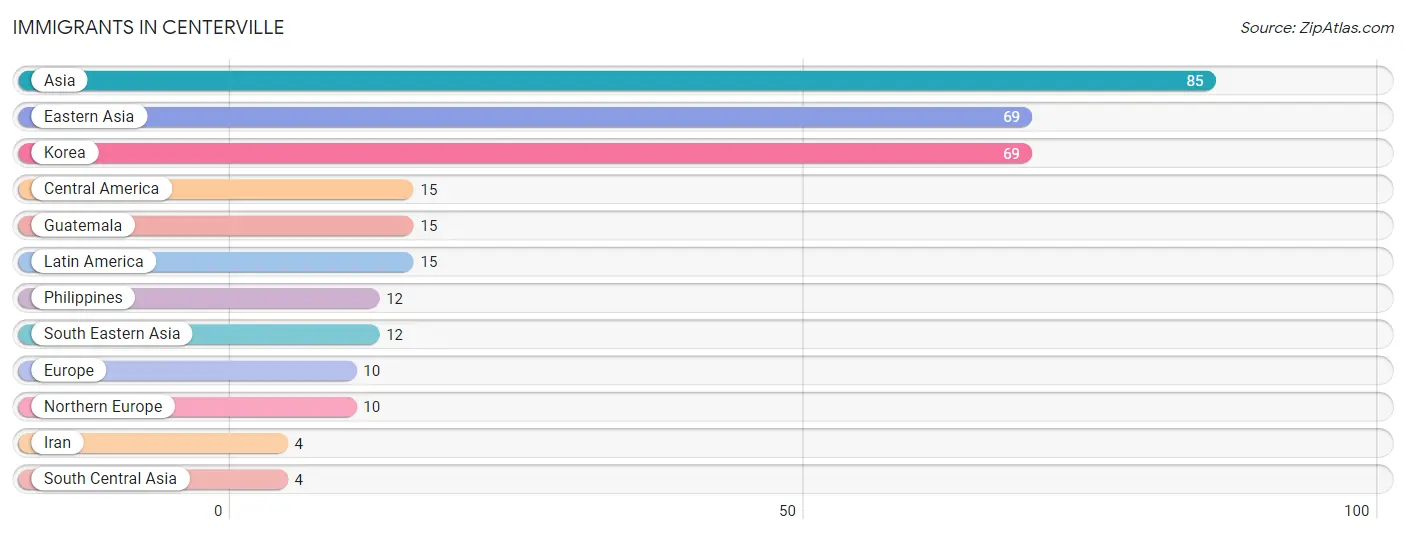
Immigrants in Centerville
The most numerous immigrant groups reported in Centerville came from Asia (85 | 1.2%), Eastern Asia (69 | 1.0%), Korea (69 | 1.0%), Central America (15 | 0.2%), and Guatemala (15 | 0.2%), together accounting for 3.5% of all Centerville residents.
| Immigration Origin | # Population | % Population |
| Asia | 85 | 1.2% |
| Central America | 15 | 0.2% |
| Eastern Asia | 69 | 1.0% |
| Europe | 10 | 0.1% |
| Guatemala | 15 | 0.2% |
| Iran | 4 | 0.1% |
| Korea | 69 | 1.0% |
| Latin America | 15 | 0.2% |
| Northern Europe | 10 | 0.1% |
| Philippines | 12 | 0.2% |
| South Central Asia | 4 | 0.1% |
| South Eastern Asia | 12 | 0.2% | View All 12 Rows |
Sex and Age in Centerville
Sex and Age in Centerville
The most populous age groups in Centerville are 35 to 39 Years (306 | 8.9%) for men and 50 to 54 Years (337 | 8.9%) for women.
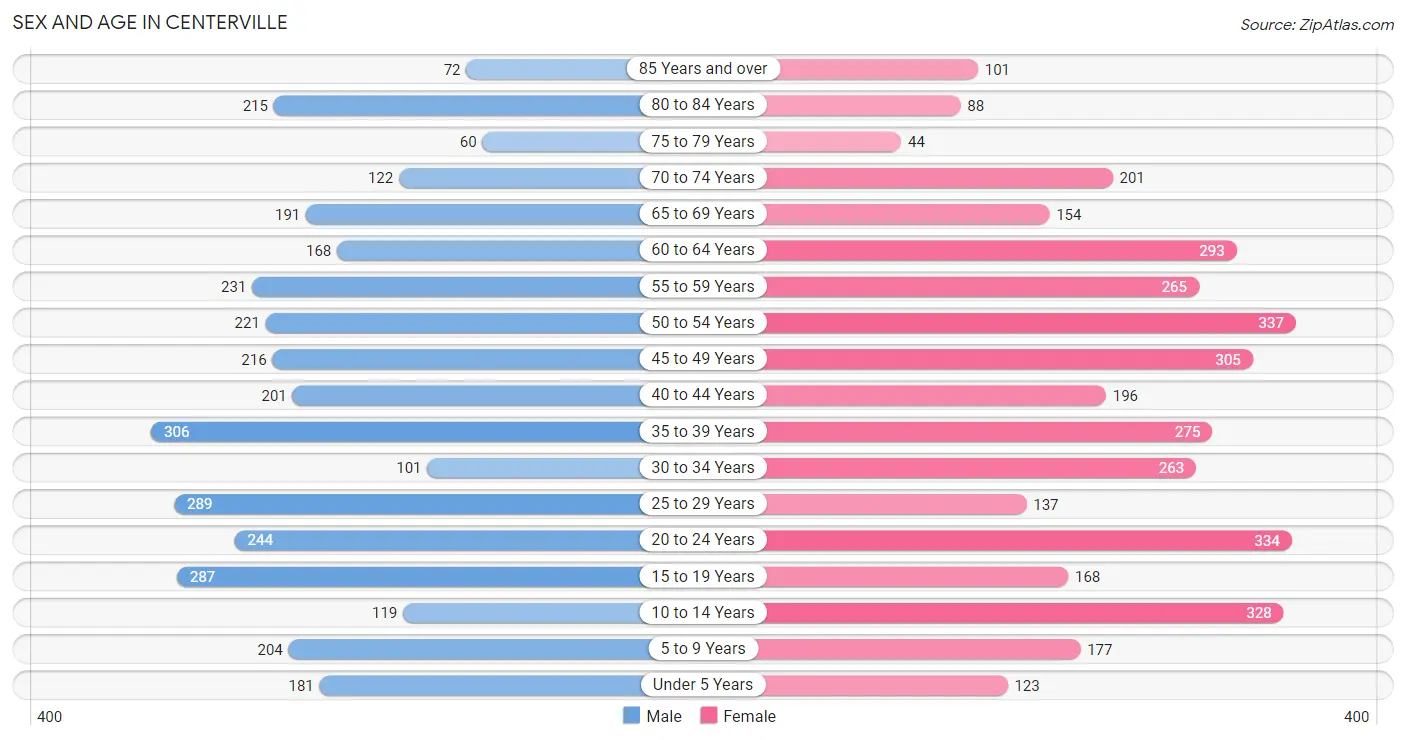
| Age Bracket | Male | Female |
| Under 5 Years | 181 (5.3%) | 123 (3.3%) |
| 5 to 9 Years | 204 (5.9%) | 177 (4.7%) |
| 10 to 14 Years | 119 (3.5%) | 328 (8.7%) |
| 15 to 19 Years | 287 (8.4%) | 168 (4.4%) |
| 20 to 24 Years | 244 (7.1%) | 334 (8.8%) |
| 25 to 29 Years | 289 (8.4%) | 137 (3.6%) |
| 30 to 34 Years | 101 (2.9%) | 263 (6.9%) |
| 35 to 39 Years | 306 (8.9%) | 275 (7.3%) |
| 40 to 44 Years | 201 (5.9%) | 196 (5.2%) |
| 45 to 49 Years | 216 (6.3%) | 305 (8.1%) |
| 50 to 54 Years | 221 (6.5%) | 337 (8.9%) |
| 55 to 59 Years | 231 (6.7%) | 265 (7.0%) |
| 60 to 64 Years | 168 (4.9%) | 293 (7.7%) |
| 65 to 69 Years | 191 (5.6%) | 154 (4.1%) |
| 70 to 74 Years | 122 (3.6%) | 201 (5.3%) |
| 75 to 79 Years | 60 (1.8%) | 44 (1.2%) |
| 80 to 84 Years | 215 (6.3%) | 88 (2.3%) |
| 85 Years and over | 72 (2.1%) | 101 (2.7%) |
| Total | 3,428 (100.0%) | 3,789 (100.0%) |
Families and Households in Centerville
Median Family Size in Centerville
The median family size in Centerville is 2.85 persons per family, with single female/mother families (326 | 16.9%) accounting for the largest median family size of 3.47 persons per family. On the other hand, single male/father families (100 | 5.2%) represent the smallest median family size with 2.41 persons per family.
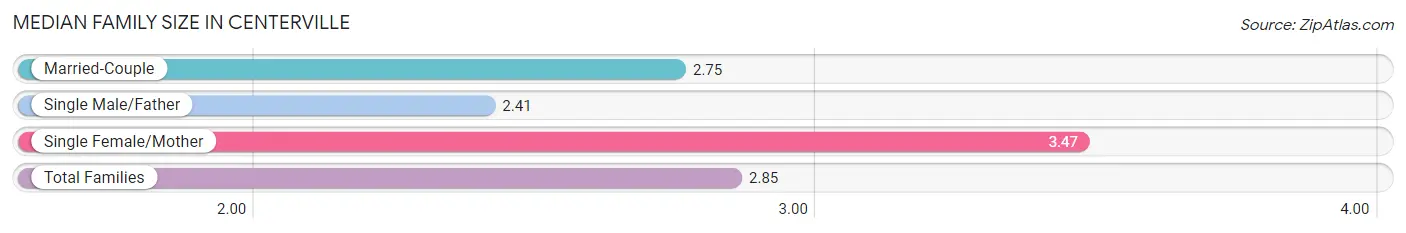
| Family Type | # Families | Family Size |
| Married-Couple | 1,504 (77.9%) | 2.75 |
| Single Male/Father | 100 (5.2%) | 2.41 |
| Single Female/Mother | 326 (16.9%) | 3.47 |
| Total Families | 1,930 (100.0%) | 2.85 |
Median Household Size in Centerville
The median household size in Centerville is 2.32 persons per household, with single female/mother households (326 | 10.5%) accounting for the largest median household size of 3.83 persons per household. non-family households (1,175 | 37.8%) represent the smallest median household size with 1.18 persons per household.
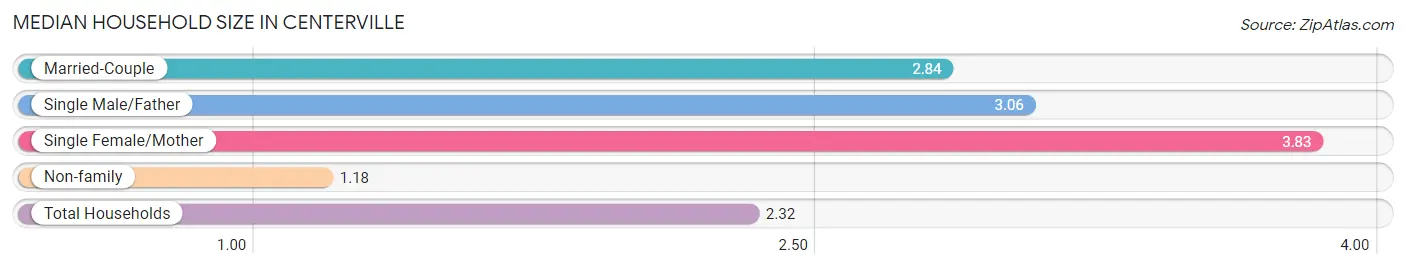
| Household Type | # Households | Household Size |
| Married-Couple | 1,504 (48.4%) | 2.84 |
| Single Male/Father | 100 (3.2%) | 3.06 |
| Single Female/Mother | 326 (10.5%) | 3.83 |
| Non-family | 1,175 (37.8%) | 1.18 |
| Total Households | 3,105 (100.0%) | 2.32 |
Household Size by Marriage Status in Centerville
Out of a total of 3,105 households in Centerville, 1,930 (62.2%) are family households, while 1,175 (37.8%) are nonfamily households. The most numerous type of family households are 2-person households, comprising 826, and the most common type of nonfamily households are 1-person households, comprising 1,018.
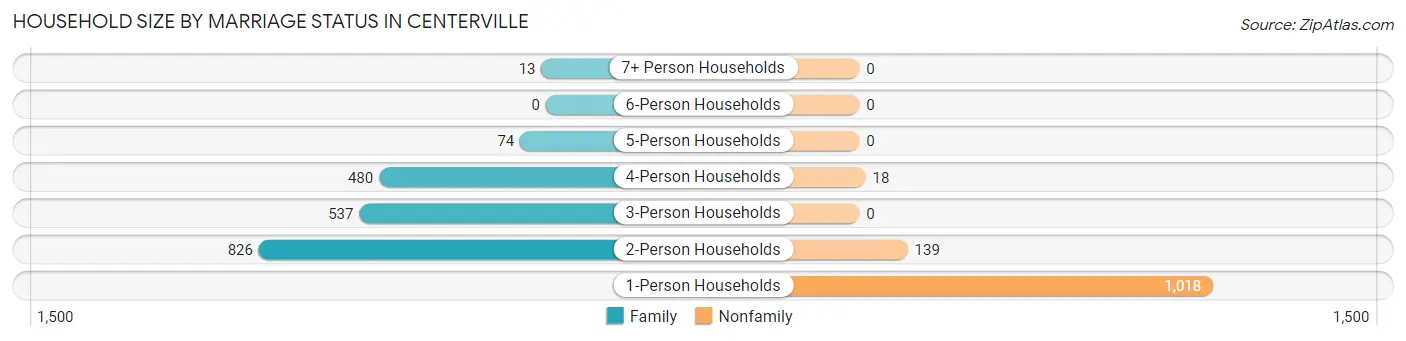
| Household Size | Family Households | Nonfamily Households |
| 1-Person Households | - | 1,018 (32.8%) |
| 2-Person Households | 826 (26.6%) | 139 (4.5%) |
| 3-Person Households | 537 (17.3%) | 0 (0.0%) |
| 4-Person Households | 480 (15.5%) | 18 (0.6%) |
| 5-Person Households | 74 (2.4%) | 0 (0.0%) |
| 6-Person Households | 0 (0.0%) | 0 (0.0%) |
| 7+ Person Households | 13 (0.4%) | 0 (0.0%) |
| Total | 1,930 (62.2%) | 1,175 (37.8%) |
Female Fertility in Centerville
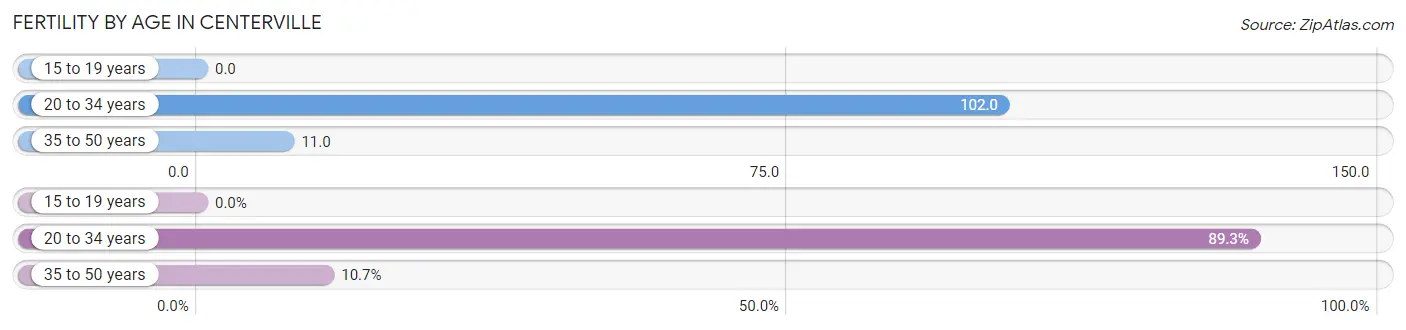
Fertility by Age in Centerville
Average fertility rate in Centerville is 49.0 births per 1,000 women. Women in the age bracket of 20 to 34 years have the highest fertility rate with 102.0 births per 1,000 women. Women in the age bracket of 20 to 34 years acount for 89.3% of all women with births.
| Age Bracket | Women with Births | Births / 1,000 Women |
| 15 to 19 years | 0 (0.0%) | 0.0 |
| 20 to 34 years | 75 (89.3%) | 102.0 |
| 35 to 50 years | 9 (10.7%) | 11.0 |
| Total | 84 (100.0%) | 49.0 |
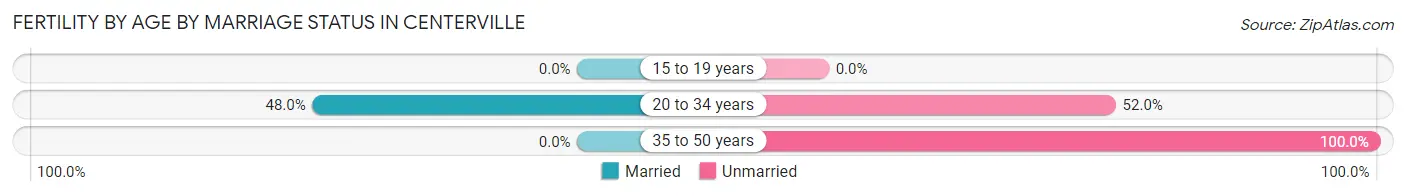
Fertility by Age by Marriage Status in Centerville
42.9% of women with births (84) in Centerville are married. The highest percentage of unmarried women with births falls into 35 to 50 years age bracket with 100.0% of them unmarried at the time of birth, while the lowest percentage of unmarried women with births belong to 20 to 34 years age bracket with 52.0% of them unmarried.
| Age Bracket | Married | Unmarried |
| 15 to 19 years | 0 (0.0%) | 0 (0.0%) |
| 20 to 34 years | 36 (48.0%) | 39 (52.0%) |
| 35 to 50 years | 0 (0.0%) | 9 (100.0%) |
| Total | 36 (42.9%) | 48 (57.1%) |
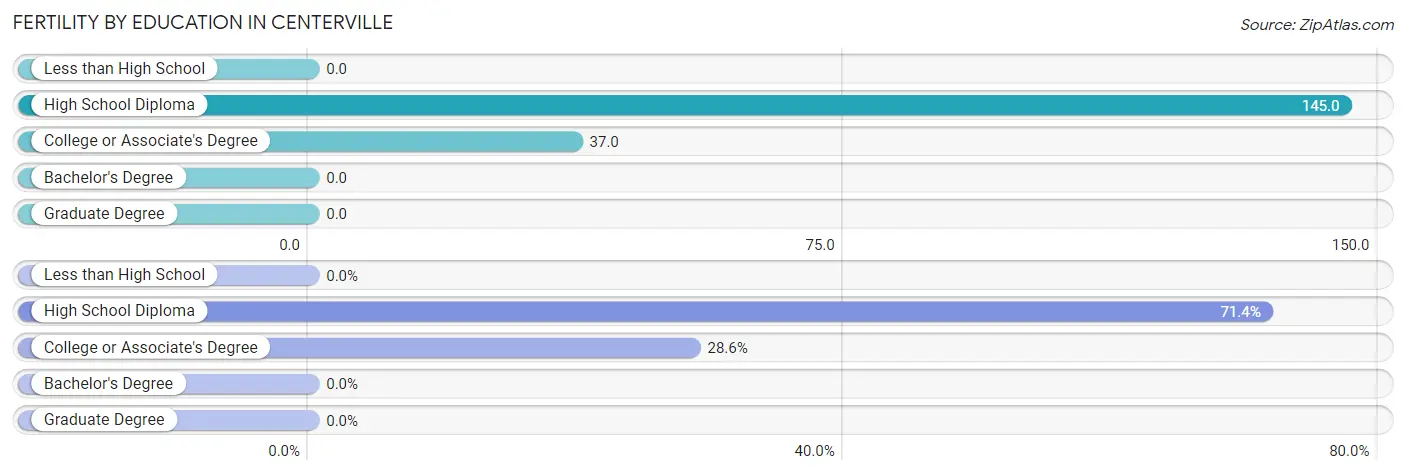
Fertility by Education in Centerville
| Educational Attainment | Women with Births | Births / 1,000 Women |
| Less than High School | 0 (0.0%) | 0.0 |
| High School Diploma | 60 (71.4%) | 145.0 |
| College or Associate's Degree | 24 (28.6%) | 37.0 |
| Bachelor's Degree | 0 (0.0%) | 0.0 |
| Graduate Degree | 0 (0.0%) | 0.0 |
| Total | 84 (100.0%) | 49.0 |
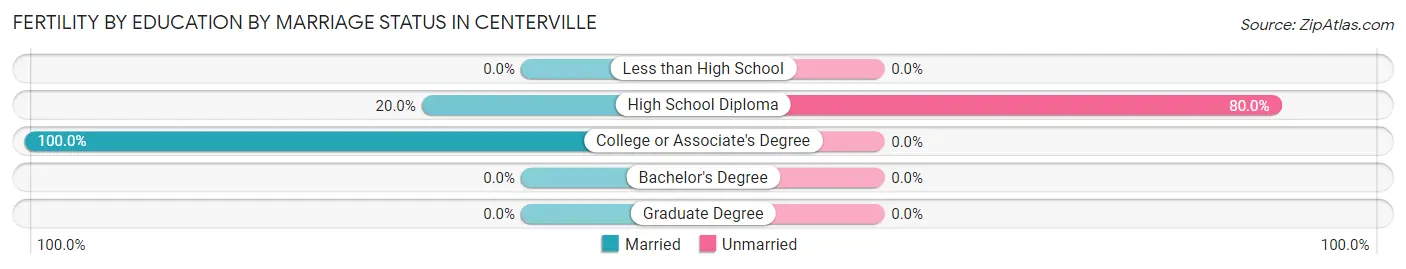
Fertility by Education by Marriage Status in Centerville
57.1% of women with births in Centerville are unmarried. Women with the educational attainment of college or associate's degree are most likely to be married with 100.0% of them married at childbirth, while women with the educational attainment of high school diploma are least likely to be married with 80.0% of them unmarried at childbirth.
| Educational Attainment | Married | Unmarried |
| Less than High School | 0 (0.0%) | 0 (0.0%) |
| High School Diploma | 12 (20.0%) | 48 (80.0%) |
| College or Associate's Degree | 24 (100.0%) | 0 (0.0%) |
| Bachelor's Degree | 0 (0.0%) | 0 (0.0%) |
| Graduate Degree | 0 (0.0%) | 0 (0.0%) |
| Total | 36 (42.9%) | 48 (57.1%) |
Income in Centerville
Income Overview in Centerville
Per Capita Income in Centerville is $35,987, while median incomes of families and households are $86,625 and $71,292 respectively.
| Characteristic | Number | Measure |
| Per Capita Income | 7,217 | $35,987 |
| Median Family Income | 1,930 | $86,625 |
| Mean Family Income | 1,930 | $95,851 |
| Median Household Income | 3,105 | $71,292 |
| Mean Household Income | 3,105 | $82,616 |
| Income Deficit | 1,930 | $13,575 |
| Wage / Income Gap (%) | 7,217 | 29.75% |
| Wage / Income Gap ($) | 7,217 | 70.25¢ per $1 |
| Gini / Inequality Index | 7,217 | 0.38 |
Earnings by Sex in Centerville
Average Earnings in Centerville are $44,489, $49,430 for men and $34,727 for women, a difference of 29.7%.
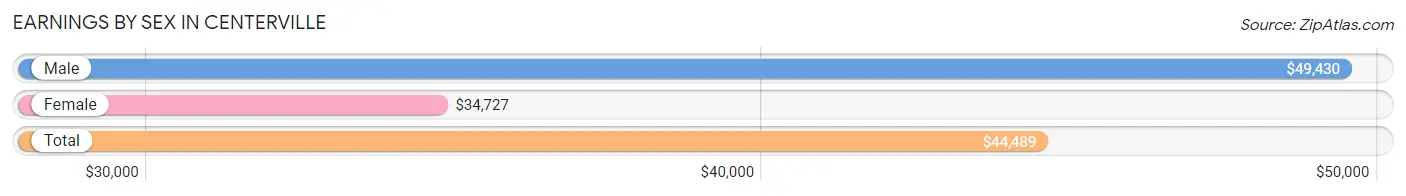
| Sex | Number | Average Earnings |
| Male | 2,079 (48.1%) | $49,430 |
| Female | 2,241 (51.9%) | $34,727 |
| Total | 4,320 (100.0%) | $44,489 |
Earnings by Sex by Income Bracket in Centerville
The most common earnings brackets in Centerville are $75,000 to $99,999 for men (278 | 13.4%) and $55,000 to $64,999 for women (304 | 13.6%).
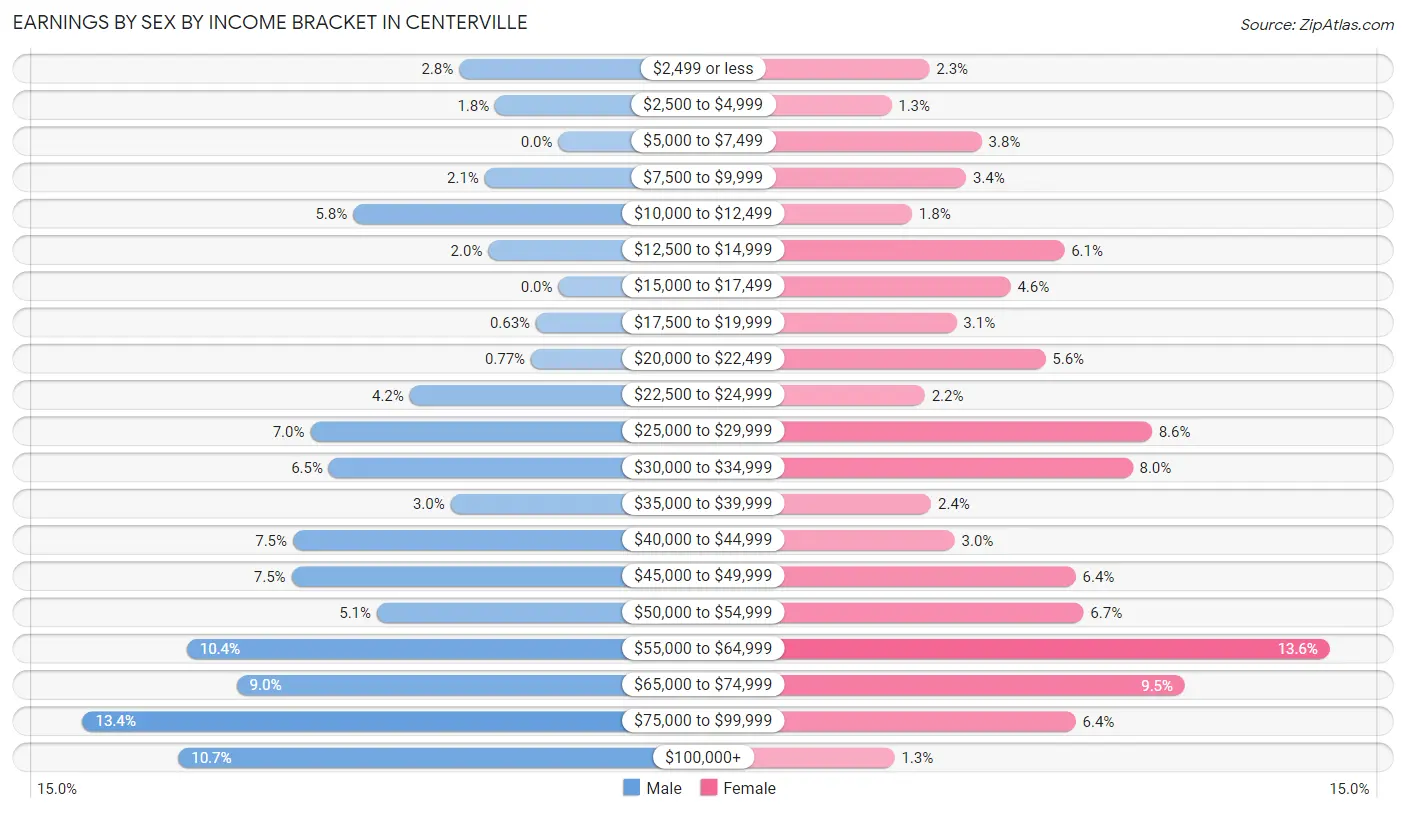
| Income | Male | Female |
| $2,499 or less | 58 (2.8%) | 52 (2.3%) |
| $2,500 to $4,999 | 37 (1.8%) | 28 (1.3%) |
| $5,000 to $7,499 | 0 (0.0%) | 85 (3.8%) |
| $7,500 to $9,999 | 43 (2.1%) | 75 (3.4%) |
| $10,000 to $12,499 | 120 (5.8%) | 41 (1.8%) |
| $12,500 to $14,999 | 41 (2.0%) | 137 (6.1%) |
| $15,000 to $17,499 | 0 (0.0%) | 103 (4.6%) |
| $17,500 to $19,999 | 13 (0.6%) | 69 (3.1%) |
| $20,000 to $22,499 | 16 (0.8%) | 125 (5.6%) |
| $22,500 to $24,999 | 87 (4.2%) | 49 (2.2%) |
| $25,000 to $29,999 | 145 (7.0%) | 192 (8.6%) |
| $30,000 to $34,999 | 134 (6.5%) | 180 (8.0%) |
| $35,000 to $39,999 | 63 (3.0%) | 53 (2.4%) |
| $40,000 to $44,999 | 155 (7.5%) | 68 (3.0%) |
| $45,000 to $49,999 | 156 (7.5%) | 144 (6.4%) |
| $50,000 to $54,999 | 106 (5.1%) | 149 (6.7%) |
| $55,000 to $64,999 | 217 (10.4%) | 304 (13.6%) |
| $65,000 to $74,999 | 188 (9.0%) | 213 (9.5%) |
| $75,000 to $99,999 | 278 (13.4%) | 144 (6.4%) |
| $100,000+ | 222 (10.7%) | 30 (1.3%) |
| Total | 2,079 (100.0%) | 2,241 (100.0%) |
Earnings by Sex by Educational Attainment in Centerville
Average earnings in Centerville are $52,241 for men and $45,201 for women, a difference of 13.5%. Men with an educational attainment of graduate degree enjoy the highest average annual earnings of $86,364, while those with college or associate's degree education earn the least with $49,030. Women with an educational attainment of bachelor's degree earn the most with the average annual earnings of $63,775, while those with less than high school education have the smallest earnings of $27,019.
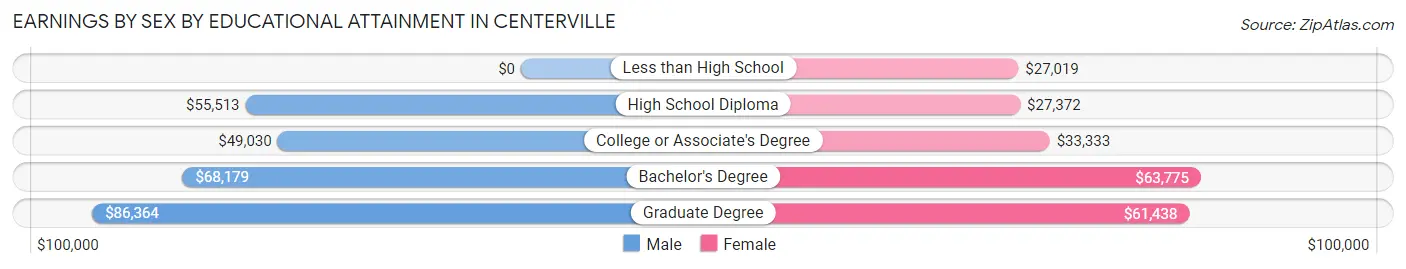
| Educational Attainment | Male Income | Female Income |
| Less than High School | - | - |
| High School Diploma | $55,513 | $27,372 |
| College or Associate's Degree | $49,030 | $33,333 |
| Bachelor's Degree | $68,179 | $63,775 |
| Graduate Degree | $86,364 | $61,438 |
| Total | $52,241 | $45,201 |
Family Income in Centerville
Family Income Brackets in Centerville
According to the Centerville family income data, there are 535 families falling into the $100,000 to $149,999 income range, which is the most common income bracket and makes up 27.7% of all families. Conversely, the $10,000 to $14,999 income bracket is the least frequent group with only 14 families (0.7%) belonging to this category.
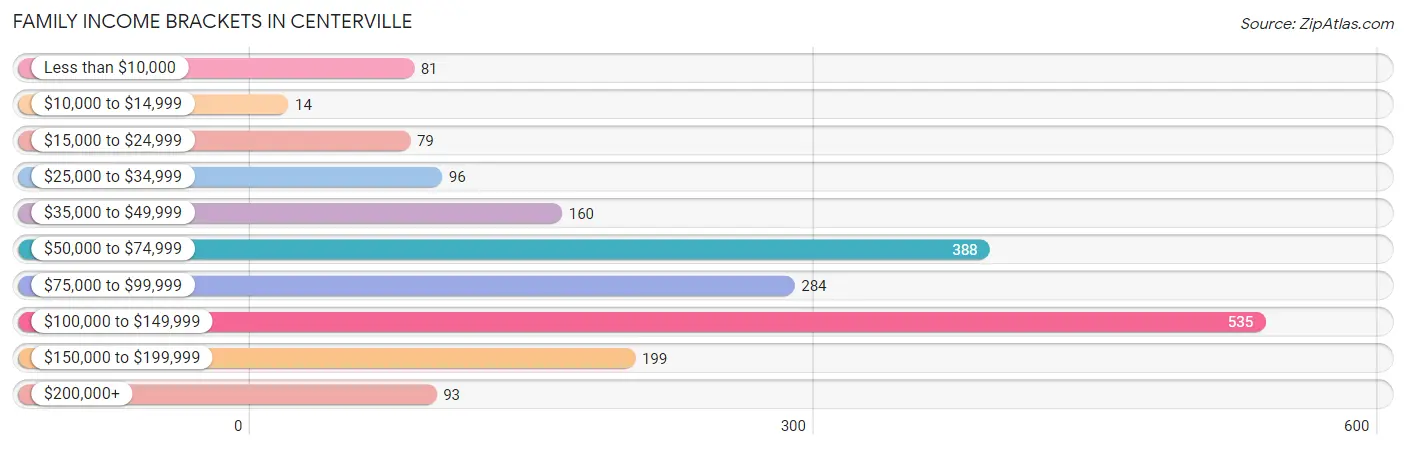
| Income Bracket | # Families | % Families |
| Less than $10,000 | 81 | 4.2% |
| $10,000 to $14,999 | 14 | 0.7% |
| $15,000 to $24,999 | 79 | 4.1% |
| $25,000 to $34,999 | 96 | 5.0% |
| $35,000 to $49,999 | 160 | 8.3% |
| $50,000 to $74,999 | 388 | 20.1% |
| $75,000 to $99,999 | 284 | 14.7% |
| $100,000 to $149,999 | 535 | 27.7% |
| $150,000 to $199,999 | 199 | 10.3% |
| $200,000+ | 93 | 4.8% |
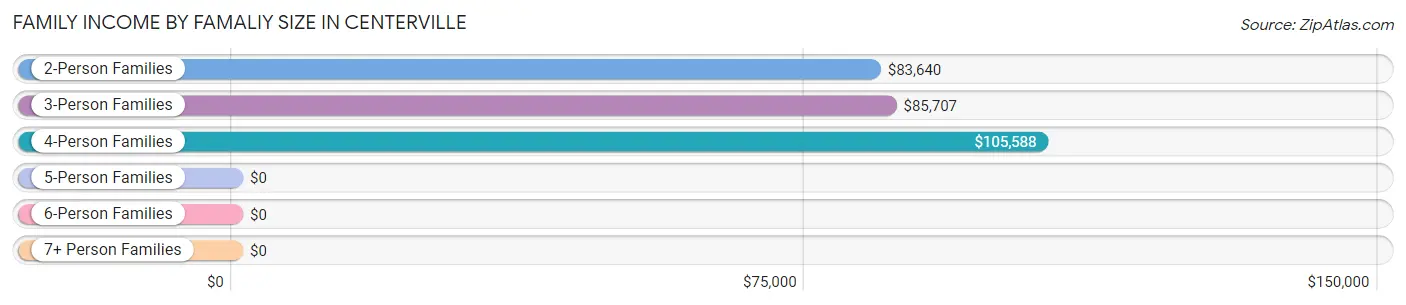
Family Income by Famaliy Size in Centerville
4-person families (310 | 16.1%) account for the highest median family income in Centerville with $105,588 per family, while 2-person families (916 | 47.5%) have the highest median income of $41,820 per family member.
| Income Bracket | # Families | Median Income |
| 2-Person Families | 916 (47.5%) | $83,640 |
| 3-Person Families | 629 (32.6%) | $85,707 |
| 4-Person Families | 310 (16.1%) | $105,588 |
| 5-Person Families | 62 (3.2%) | $0 |
| 6-Person Families | 0 (0.0%) | $0 |
| 7+ Person Families | 13 (0.7%) | $0 |
| Total | 1,930 (100.0%) | $86,625 |
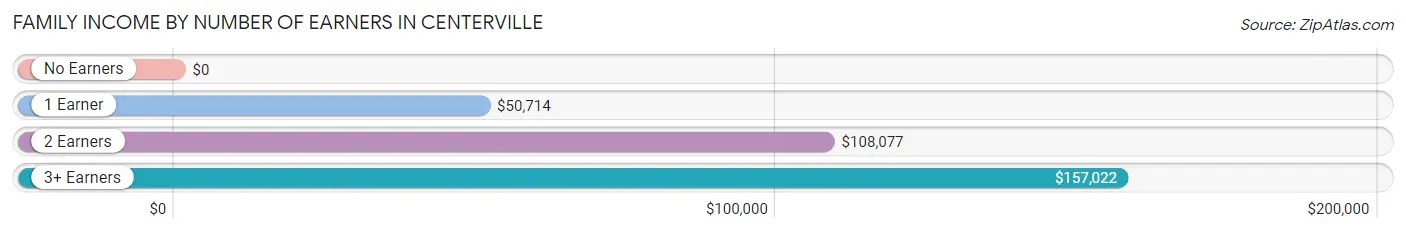
Family Income by Number of Earners in Centerville
| Number of Earners | # Families | Median Income |
| No Earners | 209 (10.8%) | $0 |
| 1 Earner | 528 (27.4%) | $50,714 |
| 2 Earners | 1,008 (52.2%) | $108,077 |
| 3+ Earners | 185 (9.6%) | $157,022 |
| Total | 1,930 (100.0%) | $86,625 |
Household Income in Centerville
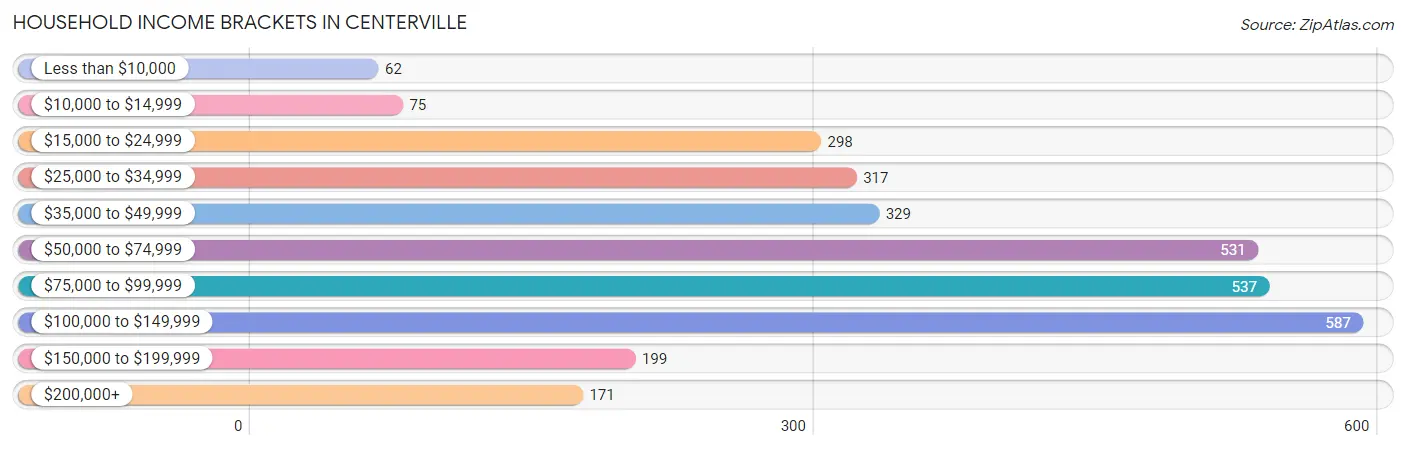
Household Income Brackets in Centerville
With 587 households falling in the category, the $100,000 to $149,999 income range is the most frequent in Centerville, accounting for 18.9% of all households. In contrast, only 62 households (2.0%) fall into the less than $10,000 income bracket, making it the least populous group.
| Income Bracket | # Households | % Households |
| Less than $10,000 | 62 | 2.0% |
| $10,000 to $14,999 | 75 | 2.4% |
| $15,000 to $24,999 | 298 | 9.6% |
| $25,000 to $34,999 | 317 | 10.2% |
| $35,000 to $49,999 | 329 | 10.6% |
| $50,000 to $74,999 | 531 | 17.1% |
| $75,000 to $99,999 | 537 | 17.3% |
| $100,000 to $149,999 | 587 | 18.9% |
| $150,000 to $199,999 | 199 | 6.4% |
| $200,000+ | 171 | 5.5% |
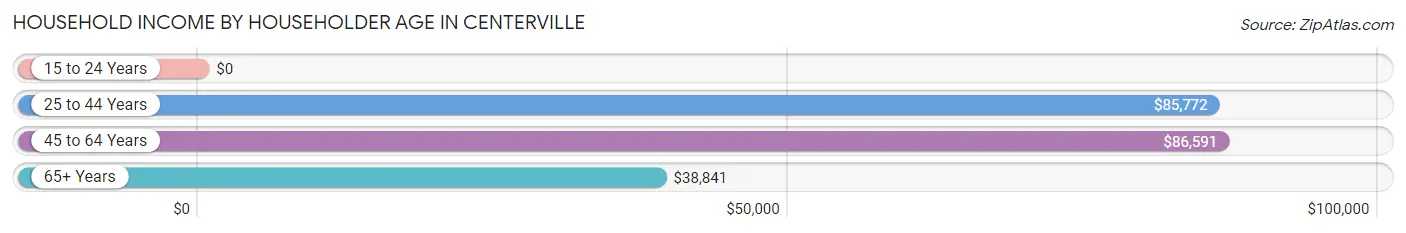
Household Income by Householder Age in Centerville
The median household income in Centerville is $71,292, with the highest median household income of $86,591 found in the 45 to 64 years age bracket for the primary householder. A total of 1,240 households (39.9%) fall into this category. Meanwhile, the 15 to 24 years age bracket for the primary householder has the lowest median household income of $0, with 211 households (6.8%) in this group.
| Income Bracket | # Households | Median Income |
| 15 to 24 Years | 211 (6.8%) | $0 |
| 25 to 44 Years | 800 (25.8%) | $85,772 |
| 45 to 64 Years | 1,240 (39.9%) | $86,591 |
| 65+ Years | 854 (27.5%) | $38,841 |
| Total | 3,105 (100.0%) | $71,292 |
Poverty in Centerville
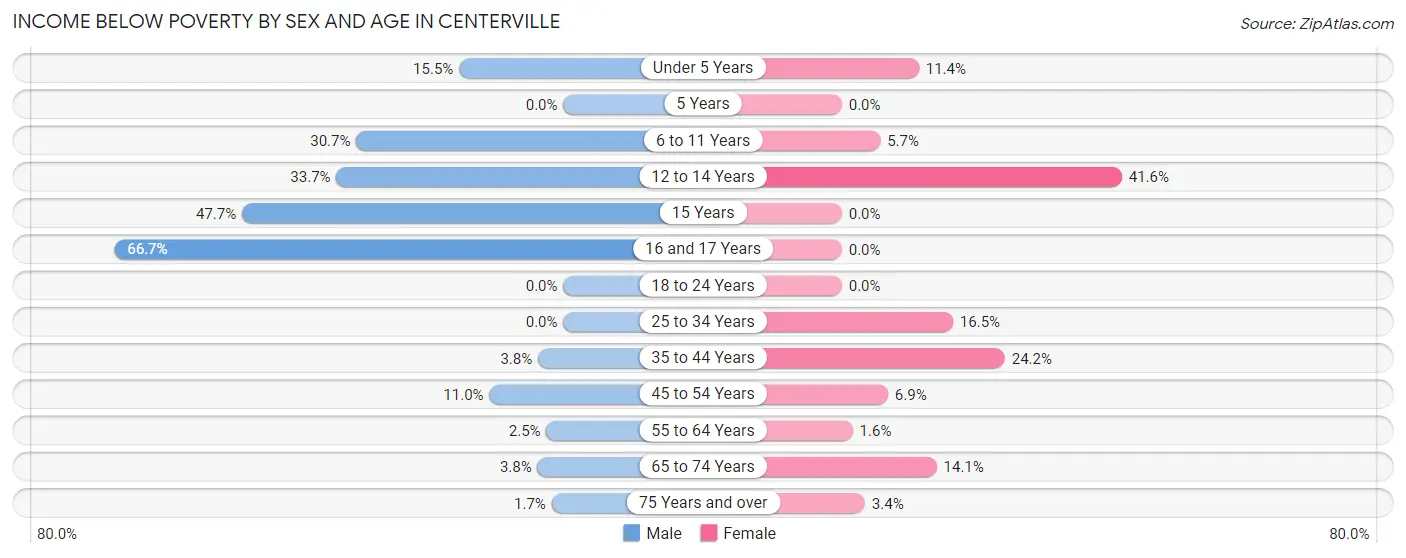
Income Below Poverty by Sex and Age in Centerville
With 9.6% poverty level for males and 9.8% for females among the residents of Centerville, 16 and 17 year old males and 12 to 14 year old females are the most vulnerable to poverty, with 52 males (66.7%) and 42 females (41.6%) in their respective age groups living below the poverty level.
| Age Bracket | Male | Female |
| Under 5 Years | 28 (15.5%) | 12 (11.4%) |
| 5 Years | 0 (0.0%) | 0 (0.0%) |
| 6 to 11 Years | 71 (30.7%) | 21 (5.7%) |
| 12 to 14 Years | 31 (33.7%) | 42 (41.6%) |
| 15 Years | 52 (47.7%) | 0 (0.0%) |
| 16 and 17 Years | 52 (66.7%) | 0 (0.0%) |
| 18 to 24 Years | 0 (0.0%) | 0 (0.0%) |
| 25 to 34 Years | 0 (0.0%) | 66 (16.5%) |
| 35 to 44 Years | 19 (3.7%) | 114 (24.2%) |
| 45 to 54 Years | 48 (11.0%) | 44 (6.9%) |
| 55 to 64 Years | 10 (2.5%) | 9 (1.6%) |
| 65 to 74 Years | 12 (3.8%) | 50 (14.1%) |
| 75 Years and over | 6 (1.7%) | 8 (3.4%) |
| Total | 329 (9.6%) | 366 (9.8%) |
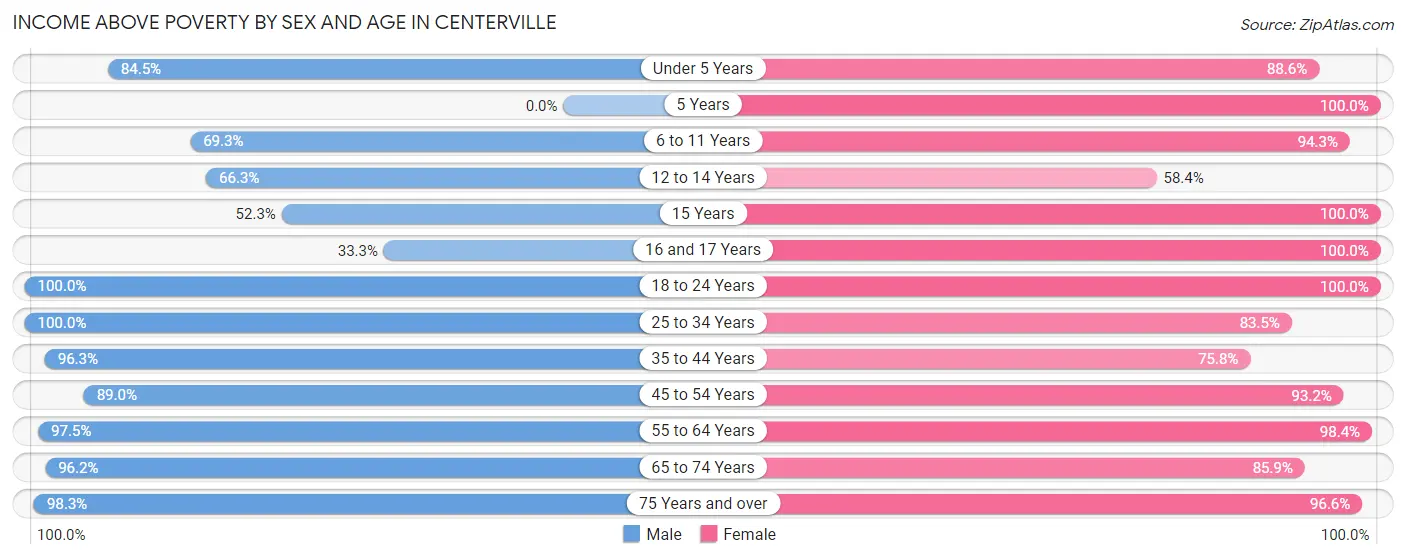
Income Above Poverty by Sex and Age in Centerville
According to the poverty statistics in Centerville, males aged 18 to 24 years and females aged 5 years are the age groups that are most secure financially, with 100.0% of males and 100.0% of females in these age groups living above the poverty line.
| Age Bracket | Male | Female |
| Under 5 Years | 153 (84.5%) | 93 (88.6%) |
| 5 Years | 0 (0.0%) | 14 (100.0%) |
| 6 to 11 Years | 160 (69.3%) | 347 (94.3%) |
| 12 to 14 Years | 61 (66.3%) | 59 (58.4%) |
| 15 Years | 57 (52.3%) | 116 (100.0%) |
| 16 and 17 Years | 26 (33.3%) | 6 (100.0%) |
| 18 to 24 Years | 344 (100.0%) | 380 (100.0%) |
| 25 to 34 Years | 390 (100.0%) | 334 (83.5%) |
| 35 to 44 Years | 488 (96.3%) | 357 (75.8%) |
| 45 to 54 Years | 389 (89.0%) | 598 (93.1%) |
| 55 to 64 Years | 389 (97.5%) | 549 (98.4%) |
| 65 to 74 Years | 301 (96.2%) | 305 (85.9%) |
| 75 Years and over | 341 (98.3%) | 225 (96.6%) |
| Total | 3,099 (90.4%) | 3,383 (90.2%) |
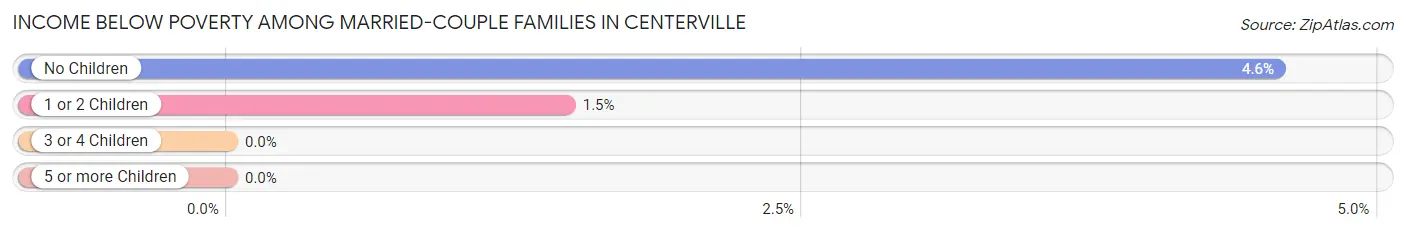
Income Below Poverty Among Married-Couple Families in Centerville
The poverty statistics for married-couple families in Centerville show that 3.7% or 55 of the total 1,504 families live below the poverty line. Families with no children have the highest poverty rate of 4.6%, comprising of 49 families. On the other hand, families with 3 or 4 children have the lowest poverty rate of 0.0%, which includes 0 families.
| Children | Above Poverty | Below Poverty |
| No Children | 1,026 (95.4%) | 49 (4.6%) |
| 1 or 2 Children | 403 (98.5%) | 6 (1.5%) |
| 3 or 4 Children | 20 (100.0%) | 0 (0.0%) |
| 5 or more Children | 0 (0.0%) | 0 (0.0%) |
| Total | 1,449 (96.3%) | 55 (3.7%) |
Income Below Poverty Among Single-Parent Households in Centerville
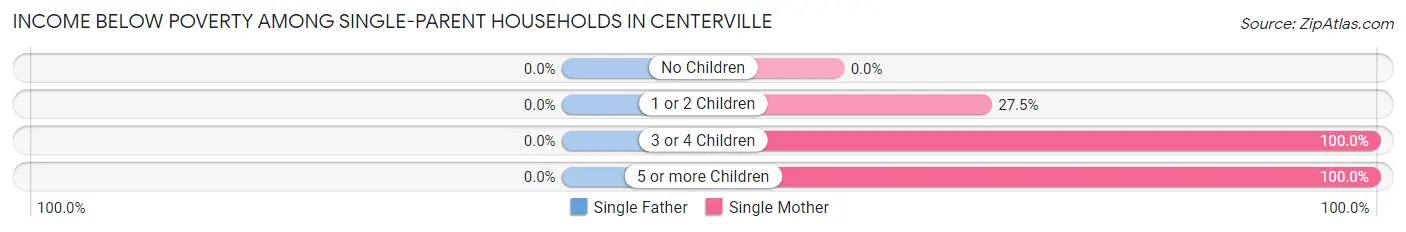
| Children | Single Father | Single Mother |
| No Children | 0 (0.0%) | 0 (0.0%) |
| 1 or 2 Children | 0 (0.0%) | 69 (27.5%) |
| 3 or 4 Children | 0 (0.0%) | 18 (100.0%) |
| 5 or more Children | 0 (0.0%) | 13 (100.0%) |
| Total | 0 (0.0%) | 100 (30.7%) |
Income Below Poverty Among Married-Couple vs Single-Parent Households in Centerville
The poverty data for Centerville shows that 55 of the married-couple family households (3.7%) and 100 of the single-parent households (23.5%) are living below the poverty level. Within the married-couple family households, those with no children have the highest poverty rate, with 49 households (4.6%) falling below the poverty line. Among the single-parent households, those with 3 or 4 children have the highest poverty rate, with 18 household (100.0%) living below poverty.
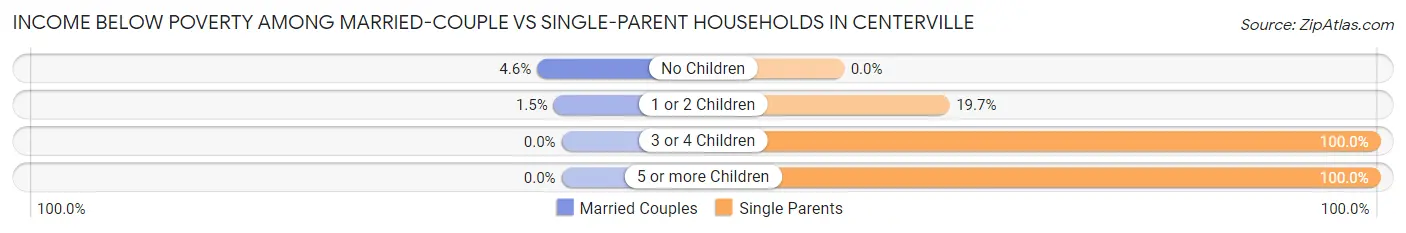
| Children | Married-Couple Families | Single-Parent Households |
| No Children | 49 (4.6%) | 0 (0.0%) |
| 1 or 2 Children | 6 (1.5%) | 69 (19.7%) |
| 3 or 4 Children | 0 (0.0%) | 18 (100.0%) |
| 5 or more Children | 0 (0.0%) | 13 (100.0%) |
| Total | 55 (3.7%) | 100 (23.5%) |
Employment Characteristics in Centerville
Employment by Class of Employer in Centerville
Among the 3,981 employed individuals in Centerville, private company employees (2,212 | 55.6%), not-for-profit organizations (719 | 18.1%), and local government employees (354 | 8.9%) make up the most common classes of employment.
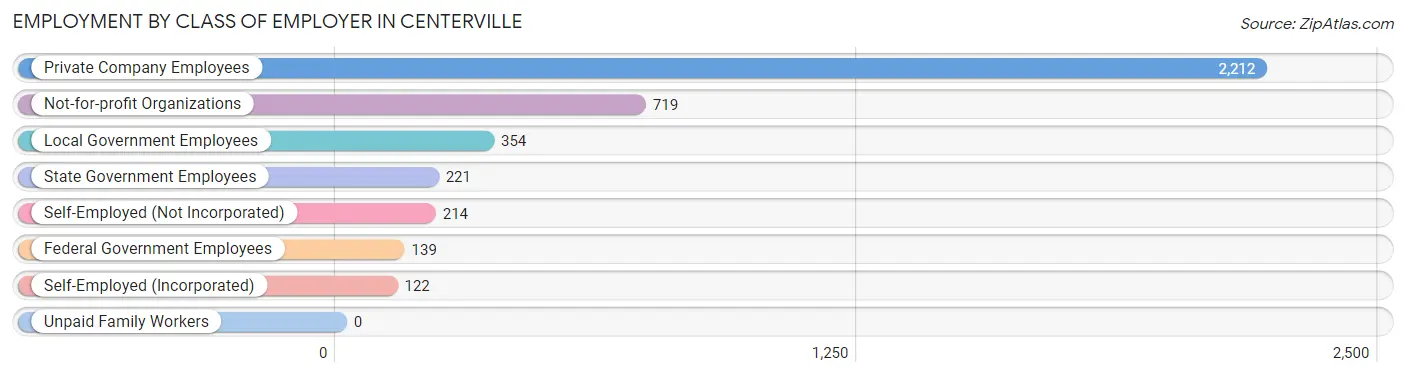
| Employer Class | # Employees | % Employees |
| Private Company Employees | 2,212 | 55.6% |
| Self-Employed (Incorporated) | 122 | 3.1% |
| Self-Employed (Not Incorporated) | 214 | 5.4% |
| Not-for-profit Organizations | 719 | 18.1% |
| Local Government Employees | 354 | 8.9% |
| State Government Employees | 221 | 5.6% |
| Federal Government Employees | 139 | 3.5% |
| Unpaid Family Workers | 0 | 0.0% |
| Total | 3,981 | 100.0% |
Employment Status by Age in Centerville
According to the labor force statistics for Centerville, out of the total population over 16 years of age (5,860), 71.7% or 4,202 individuals are in the labor force, with 1.6% or 67 of them unemployed. The age group with the highest labor force participation rate is 30 to 34 years, with 97.3% or 354 individuals in the labor force. Within the labor force, the 35 to 44 years age range has the highest percentage of unemployed individuals, with 6.1% or 55 of them being unemployed.
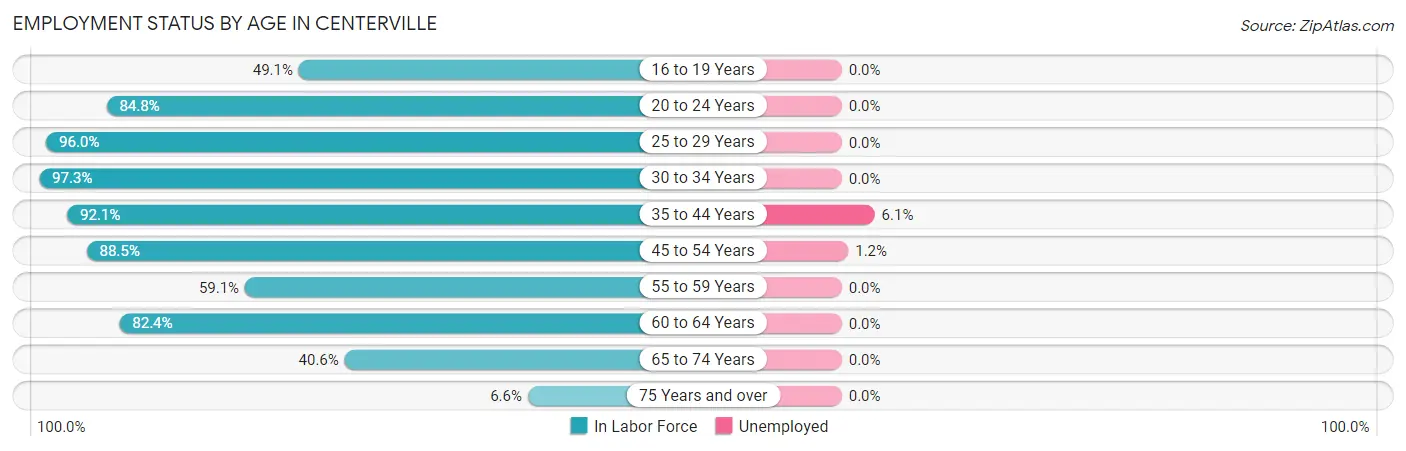
| Age Bracket | In Labor Force | Unemployed |
| 16 to 19 Years | 113 (49.1%) | 0 (0.0%) |
| 20 to 24 Years | 490 (84.8%) | 0 (0.0%) |
| 25 to 29 Years | 409 (96.0%) | 0 (0.0%) |
| 30 to 34 Years | 354 (97.3%) | 0 (0.0%) |
| 35 to 44 Years | 901 (92.1%) | 55 (6.1%) |
| 45 to 54 Years | 955 (88.5%) | 11 (1.2%) |
| 55 to 59 Years | 293 (59.1%) | 0 (0.0%) |
| 60 to 64 Years | 380 (82.4%) | 0 (0.0%) |
| 65 to 74 Years | 271 (40.6%) | 0 (0.0%) |
| 75 Years and over | 38 (6.6%) | 0 (0.0%) |
| Total | 4,202 (71.7%) | 67 (1.6%) |
Employment Status by Educational Attainment in Centerville
According to labor force statistics for Centerville, 86.5% of individuals (3,290) out of the total population between 25 and 64 years of age (3,804) are in the labor force, with 2.0% or 66 of them being unemployed. The group with the highest labor force participation rate are those with the educational attainment of bachelor's degree or higher, with 96.3% or 814 individuals in the labor force. Within the labor force, individuals with college / associate degree education have the highest percentage of unemployment, with 3.8% or 48 of them being unemployed.
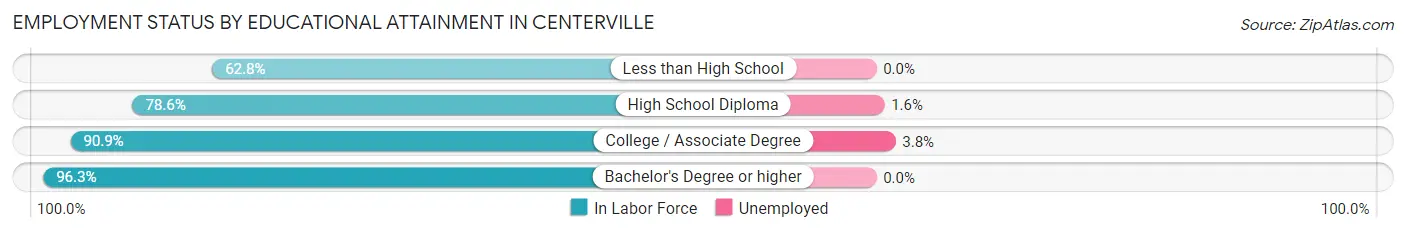
| Educational Attainment | In Labor Force | Unemployed |
| Less than High School | 71 (62.8%) | 0 (0.0%) |
| High School Diploma | 1,151 (78.6%) | 23 (1.6%) |
| College / Associate Degree | 1,255 (90.9%) | 52 (3.8%) |
| Bachelor's Degree or higher | 814 (96.3%) | 0 (0.0%) |
| Total | 3,290 (86.5%) | 76 (2.0%) |
Employment Occupations by Sex in Centerville
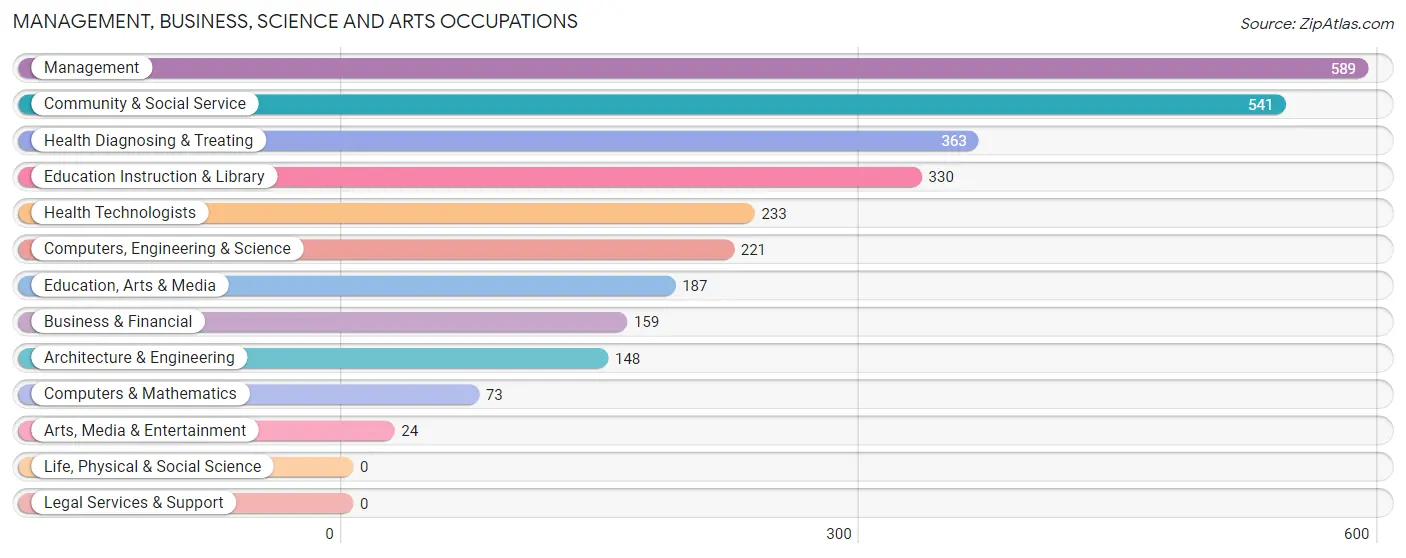
Management, Business, Science and Arts Occupations
The most common Management, Business, Science and Arts occupations in Centerville are Management (589 | 14.2%), Community & Social Service (541 | 13.1%), Health Diagnosing & Treating (363 | 8.8%), Education Instruction & Library (330 | 8.0%), and Health Technologists (233 | 5.6%).
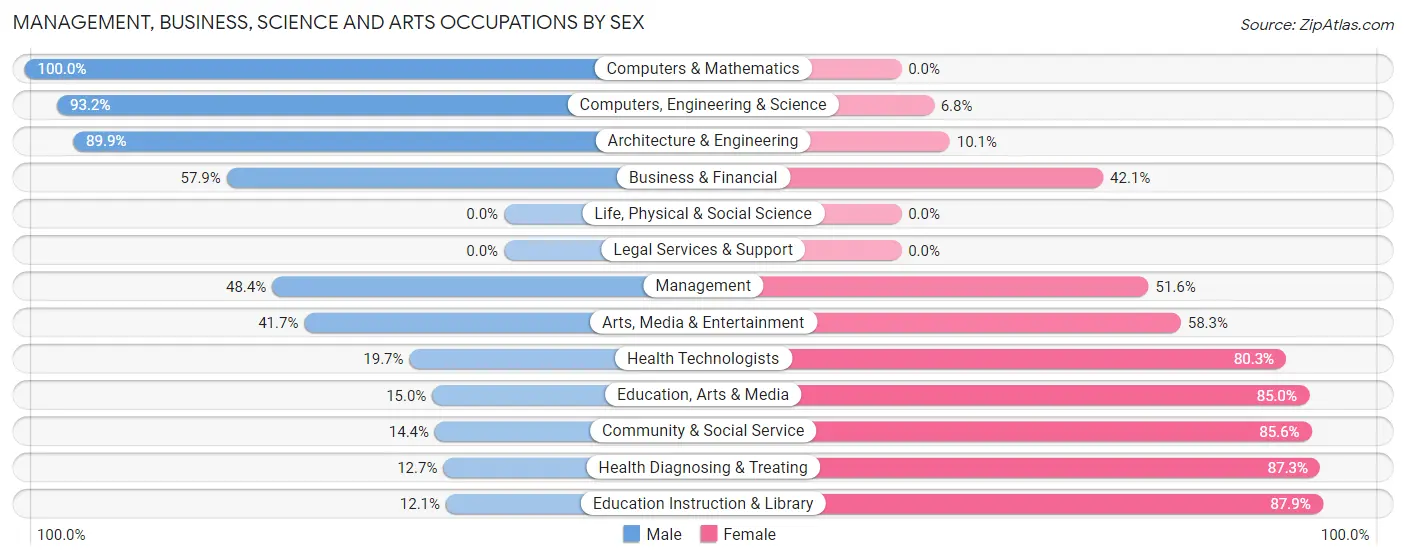
Management, Business, Science and Arts Occupations by Sex
Within the Management, Business, Science and Arts occupations in Centerville, the most male-oriented occupations are Computers & Mathematics (100.0%), Computers, Engineering & Science (93.2%), and Architecture & Engineering (89.9%), while the most female-oriented occupations are Education Instruction & Library (87.9%), Health Diagnosing & Treating (87.3%), and Community & Social Service (85.6%).
| Occupation | Male | Female |
| Management | 285 (48.4%) | 304 (51.6%) |
| Business & Financial | 92 (57.9%) | 67 (42.1%) |
| Computers, Engineering & Science | 206 (93.2%) | 15 (6.8%) |
| Computers & Mathematics | 73 (100.0%) | 0 (0.0%) |
| Architecture & Engineering | 133 (89.9%) | 15 (10.1%) |
| Life, Physical & Social Science | 0 (0.0%) | 0 (0.0%) |
| Community & Social Service | 78 (14.4%) | 463 (85.6%) |
| Education, Arts & Media | 28 (15.0%) | 159 (85.0%) |
| Legal Services & Support | 0 (0.0%) | 0 (0.0%) |
| Education Instruction & Library | 40 (12.1%) | 290 (87.9%) |
| Arts, Media & Entertainment | 10 (41.7%) | 14 (58.3%) |
| Health Diagnosing & Treating | 46 (12.7%) | 317 (87.3%) |
| Health Technologists | 46 (19.7%) | 187 (80.3%) |
| Total (Category) | 707 (37.8%) | 1,166 (62.3%) |
| Total (Overall) | 1,965 (47.5%) | 2,173 (52.5%) |
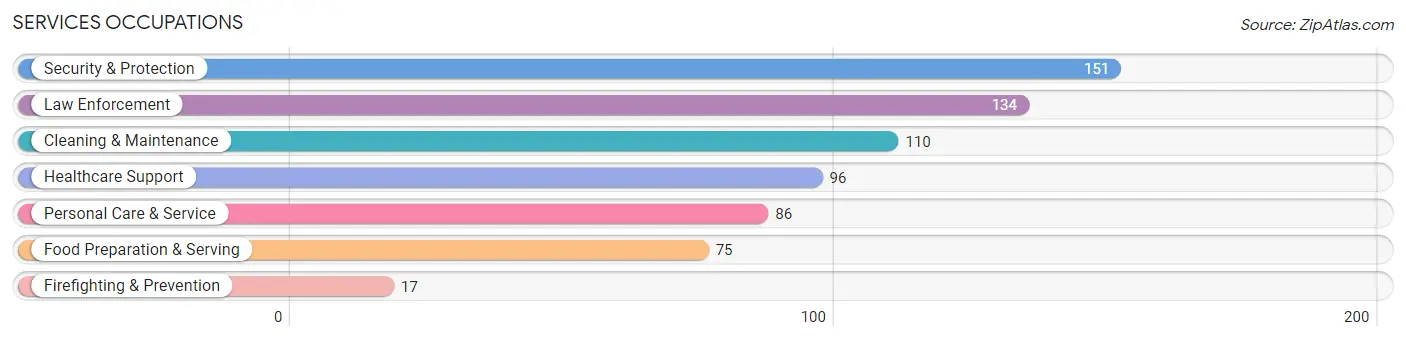
Services Occupations
The most common Services occupations in Centerville are Security & Protection (151 | 3.6%), Law Enforcement (134 | 3.2%), Cleaning & Maintenance (110 | 2.7%), Healthcare Support (96 | 2.3%), and Personal Care & Service (86 | 2.1%).
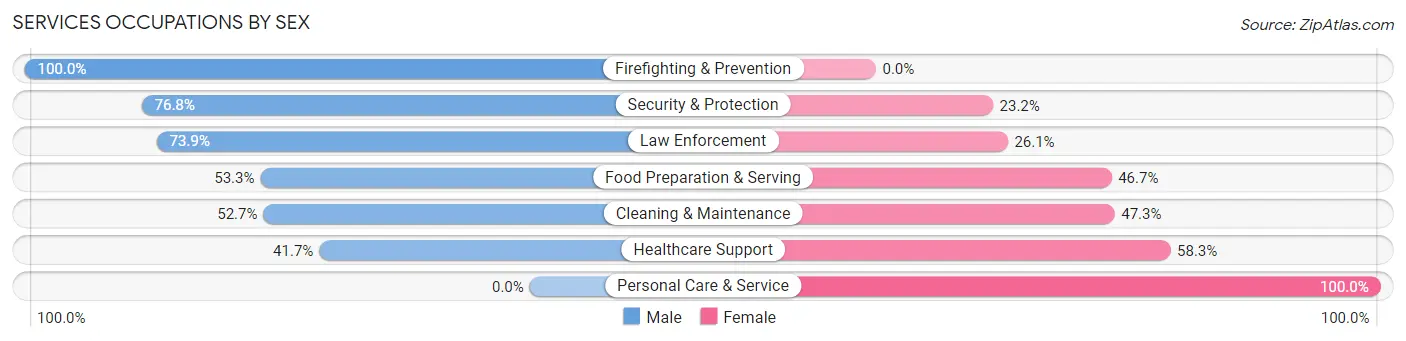
Services Occupations by Sex
Within the Services occupations in Centerville, the most male-oriented occupations are Firefighting & Prevention (100.0%), Security & Protection (76.8%), and Law Enforcement (73.9%), while the most female-oriented occupations are Personal Care & Service (100.0%), Healthcare Support (58.3%), and Cleaning & Maintenance (47.3%).
| Occupation | Male | Female |
| Healthcare Support | 40 (41.7%) | 56 (58.3%) |
| Security & Protection | 116 (76.8%) | 35 (23.2%) |
| Firefighting & Prevention | 17 (100.0%) | 0 (0.0%) |
| Law Enforcement | 99 (73.9%) | 35 (26.1%) |
| Food Preparation & Serving | 40 (53.3%) | 35 (46.7%) |
| Cleaning & Maintenance | 58 (52.7%) | 52 (47.3%) |
| Personal Care & Service | 0 (0.0%) | 86 (100.0%) |
| Total (Category) | 254 (49.0%) | 264 (51.0%) |
| Total (Overall) | 1,965 (47.5%) | 2,173 (52.5%) |
Sales and Office Occupations
The most common Sales and Office occupations in Centerville are Sales & Related (395 | 9.6%), and Office & Administration (309 | 7.5%).

Sales and Office Occupations by Sex
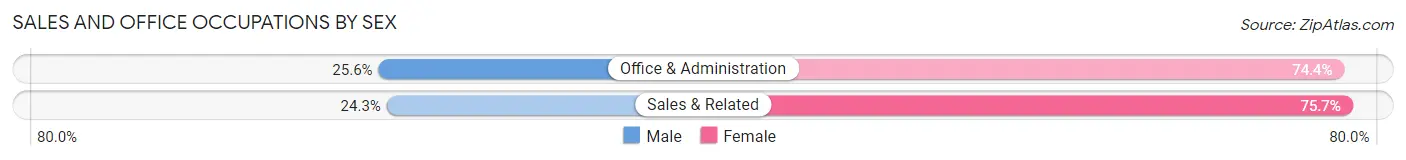
| Occupation | Male | Female |
| Sales & Related | 96 (24.3%) | 299 (75.7%) |
| Office & Administration | 79 (25.6%) | 230 (74.4%) |
| Total (Category) | 175 (24.9%) | 529 (75.1%) |
| Total (Overall) | 1,965 (47.5%) | 2,173 (52.5%) |
Natural Resources, Construction and Maintenance Occupations
The most common Natural Resources, Construction and Maintenance occupations in Centerville are Construction & Extraction (192 | 4.6%), and Installation, Maintenance & Repair (81 | 2.0%).

Natural Resources, Construction and Maintenance Occupations by Sex

| Occupation | Male | Female |
| Farming, Fishing & Forestry | 0 (0.0%) | 0 (0.0%) |
| Construction & Extraction | 129 (67.2%) | 63 (32.8%) |
| Installation, Maintenance & Repair | 59 (72.8%) | 22 (27.2%) |
| Total (Category) | 188 (68.9%) | 85 (31.1%) |
| Total (Overall) | 1,965 (47.5%) | 2,173 (52.5%) |
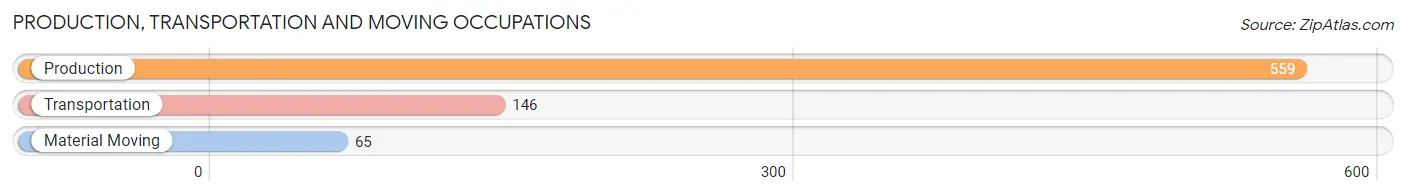
Production, Transportation and Moving Occupations
The most common Production, Transportation and Moving occupations in Centerville are Production (559 | 13.5%), Transportation (146 | 3.5%), and Material Moving (65 | 1.6%).
Production, Transportation and Moving Occupations by Sex
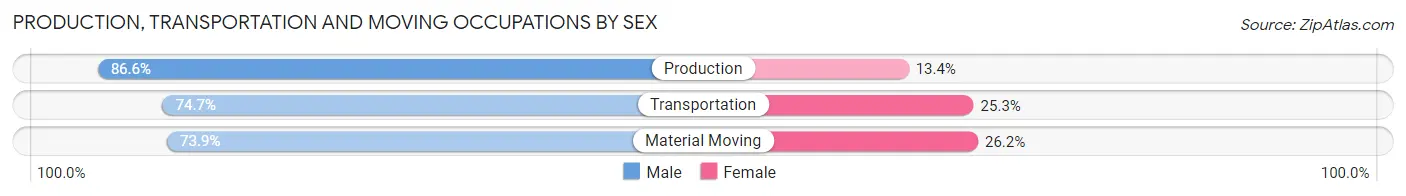
| Occupation | Male | Female |
| Production | 484 (86.6%) | 75 (13.4%) |
| Transportation | 109 (74.7%) | 37 (25.3%) |
| Material Moving | 48 (73.9%) | 17 (26.2%) |
| Total (Category) | 641 (83.3%) | 129 (16.8%) |
| Total (Overall) | 1,965 (47.5%) | 2,173 (52.5%) |
Employment Industries by Sex in Centerville
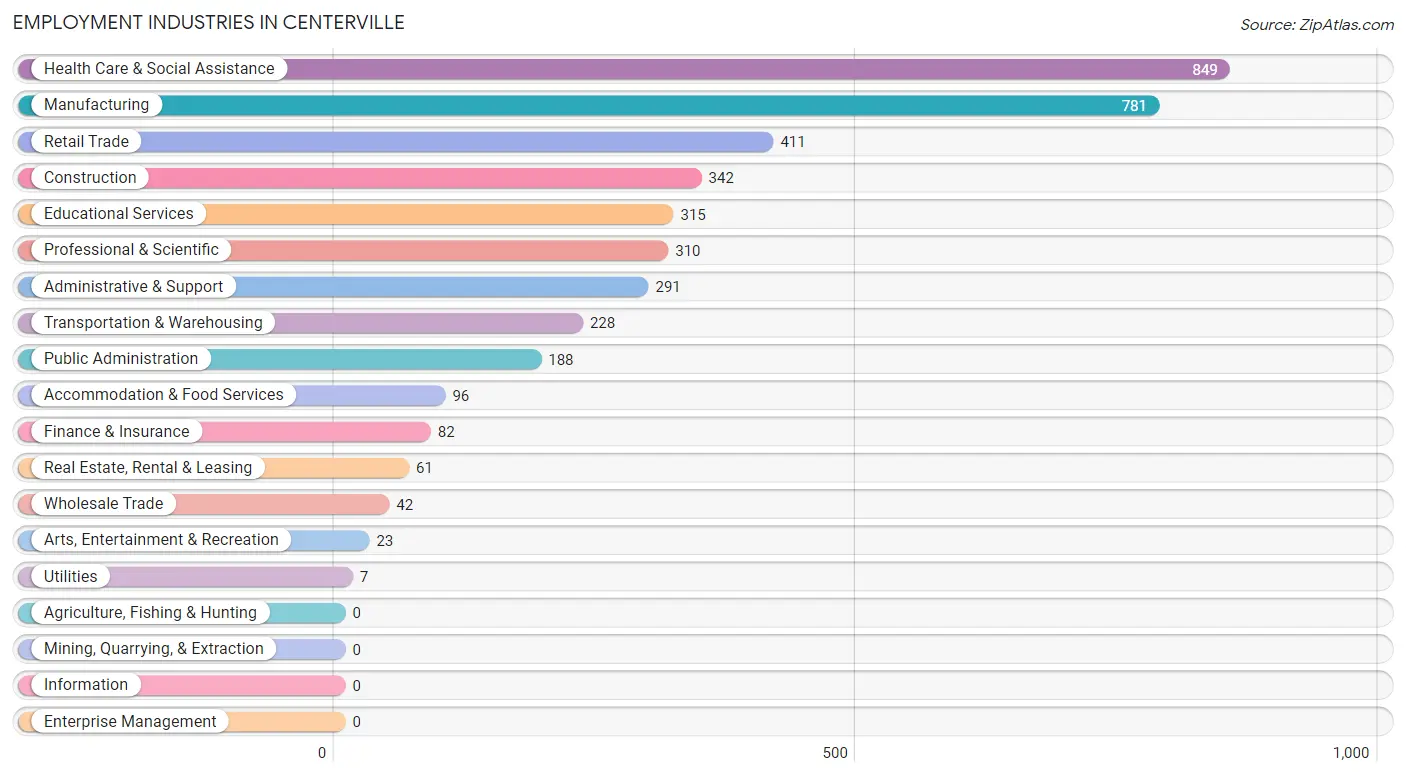
Employment Industries in Centerville
The major employment industries in Centerville include Health Care & Social Assistance (849 | 20.5%), Manufacturing (781 | 18.9%), Retail Trade (411 | 9.9%), Construction (342 | 8.3%), and Educational Services (315 | 7.6%).
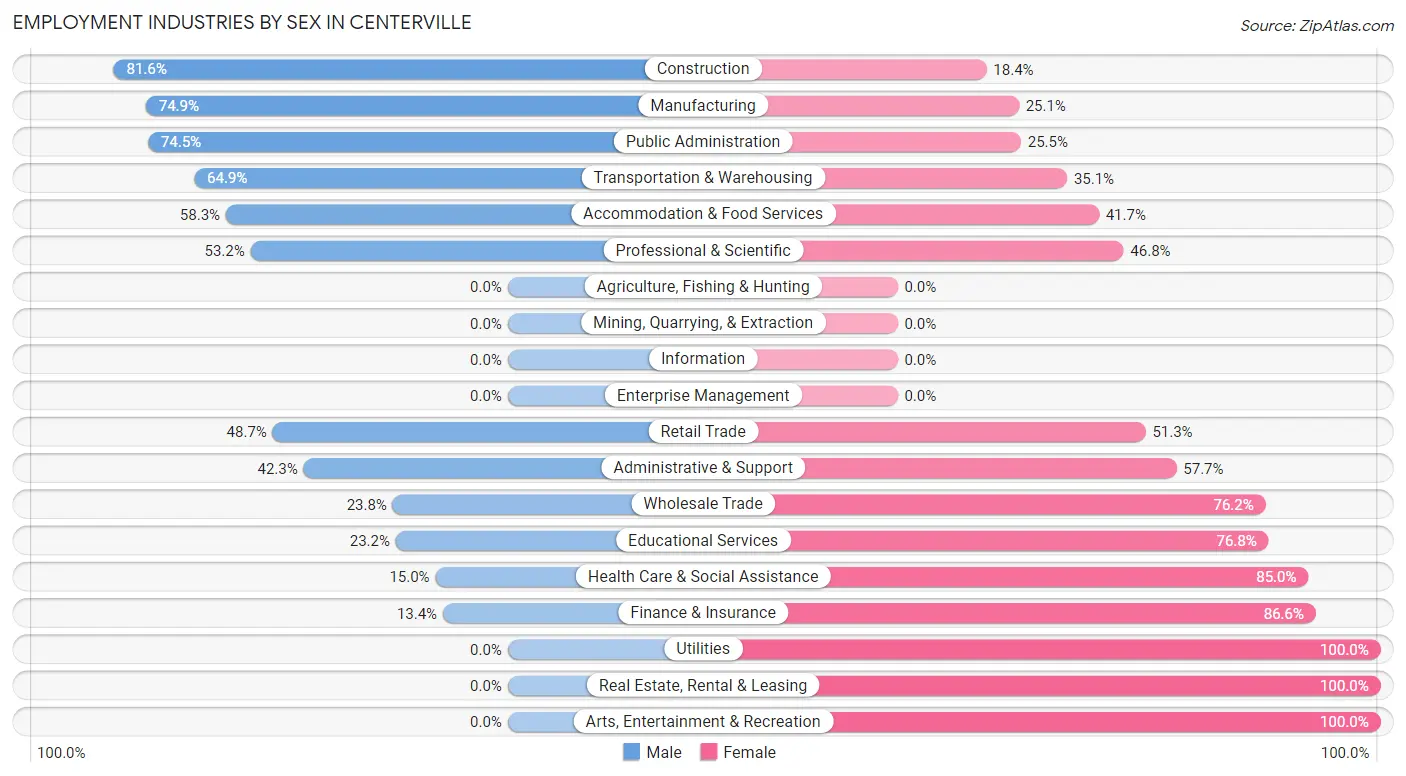
Employment Industries by Sex in Centerville
The Centerville industries that see more men than women are Construction (81.6%), Manufacturing (74.9%), and Public Administration (74.5%), whereas the industries that tend to have a higher number of women are Utilities (100.0%), Real Estate, Rental & Leasing (100.0%), and Arts, Entertainment & Recreation (100.0%).
| Industry | Male | Female |
| Agriculture, Fishing & Hunting | 0 (0.0%) | 0 (0.0%) |
| Mining, Quarrying, & Extraction | 0 (0.0%) | 0 (0.0%) |
| Construction | 279 (81.6%) | 63 (18.4%) |
| Manufacturing | 585 (74.9%) | 196 (25.1%) |
| Wholesale Trade | 10 (23.8%) | 32 (76.2%) |
| Retail Trade | 200 (48.7%) | 211 (51.3%) |
| Transportation & Warehousing | 148 (64.9%) | 80 (35.1%) |
| Utilities | 0 (0.0%) | 7 (100.0%) |
| Information | 0 (0.0%) | 0 (0.0%) |
| Finance & Insurance | 11 (13.4%) | 71 (86.6%) |
| Real Estate, Rental & Leasing | 0 (0.0%) | 61 (100.0%) |
| Professional & Scientific | 165 (53.2%) | 145 (46.8%) |
| Enterprise Management | 0 (0.0%) | 0 (0.0%) |
| Administrative & Support | 123 (42.3%) | 168 (57.7%) |
| Educational Services | 73 (23.2%) | 242 (76.8%) |
| Health Care & Social Assistance | 127 (15.0%) | 722 (85.0%) |
| Arts, Entertainment & Recreation | 0 (0.0%) | 23 (100.0%) |
| Accommodation & Food Services | 56 (58.3%) | 40 (41.7%) |
| Public Administration | 140 (74.5%) | 48 (25.5%) |
| Total | 1,965 (47.5%) | 2,173 (52.5%) |
Education in Centerville
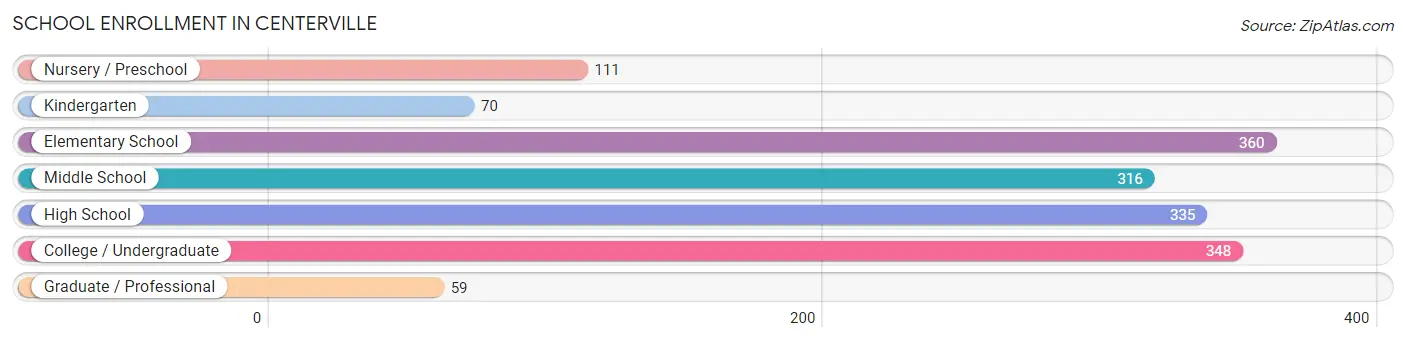
School Enrollment in Centerville
The most common levels of schooling among the 1,599 students in Centerville are elementary school (360 | 22.5%), college / undergraduate (348 | 21.8%), and high school (335 | 20.9%).
| School Level | # Students | % Students |
| Nursery / Preschool | 111 | 6.9% |
| Kindergarten | 70 | 4.4% |
| Elementary School | 360 | 22.5% |
| Middle School | 316 | 19.8% |
| High School | 335 | 20.9% |
| College / Undergraduate | 348 | 21.8% |
| Graduate / Professional | 59 | 3.7% |
| Total | 1,599 | 100.0% |
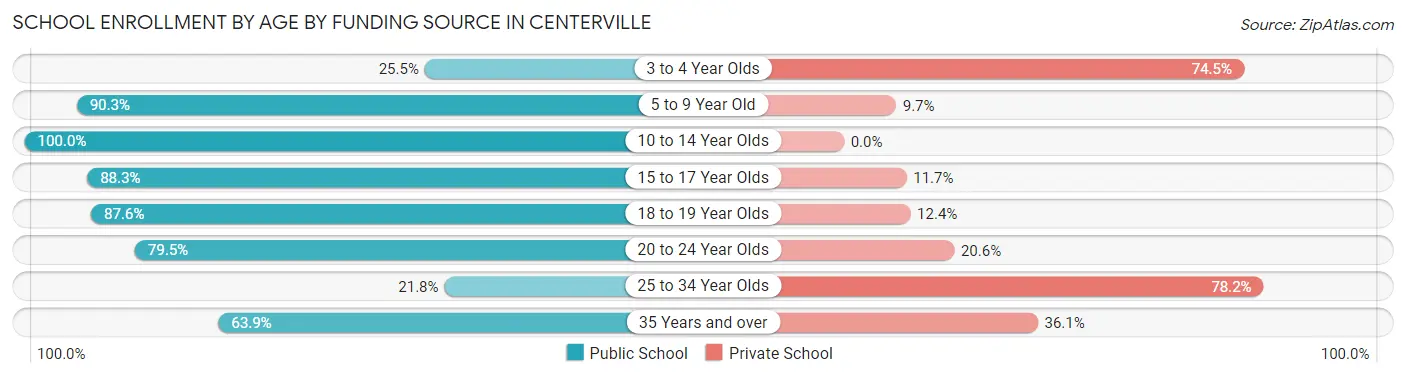
School Enrollment by Age by Funding Source in Centerville
Out of a total of 1,599 students who are enrolled in schools in Centerville, 261 (16.3%) attend a private institution, while the remaining 1,338 (83.7%) are enrolled in public schools. The age group of 25 to 34 year olds has the highest likelihood of being enrolled in private schools, with 43 (78.2% in the age bracket) enrolled. Conversely, the age group of 10 to 14 year olds has the lowest likelihood of being enrolled in a private school, with 440 (100.0% in the age bracket) attending a public institution.
| Age Bracket | Public School | Private School |
| 3 to 4 Year Olds | 27 (25.5%) | 79 (74.5%) |
| 5 to 9 Year Old | 344 (90.3%) | 37 (9.7%) |
| 10 to 14 Year Olds | 440 (100.0%) | 0 (0.0%) |
| 15 to 17 Year Olds | 227 (88.3%) | 30 (11.7%) |
| 18 to 19 Year Olds | 92 (87.6%) | 13 (12.4%) |
| 20 to 24 Year Olds | 174 (79.4%) | 45 (20.5%) |
| 25 to 34 Year Olds | 12 (21.8%) | 43 (78.2%) |
| 35 Years and over | 23 (63.9%) | 13 (36.1%) |
| Total | 1,338 (83.7%) | 261 (16.3%) |
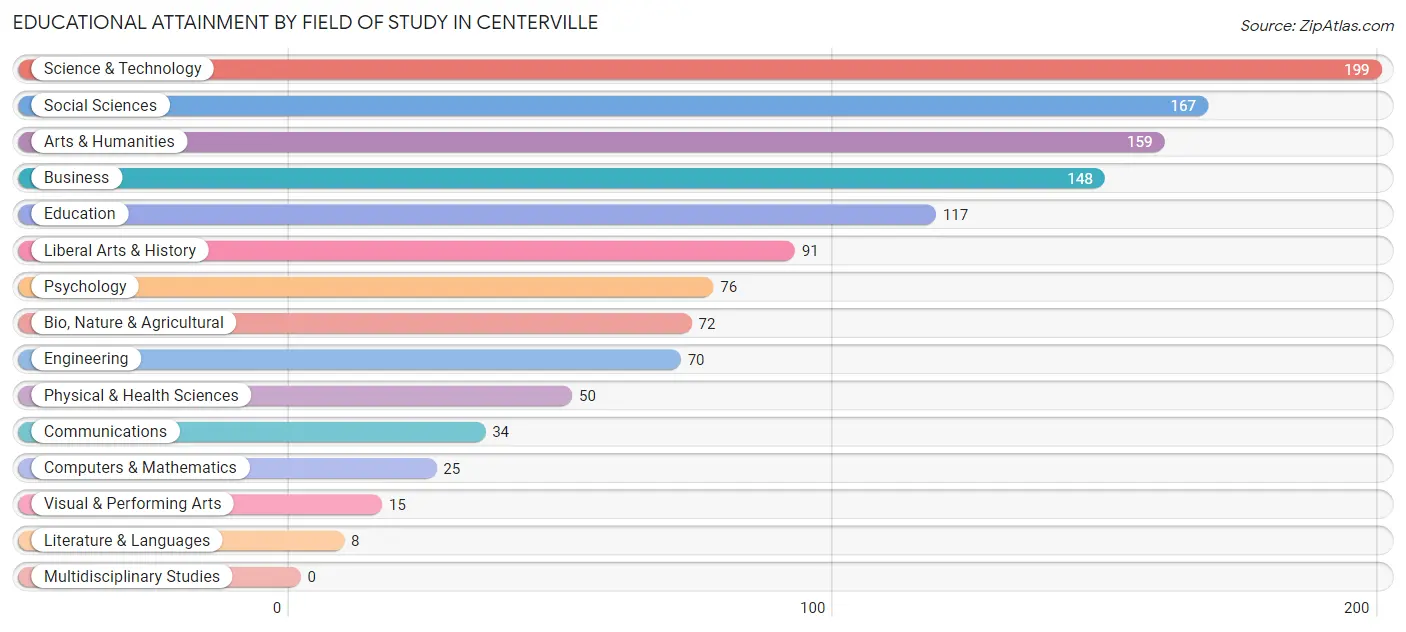
Educational Attainment by Field of Study in Centerville
Science & technology (199 | 16.2%), social sciences (167 | 13.6%), arts & humanities (159 | 12.9%), business (148 | 12.0%), and education (117 | 9.5%) are the most common fields of study among 1,231 individuals in Centerville who have obtained a bachelor's degree or higher.
| Field of Study | # Graduates | % Graduates |
| Computers & Mathematics | 25 | 2.0% |
| Bio, Nature & Agricultural | 72 | 5.9% |
| Physical & Health Sciences | 50 | 4.1% |
| Psychology | 76 | 6.2% |
| Social Sciences | 167 | 13.6% |
| Engineering | 70 | 5.7% |
| Multidisciplinary Studies | 0 | 0.0% |
| Science & Technology | 199 | 16.2% |
| Business | 148 | 12.0% |
| Education | 117 | 9.5% |
| Literature & Languages | 8 | 0.6% |
| Liberal Arts & History | 91 | 7.4% |
| Visual & Performing Arts | 15 | 1.2% |
| Communications | 34 | 2.8% |
| Arts & Humanities | 159 | 12.9% |
| Total | 1,231 | 100.0% |
Transportation & Commute in Centerville
Vehicle Availability by Sex in Centerville
The most prevalent vehicle ownership categories in Centerville are males with 3 vehicles (648, accounting for 34.0%) and females with 3 vehicles (562, making up 31.4%).
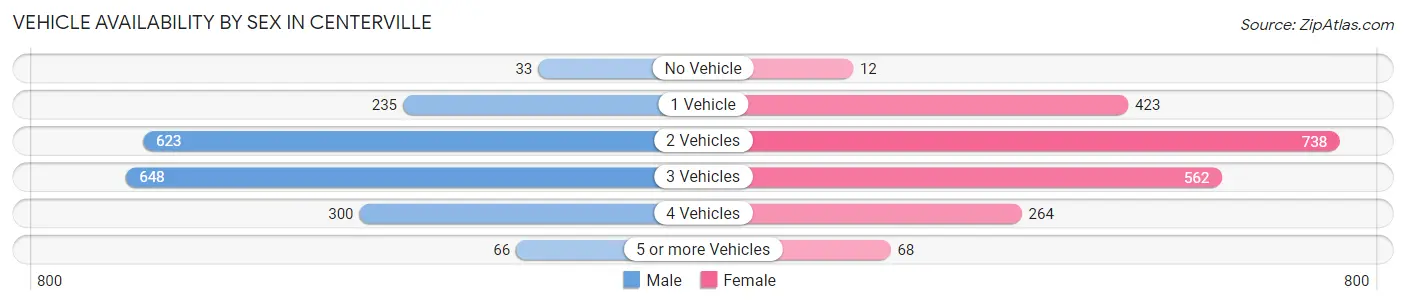
| Vehicles Available | Male | Female |
| No Vehicle | 33 (1.7%) | 12 (0.6%) |
| 1 Vehicle | 235 (12.3%) | 423 (20.5%) |
| 2 Vehicles | 623 (32.7%) | 738 (35.7%) |
| 3 Vehicles | 648 (34.0%) | 562 (27.2%) |
| 4 Vehicles | 300 (15.8%) | 264 (12.8%) |
| 5 or more Vehicles | 66 (3.5%) | 68 (3.3%) |
| Total | 1,905 (100.0%) | 2,067 (100.0%) |
Commute Time in Centerville
The most frequently occuring commute durations in Centerville are 15 to 19 minutes (966 commuters, 25.1%), 10 to 14 minutes (652 commuters, 16.9%), and 5 to 9 minutes (544 commuters, 14.1%).
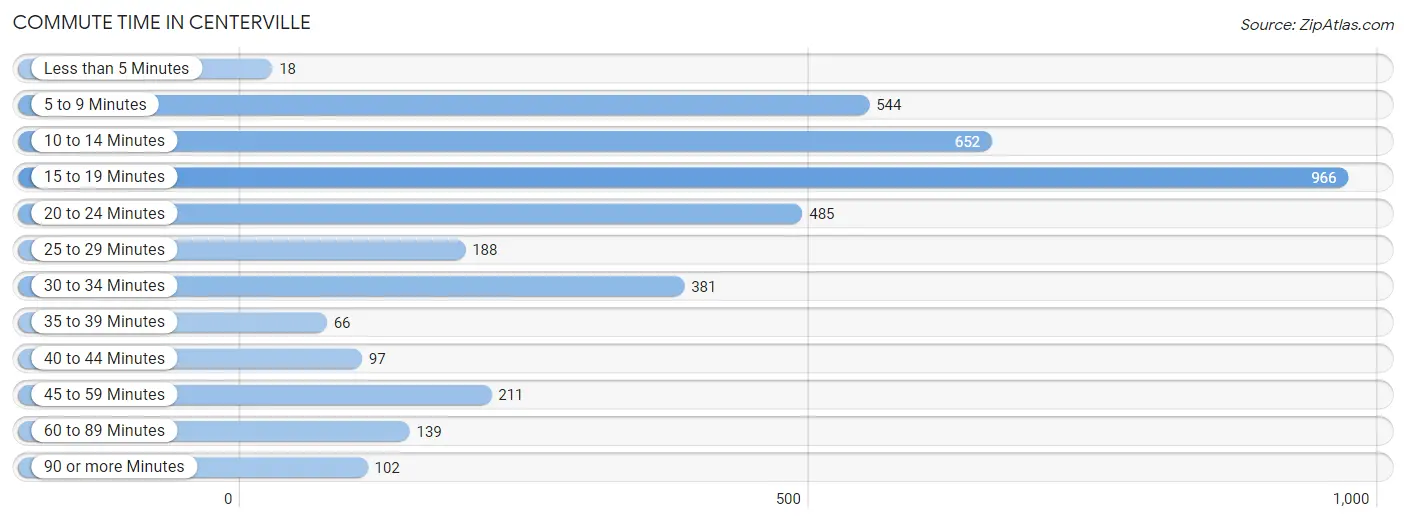
| Commute Time | # Commuters | % Commuters |
| Less than 5 Minutes | 18 | 0.5% |
| 5 to 9 Minutes | 544 | 14.1% |
| 10 to 14 Minutes | 652 | 16.9% |
| 15 to 19 Minutes | 966 | 25.1% |
| 20 to 24 Minutes | 485 | 12.6% |
| 25 to 29 Minutes | 188 | 4.9% |
| 30 to 34 Minutes | 381 | 9.9% |
| 35 to 39 Minutes | 66 | 1.7% |
| 40 to 44 Minutes | 97 | 2.5% |
| 45 to 59 Minutes | 211 | 5.5% |
| 60 to 89 Minutes | 139 | 3.6% |
| 90 or more Minutes | 102 | 2.6% |
Commute Time by Sex in Centerville
The most common commute times in Centerville are 15 to 19 minutes (635 commuters, 35.0%) for males and 10 to 14 minutes (478 commuters, 23.5%) for females.
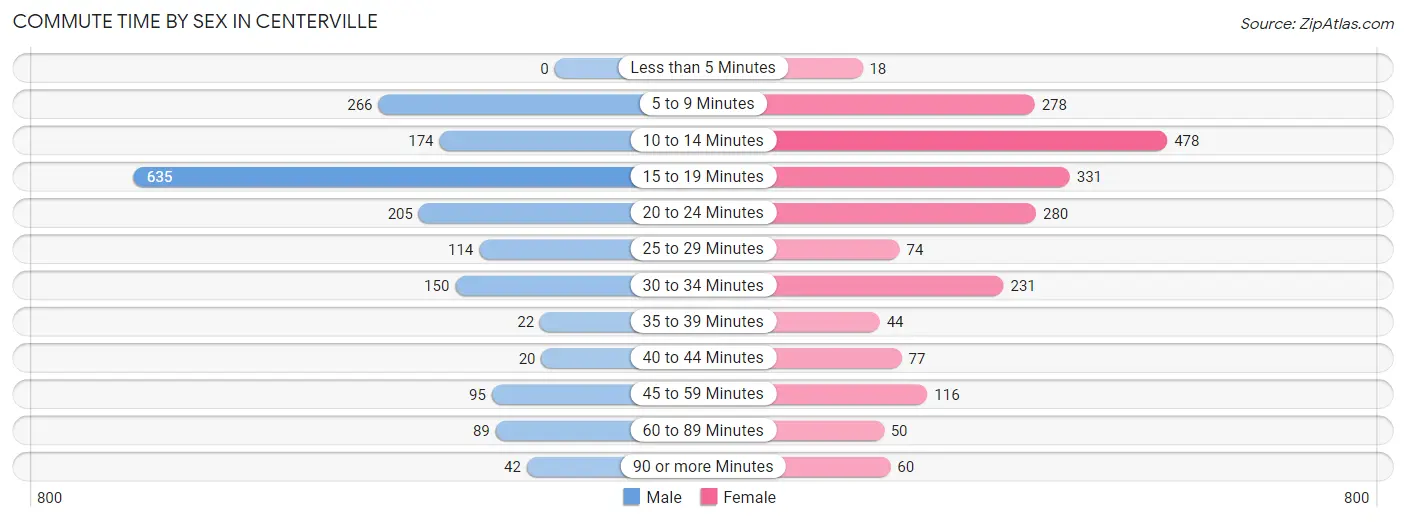
| Commute Time | Male | Female |
| Less than 5 Minutes | 0 (0.0%) | 18 (0.9%) |
| 5 to 9 Minutes | 266 (14.7%) | 278 (13.7%) |
| 10 to 14 Minutes | 174 (9.6%) | 478 (23.5%) |
| 15 to 19 Minutes | 635 (35.0%) | 331 (16.3%) |
| 20 to 24 Minutes | 205 (11.3%) | 280 (13.8%) |
| 25 to 29 Minutes | 114 (6.3%) | 74 (3.6%) |
| 30 to 34 Minutes | 150 (8.3%) | 231 (11.3%) |
| 35 to 39 Minutes | 22 (1.2%) | 44 (2.2%) |
| 40 to 44 Minutes | 20 (1.1%) | 77 (3.8%) |
| 45 to 59 Minutes | 95 (5.2%) | 116 (5.7%) |
| 60 to 89 Minutes | 89 (4.9%) | 50 (2.5%) |
| 90 or more Minutes | 42 (2.3%) | 60 (2.9%) |
Time of Departure to Work by Sex in Centerville
The most frequent times of departure to work in Centerville are 7:00 AM to 7:29 AM (354, 19.5%) for males and 7:00 AM to 7:29 AM (336, 16.5%) for females.
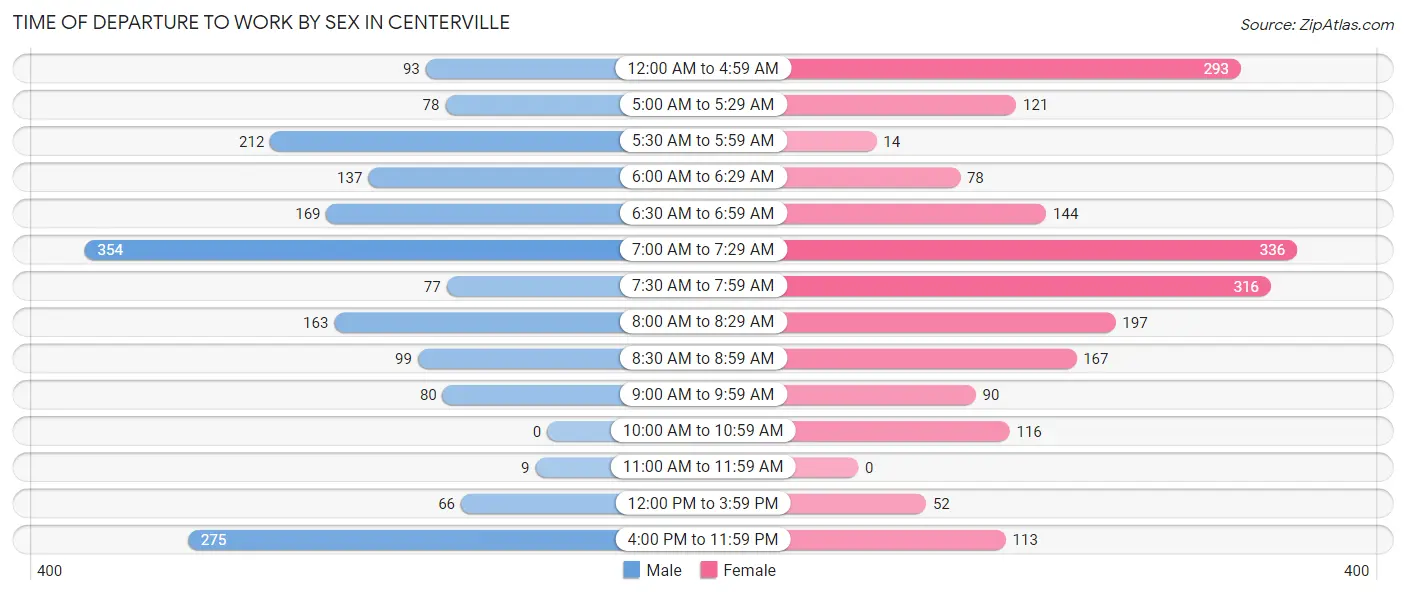
| Time of Departure | Male | Female |
| 12:00 AM to 4:59 AM | 93 (5.1%) | 293 (14.4%) |
| 5:00 AM to 5:29 AM | 78 (4.3%) | 121 (5.9%) |
| 5:30 AM to 5:59 AM | 212 (11.7%) | 14 (0.7%) |
| 6:00 AM to 6:29 AM | 137 (7.6%) | 78 (3.8%) |
| 6:30 AM to 6:59 AM | 169 (9.3%) | 144 (7.1%) |
| 7:00 AM to 7:29 AM | 354 (19.5%) | 336 (16.5%) |
| 7:30 AM to 7:59 AM | 77 (4.3%) | 316 (15.5%) |
| 8:00 AM to 8:29 AM | 163 (9.0%) | 197 (9.7%) |
| 8:30 AM to 8:59 AM | 99 (5.5%) | 167 (8.2%) |
| 9:00 AM to 9:59 AM | 80 (4.4%) | 90 (4.4%) |
| 10:00 AM to 10:59 AM | 0 (0.0%) | 116 (5.7%) |
| 11:00 AM to 11:59 AM | 9 (0.5%) | 0 (0.0%) |
| 12:00 PM to 3:59 PM | 66 (3.6%) | 52 (2.5%) |
| 4:00 PM to 11:59 PM | 275 (15.2%) | 113 (5.6%) |
| Total | 1,812 (100.0%) | 2,037 (100.0%) |
Housing Occupancy in Centerville
Occupancy by Ownership in Centerville
Of the total 3,105 dwellings in Centerville, owner-occupied units account for 2,741 (88.3%), while renter-occupied units make up 364 (11.7%).
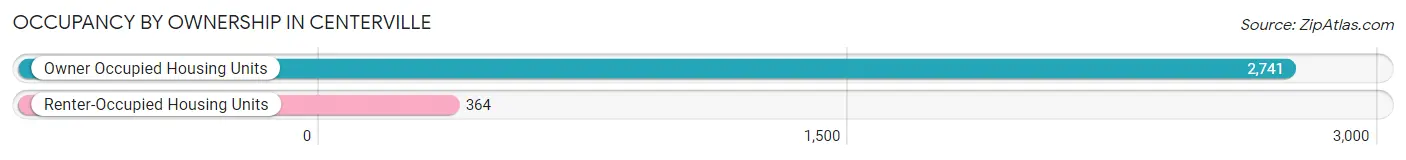
| Occupancy | # Housing Units | % Housing Units |
| Owner Occupied Housing Units | 2,741 | 88.3% |
| Renter-Occupied Housing Units | 364 | 11.7% |
| Total Occupied Housing Units | 3,105 | 100.0% |
Occupancy by Household Size in Centerville
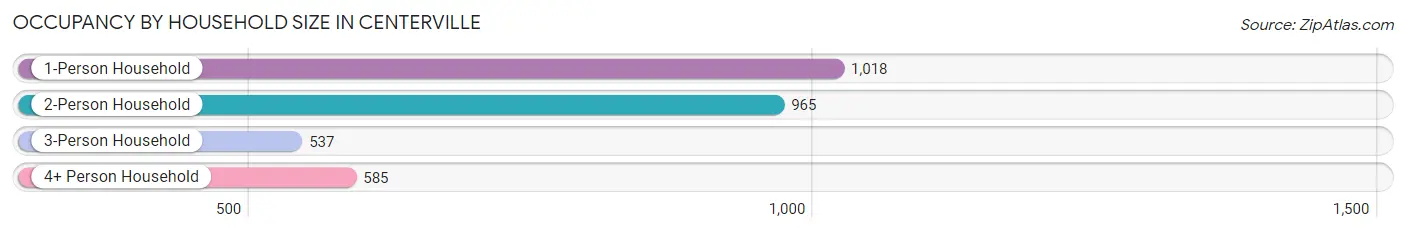
| Household Size | # Housing Units | % Housing Units |
| 1-Person Household | 1,018 | 32.8% |
| 2-Person Household | 965 | 31.1% |
| 3-Person Household | 537 | 17.3% |
| 4+ Person Household | 585 | 18.8% |
| Total Housing Units | 3,105 | 100.0% |
Occupancy by Ownership by Household Size in Centerville
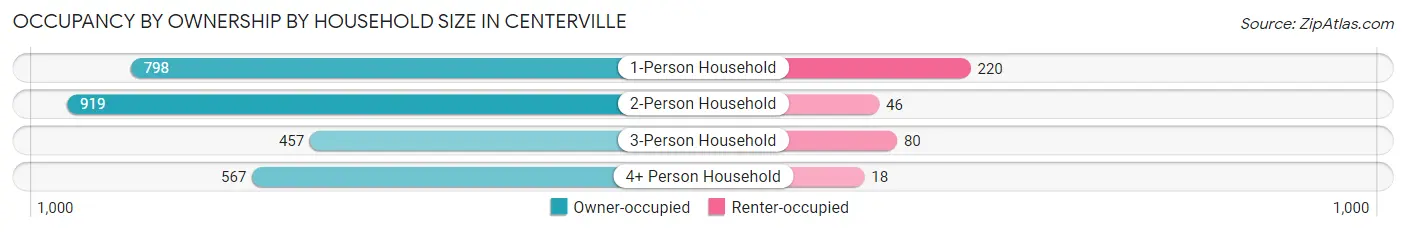
| Household Size | Owner-occupied | Renter-occupied |
| 1-Person Household | 798 (78.4%) | 220 (21.6%) |
| 2-Person Household | 919 (95.2%) | 46 (4.8%) |
| 3-Person Household | 457 (85.1%) | 80 (14.9%) |
| 4+ Person Household | 567 (96.9%) | 18 (3.1%) |
| Total Housing Units | 2,741 (88.3%) | 364 (11.7%) |
Occupancy by Educational Attainment in Centerville
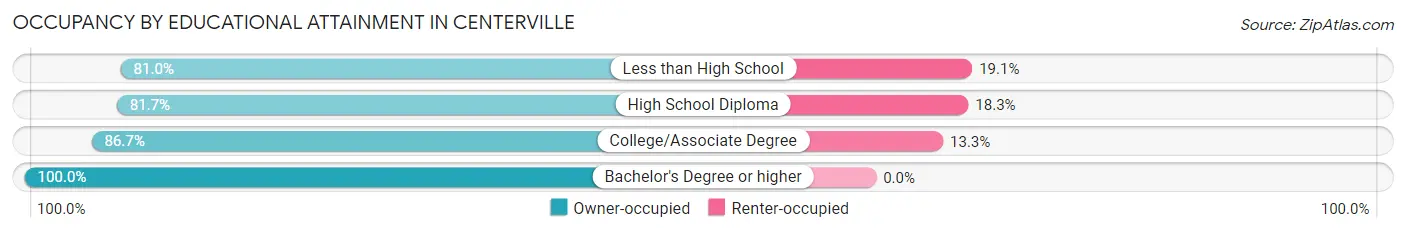
| Household Size | Owner-occupied | Renter-occupied |
| Less than High School | 119 (80.9%) | 28 (19.1%) |
| High School Diploma | 858 (81.7%) | 192 (18.3%) |
| College/Associate Degree | 941 (86.7%) | 144 (13.3%) |
| Bachelor's Degree or higher | 823 (100.0%) | 0 (0.0%) |
Occupancy by Age of Householder in Centerville
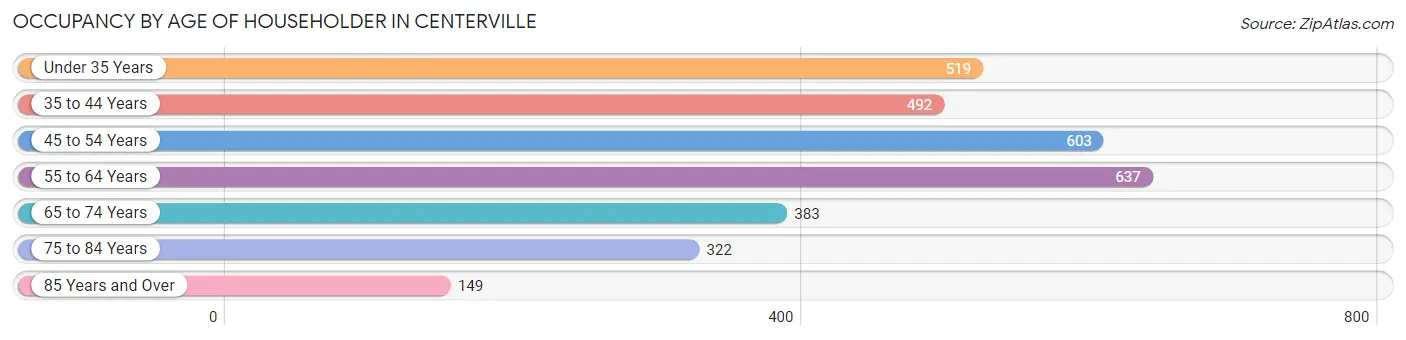
| Age Bracket | # Households | % Households |
| Under 35 Years | 519 | 16.7% |
| 35 to 44 Years | 492 | 15.9% |
| 45 to 54 Years | 603 | 19.4% |
| 55 to 64 Years | 637 | 20.5% |
| 65 to 74 Years | 383 | 12.3% |
| 75 to 84 Years | 322 | 10.4% |
| 85 Years and Over | 149 | 4.8% |
| Total | 3,105 | 100.0% |
Housing Finances in Centerville
Median Income by Occupancy in Centerville
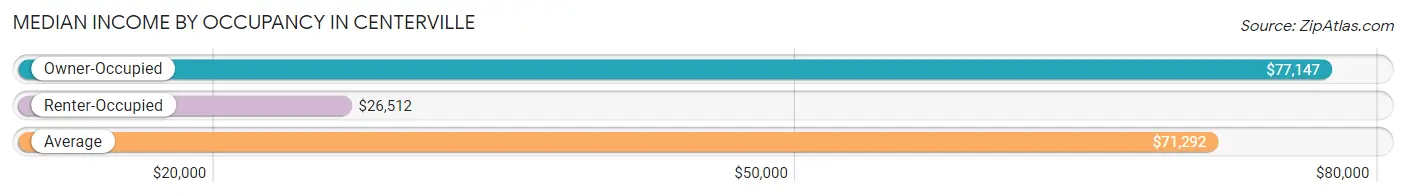
| Occupancy Type | # Households | Median Income |
| Owner-Occupied | 2,741 (88.3%) | $77,147 |
| Renter-Occupied | 364 (11.7%) | $26,512 |
| Average | 3,105 (100.0%) | $71,292 |
Occupancy by Householder Income Bracket in Centerville
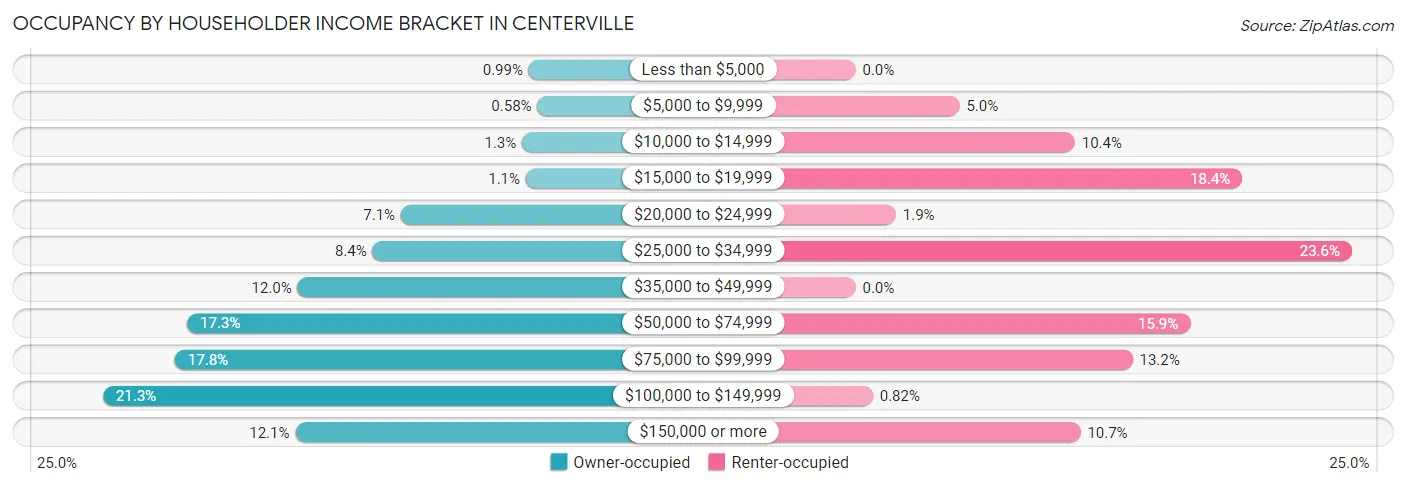
| Income Bracket | Owner-occupied | Renter-occupied |
| Less than $5,000 | 27 (1.0%) | 0 (0.0%) |
| $5,000 to $9,999 | 16 (0.6%) | 18 (5.0%) |
| $10,000 to $14,999 | 36 (1.3%) | 38 (10.4%) |
| $15,000 to $19,999 | 31 (1.1%) | 67 (18.4%) |
| $20,000 to $24,999 | 194 (7.1%) | 7 (1.9%) |
| $25,000 to $34,999 | 231 (8.4%) | 86 (23.6%) |
| $35,000 to $49,999 | 329 (12.0%) | 0 (0.0%) |
| $50,000 to $74,999 | 473 (17.3%) | 58 (15.9%) |
| $75,000 to $99,999 | 489 (17.8%) | 48 (13.2%) |
| $100,000 to $149,999 | 583 (21.3%) | 3 (0.8%) |
| $150,000 or more | 332 (12.1%) | 39 (10.7%) |
| Total | 2,741 (100.0%) | 364 (100.0%) |
Monthly Housing Cost Tiers in Centerville
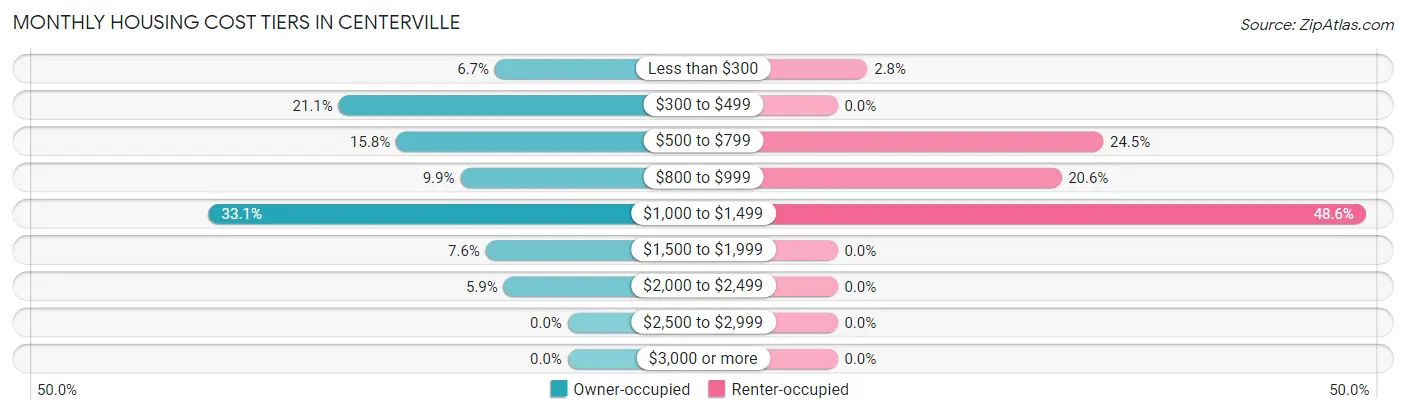
| Monthly Cost | Owner-occupied | Renter-occupied |
| Less than $300 | 184 (6.7%) | 10 (2.8%) |
| $300 to $499 | 578 (21.1%) | 0 (0.0%) |
| $500 to $799 | 433 (15.8%) | 89 (24.4%) |
| $800 to $999 | 271 (9.9%) | 75 (20.6%) |
| $1,000 to $1,499 | 906 (33.1%) | 177 (48.6%) |
| $1,500 to $1,999 | 207 (7.5%) | 0 (0.0%) |
| $2,000 to $2,499 | 162 (5.9%) | 0 (0.0%) |
| $2,500 to $2,999 | 0 (0.0%) | 0 (0.0%) |
| $3,000 or more | 0 (0.0%) | 0 (0.0%) |
| Total | 2,741 (100.0%) | 364 (100.0%) |
Physical Housing Characteristics in Centerville
Housing Structures in Centerville
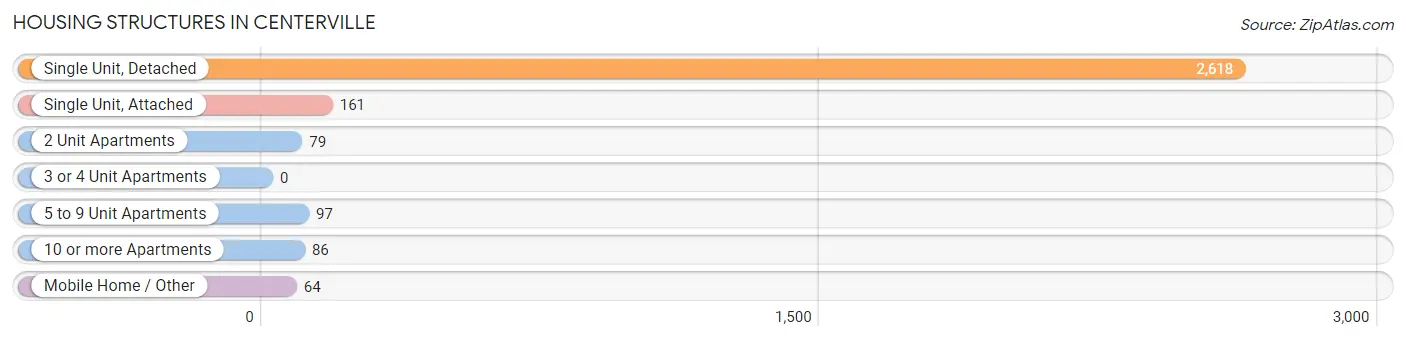
| Structure Type | # Housing Units | % Housing Units |
| Single Unit, Detached | 2,618 | 84.3% |
| Single Unit, Attached | 161 | 5.2% |
| 2 Unit Apartments | 79 | 2.5% |
| 3 or 4 Unit Apartments | 0 | 0.0% |
| 5 to 9 Unit Apartments | 97 | 3.1% |
| 10 or more Apartments | 86 | 2.8% |
| Mobile Home / Other | 64 | 2.1% |
| Total | 3,105 | 100.0% |
Housing Structures by Occupancy in Centerville
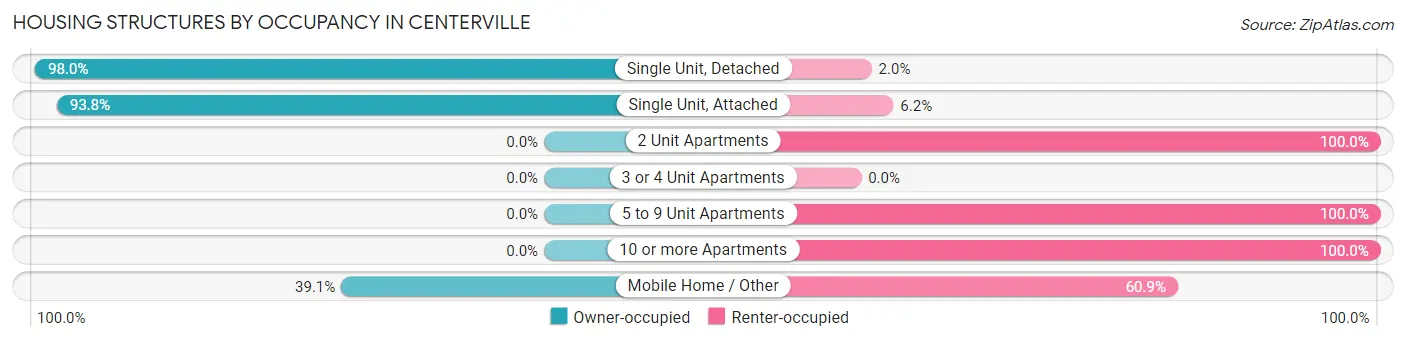
| Structure Type | Owner-occupied | Renter-occupied |
| Single Unit, Detached | 2,565 (98.0%) | 53 (2.0%) |
| Single Unit, Attached | 151 (93.8%) | 10 (6.2%) |
| 2 Unit Apartments | 0 (0.0%) | 79 (100.0%) |
| 3 or 4 Unit Apartments | 0 (0.0%) | 0 (0.0%) |
| 5 to 9 Unit Apartments | 0 (0.0%) | 97 (100.0%) |
| 10 or more Apartments | 0 (0.0%) | 86 (100.0%) |
| Mobile Home / Other | 25 (39.1%) | 39 (60.9%) |
| Total | 2,741 (88.3%) | 364 (11.7%) |
Housing Structures by Number of Rooms in Centerville
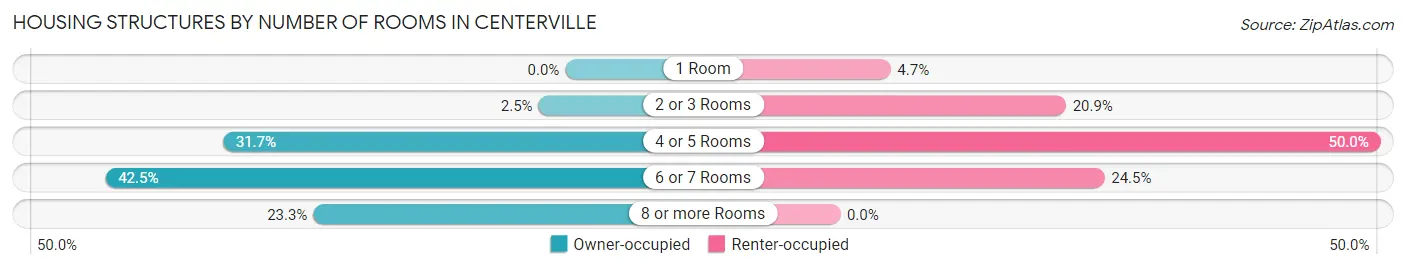
| Number of Rooms | Owner-occupied | Renter-occupied |
| 1 Room | 0 (0.0%) | 17 (4.7%) |
| 2 or 3 Rooms | 68 (2.5%) | 76 (20.9%) |
| 4 or 5 Rooms | 868 (31.7%) | 182 (50.0%) |
| 6 or 7 Rooms | 1,166 (42.5%) | 89 (24.4%) |
| 8 or more Rooms | 639 (23.3%) | 0 (0.0%) |
| Total | 2,741 (100.0%) | 364 (100.0%) |
Housing Structure by Heating Type in Centerville
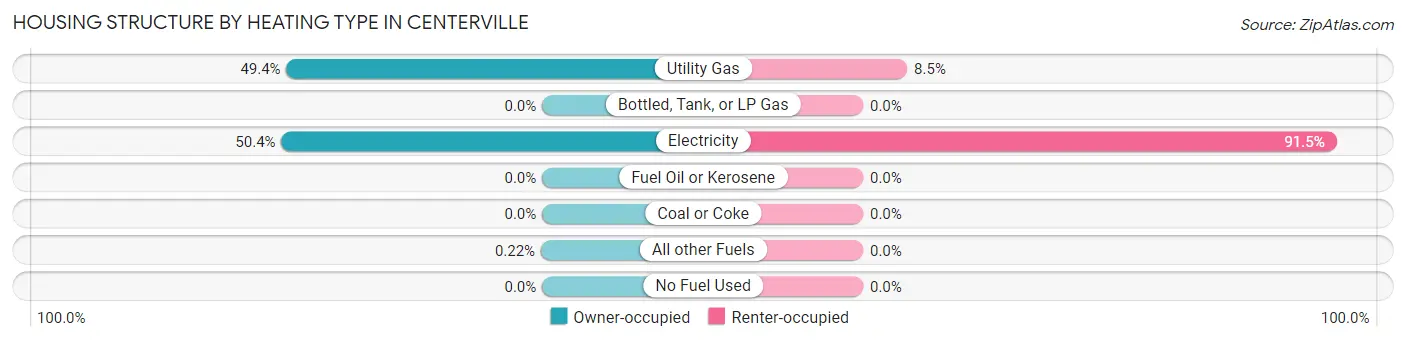
| Heating Type | Owner-occupied | Renter-occupied |
| Utility Gas | 1,354 (49.4%) | 31 (8.5%) |
| Bottled, Tank, or LP Gas | 0 (0.0%) | 0 (0.0%) |
| Electricity | 1,381 (50.4%) | 333 (91.5%) |
| Fuel Oil or Kerosene | 0 (0.0%) | 0 (0.0%) |
| Coal or Coke | 0 (0.0%) | 0 (0.0%) |
| All other Fuels | 6 (0.2%) | 0 (0.0%) |
| No Fuel Used | 0 (0.0%) | 0 (0.0%) |
| Total | 2,741 (100.0%) | 364 (100.0%) |
Household Vehicle Usage in Centerville
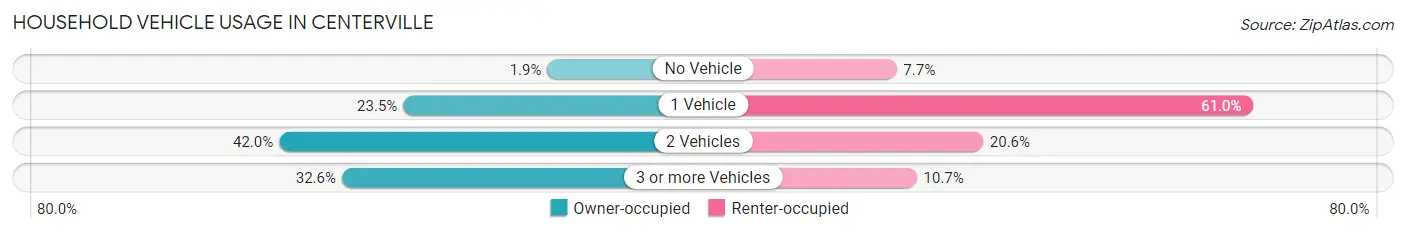
| Vehicles per Household | Owner-occupied | Renter-occupied |
| No Vehicle | 53 (1.9%) | 28 (7.7%) |
| 1 Vehicle | 643 (23.5%) | 222 (61.0%) |
| 2 Vehicles | 1,151 (42.0%) | 75 (20.6%) |
| 3 or more Vehicles | 894 (32.6%) | 39 (10.7%) |
| Total | 2,741 (100.0%) | 364 (100.0%) |
Real Estate & Mortgages in Centerville
Real Estate and Mortgage Overview in Centerville
| Characteristic | Without Mortgage | With Mortgage |
| Housing Units | 945 | 1,796 |
| Median Property Value | $193,200 | $188,200 |
| Median Household Income | $65,703 | $252 |
| Monthly Housing Costs | $395 | $0 |
| Real Estate Taxes | $749 | $51 |
Property Value by Mortgage Status in Centerville
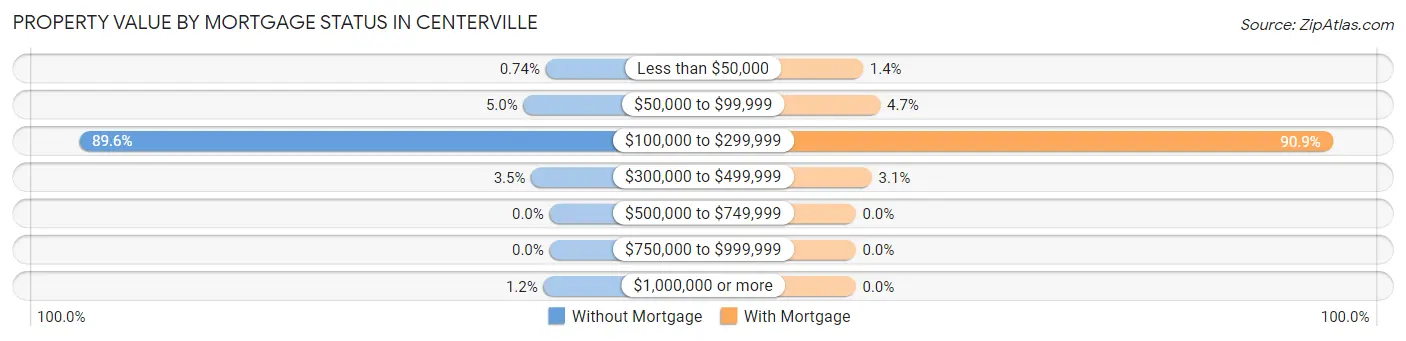
| Property Value | Without Mortgage | With Mortgage |
| Less than $50,000 | 7 (0.7%) | 25 (1.4%) |
| $50,000 to $99,999 | 47 (5.0%) | 84 (4.7%) |
| $100,000 to $299,999 | 847 (89.6%) | 1,632 (90.9%) |
| $300,000 to $499,999 | 33 (3.5%) | 55 (3.1%) |
| $500,000 to $749,999 | 0 (0.0%) | 0 (0.0%) |
| $750,000 to $999,999 | 0 (0.0%) | 0 (0.0%) |
| $1,000,000 or more | 11 (1.2%) | 0 (0.0%) |
| Total | 945 (100.0%) | 1,796 (100.0%) |
Household Income by Mortgage Status in Centerville
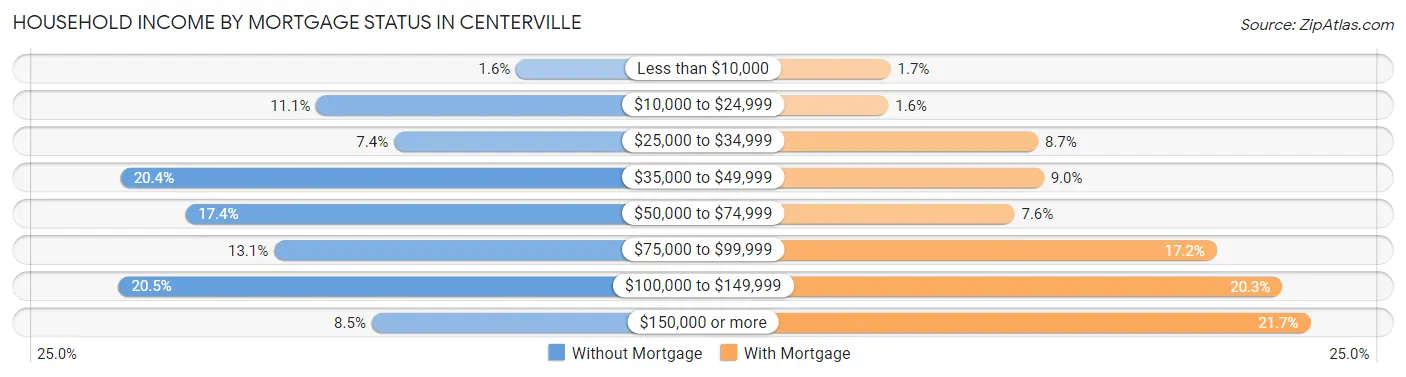
| Household Income | Without Mortgage | With Mortgage |
| Less than $10,000 | 15 (1.6%) | 30 (1.7%) |
| $10,000 to $24,999 | 105 (11.1%) | 28 (1.6%) |
| $25,000 to $34,999 | 70 (7.4%) | 156 (8.7%) |
| $35,000 to $49,999 | 193 (20.4%) | 161 (9.0%) |
| $50,000 to $74,999 | 164 (17.3%) | 136 (7.6%) |
| $75,000 to $99,999 | 124 (13.1%) | 309 (17.2%) |
| $100,000 to $149,999 | 194 (20.5%) | 365 (20.3%) |
| $150,000 or more | 80 (8.5%) | 389 (21.7%) |
| Total | 945 (100.0%) | 1,796 (100.0%) |
Property Value to Household Income Ratio in Centerville
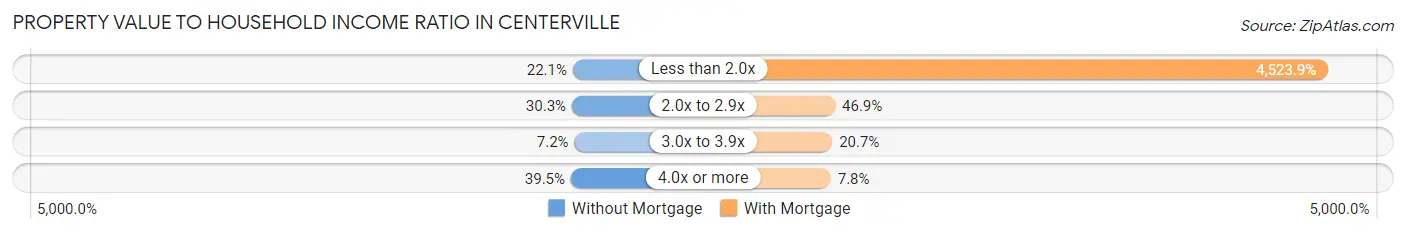
| Value-to-Income Ratio | Without Mortgage | With Mortgage |
| Less than 2.0x | 209 (22.1%) | 81,250 (4,523.9%) |
| 2.0x to 2.9x | 286 (30.3%) | 842 (46.9%) |
| 3.0x to 3.9x | 68 (7.2%) | 372 (20.7%) |
| 4.0x or more | 373 (39.5%) | 140 (7.8%) |
| Total | 945 (100.0%) | 1,796 (100.0%) |
Real Estate Taxes by Mortgage Status in Centerville
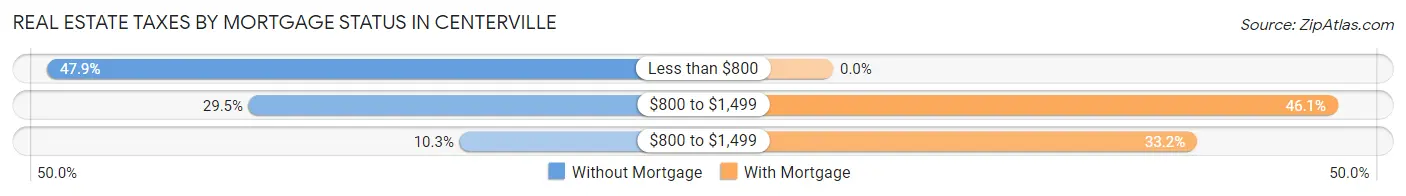
| Property Taxes | Without Mortgage | With Mortgage |
| Less than $800 | 453 (47.9%) | 0 (0.0%) |
| $800 to $1,499 | 279 (29.5%) | 828 (46.1%) |
| $800 to $1,499 | 97 (10.3%) | 597 (33.2%) |
| Total | 945 (100.0%) | 1,796 (100.0%) |
Health & Disability in Centerville
Health Insurance Coverage by Age in Centerville
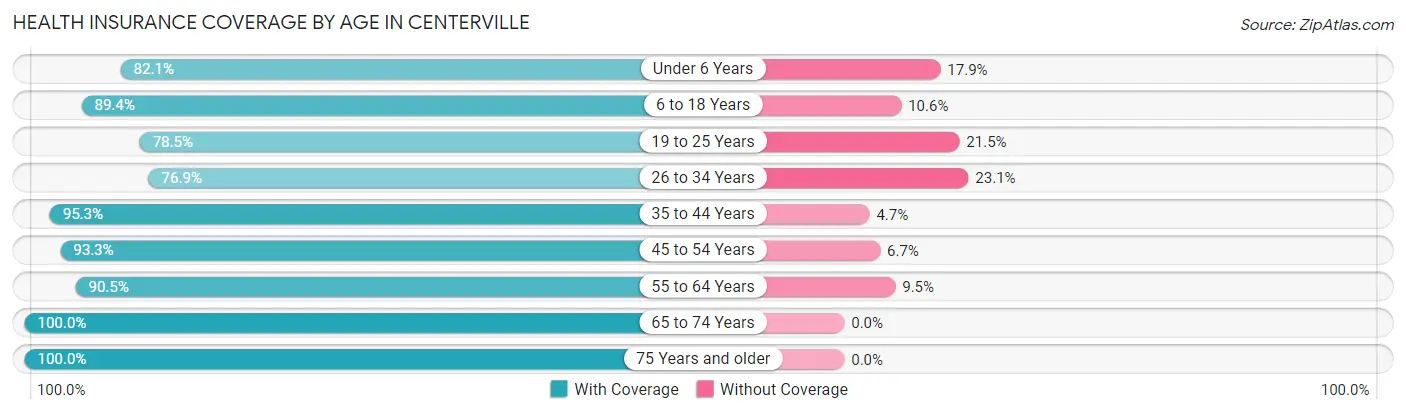
| Age Bracket | With Coverage | Without Coverage |
| Under 6 Years | 261 (82.1%) | 57 (17.9%) |
| 6 to 18 Years | 1,027 (89.4%) | 122 (10.6%) |
| 19 to 25 Years | 629 (78.5%) | 172 (21.5%) |
| 26 to 34 Years | 528 (76.9%) | 159 (23.1%) |
| 35 to 44 Years | 932 (95.3%) | 46 (4.7%) |
| 45 to 54 Years | 1,007 (93.3%) | 72 (6.7%) |
| 55 to 64 Years | 866 (90.5%) | 91 (9.5%) |
| 65 to 74 Years | 668 (100.0%) | 0 (0.0%) |
| 75 Years and older | 580 (100.0%) | 0 (0.0%) |
| Total | 6,498 (90.0%) | 719 (10.0%) |
Health Insurance Coverage by Citizenship Status in Centerville

| Citizenship Status | With Coverage | Without Coverage |
| Native Born | 261 (82.1%) | 57 (17.9%) |
| Foreign Born, Citizen | 1,027 (89.4%) | 122 (10.6%) |
| Foreign Born, not a Citizen | 629 (78.5%) | 172 (21.5%) |
Health Insurance Coverage by Household Income in Centerville
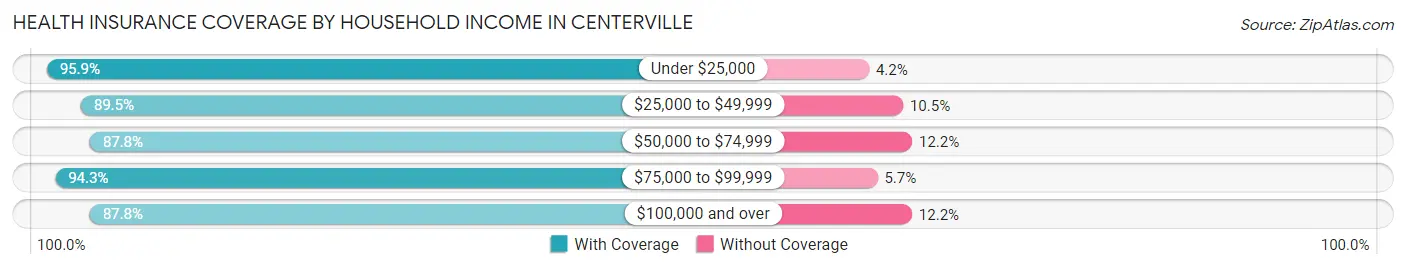
| Household Income | With Coverage | Without Coverage |
| Under $25,000 | 600 (95.9%) | 26 (4.2%) |
| $25,000 to $49,999 | 1,198 (89.5%) | 141 (10.5%) |
| $50,000 to $74,999 | 970 (87.8%) | 135 (12.2%) |
| $75,000 to $99,999 | 1,281 (94.3%) | 78 (5.7%) |
| $100,000 and over | 2,440 (87.8%) | 339 (12.2%) |
Public vs Private Health Insurance Coverage by Age in Centerville
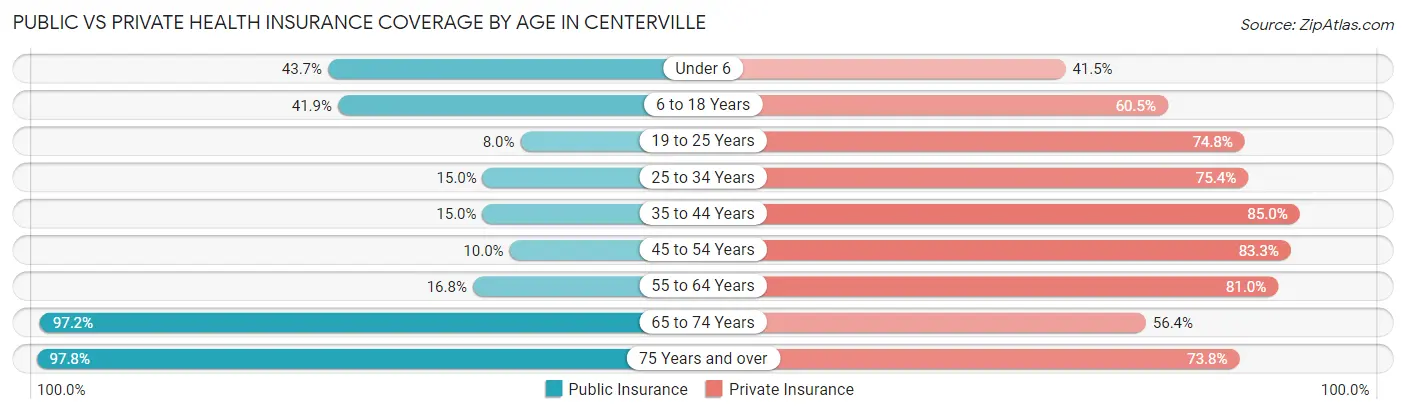
| Age Bracket | Public Insurance | Private Insurance |
| Under 6 | 139 (43.7%) | 132 (41.5%) |
| 6 to 18 Years | 481 (41.9%) | 695 (60.5%) |
| 19 to 25 Years | 64 (8.0%) | 599 (74.8%) |
| 25 to 34 Years | 103 (15.0%) | 518 (75.4%) |
| 35 to 44 Years | 147 (15.0%) | 831 (85.0%) |
| 45 to 54 Years | 108 (10.0%) | 899 (83.3%) |
| 55 to 64 Years | 161 (16.8%) | 775 (81.0%) |
| 65 to 74 Years | 649 (97.2%) | 377 (56.4%) |
| 75 Years and over | 567 (97.8%) | 428 (73.8%) |
| Total | 2,419 (33.5%) | 5,254 (72.8%) |
Disability Status by Sex by Age in Centerville
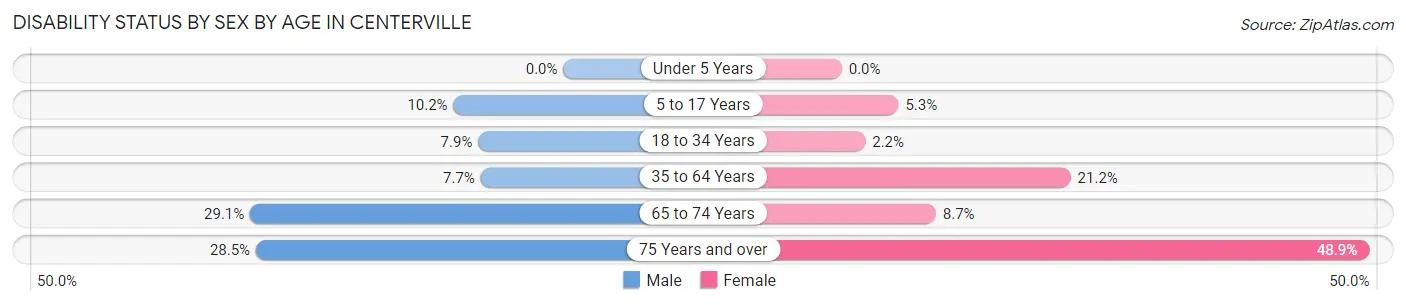
| Age Bracket | Male | Female |
| Under 5 Years | 0 (0.0%) | 0 (0.0%) |
| 5 to 17 Years | 52 (10.2%) | 33 (5.3%) |
| 18 to 34 Years | 58 (7.9%) | 17 (2.2%) |
| 35 to 64 Years | 103 (7.7%) | 355 (21.2%) |
| 65 to 74 Years | 91 (29.1%) | 31 (8.7%) |
| 75 Years and over | 99 (28.5%) | 114 (48.9%) |
Disability Class by Sex by Age in Centerville
Disability Class: Hearing Difficulty
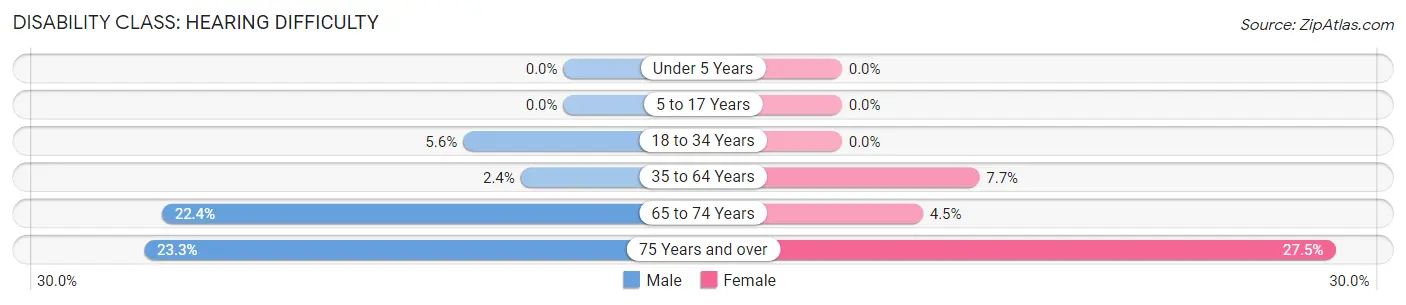
| Age Bracket | Male | Female |
| Under 5 Years | 0 (0.0%) | 0 (0.0%) |
| 5 to 17 Years | 0 (0.0%) | 0 (0.0%) |
| 18 to 34 Years | 41 (5.6%) | 0 (0.0%) |
| 35 to 64 Years | 32 (2.4%) | 128 (7.7%) |
| 65 to 74 Years | 70 (22.4%) | 16 (4.5%) |
| 75 Years and over | 81 (23.3%) | 64 (27.5%) |
Disability Class: Vision Difficulty
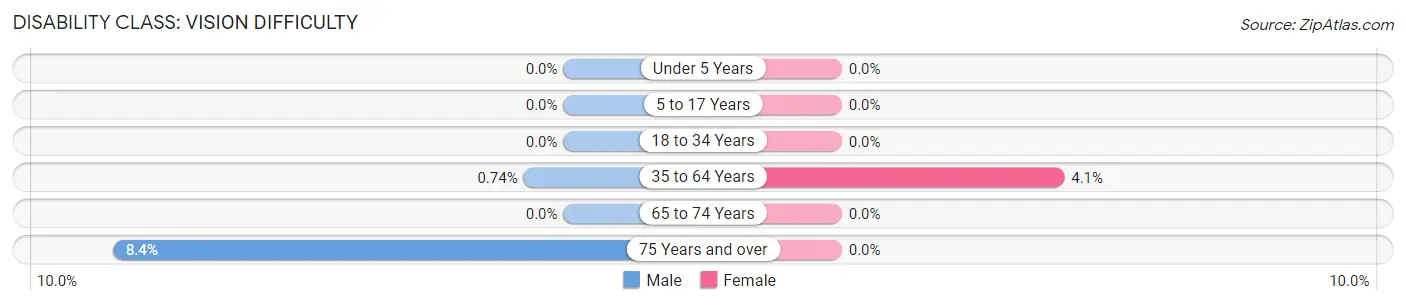
| Age Bracket | Male | Female |
| Under 5 Years | 0 (0.0%) | 0 (0.0%) |
| 5 to 17 Years | 0 (0.0%) | 0 (0.0%) |
| 18 to 34 Years | 0 (0.0%) | 0 (0.0%) |
| 35 to 64 Years | 10 (0.7%) | 69 (4.1%) |
| 65 to 74 Years | 0 (0.0%) | 0 (0.0%) |
| 75 Years and over | 29 (8.4%) | 0 (0.0%) |
Disability Class: Cognitive Difficulty
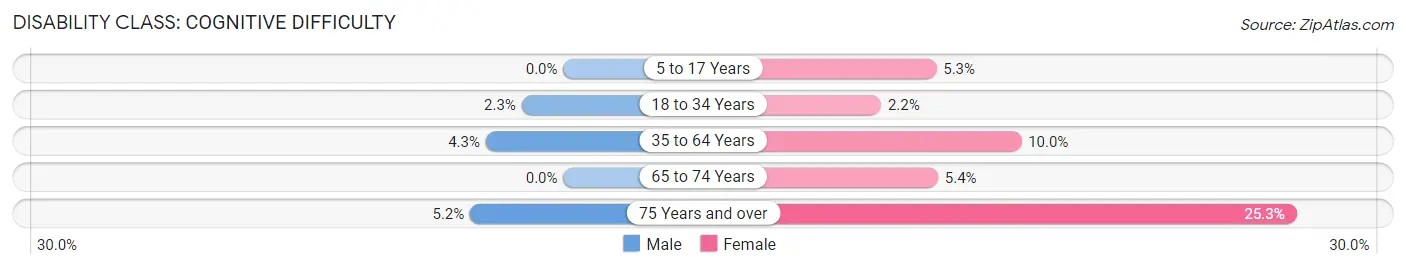
| Age Bracket | Male | Female |
| 5 to 17 Years | 0 (0.0%) | 33 (5.3%) |
| 18 to 34 Years | 17 (2.3%) | 17 (2.2%) |
| 35 to 64 Years | 58 (4.3%) | 167 (10.0%) |
| 65 to 74 Years | 0 (0.0%) | 19 (5.3%) |
| 75 Years and over | 18 (5.2%) | 59 (25.3%) |
Disability Class: Ambulatory Difficulty
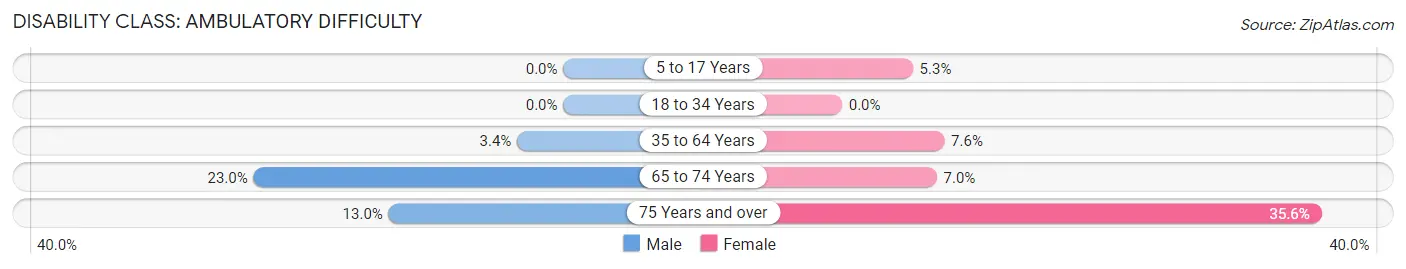
| Age Bracket | Male | Female |
| 5 to 17 Years | 0 (0.0%) | 33 (5.3%) |
| 18 to 34 Years | 0 (0.0%) | 0 (0.0%) |
| 35 to 64 Years | 46 (3.4%) | 127 (7.6%) |
| 65 to 74 Years | 72 (23.0%) | 25 (7.0%) |
| 75 Years and over | 45 (13.0%) | 83 (35.6%) |
Disability Class: Self-Care Difficulty
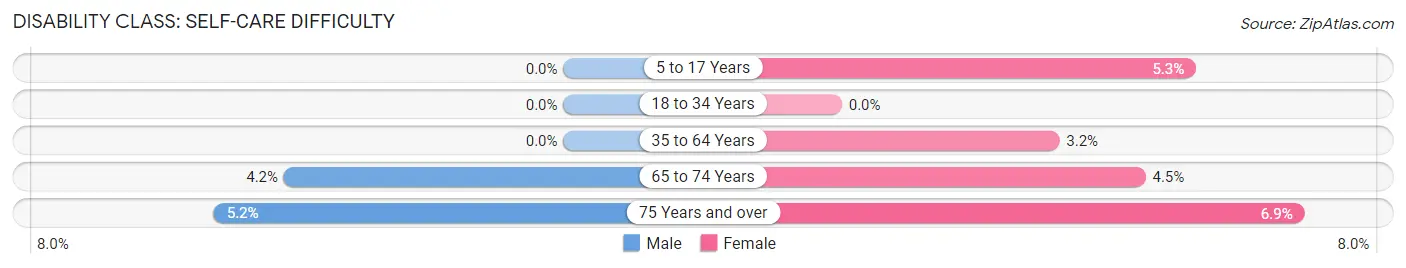
| Age Bracket | Male | Female |
| 5 to 17 Years | 0 (0.0%) | 33 (5.3%) |
| 18 to 34 Years | 0 (0.0%) | 0 (0.0%) |
| 35 to 64 Years | 0 (0.0%) | 54 (3.2%) |
| 65 to 74 Years | 13 (4.2%) | 16 (4.5%) |
| 75 Years and over | 18 (5.2%) | 16 (6.9%) |
Technology Access in Centerville
Computing Device Access in Centerville
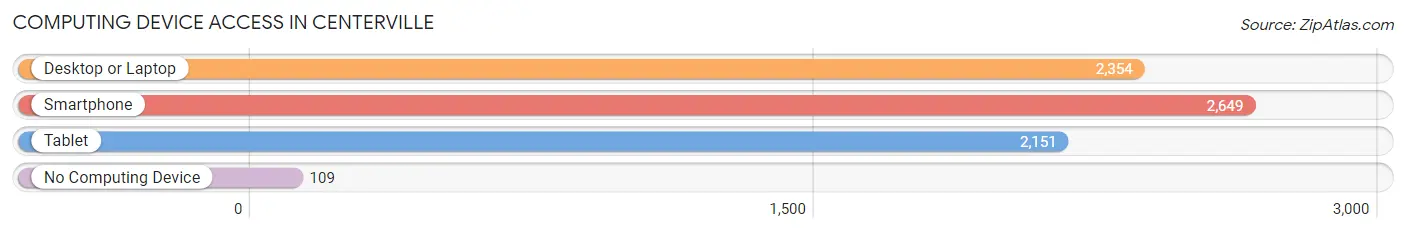
| Device Type | # Households | % Households |
| Desktop or Laptop | 2,354 | 75.8% |
| Smartphone | 2,649 | 85.3% |
| Tablet | 2,151 | 69.3% |
| No Computing Device | 109 | 3.5% |
| Total | 3,105 | 100.0% |
Internet Access in Centerville
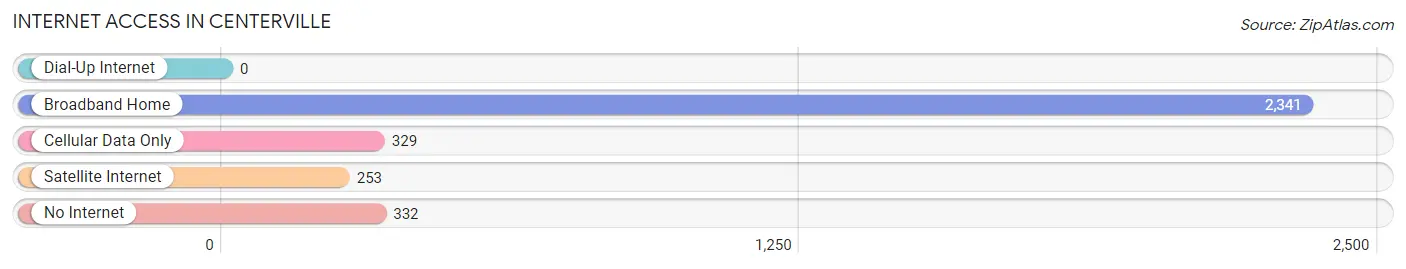
| Internet Type | # Households | % Households |
| Dial-Up Internet | 0 | 0.0% |
| Broadband Home | 2,341 | 75.4% |
| Cellular Data Only | 329 | 10.6% |
| Satellite Internet | 253 | 8.2% |
| No Internet | 332 | 10.7% |
| Total | 3,105 | 100.0% |
Centerville Summary
Centerville is a small town located in the state of South Carolina, United States. It is situated in the northeastern part of the state, in the county of Anderson. The town has a population of approximately 1,000 people, and is part of the Anderson Metropolitan Statistical Area.
History
Centerville was founded in 1820 by a group of settlers from the nearby town of Pendleton. The town was named after the nearby Centerville Creek, which was named after the nearby Centerville Plantation. The plantation was owned by the prominent local family of the same name. The town was incorporated in 1837, and was the first town in Anderson County to be incorporated.
Geography
Centerville is located in the foothills of the Blue Ridge Mountains, and is situated at an elevation of 890 feet above sea level. The town is located in the Piedmont region of South Carolina, and is surrounded by rolling hills and forests. The town is located near the intersection of Interstate 85 and US Highway 76.
The climate in Centerville is humid subtropical, with hot, humid summers and mild winters. The average annual temperature is around 64°F, and the average annual precipitation is around 48 inches.
Economy
The economy of Centerville is largely based on agriculture and manufacturing. The town is home to several small businesses, including a lumber mill, a furniture factory, and a textile mill. The town also has a few retail stores, restaurants, and other small businesses.
Demographics
As of the 2010 census, the population of Centerville was 1,000 people. The racial makeup of the town was 97.2% White, 0.7% African American, 0.3% Native American, 0.2% Asian, 0.1% Pacific Islander, and 1.5% from other races. The median household income was $30,000, and the median family income was $35,000.
Conclusion
Centerville is a small town located in the northeastern part of South Carolina. It has a population of approximately 1,000 people, and is part of the Anderson Metropolitan Statistical Area. The town was founded in 1820, and was the first town in Anderson County to be incorporated. The economy of Centerville is largely based on agriculture and manufacturing, and the town is home to several small businesses. The racial makeup of the town is predominantly White, with a small percentage of African American, Native American, Asian, and Pacific Islander residents. The median household income is $30,000, and the median family income is $35,000.
Common Questions
What is the Total Population of Centerville?
Total Population of Centerville is 7,217.
What is the Total Male Population of Centerville?
Total Male Population of Centerville is 3,428.
What is the Total Female Population of Centerville?
Total Female Population of Centerville is 3,789.
What is the Ratio of Males per 100 Females in Centerville?
There are 90.47 Males per 100 Females in Centerville.
What is the Ratio of Females per 100 Males in Centerville?
There are 110.53 Females per 100 Males in Centerville.
What is the Median Population Age in Centerville?
Median Population Age in Centerville is 40.8 Years.
What is the Average Family Size in Centerville
Average Family Size in Centerville is 2.9 People.
What is the Average Household Size in Centerville
Average Household Size in Centerville is 2.3 People.
What is Per Capita Income in Centerville?
Per Capita income in Centerville is $35,987.
What is the Median Family Income in Centerville?
Median Family Income in Centerville is $86,625.
What is the Median Household income in Centerville?
Median Household Income in Centerville is $71,292.
What is Income or Wage Gap in Centerville?
Income or Wage Gap in Centerville is 29.7%.
Women in Centerville earn 70.3 cents for every dollar earned by a man.
What is Family Income Deficit in Centerville?
Family Income Deficit in Centerville is $13,575.
Families that are below poverty line in Centerville earn $13,575 less on average than the poverty threshold level.
What is Inequality or Gini Index in Centerville?
Inequality or Gini Index in Centerville is 0.38.
How Large is the Labor Force in Centerville?
There are 4,202 People in the Labor Forcein in Centerville.
What is the Percentage of People in the Labor Force in Centerville?
71.7% of People are in the Labor Force in Centerville.
What is the Unemployment Rate in Centerville?
Unemployment Rate in Centerville is 1.6%.