Iranian vs German Receiving Food Stamps

COMPARE

Iranian
Race
Ancestry
AfghanAfricanAlaska NativeAlaskan AthabascanAlbanianAleutAlsatianAmericanApacheArabArapahoArgentineanArmenianAssyrian/Chaldean/SyriacAustralianAustrianBahamianBangladeshiBarbadianBasqueBelgianBelizeanBermudanBhutaneseBlackfeetBolivianBrazilianBritishBritish West IndianBulgarianBurmeseCajunCambodianCanadianCape VerdeanCarpatho RusynCelticCentral AmericanCentral American IndianCherokeeCheyenneChickasawChileanChineseChippewaChoctawColombianColvilleComancheCosta RicanCreeCreekCroatianCrowCubanCypriotCzechCzechoslovakianDanishDelawareDominicanDutchDutch West IndianEastern EuropeanEcuadorianEgyptianEnglishEstonianEthiopianEuropeanFijianFilipinoFinnishFrenchFrench American IndianFrench CanadianGerman RussianGhanaianGreekGuamanian/ChamorroGuatemalanGuyaneseHaitianHmongHonduranHopiHoumaHungarianIcelanderIndian (Asian)IndonesianInupiatIranianIraqiIrishIroquoisIsraeliItalianJamaicanJapaneseJordanianKenyanKiowaKoreanLaotianLatvianLebaneseLiberianLithuanianLumbeeLuxembourgerMacedonianMalaysianMalteseMarshalleseMenomineeMexicanMexican American IndianMongolianMoroccanNative HawaiianNavajoNepaleseNew ZealanderNicaraguanNigerianNorthern EuropeanNorwegianOkinawanOsageOttawaPaiutePakistaniPalestinianPanamanianParaguayanPennsylvania GermanPeruvianPimaPolishPortuguesePotawatomiPuebloPuerto RicanPuget Sound SalishRomanianRussianSalvadoranSamoanScandinavianScotch-IrishScottishSeminoleSenegaleseSerbianShoshoneSierra LeoneanSiouxSlavicSlovakSloveneSomaliSouth AfricanSouth AmericanSouth American IndianSoviet UnionSpaniardSpanishSpanish AmericanSpanish American IndianSri LankanSubsaharan AfricanSudaneseSwedishSwissSyrianTaiwaneseThaiTlingit-HaidaTohono O'OdhamTonganTrinidadian and TobagonianTsimshianTurkishU.S. Virgin IslanderUgandanUkrainianUruguayanUteVenezuelanVietnameseWelshWest IndianYakamaYaquiYugoslavianYumanYup'ikZimbabwean
Immigration
NonimmigrantsImmigrantsAfghanistanAfricaAlbaniaArgentinaArmeniaAsiaAustraliaAustriaBahamasBangladeshBarbadosBelarusBelgiumBelizeBoliviaBosnia and HerzegovinaBrazilBulgariaBurma/MyanmarCabo VerdeCambodiaCameroonCanadaCaribbeanCentral AmericaChileChinaColombiaCongoCosta RicaCroatiaCubaCzechoslovakiaDenmarkDominicaDominican RepublicEastern AfricaEastern AsiaEastern EuropeEcuadorEgyptEl SalvadorEnglandEritreaEthiopiaEuropeFijiFranceGermanyGhanaGreeceGrenadaGuatemalaGuyanaHaitiHondurasHong KongHungaryIndiaIndonesiaIranIraqIrelandIsraelItalyJamaicaJapanJordanKazakhstanKenyaKoreaKuwaitLaosLatin AmericaLatviaLebanonLiberiaLithuaniaMalaysiaMexicoMicronesiaMiddle AfricaMoldovaMoroccoNepalNetherlandsNicaraguaNigeriaNorth AmericaNorth MacedoniaNorthern AfricaNorthern EuropeNorwayOceaniaPakistanPanamaPeruPhilippinesPolandPortugalRomaniaRussiaSaudi ArabiaScotlandSenegalSerbiaSierra LeoneSingaporeSomaliaSouth AfricaSouth AmericaSouth Central AsiaSouth Eastern AsiaSouthern EuropeSpainSri LankaSt. Vincent and the GrenadinesSudanSwedenSwitzerlandSyriaTaiwanThailandTrinidad and TobagoTurkeyUgandaUkraineUruguayUzbekistanVenezuelaVietnamWest IndiesWestern AfricaWestern AsiaWestern EuropeYemenZaireZimbabweAzores
German
Race
Ancestry
AfghanAfricanAlaska NativeAlaskan AthabascanAlbanianAleutAlsatianAmericanApacheArabArapahoArgentineanArmenianAssyrian/Chaldean/SyriacAustralianAustrianBahamianBangladeshiBarbadianBasqueBelgianBelizeanBermudanBhutaneseBlackfeetBolivianBrazilianBritishBritish West IndianBulgarianBurmeseCajunCambodianCanadianCape VerdeanCarpatho RusynCelticCentral AmericanCentral American IndianCherokeeCheyenneChickasawChileanChineseChippewaChoctawColombianColvilleComancheCosta RicanCreeCreekCroatianCrowCubanCypriotCzechCzechoslovakianDanishDelawareDominicanDutchDutch West IndianEastern EuropeanEcuadorianEgyptianEnglishEstonianEthiopianEuropeanFijianFilipinoFinnishFrenchFrench American IndianFrench CanadianGermanGerman RussianGhanaianGreekGuamanian/ChamorroGuatemalanGuyaneseHaitianHmongHonduranHopiHoumaHungarianIcelanderIndian (Asian)IndonesianInupiatIraqiIrishIroquoisIsraeliItalianJamaicanJapaneseJordanianKenyanKiowaKoreanLaotianLatvianLebaneseLiberianLithuanianLumbeeLuxembourgerMacedonianMalaysianMalteseMarshalleseMenomineeMexicanMexican American IndianMongolianMoroccanNative HawaiianNavajoNepaleseNew ZealanderNicaraguanNigerianNorthern EuropeanNorwegianOkinawanOsageOttawaPaiutePakistaniPalestinianPanamanianParaguayanPennsylvania GermanPeruvianPimaPolishPortuguesePotawatomiPuebloPuerto RicanPuget Sound SalishRomanianRussianSalvadoranSamoanScandinavianScotch-IrishScottishSeminoleSenegaleseSerbianShoshoneSierra LeoneanSiouxSlavicSlovakSloveneSomaliSouth AfricanSouth AmericanSouth American IndianSoviet UnionSpaniardSpanishSpanish AmericanSpanish American IndianSri LankanSubsaharan AfricanSudaneseSwedishSwissSyrianTaiwaneseThaiTlingit-HaidaTohono O'OdhamTonganTrinidadian and TobagonianTsimshianTurkishU.S. Virgin IslanderUgandanUkrainianUruguayanUteVenezuelanVietnameseWelshWest IndianYakamaYaquiYugoslavianYumanYup'ikZimbabwean
Immigration
NonimmigrantsImmigrantsAfghanistanAfricaAlbaniaArgentinaArmeniaAsiaAustraliaAustriaBahamasBangladeshBarbadosBelarusBelgiumBelizeBoliviaBosnia and HerzegovinaBrazilBulgariaBurma/MyanmarCabo VerdeCambodiaCameroonCanadaCaribbeanCentral AmericaChileChinaColombiaCongoCosta RicaCroatiaCubaCzechoslovakiaDenmarkDominicaDominican RepublicEastern AfricaEastern AsiaEastern EuropeEcuadorEgyptEl SalvadorEnglandEritreaEthiopiaEuropeFijiFranceGermanyGhanaGreeceGrenadaGuatemalaGuyanaHaitiHondurasHong KongHungaryIndiaIndonesiaIranIraqIrelandIsraelItalyJamaicaJapanJordanKazakhstanKenyaKoreaKuwaitLaosLatin AmericaLatviaLebanonLiberiaLithuaniaMalaysiaMexicoMicronesiaMiddle AfricaMoldovaMoroccoNepalNetherlandsNicaraguaNigeriaNorth AmericaNorth MacedoniaNorthern AfricaNorthern EuropeNorwayOceaniaPakistanPanamaPeruPhilippinesPolandPortugalRomaniaRussiaSaudi ArabiaScotlandSenegalSerbiaSierra LeoneSingaporeSomaliaSouth AfricaSouth AmericaSouth Central AsiaSouth Eastern AsiaSouthern EuropeSpainSri LankaSt. Vincent and the GrenadinesSudanSwedenSwitzerlandSyriaTaiwanThailandTrinidad and TobagoTurkeyUgandaUkraineUruguayUzbekistanVenezuelaVietnamWest IndiesWestern AfricaWestern AsiaWestern EuropeYemenZaireZimbabweAzores
Receiving Food Stamps
Income
Poverty
Unemployment
Labor Participation
Family Structure
Vehicle Availability
Education Level
Disability

Receiving Food Stamps Comparison

Iranians

Germans

Exceptional
Exceptional
7.9%
RECEIVING FOOD STAMPS
100.0/ 100
METRIC RATING
4th/ 347
METRIC RANK
9.7%
RECEIVING FOOD STAMPS
99.2/ 100
METRIC RATING
60th/ 347
METRIC RANK

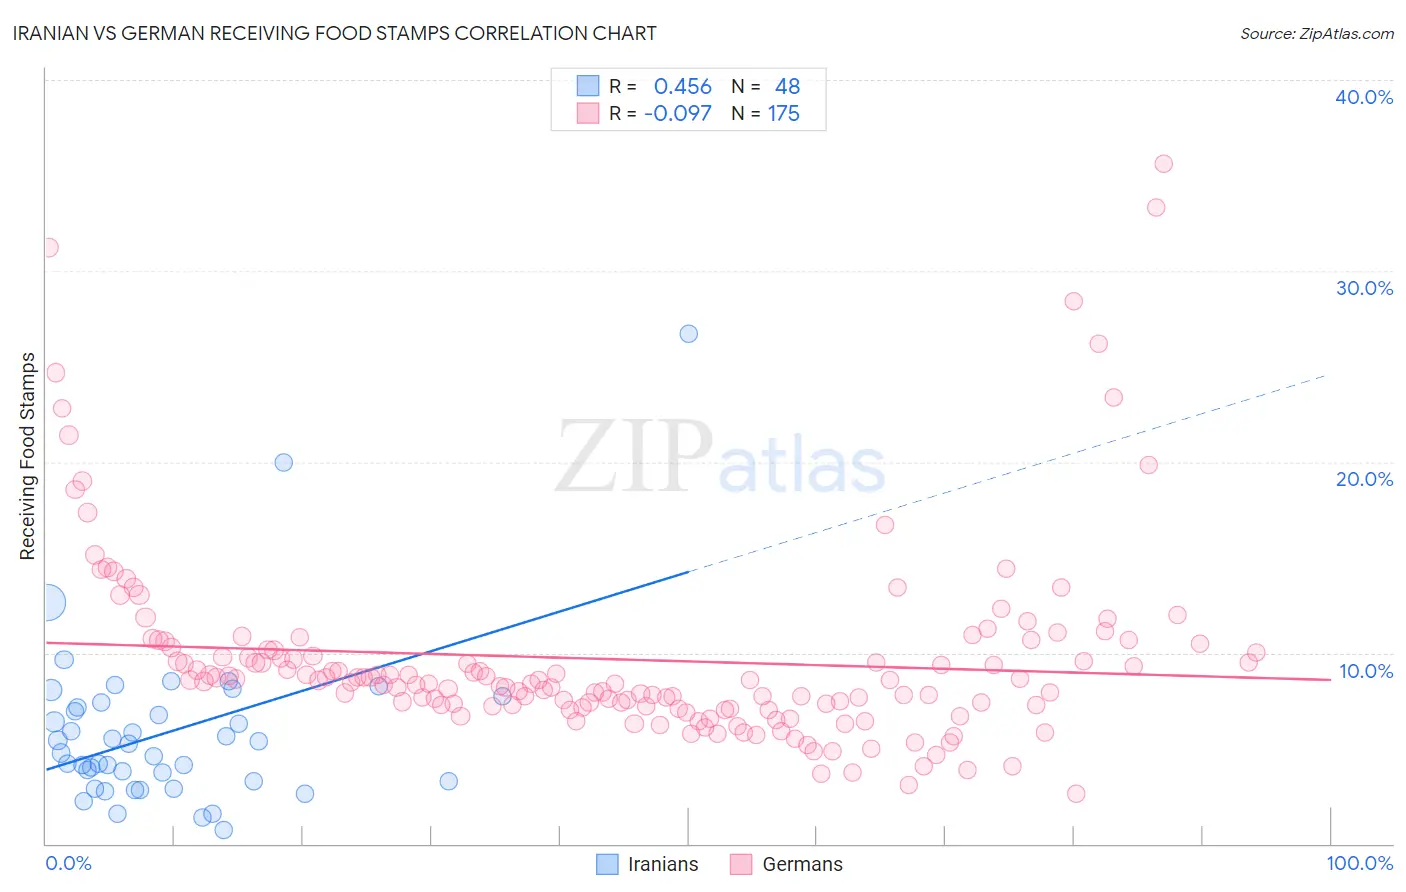
Iranian vs German Receiving Food Stamps Correlation Chart

The statistical analysis conducted on geographies consisting of 315,912,646 people shows a moderate positive correlation between the proportion of Iranians and percentage of population receiving government assistance and/or food stamps in the United States with a correlation coefficient (R) of 0.456 and weighted average of 7.9%. Similarly, the statistical analysis conducted on geographies consisting of 576,781,098 people shows a slight negative correlation between the proportion of Germans and percentage of population receiving government assistance and/or food stamps in the United States with a correlation coefficient (R) of -0.097 and weighted average of 9.7%, a difference of 22.8%.
Iranian vs German Receiving Food Stamps

Receiving Food Stamps Correlation Summary

MeasurementIranianGerman
Minimum0.70%2.6%
Maximum26.7%35.6%
Range26.0%33.0%
Mean5.9%9.7%
Median5.0%8.6%
Interquartile 25% (IQ1)3.3%7.2%
Interquartile 75% (IQ3)7.3%10.1%
Interquartile Range (IQR)4.0%2.9%
Standard Deviation (Sample)4.5%5.1%
Standard Deviation (Population)4.4%5.1%

Similar Demographics by Receiving Food Stamps

Demographics Similar to Iranians by Receiving Food Stamps

In terms of receiving food stamps, the demographic groups most similar to Iranians are Thai (8.1%, a difference of 2.3%), Immigrants from Singapore (8.3%, a difference of 4.6%), Immigrants from Iran (8.3%, a difference of 5.2%), Filipino (7.4%, a difference of 7.3%), and Immigrants from India (7.4%, a difference of 7.6%).
DemographicsRating | RankReceiving Food Stamps
Immigrants | Taiwan
100.0
/100
|
#1
Exceptional
7.3%
Immigrants | India
100.0
/100
|
#2
Exceptional
7.4%
Filipinos
100.0
/100
|
#3
Exceptional
7.4%
Iranians
100.0
/100
|
#4
Exceptional
7.9%
Thais
100.0
/100
|
#5
Exceptional
8.1%
Immigrants | Singapore
100.0
/100
|
#6
Exceptional
8.3%
Immigrants | Iran
100.0
/100
|
#7
Exceptional
8.3%
Burmese
99.9
/100
|
#8
Exceptional
8.6%
Immigrants | Korea
99.9
/100
|
#9
Exceptional
8.7%
Immigrants | South Central Asia
99.9
/100
|
#10
Exceptional
8.8%
Okinawans
99.9
/100
|
#11
Exceptional
8.9%
Cypriots
99.9
/100
|
#12
Exceptional
8.9%
Bulgarians
99.9
/100
|
#13
Exceptional
8.9%
Maltese
99.9
/100
|
#14
Exceptional
8.9%
Norwegians
99.9
/100
|
#15
Exceptional
9.0%

Demographics Similar to Germans by Receiving Food Stamps

In terms of receiving food stamps, the demographic groups most similar to Germans are British (9.7%, a difference of 0.10%), Scandinavian (9.7%, a difference of 0.13%), English (9.8%, a difference of 0.14%), Greek (9.7%, a difference of 0.19%), and Immigrants from Bulgaria (9.8%, a difference of 0.22%).
DemographicsRating | RankReceiving Food Stamps
Tongans
99.3
/100
|
#53
Exceptional
9.7%
Swiss
99.3
/100
|
#54
Exceptional
9.7%
Immigrants | Switzerland
99.3
/100
|
#55
Exceptional
9.7%
Immigrants | Canada
99.3
/100
|
#56
Exceptional
9.7%
Greeks
99.3
/100
|
#57
Exceptional
9.7%
Scandinavians
99.2
/100
|
#58
Exceptional
9.7%
British
99.2
/100
|
#59
Exceptional
9.7%
Germans
99.2
/100
|
#60
Exceptional
9.7%
English
99.2
/100
|
#61
Exceptional
9.8%
Immigrants | Bulgaria
99.2
/100
|
#62
Exceptional
9.8%
Chinese
99.2
/100
|
#63
Exceptional
9.8%
Immigrants | North America
99.2
/100
|
#64
Exceptional
9.8%
Immigrants | Turkey
99.1
/100
|
#65
Exceptional
9.8%
Slovenes
99.1
/100
|
#66
Exceptional
9.8%
Immigrants | Indonesia
99.0
/100
|
#67
Exceptional
9.8%