Norwood, OH
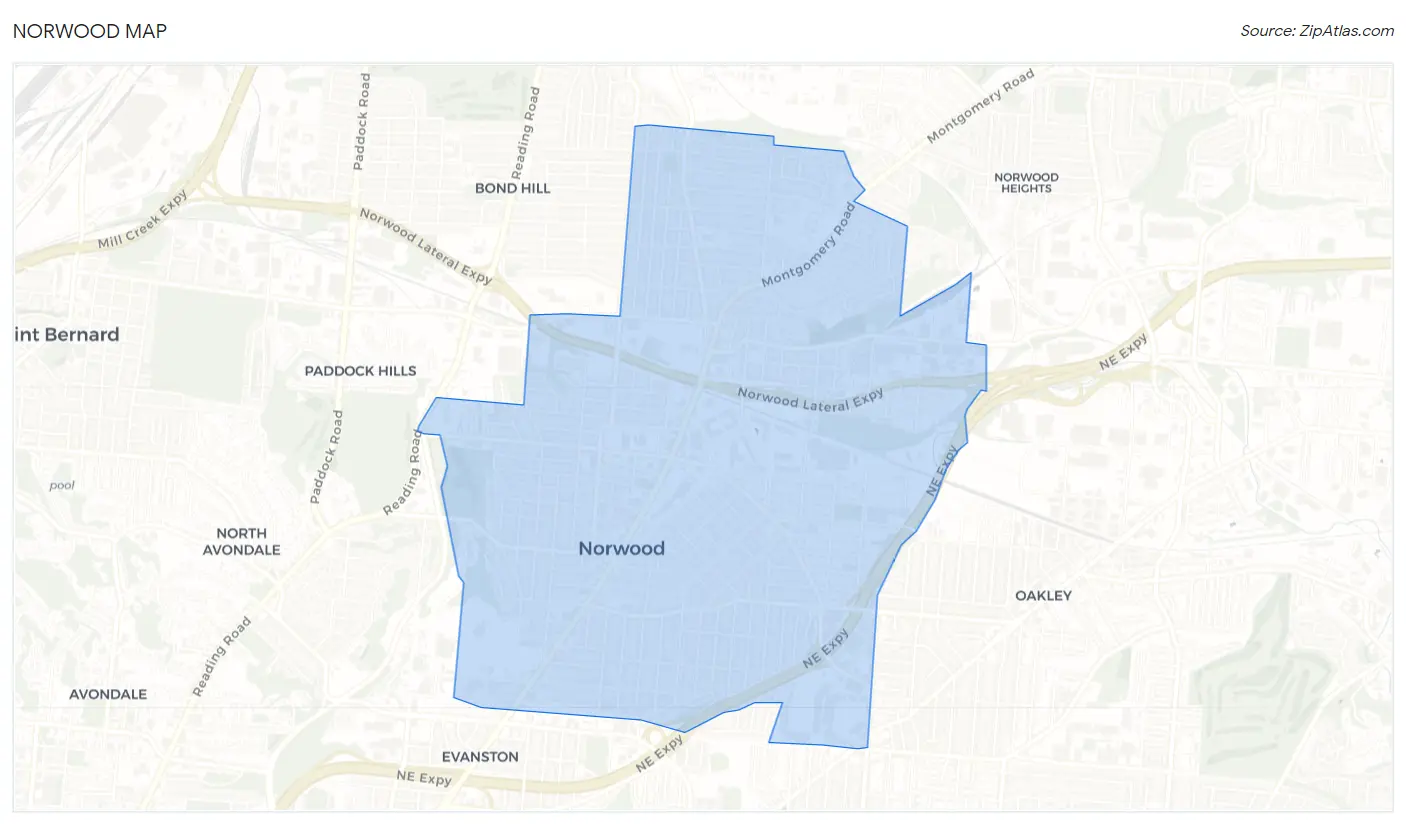
Norwood Map
Norwood Overview
19,018
TOTAL POPULATION
9,903
MALE POPULATION
9,115
FEMALE POPULATION
108.65
MALES / 100 FEMALES
92.04
FEMALES / 100 MALES
33.5
MEDIAN AGE
3.0
AVG FAMILY SIZE
2.2
AVG HOUSEHOLD SIZE
$36,286
PER CAPITA INCOME
$81,334
AVG FAMILY INCOME
$58,095
AVG HOUSEHOLD INCOME
19.5%
WAGE / INCOME GAP [ % ]
80.5¢/ $1
WAGE / INCOME GAP [ $ ]
0.46
INEQUALITY / GINI INDEX
11,215
LABOR FORCE [ PEOPLE ]
70.4%
PERCENT IN LABOR FORCE
4.5%
UNEMPLOYMENT RATE
Norwood Area Codes
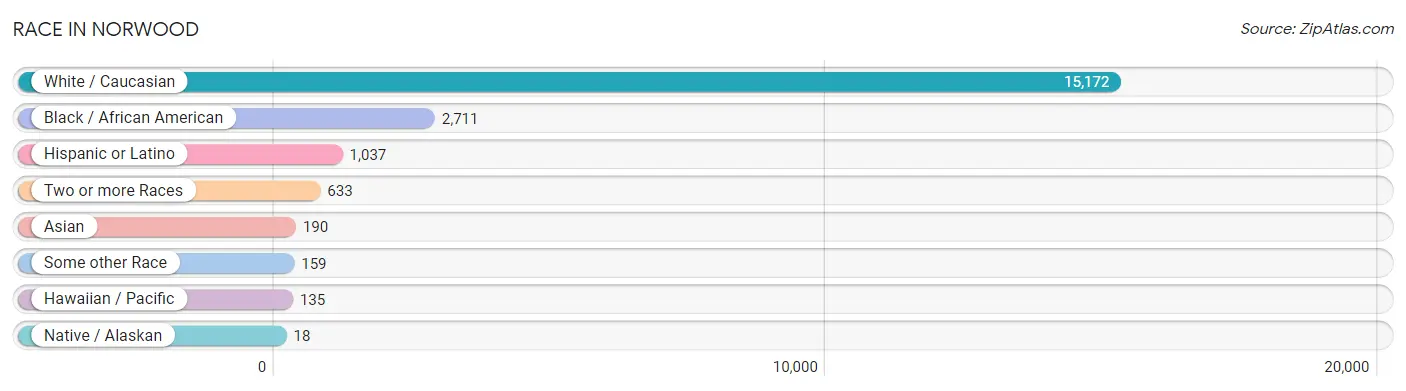
Race in Norwood
The most populous races in Norwood are White / Caucasian (15,172 | 79.8%), Black / African American (2,711 | 14.2%), and Hispanic or Latino (1,037 | 5.4%).
| Race | # Population | % Population |
| Asian | 190 | 1.0% |
| Black / African American | 2,711 | 14.2% |
| Hawaiian / Pacific | 135 | 0.7% |
| Hispanic or Latino | 1,037 | 5.4% |
| Native / Alaskan | 18 | 0.1% |
| White / Caucasian | 15,172 | 79.8% |
| Two or more Races | 633 | 3.3% |
| Some other Race | 159 | 0.8% |
| Total | 19,018 | 100.0% |
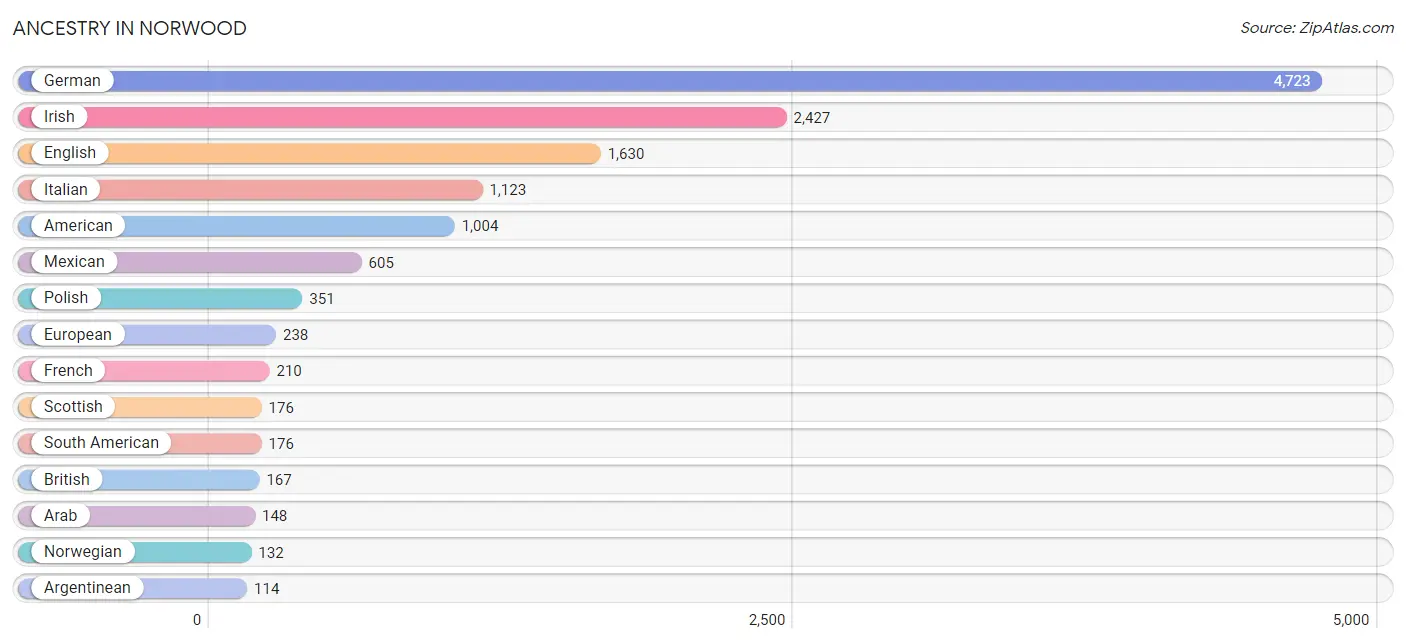
Ancestry in Norwood
The most populous ancestries reported in Norwood are German (4,723 | 24.8%), Irish (2,427 | 12.8%), English (1,630 | 8.6%), Italian (1,123 | 5.9%), and American (1,004 | 5.3%), together accounting for 57.3% of all Norwood residents.
| Ancestry | # Population | % Population |
| African | 33 | 0.2% |
| American | 1,004 | 5.3% |
| Arab | 148 | 0.8% |
| Argentinean | 114 | 0.6% |
| Austrian | 8 | 0.0% |
| Belgian | 13 | 0.1% |
| Bhutanese | 23 | 0.1% |
| British | 167 | 0.9% |
| Burmese | 11 | 0.1% |
| Canadian | 56 | 0.3% |
| Central American | 54 | 0.3% |
| Cherokee | 30 | 0.2% |
| Colombian | 24 | 0.1% |
| Costa Rican | 7 | 0.0% |
| Croatian | 23 | 0.1% |
| Czech | 43 | 0.2% |
| Czechoslovakian | 11 | 0.1% |
| Danish | 22 | 0.1% |
| Dominican | 102 | 0.5% |
| Dutch | 67 | 0.4% |
| Eastern European | 38 | 0.2% |
| Ecuadorian | 6 | 0.0% |
| English | 1,630 | 8.6% |
| European | 238 | 1.3% |
| French | 210 | 1.1% |
| French Canadian | 21 | 0.1% |
| German | 4,723 | 24.8% |
| Greek | 81 | 0.4% |
| Guatemalan | 38 | 0.2% |
| Honduran | 9 | 0.1% |
| Hungarian | 73 | 0.4% |
| Indian (Asian) | 96 | 0.5% |
| Irish | 2,427 | 12.8% |
| Israeli | 39 | 0.2% |
| Italian | 1,123 | 5.9% |
| Jordanian | 52 | 0.3% |
| Korean | 87 | 0.5% |
| Latvian | 12 | 0.1% |
| Lebanese | 69 | 0.4% |
| Lithuanian | 23 | 0.1% |
| Luxembourger | 13 | 0.1% |
| Mexican | 605 | 3.2% |
| Navajo | 8 | 0.0% |
| Nigerian | 55 | 0.3% |
| Northern European | 30 | 0.2% |
| Norwegian | 132 | 0.7% |
| Paraguayan | 12 | 0.1% |
| Peruvian | 20 | 0.1% |
| Polish | 351 | 1.8% |
| Portuguese | 7 | 0.0% |
| Puerto Rican | 79 | 0.4% |
| Russian | 36 | 0.2% |
| Scandinavian | 16 | 0.1% |
| Scotch-Irish | 68 | 0.4% |
| Scottish | 176 | 0.9% |
| Seminole | 5 | 0.0% |
| Serbian | 19 | 0.1% |
| Slovak | 59 | 0.3% |
| Slovene | 12 | 0.1% |
| South American | 176 | 0.9% |
| South American Indian | 12 | 0.1% |
| Sri Lankan | 26 | 0.1% |
| Subsaharan African | 88 | 0.5% |
| Swedish | 45 | 0.2% |
| Swiss | 36 | 0.2% |
| Thai | 15 | 0.1% |
| Turkish | 11 | 0.1% |
| Ukrainian | 3 | 0.0% |
| Welsh | 91 | 0.5% |
| Yugoslavian | 11 | 0.1% | View All 70 Rows |
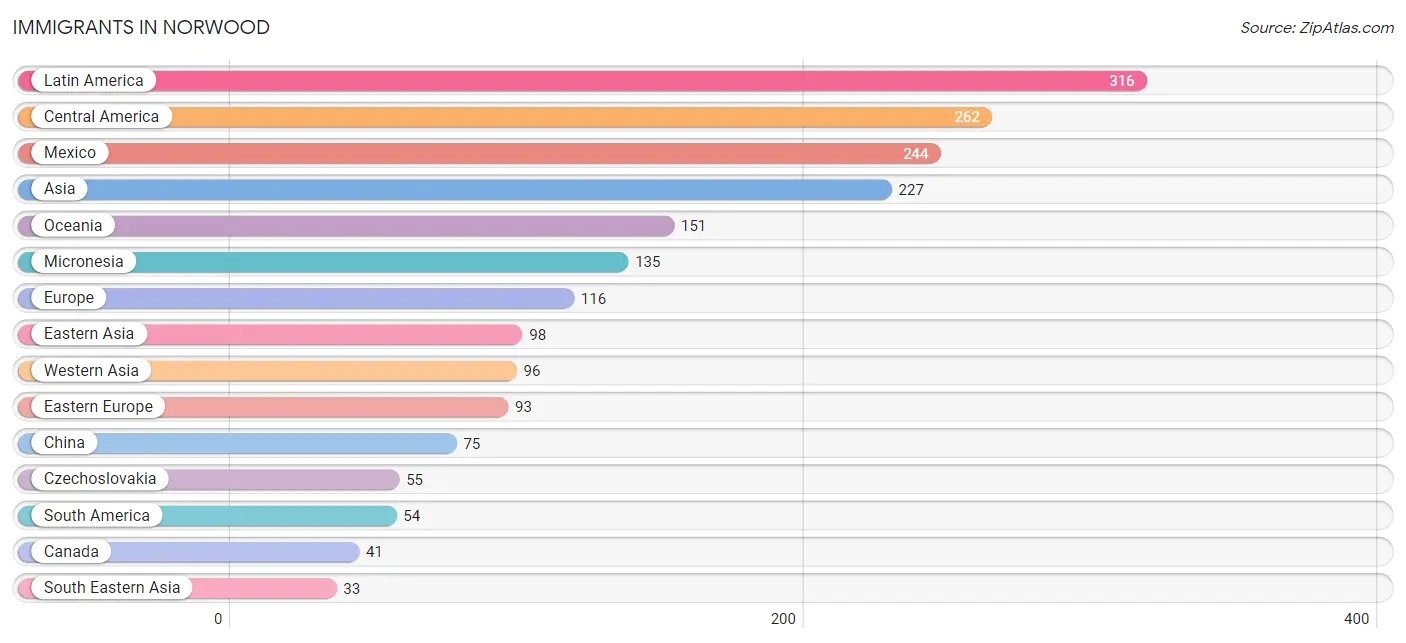
Immigrants in Norwood
The most numerous immigrant groups reported in Norwood came from Latin America (316 | 1.7%), Central America (262 | 1.4%), Mexico (244 | 1.3%), Asia (227 | 1.2%), and Oceania (151 | 0.8%), together accounting for 6.3% of all Norwood residents.
| Immigration Origin | # Population | % Population |
| Asia | 227 | 1.2% |
| Australia | 16 | 0.1% |
| Canada | 41 | 0.2% |
| Central America | 262 | 1.4% |
| China | 75 | 0.4% |
| Colombia | 16 | 0.1% |
| Czechoslovakia | 55 | 0.3% |
| Eastern Asia | 98 | 0.5% |
| Eastern Europe | 93 | 0.5% |
| Ecuador | 6 | 0.0% |
| Europe | 116 | 0.6% |
| Guatemala | 12 | 0.1% |
| Honduras | 6 | 0.0% |
| Japan | 23 | 0.1% |
| Jordan | 26 | 0.1% |
| Kuwait | 27 | 0.1% |
| Latin America | 316 | 1.7% |
| Latvia | 12 | 0.1% |
| Lebanon | 17 | 0.1% |
| Mexico | 244 | 1.3% |
| Micronesia | 135 | 0.7% |
| Oceania | 151 | 0.8% |
| Peru | 20 | 0.1% |
| Philippines | 7 | 0.0% |
| Poland | 8 | 0.0% |
| Russia | 18 | 0.1% |
| Saudi Arabia | 26 | 0.1% |
| South America | 54 | 0.3% |
| South Eastern Asia | 33 | 0.2% |
| Southern Europe | 23 | 0.1% |
| Spain | 23 | 0.1% |
| Vietnam | 26 | 0.1% |
| Western Asia | 96 | 0.5% | View All 33 Rows |
Sex and Age in Norwood
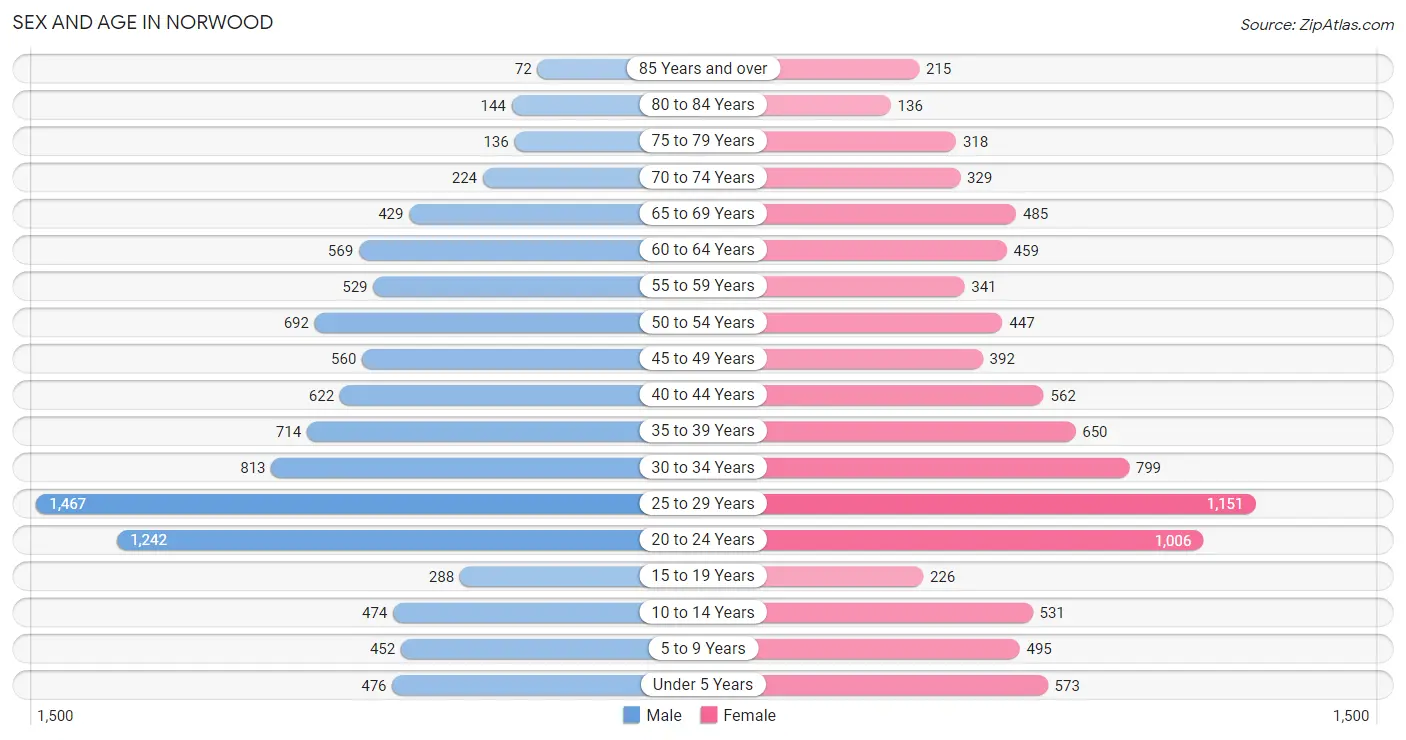
Sex and Age in Norwood
The most populous age groups in Norwood are 25 to 29 Years (1,467 | 14.8%) for men and 25 to 29 Years (1,151 | 12.6%) for women.
| Age Bracket | Male | Female |
| Under 5 Years | 476 (4.8%) | 573 (6.3%) |
| 5 to 9 Years | 452 (4.6%) | 495 (5.4%) |
| 10 to 14 Years | 474 (4.8%) | 531 (5.8%) |
| 15 to 19 Years | 288 (2.9%) | 226 (2.5%) |
| 20 to 24 Years | 1,242 (12.5%) | 1,006 (11.0%) |
| 25 to 29 Years | 1,467 (14.8%) | 1,151 (12.6%) |
| 30 to 34 Years | 813 (8.2%) | 799 (8.8%) |
| 35 to 39 Years | 714 (7.2%) | 650 (7.1%) |
| 40 to 44 Years | 622 (6.3%) | 562 (6.2%) |
| 45 to 49 Years | 560 (5.7%) | 392 (4.3%) |
| 50 to 54 Years | 692 (7.0%) | 447 (4.9%) |
| 55 to 59 Years | 529 (5.3%) | 341 (3.7%) |
| 60 to 64 Years | 569 (5.8%) | 459 (5.0%) |
| 65 to 69 Years | 429 (4.3%) | 485 (5.3%) |
| 70 to 74 Years | 224 (2.3%) | 329 (3.6%) |
| 75 to 79 Years | 136 (1.4%) | 318 (3.5%) |
| 80 to 84 Years | 144 (1.5%) | 136 (1.5%) |
| 85 Years and over | 72 (0.7%) | 215 (2.4%) |
| Total | 9,903 (100.0%) | 9,115 (100.0%) |
Families and Households in Norwood
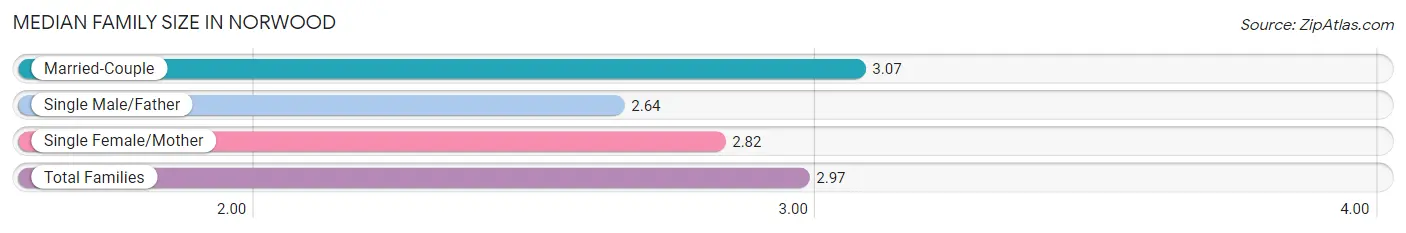
Median Family Size in Norwood
The median family size in Norwood is 2.97 persons per family, with married-couple families (2,558 | 68.3%) accounting for the largest median family size of 3.07 persons per family. On the other hand, single male/father families (420 | 11.2%) represent the smallest median family size with 2.64 persons per family.
| Family Type | # Families | Family Size |
| Married-Couple | 2,558 (68.3%) | 3.07 |
| Single Male/Father | 420 (11.2%) | 2.64 |
| Single Female/Mother | 767 (20.5%) | 2.82 |
| Total Families | 3,745 (100.0%) | 2.97 |
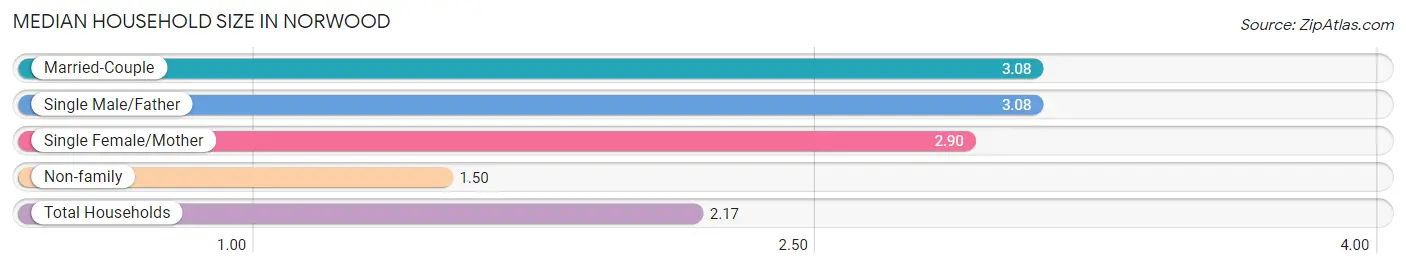
Median Household Size in Norwood
The median household size in Norwood is 2.17 persons per household, with married-couple households (2,558 | 29.6%) accounting for the largest median household size of 3.08 persons per household. non-family households (4,893 | 56.7%) represent the smallest median household size with 1.50 persons per household.
| Household Type | # Households | Household Size |
| Married-Couple | 2,558 (29.6%) | 3.08 |
| Single Male/Father | 420 (4.9%) | 3.08 |
| Single Female/Mother | 767 (8.9%) | 2.90 |
| Non-family | 4,893 (56.7%) | 1.50 |
| Total Households | 8,638 (100.0%) | 2.17 |
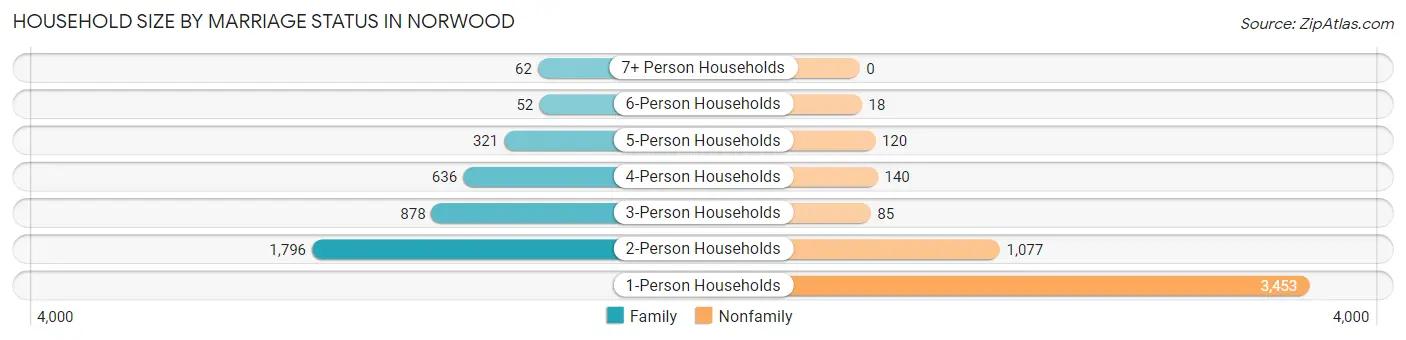
Household Size by Marriage Status in Norwood
Out of a total of 8,638 households in Norwood, 3,745 (43.3%) are family households, while 4,893 (56.7%) are nonfamily households. The most numerous type of family households are 2-person households, comprising 1,796, and the most common type of nonfamily households are 1-person households, comprising 3,453.
| Household Size | Family Households | Nonfamily Households |
| 1-Person Households | - | 3,453 (40.0%) |
| 2-Person Households | 1,796 (20.8%) | 1,077 (12.5%) |
| 3-Person Households | 878 (10.2%) | 85 (1.0%) |
| 4-Person Households | 636 (7.4%) | 140 (1.6%) |
| 5-Person Households | 321 (3.7%) | 120 (1.4%) |
| 6-Person Households | 52 (0.6%) | 18 (0.2%) |
| 7+ Person Households | 62 (0.7%) | 0 (0.0%) |
| Total | 3,745 (43.3%) | 4,893 (56.7%) |
Female Fertility in Norwood
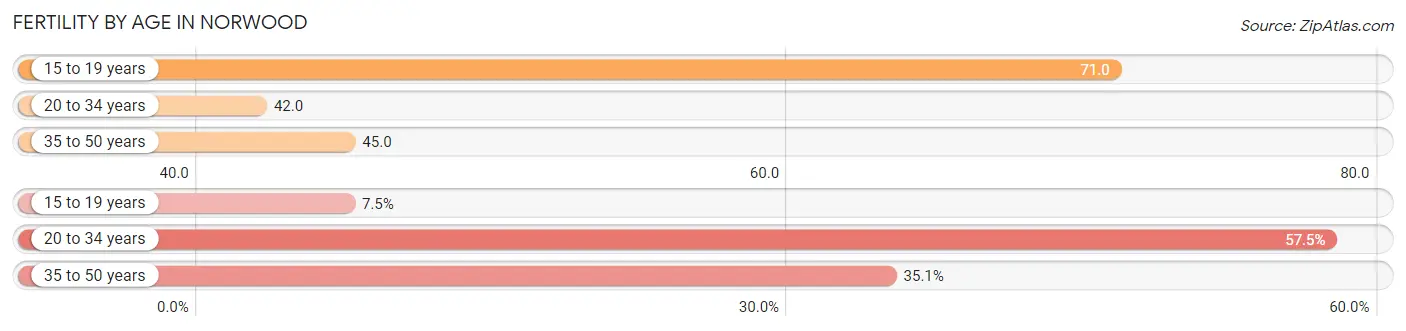
Fertility by Age in Norwood
Average fertility rate in Norwood is 44.0 births per 1,000 women. Women in the age bracket of 15 to 19 years have the highest fertility rate with 71.0 births per 1,000 women. Women in the age bracket of 20 to 34 years acount for 57.5% of all women with births.
| Age Bracket | Women with Births | Births / 1,000 Women |
| 15 to 19 years | 16 (7.5%) | 71.0 |
| 20 to 34 years | 123 (57.5%) | 42.0 |
| 35 to 50 years | 75 (35.0%) | 45.0 |
| Total | 214 (100.0%) | 44.0 |
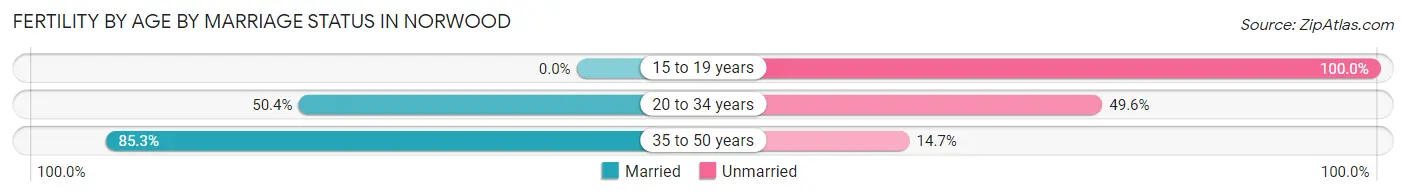
Fertility by Age by Marriage Status in Norwood
58.9% of women with births (214) in Norwood are married. The highest percentage of unmarried women with births falls into 15 to 19 years age bracket with 100.0% of them unmarried at the time of birth, while the lowest percentage of unmarried women with births belong to 35 to 50 years age bracket with 14.7% of them unmarried.
| Age Bracket | Married | Unmarried |
| 15 to 19 years | 0 (0.0%) | 16 (100.0%) |
| 20 to 34 years | 62 (50.4%) | 61 (49.6%) |
| 35 to 50 years | 64 (85.3%) | 11 (14.7%) |
| Total | 126 (58.9%) | 88 (41.1%) |
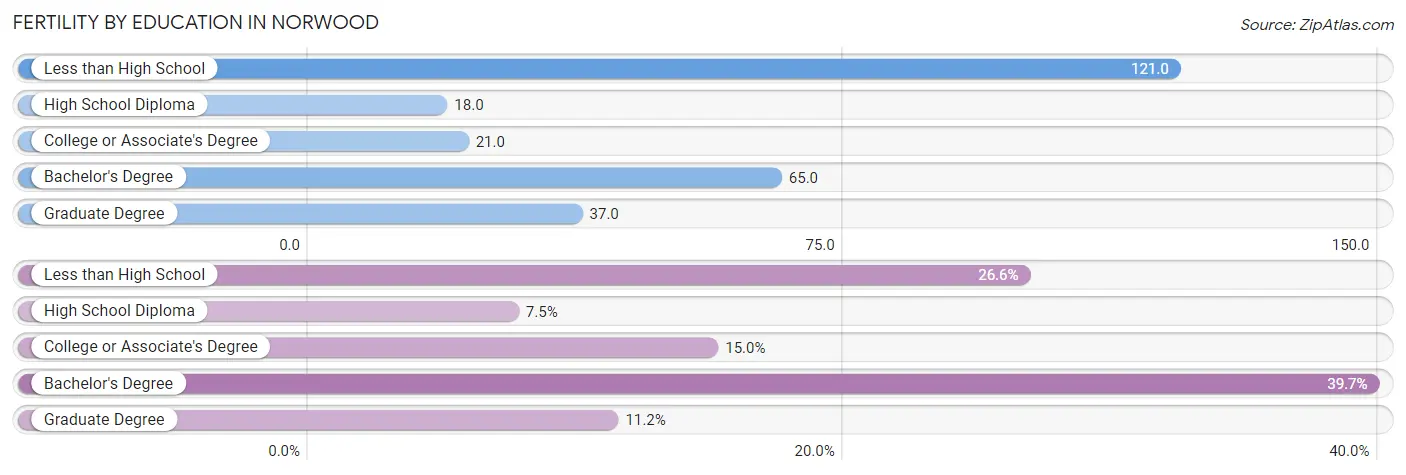
Fertility by Education in Norwood
Average fertility rate in Norwood is 44.0 births per 1,000 women. Women with the education attainment of less than high school have the highest fertility rate of 121.0 births per 1,000 women, while women with the education attainment of high school diploma have the lowest fertility at 18.0 births per 1,000 women. Women with the education attainment of bachelor's degree represent 39.7% of all women with births.
| Educational Attainment | Women with Births | Births / 1,000 Women |
| Less than High School | 57 (26.6%) | 121.0 |
| High School Diploma | 16 (7.5%) | 18.0 |
| College or Associate's Degree | 32 (14.9%) | 21.0 |
| Bachelor's Degree | 85 (39.7%) | 65.0 |
| Graduate Degree | 24 (11.2%) | 37.0 |
| Total | 214 (100.0%) | 44.0 |
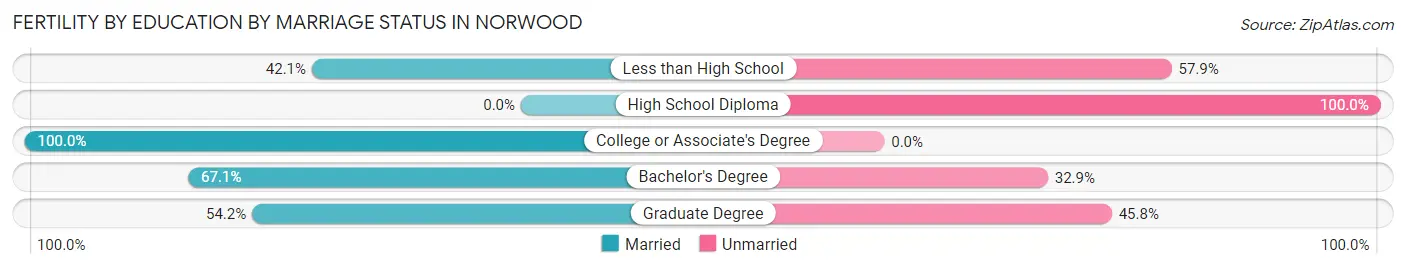
Fertility by Education by Marriage Status in Norwood
41.1% of women with births in Norwood are unmarried. Women with the educational attainment of college or associate's degree are most likely to be married with 100.0% of them married at childbirth, while women with the educational attainment of high school diploma are least likely to be married with 100.0% of them unmarried at childbirth.
| Educational Attainment | Married | Unmarried |
| Less than High School | 24 (42.1%) | 33 (57.9%) |
| High School Diploma | 0 (0.0%) | 16 (100.0%) |
| College or Associate's Degree | 32 (100.0%) | 0 (0.0%) |
| Bachelor's Degree | 57 (67.1%) | 28 (32.9%) |
| Graduate Degree | 13 (54.2%) | 11 (45.8%) |
| Total | 126 (58.9%) | 88 (41.1%) |
Income in Norwood
Income Overview in Norwood
Per Capita Income in Norwood is $36,286, while median incomes of families and households are $81,334 and $58,095 respectively.
| Characteristic | Number | Measure |
| Per Capita Income | 19,018 | $36,286 |
| Median Family Income | 3,745 | $81,334 |
| Mean Family Income | 3,745 | $100,500 |
| Median Household Income | 8,638 | $58,095 |
| Mean Household Income | 8,638 | $76,619 |
| Income Deficit | 3,745 | $0 |
| Wage / Income Gap (%) | 19,018 | 19.50% |
| Wage / Income Gap ($) | 19,018 | 80.50¢ per $1 |
| Gini / Inequality Index | 19,018 | 0.46 |
Earnings by Sex in Norwood
Average Earnings in Norwood are $38,901, $41,281 for men and $33,232 for women, a difference of 19.5%.
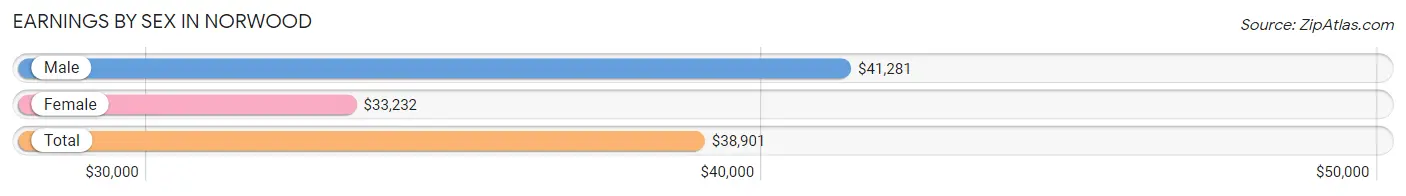
| Sex | Number | Average Earnings |
| Male | 6,809 (56.8%) | $41,281 |
| Female | 5,182 (43.2%) | $33,232 |
| Total | 11,991 (100.0%) | $38,901 |
Earnings by Sex by Income Bracket in Norwood
The most common earnings brackets in Norwood are $100,000+ for men (893 | 13.1%) and $55,000 to $64,999 for women (433 | 8.4%).
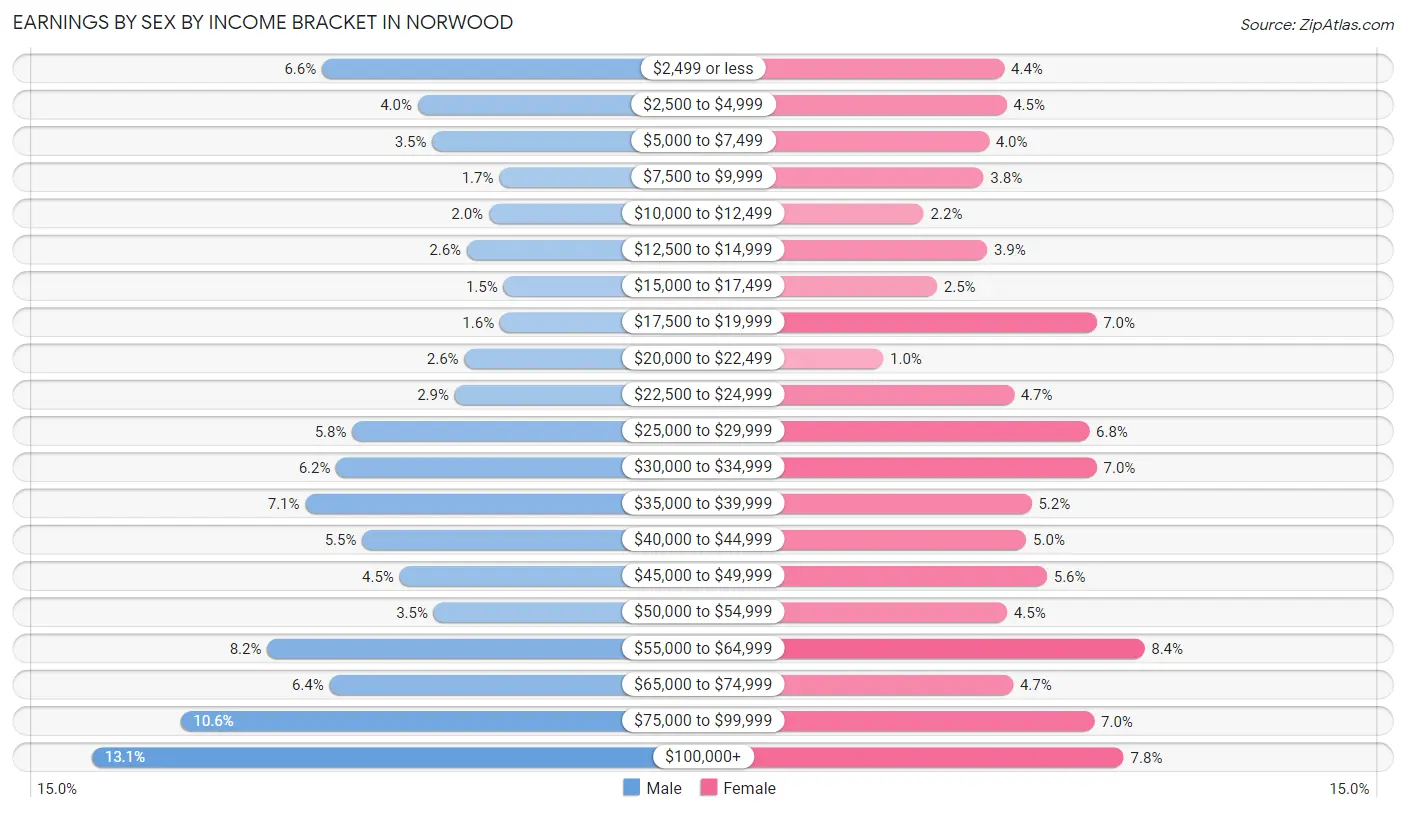
| Income | Male | Female |
| $2,499 or less | 452 (6.6%) | 229 (4.4%) |
| $2,500 to $4,999 | 269 (4.0%) | 232 (4.5%) |
| $5,000 to $7,499 | 241 (3.5%) | 207 (4.0%) |
| $7,500 to $9,999 | 113 (1.7%) | 199 (3.8%) |
| $10,000 to $12,499 | 133 (1.9%) | 112 (2.2%) |
| $12,500 to $14,999 | 175 (2.6%) | 204 (3.9%) |
| $15,000 to $17,499 | 105 (1.5%) | 131 (2.5%) |
| $17,500 to $19,999 | 112 (1.6%) | 363 (7.0%) |
| $20,000 to $22,499 | 180 (2.6%) | 53 (1.0%) |
| $22,500 to $24,999 | 198 (2.9%) | 243 (4.7%) |
| $25,000 to $29,999 | 394 (5.8%) | 353 (6.8%) |
| $30,000 to $34,999 | 425 (6.2%) | 364 (7.0%) |
| $35,000 to $39,999 | 484 (7.1%) | 269 (5.2%) |
| $40,000 to $44,999 | 375 (5.5%) | 261 (5.0%) |
| $45,000 to $49,999 | 304 (4.5%) | 291 (5.6%) |
| $50,000 to $54,999 | 238 (3.5%) | 233 (4.5%) |
| $55,000 to $64,999 | 557 (8.2%) | 433 (8.4%) |
| $65,000 to $74,999 | 438 (6.4%) | 242 (4.7%) |
| $75,000 to $99,999 | 723 (10.6%) | 360 (7.0%) |
| $100,000+ | 893 (13.1%) | 403 (7.8%) |
| Total | 6,809 (100.0%) | 5,182 (100.0%) |
Earnings by Sex by Educational Attainment in Norwood
Average earnings in Norwood are $49,254 for men and $40,261 for women, a difference of 18.3%. Men with an educational attainment of graduate degree enjoy the highest average annual earnings of $79,033, while those with less than high school education earn the least with $34,625. Women with an educational attainment of graduate degree earn the most with the average annual earnings of $60,179, while those with college or associate's degree education have the smallest earnings of $28,502.
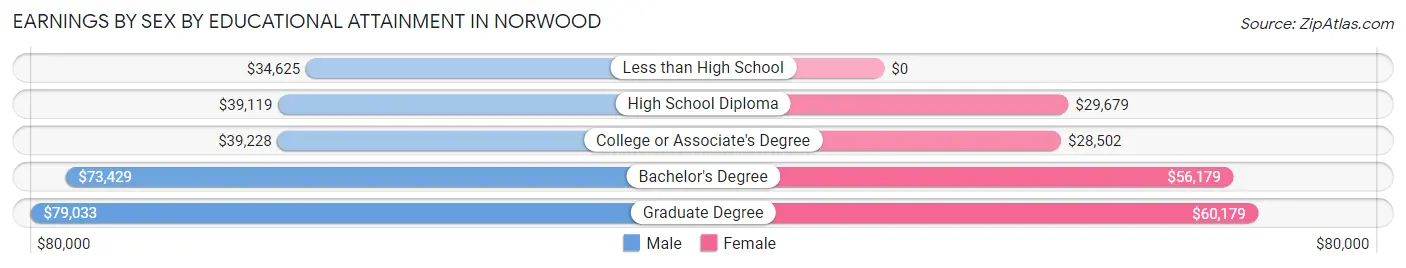
| Educational Attainment | Male Income | Female Income |
| Less than High School | $34,625 | $0 |
| High School Diploma | $39,119 | $29,679 |
| College or Associate's Degree | $39,228 | $28,502 |
| Bachelor's Degree | $73,429 | $56,179 |
| Graduate Degree | $79,033 | $60,179 |
| Total | $49,254 | $40,261 |
Family Income in Norwood
Family Income Brackets in Norwood
According to the Norwood family income data, there are 678 families falling into the $50,000 to $74,999 income range, which is the most common income bracket and makes up 18.1% of all families. Conversely, the $10,000 to $14,999 income bracket is the least frequent group with only 64 families (1.7%) belonging to this category.
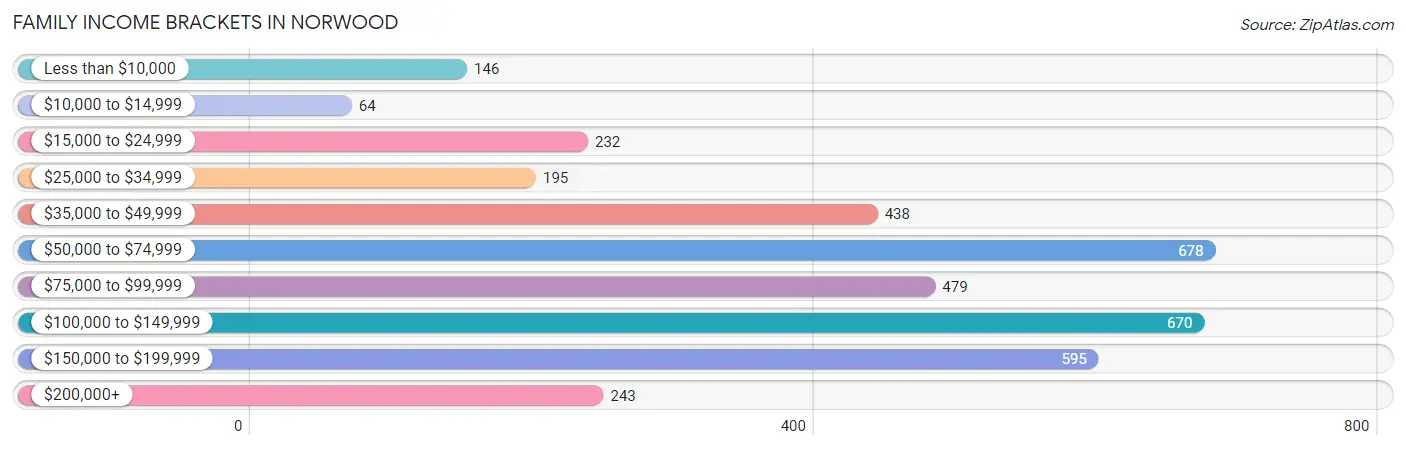
| Income Bracket | # Families | % Families |
| Less than $10,000 | 146 | 3.9% |
| $10,000 to $14,999 | 64 | 1.7% |
| $15,000 to $24,999 | 232 | 6.2% |
| $25,000 to $34,999 | 195 | 5.2% |
| $35,000 to $49,999 | 438 | 11.7% |
| $50,000 to $74,999 | 678 | 18.1% |
| $75,000 to $99,999 | 479 | 12.8% |
| $100,000 to $149,999 | 670 | 17.9% |
| $150,000 to $199,999 | 595 | 15.9% |
| $200,000+ | 243 | 6.5% |
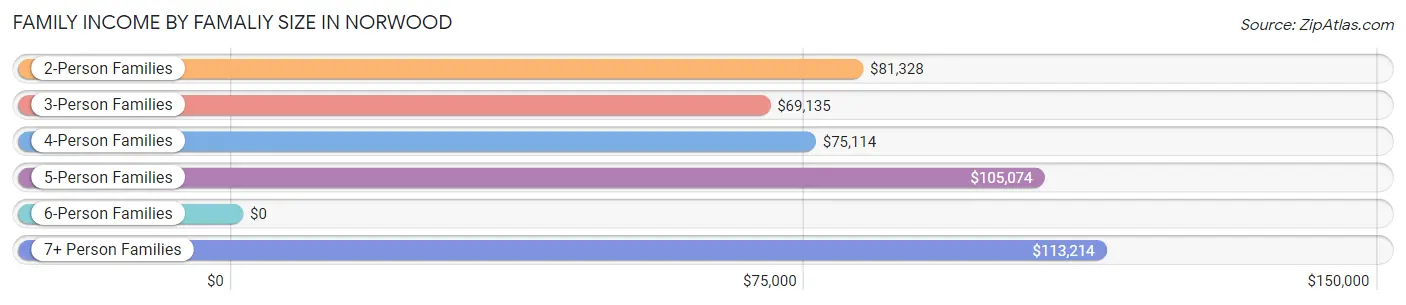
Family Income by Famaliy Size in Norwood
7+ person families (62 | 1.7%) account for the highest median family income in Norwood with $113,214 per family, while 2-person families (1,948 | 52.0%) have the highest median income of $40,664 per family member.
| Income Bracket | # Families | Median Income |
| 2-Person Families | 1,948 (52.0%) | $81,328 |
| 3-Person Families | 819 (21.9%) | $69,135 |
| 4-Person Families | 581 (15.5%) | $75,114 |
| 5-Person Families | 295 (7.9%) | $105,074 |
| 6-Person Families | 40 (1.1%) | $0 |
| 7+ Person Families | 62 (1.7%) | $113,214 |
| Total | 3,745 (100.0%) | $81,334 |
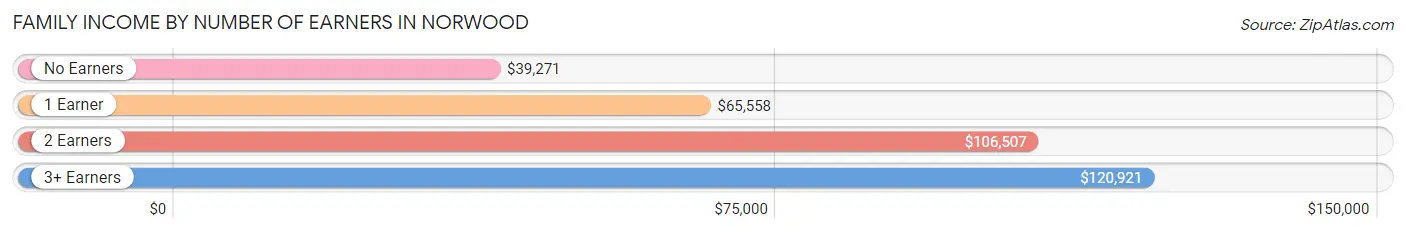
Family Income by Number of Earners in Norwood
The median family income in Norwood is $81,334, with families comprising 3+ earners (322) having the highest median family income of $120,921, while families with no earners (403) have the lowest median family income of $39,271, accounting for 8.6% and 10.8% of families, respectively.
| Number of Earners | # Families | Median Income |
| No Earners | 403 (10.8%) | $39,271 |
| 1 Earner | 1,352 (36.1%) | $65,558 |
| 2 Earners | 1,668 (44.5%) | $106,507 |
| 3+ Earners | 322 (8.6%) | $120,921 |
| Total | 3,745 (100.0%) | $81,334 |
Household Income in Norwood
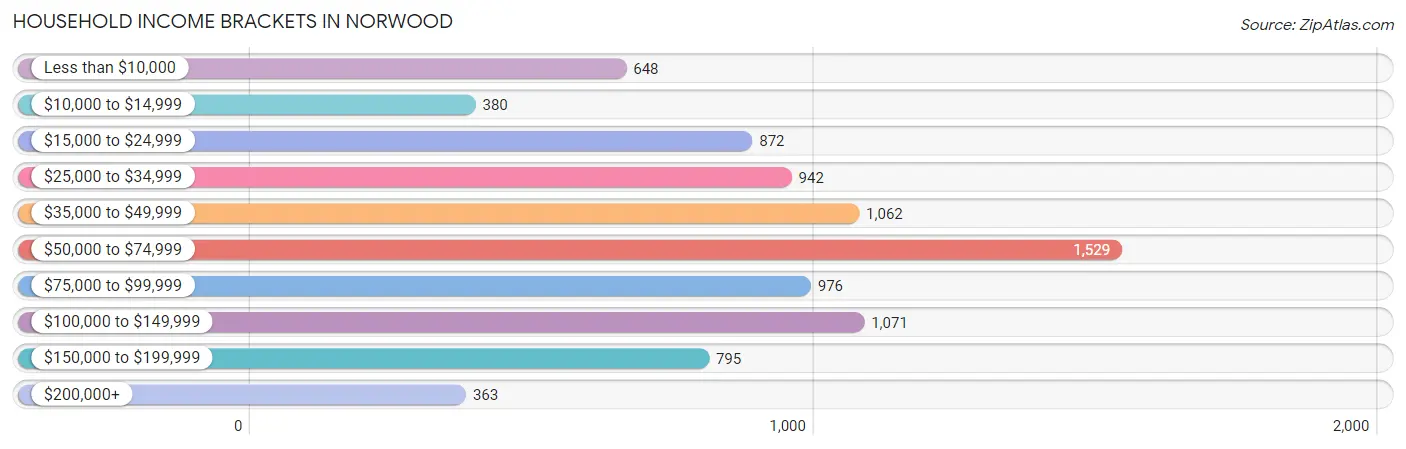
Household Income Brackets in Norwood
With 1,529 households falling in the category, the $50,000 to $74,999 income range is the most frequent in Norwood, accounting for 17.7% of all households. In contrast, only 363 households (4.2%) fall into the $200,000+ income bracket, making it the least populous group.
| Income Bracket | # Households | % Households |
| Less than $10,000 | 648 | 7.5% |
| $10,000 to $14,999 | 380 | 4.4% |
| $15,000 to $24,999 | 872 | 10.1% |
| $25,000 to $34,999 | 942 | 10.9% |
| $35,000 to $49,999 | 1,062 | 12.3% |
| $50,000 to $74,999 | 1,529 | 17.7% |
| $75,000 to $99,999 | 976 | 11.3% |
| $100,000 to $149,999 | 1,071 | 12.4% |
| $150,000 to $199,999 | 795 | 9.2% |
| $200,000+ | 363 | 4.2% |
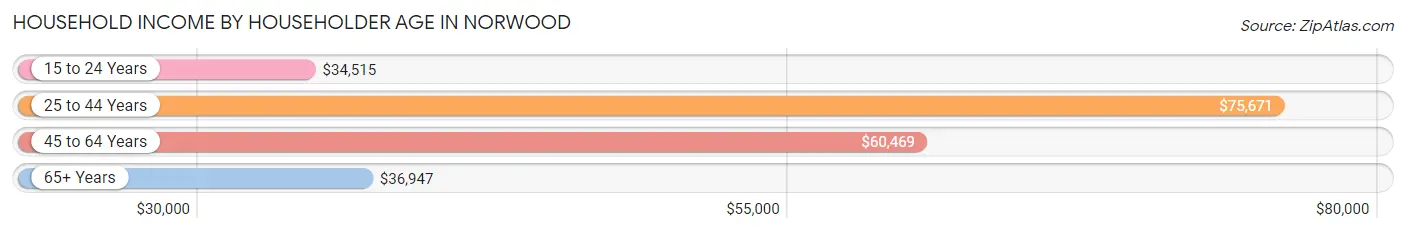
Household Income by Householder Age in Norwood
The median household income in Norwood is $58,095, with the highest median household income of $75,671 found in the 25 to 44 years age bracket for the primary householder. A total of 3,704 households (42.9%) fall into this category. Meanwhile, the 15 to 24 years age bracket for the primary householder has the lowest median household income of $34,515, with 773 households (8.9%) in this group.
| Income Bracket | # Households | Median Income |
| 15 to 24 Years | 773 (8.9%) | $34,515 |
| 25 to 44 Years | 3,704 (42.9%) | $75,671 |
| 45 to 64 Years | 2,448 (28.3%) | $60,469 |
| 65+ Years | 1,713 (19.8%) | $36,947 |
| Total | 8,638 (100.0%) | $58,095 |
Poverty in Norwood
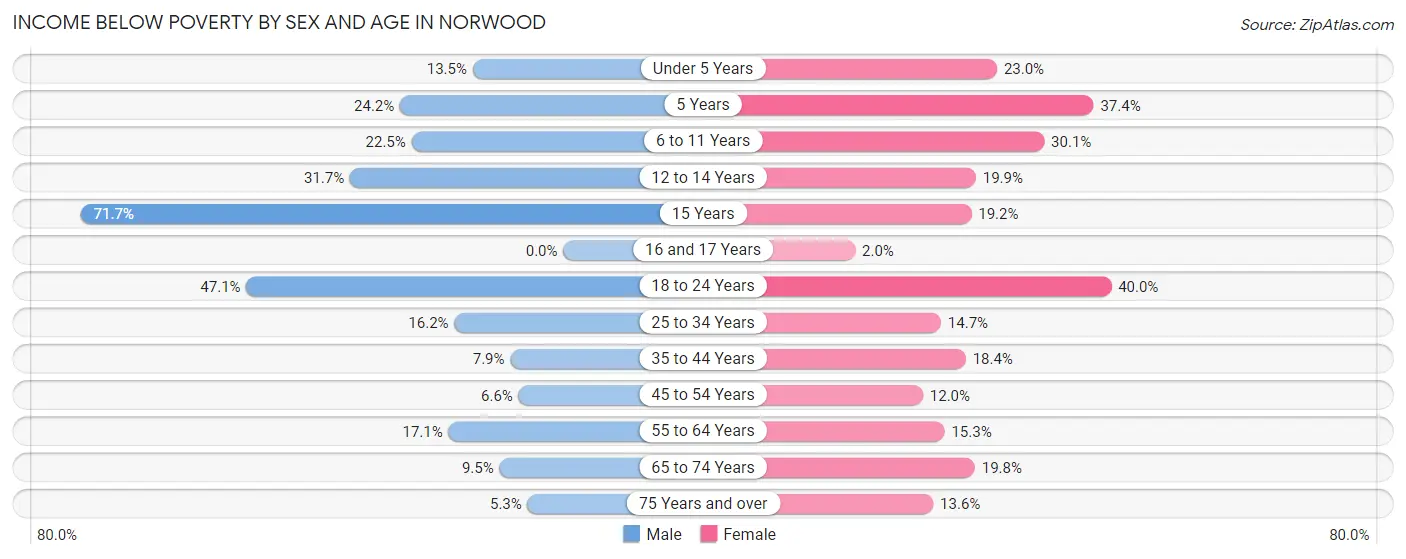
Income Below Poverty by Sex and Age in Norwood
With 18.6% poverty level for males and 20.3% for females among the residents of Norwood, 15 year old males and 18 to 24 year old females are the most vulnerable to poverty, with 43 males (71.7%) and 440 females (40.0%) in their respective age groups living below the poverty level.
| Age Bracket | Male | Female |
| Under 5 Years | 64 (13.5%) | 132 (23.0%) |
| 5 Years | 24 (24.2%) | 74 (37.4%) |
| 6 to 11 Years | 123 (22.5%) | 128 (30.0%) |
| 12 to 14 Years | 89 (31.7%) | 80 (19.9%) |
| 15 Years | 43 (71.7%) | 5 (19.2%) |
| 16 and 17 Years | 0 (0.0%) | 2 (2.0%) |
| 18 to 24 Years | 664 (47.1%) | 440 (40.0%) |
| 25 to 34 Years | 369 (16.2%) | 287 (14.7%) |
| 35 to 44 Years | 104 (7.9%) | 223 (18.4%) |
| 45 to 54 Years | 83 (6.6%) | 101 (12.0%) |
| 55 to 64 Years | 184 (17.1%) | 122 (15.2%) |
| 65 to 74 Years | 59 (9.5%) | 156 (19.8%) |
| 75 Years and over | 18 (5.3%) | 81 (13.6%) |
| Total | 1,824 (18.6%) | 1,831 (20.3%) |
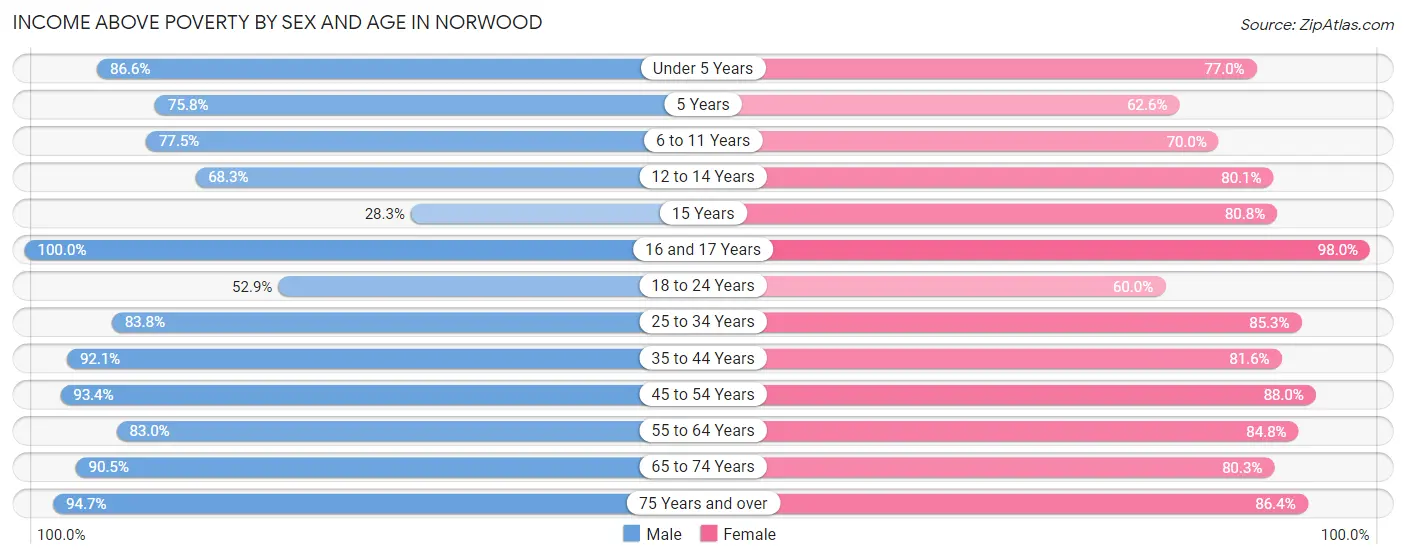
Income Above Poverty by Sex and Age in Norwood
According to the poverty statistics in Norwood, males aged 16 and 17 years and females aged 16 and 17 years are the age groups that are most secure financially, with 100.0% of males and 98.0% of females in these age groups living above the poverty line.
| Age Bracket | Male | Female |
| Under 5 Years | 412 (86.6%) | 441 (77.0%) |
| 5 Years | 75 (75.8%) | 124 (62.6%) |
| 6 to 11 Years | 423 (77.5%) | 298 (70.0%) |
| 12 to 14 Years | 192 (68.3%) | 322 (80.1%) |
| 15 Years | 17 (28.3%) | 21 (80.8%) |
| 16 and 17 Years | 49 (100.0%) | 99 (98.0%) |
| 18 to 24 Years | 747 (52.9%) | 660 (60.0%) |
| 25 to 34 Years | 1,911 (83.8%) | 1,663 (85.3%) |
| 35 to 44 Years | 1,218 (92.1%) | 989 (81.6%) |
| 45 to 54 Years | 1,169 (93.4%) | 738 (88.0%) |
| 55 to 64 Years | 895 (83.0%) | 678 (84.8%) |
| 65 to 74 Years | 564 (90.5%) | 634 (80.2%) |
| 75 Years and over | 321 (94.7%) | 516 (86.4%) |
| Total | 7,993 (81.4%) | 7,183 (79.7%) |
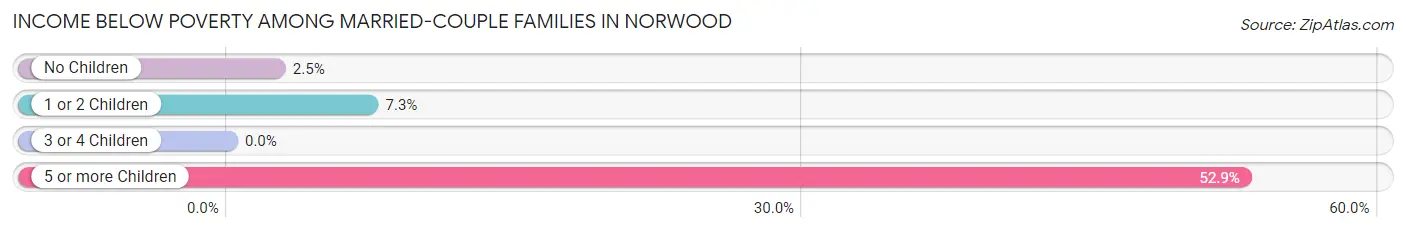
Income Below Poverty Among Married-Couple Families in Norwood
The poverty statistics for married-couple families in Norwood show that 4.0% or 101 of the total 2,558 families live below the poverty line. Families with 5 or more children have the highest poverty rate of 52.9%, comprising of 9 families. On the other hand, families with 3 or 4 children have the lowest poverty rate of 0.0%, which includes 0 families.
| Children | Above Poverty | Below Poverty |
| No Children | 1,524 (97.5%) | 39 (2.5%) |
| 1 or 2 Children | 669 (92.7%) | 53 (7.3%) |
| 3 or 4 Children | 256 (100.0%) | 0 (0.0%) |
| 5 or more Children | 8 (47.1%) | 9 (52.9%) |
| Total | 2,457 (96.1%) | 101 (4.0%) |
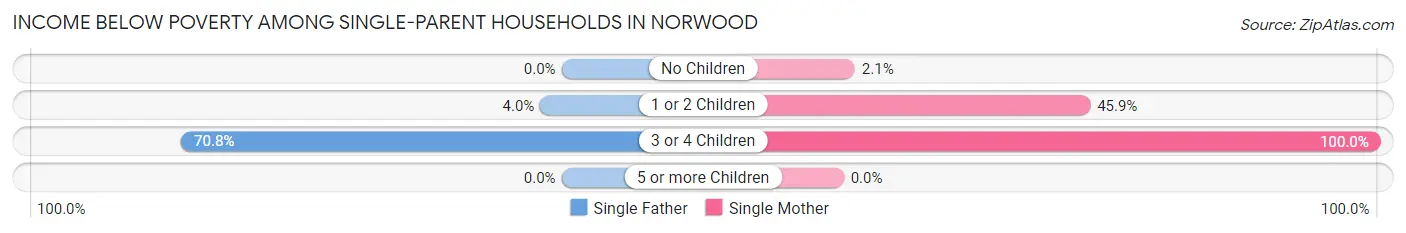
Income Below Poverty Among Single-Parent Households in Norwood
According to the poverty data in Norwood, 6.7% or 28 single-father households and 32.2% or 247 single-mother households are living below the poverty line. Among single-father households, those with 3 or 4 children have the highest poverty rate, with 17 households (70.8%) experiencing poverty. Likewise, among single-mother households, those with 3 or 4 children have the highest poverty rate, with 77 households (100.0%) falling below the poverty line.
| Children | Single Father | Single Mother |
| No Children | 0 (0.0%) | 7 (2.1%) |
| 1 or 2 Children | 11 (4.0%) | 163 (45.9%) |
| 3 or 4 Children | 17 (70.8%) | 77 (100.0%) |
| 5 or more Children | 0 (0.0%) | 0 (0.0%) |
| Total | 28 (6.7%) | 247 (32.2%) |
Income Below Poverty Among Married-Couple vs Single-Parent Households in Norwood
The poverty data for Norwood shows that 101 of the married-couple family households (4.0%) and 275 of the single-parent households (23.2%) are living below the poverty level. Within the married-couple family households, those with 5 or more children have the highest poverty rate, with 9 households (52.9%) falling below the poverty line. Among the single-parent households, those with 3 or 4 children have the highest poverty rate, with 94 household (93.1%) living below poverty.
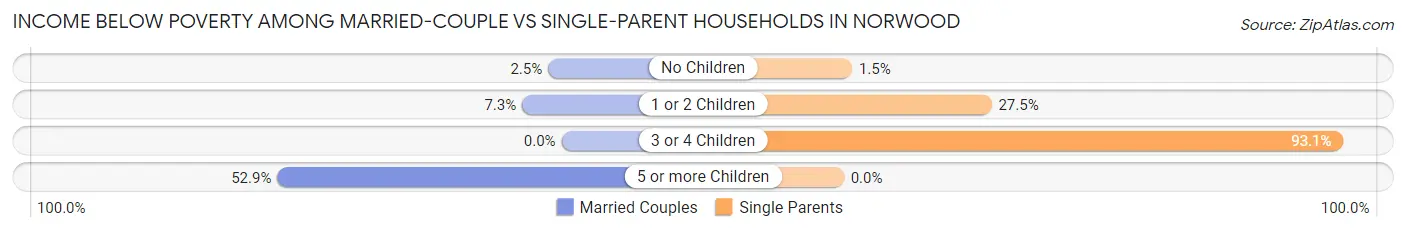
| Children | Married-Couple Families | Single-Parent Households |
| No Children | 39 (2.5%) | 7 (1.5%) |
| 1 or 2 Children | 53 (7.3%) | 174 (27.5%) |
| 3 or 4 Children | 0 (0.0%) | 94 (93.1%) |
| 5 or more Children | 9 (52.9%) | 0 (0.0%) |
| Total | 101 (4.0%) | 275 (23.2%) |
Employment Characteristics in Norwood
Employment by Class of Employer in Norwood
Among the 10,503 employed individuals in Norwood, private company employees (7,871 | 74.9%), not-for-profit organizations (966 | 9.2%), and local government employees (606 | 5.8%) make up the most common classes of employment.
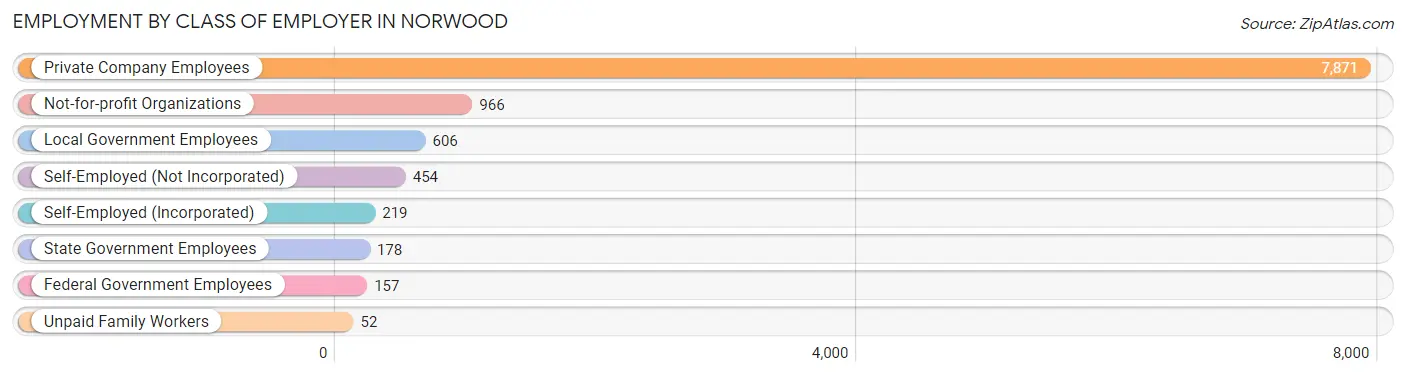
| Employer Class | # Employees | % Employees |
| Private Company Employees | 7,871 | 74.9% |
| Self-Employed (Incorporated) | 219 | 2.1% |
| Self-Employed (Not Incorporated) | 454 | 4.3% |
| Not-for-profit Organizations | 966 | 9.2% |
| Local Government Employees | 606 | 5.8% |
| State Government Employees | 178 | 1.7% |
| Federal Government Employees | 157 | 1.5% |
| Unpaid Family Workers | 52 | 0.5% |
| Total | 10,503 | 100.0% |
Employment Status by Age in Norwood
According to the labor force statistics for Norwood, out of the total population over 16 years of age (15,931), 70.4% or 11,215 individuals are in the labor force, with 4.5% or 505 of them unemployed. The age group with the highest labor force participation rate is 25 to 29 years, with 92.8% or 2,430 individuals in the labor force. Within the labor force, the 75 years and over age range has the highest percentage of unemployed individuals, with 27.8% or 15 of them being unemployed.
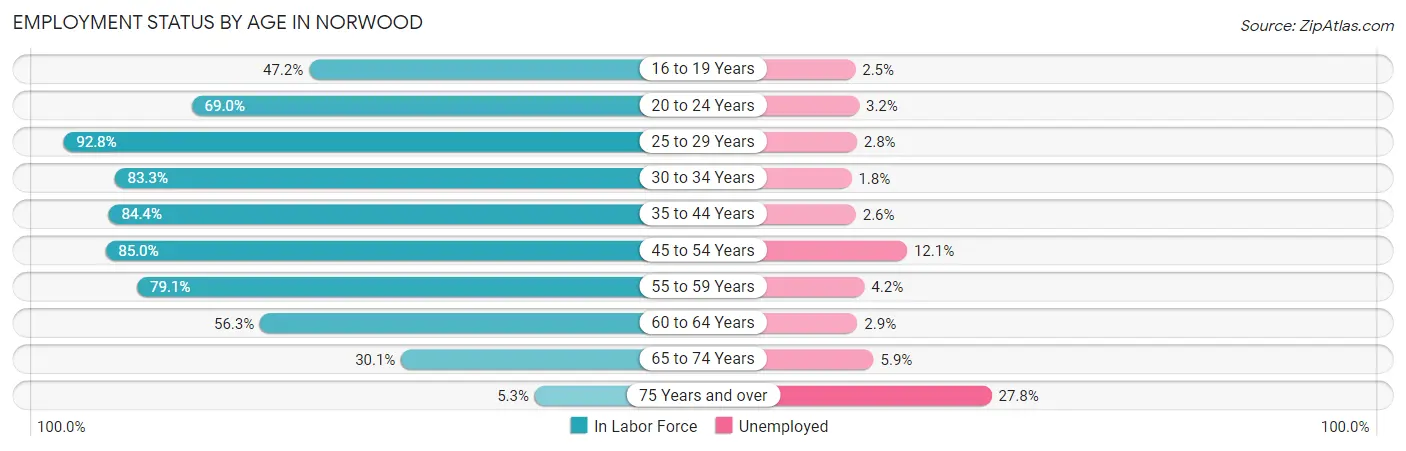
| Age Bracket | In Labor Force | Unemployed |
| 16 to 19 Years | 202 (47.2%) | 5 (2.5%) |
| 20 to 24 Years | 1,551 (69.0%) | 50 (3.2%) |
| 25 to 29 Years | 2,430 (92.8%) | 68 (2.8%) |
| 30 to 34 Years | 1,343 (83.3%) | 24 (1.8%) |
| 35 to 44 Years | 2,151 (84.4%) | 56 (2.6%) |
| 45 to 54 Years | 1,777 (85.0%) | 215 (12.1%) |
| 55 to 59 Years | 688 (79.1%) | 29 (4.2%) |
| 60 to 64 Years | 579 (56.3%) | 17 (2.9%) |
| 65 to 74 Years | 442 (30.1%) | 26 (5.9%) |
| 75 Years and over | 54 (5.3%) | 15 (27.8%) |
| Total | 11,215 (70.4%) | 505 (4.5%) |
Employment Status by Educational Attainment in Norwood
According to labor force statistics for Norwood, 83.3% of individuals (8,969) out of the total population between 25 and 64 years of age (10,767) are in the labor force, with 4.6% or 413 of them being unemployed. The group with the highest labor force participation rate are those with the educational attainment of bachelor's degree or higher, with 92.8% or 3,919 individuals in the labor force. Within the labor force, individuals with less than high school education have the highest percentage of unemployment, with 9.5% or 45 of them being unemployed.
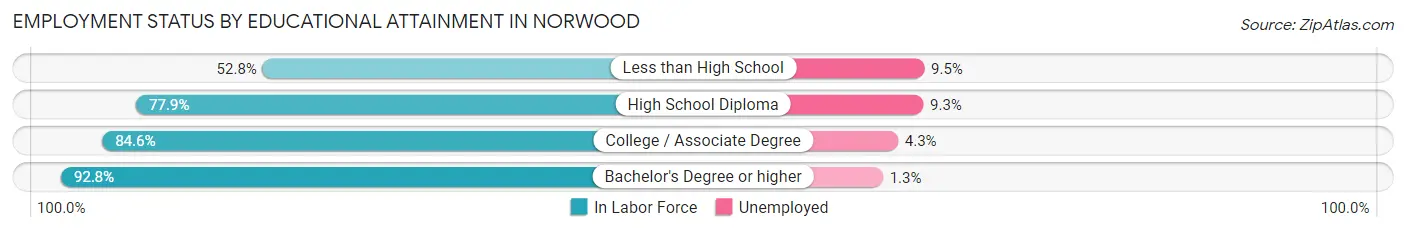
| Educational Attainment | In Labor Force | Unemployed |
| Less than High School | 472 (52.8%) | 85 (9.5%) |
| High School Diploma | 2,357 (77.9%) | 281 (9.3%) |
| College / Associate Degree | 2,220 (84.6%) | 113 (4.3%) |
| Bachelor's Degree or higher | 3,919 (92.8%) | 55 (1.3%) |
| Total | 8,969 (83.3%) | 495 (4.6%) |
Employment Occupations by Sex in Norwood
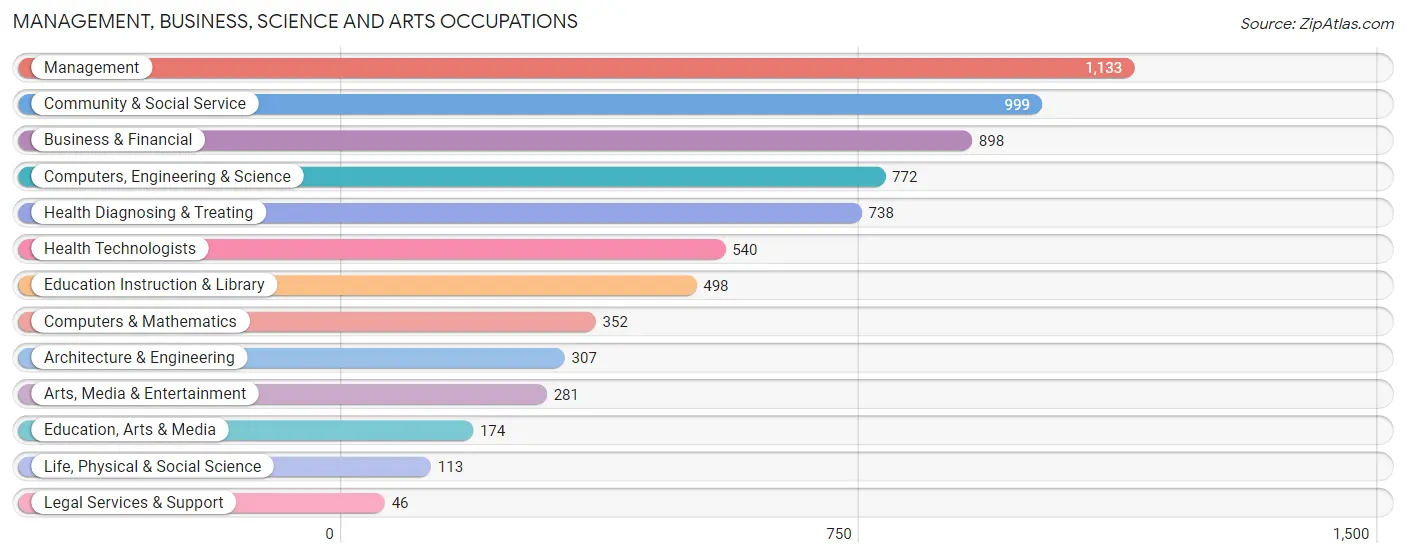
Management, Business, Science and Arts Occupations
The most common Management, Business, Science and Arts occupations in Norwood are Management (1,133 | 10.6%), Community & Social Service (999 | 9.3%), Business & Financial (898 | 8.4%), Computers, Engineering & Science (772 | 7.2%), and Health Diagnosing & Treating (738 | 6.9%).
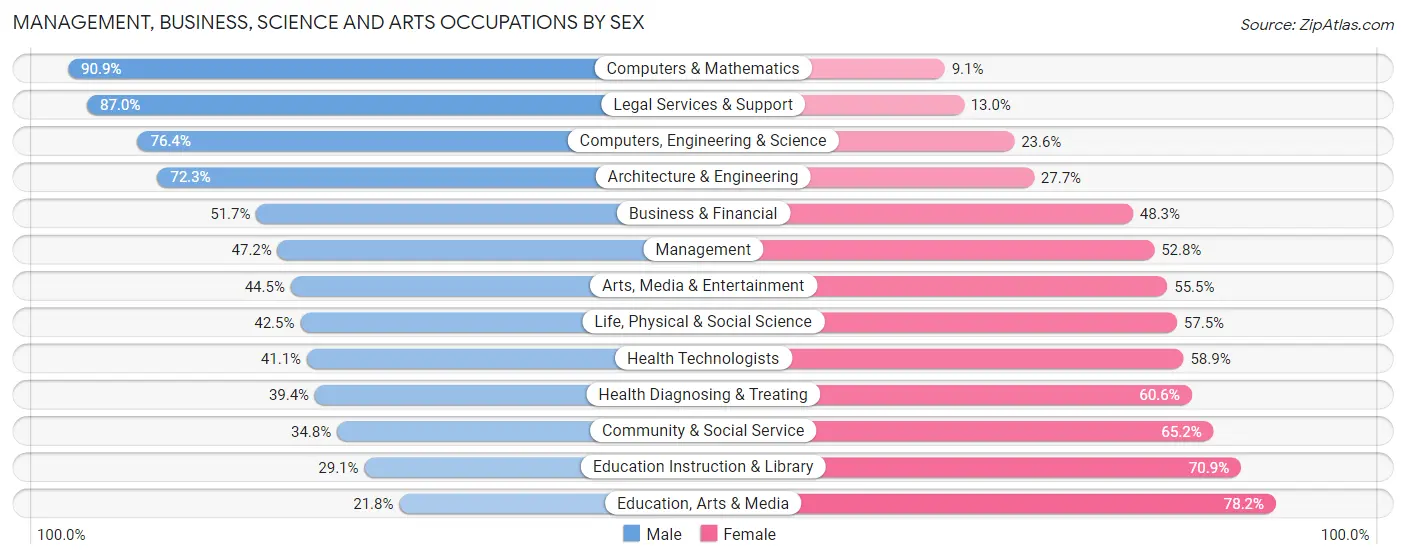
Management, Business, Science and Arts Occupations by Sex
Within the Management, Business, Science and Arts occupations in Norwood, the most male-oriented occupations are Computers & Mathematics (90.9%), Legal Services & Support (87.0%), and Computers, Engineering & Science (76.4%), while the most female-oriented occupations are Education, Arts & Media (78.2%), Education Instruction & Library (70.9%), and Community & Social Service (65.2%).
| Occupation | Male | Female |
| Management | 535 (47.2%) | 598 (52.8%) |
| Business & Financial | 464 (51.7%) | 434 (48.3%) |
| Computers, Engineering & Science | 590 (76.4%) | 182 (23.6%) |
| Computers & Mathematics | 320 (90.9%) | 32 (9.1%) |
| Architecture & Engineering | 222 (72.3%) | 85 (27.7%) |
| Life, Physical & Social Science | 48 (42.5%) | 65 (57.5%) |
| Community & Social Service | 348 (34.8%) | 651 (65.2%) |
| Education, Arts & Media | 38 (21.8%) | 136 (78.2%) |
| Legal Services & Support | 40 (87.0%) | 6 (13.0%) |
| Education Instruction & Library | 145 (29.1%) | 353 (70.9%) |
| Arts, Media & Entertainment | 125 (44.5%) | 156 (55.5%) |
| Health Diagnosing & Treating | 291 (39.4%) | 447 (60.6%) |
| Health Technologists | 222 (41.1%) | 318 (58.9%) |
| Total (Category) | 2,228 (49.1%) | 2,312 (50.9%) |
| Total (Overall) | 6,039 (56.4%) | 4,671 (43.6%) |
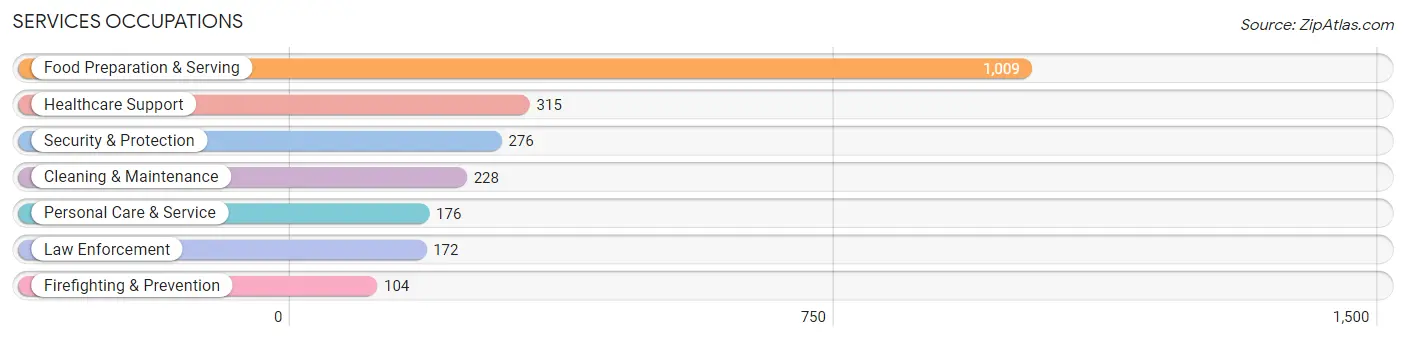
Services Occupations
The most common Services occupations in Norwood are Food Preparation & Serving (1,009 | 9.4%), Healthcare Support (315 | 2.9%), Security & Protection (276 | 2.6%), Cleaning & Maintenance (228 | 2.1%), and Personal Care & Service (176 | 1.6%).
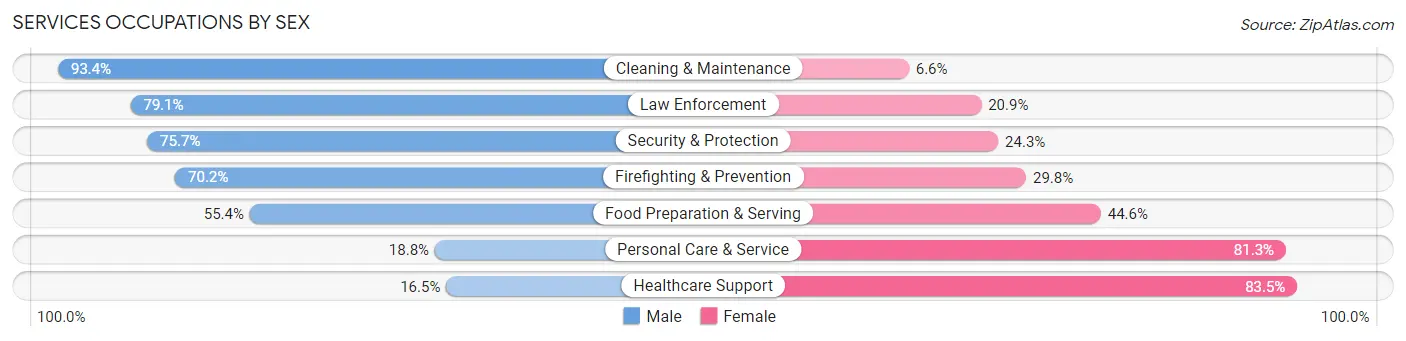
Services Occupations by Sex
Within the Services occupations in Norwood, the most male-oriented occupations are Cleaning & Maintenance (93.4%), Law Enforcement (79.1%), and Security & Protection (75.7%), while the most female-oriented occupations are Healthcare Support (83.5%), Personal Care & Service (81.2%), and Food Preparation & Serving (44.6%).
| Occupation | Male | Female |
| Healthcare Support | 52 (16.5%) | 263 (83.5%) |
| Security & Protection | 209 (75.7%) | 67 (24.3%) |
| Firefighting & Prevention | 73 (70.2%) | 31 (29.8%) |
| Law Enforcement | 136 (79.1%) | 36 (20.9%) |
| Food Preparation & Serving | 559 (55.4%) | 450 (44.6%) |
| Cleaning & Maintenance | 213 (93.4%) | 15 (6.6%) |
| Personal Care & Service | 33 (18.8%) | 143 (81.2%) |
| Total (Category) | 1,066 (53.2%) | 938 (46.8%) |
| Total (Overall) | 6,039 (56.4%) | 4,671 (43.6%) |
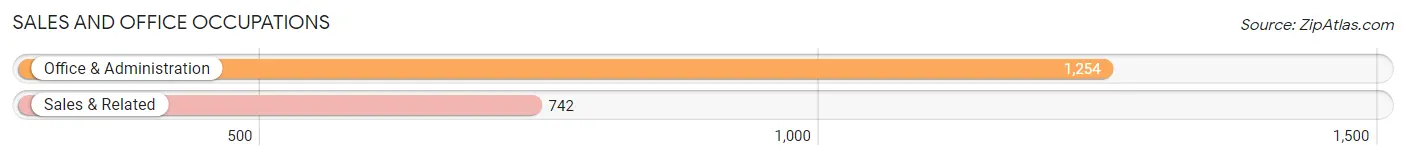
Sales and Office Occupations
The most common Sales and Office occupations in Norwood are Office & Administration (1,254 | 11.7%), and Sales & Related (742 | 6.9%).
Sales and Office Occupations by Sex
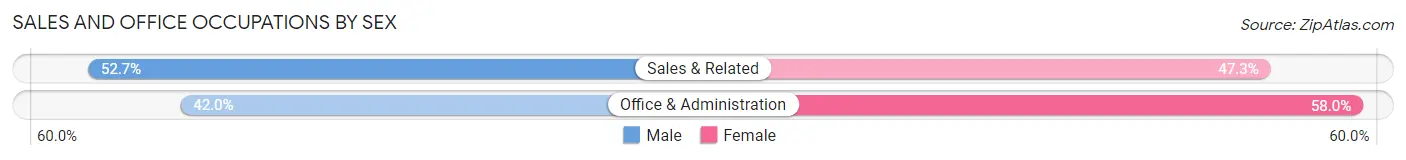
| Occupation | Male | Female |
| Sales & Related | 391 (52.7%) | 351 (47.3%) |
| Office & Administration | 527 (42.0%) | 727 (58.0%) |
| Total (Category) | 918 (46.0%) | 1,078 (54.0%) |
| Total (Overall) | 6,039 (56.4%) | 4,671 (43.6%) |
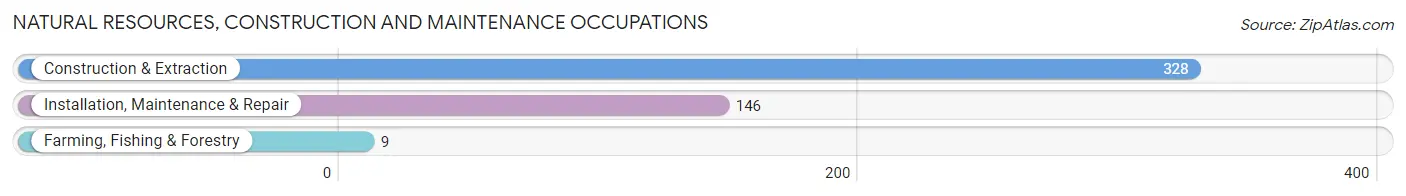
Natural Resources, Construction and Maintenance Occupations
The most common Natural Resources, Construction and Maintenance occupations in Norwood are Construction & Extraction (328 | 3.1%), Installation, Maintenance & Repair (146 | 1.4%), and Farming, Fishing & Forestry (9 | 0.1%).
Natural Resources, Construction and Maintenance Occupations by Sex
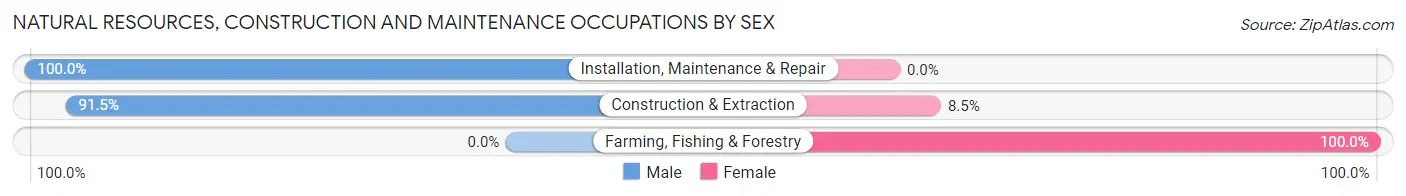
| Occupation | Male | Female |
| Farming, Fishing & Forestry | 0 (0.0%) | 9 (100.0%) |
| Construction & Extraction | 300 (91.5%) | 28 (8.5%) |
| Installation, Maintenance & Repair | 146 (100.0%) | 0 (0.0%) |
| Total (Category) | 446 (92.3%) | 37 (7.7%) |
| Total (Overall) | 6,039 (56.4%) | 4,671 (43.6%) |
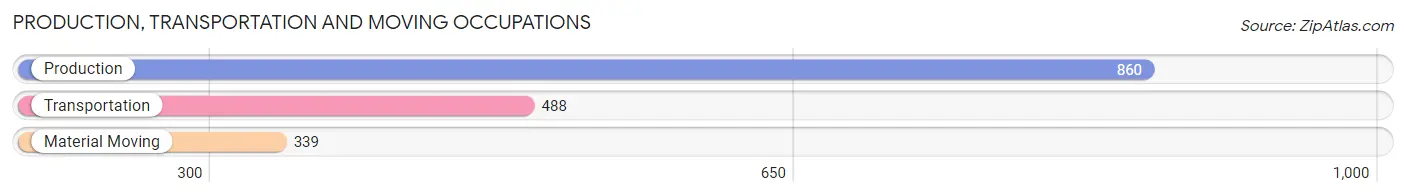
Production, Transportation and Moving Occupations
The most common Production, Transportation and Moving occupations in Norwood are Production (860 | 8.0%), Transportation (488 | 4.6%), and Material Moving (339 | 3.2%).
Production, Transportation and Moving Occupations by Sex
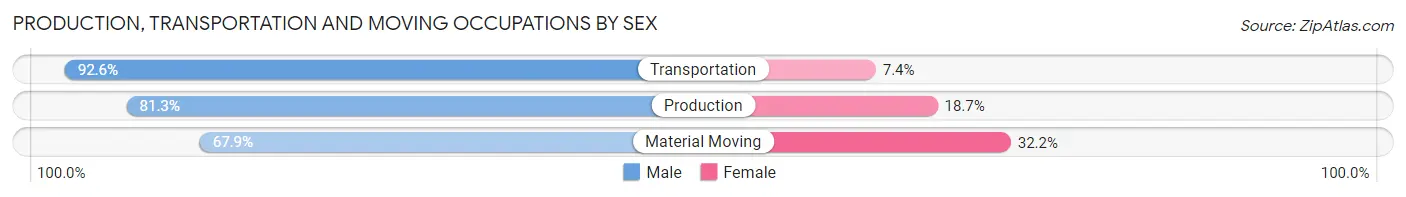
| Occupation | Male | Female |
| Production | 699 (81.3%) | 161 (18.7%) |
| Transportation | 452 (92.6%) | 36 (7.4%) |
| Material Moving | 230 (67.8%) | 109 (32.2%) |
| Total (Category) | 1,381 (81.9%) | 306 (18.1%) |
| Total (Overall) | 6,039 (56.4%) | 4,671 (43.6%) |
Employment Industries by Sex in Norwood
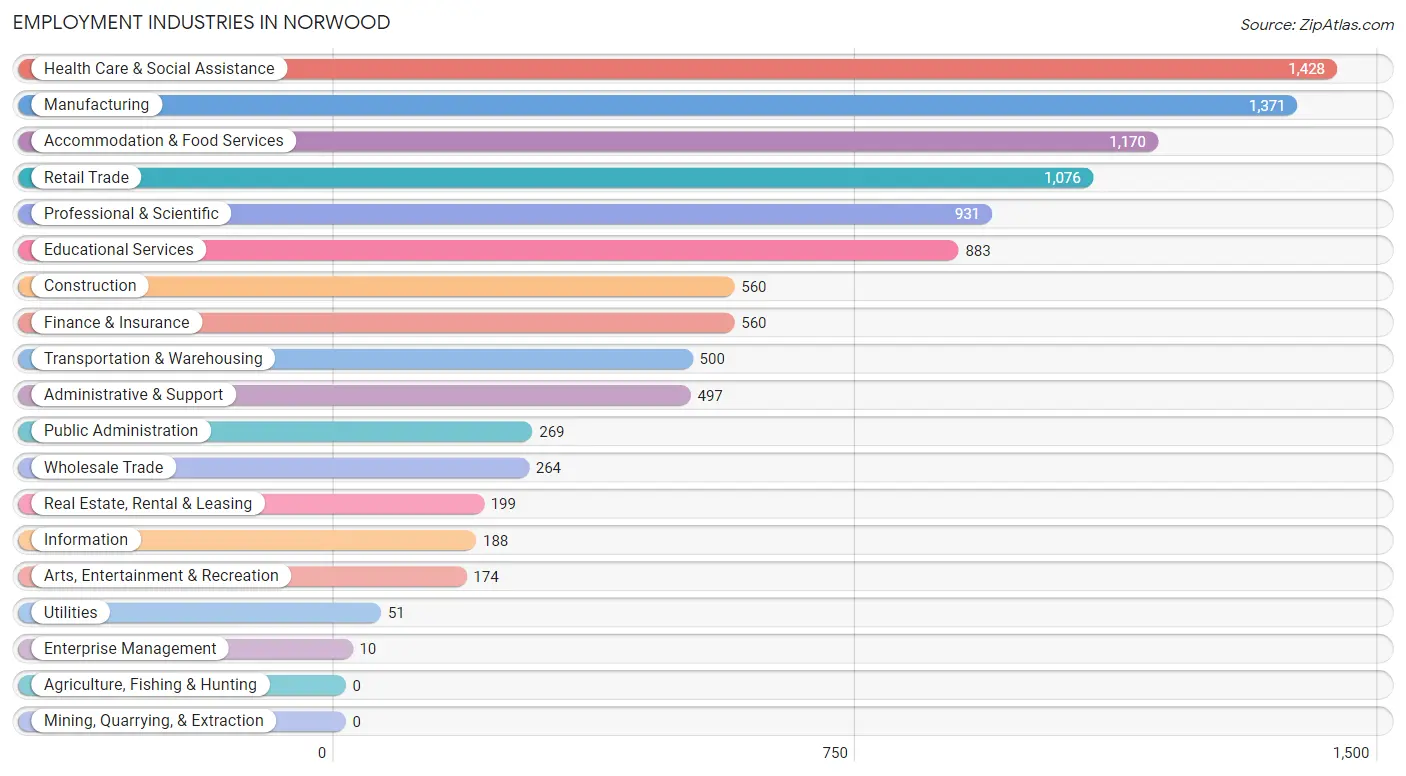
Employment Industries in Norwood
The major employment industries in Norwood include Health Care & Social Assistance (1,428 | 13.3%), Manufacturing (1,371 | 12.8%), Accommodation & Food Services (1,170 | 10.9%), Retail Trade (1,076 | 10.1%), and Professional & Scientific (931 | 8.7%).
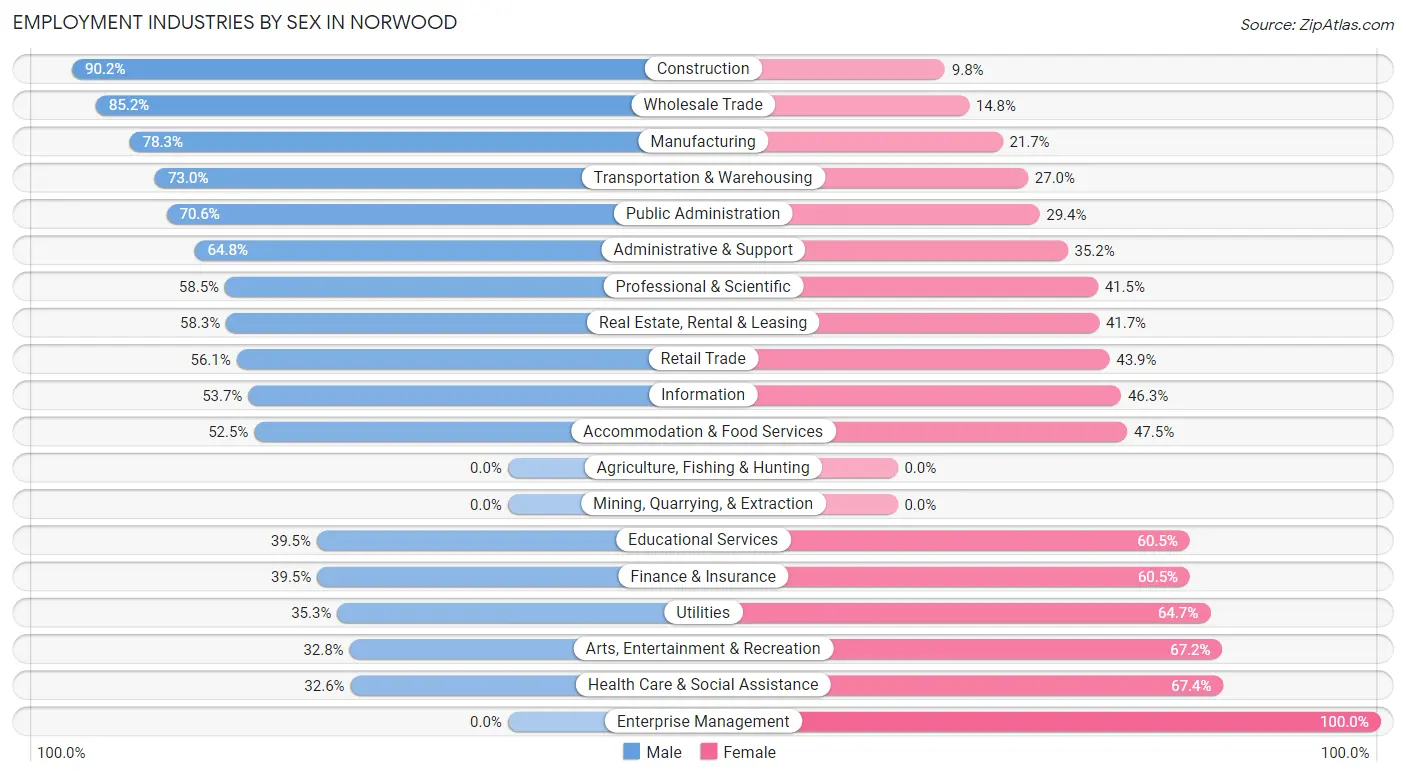
Employment Industries by Sex in Norwood
The Norwood industries that see more men than women are Construction (90.2%), Wholesale Trade (85.2%), and Manufacturing (78.3%), whereas the industries that tend to have a higher number of women are Enterprise Management (100.0%), Health Care & Social Assistance (67.4%), and Arts, Entertainment & Recreation (67.2%).
| Industry | Male | Female |
| Agriculture, Fishing & Hunting | 0 (0.0%) | 0 (0.0%) |
| Mining, Quarrying, & Extraction | 0 (0.0%) | 0 (0.0%) |
| Construction | 505 (90.2%) | 55 (9.8%) |
| Manufacturing | 1,073 (78.3%) | 298 (21.7%) |
| Wholesale Trade | 225 (85.2%) | 39 (14.8%) |
| Retail Trade | 604 (56.1%) | 472 (43.9%) |
| Transportation & Warehousing | 365 (73.0%) | 135 (27.0%) |
| Utilities | 18 (35.3%) | 33 (64.7%) |
| Information | 101 (53.7%) | 87 (46.3%) |
| Finance & Insurance | 221 (39.5%) | 339 (60.5%) |
| Real Estate, Rental & Leasing | 116 (58.3%) | 83 (41.7%) |
| Professional & Scientific | 545 (58.5%) | 386 (41.5%) |
| Enterprise Management | 0 (0.0%) | 10 (100.0%) |
| Administrative & Support | 322 (64.8%) | 175 (35.2%) |
| Educational Services | 349 (39.5%) | 534 (60.5%) |
| Health Care & Social Assistance | 465 (32.6%) | 963 (67.4%) |
| Arts, Entertainment & Recreation | 57 (32.8%) | 117 (67.2%) |
| Accommodation & Food Services | 614 (52.5%) | 556 (47.5%) |
| Public Administration | 190 (70.6%) | 79 (29.4%) |
| Total | 6,039 (56.4%) | 4,671 (43.6%) |
Education in Norwood
School Enrollment in Norwood
The most common levels of schooling among the 4,679 students in Norwood are college / undergraduate (1,798 | 38.4%), middle school (779 | 16.7%), and elementary school (643 | 13.7%).
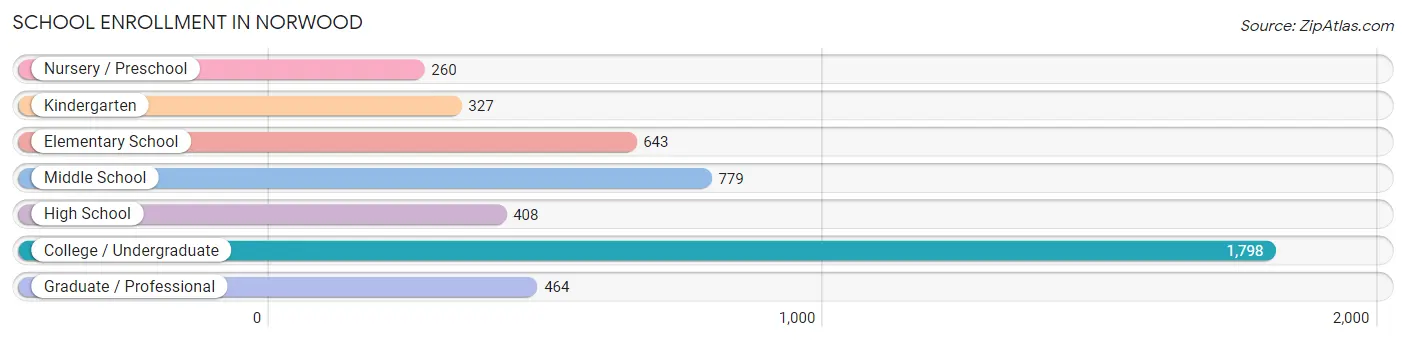
| School Level | # Students | % Students |
| Nursery / Preschool | 260 | 5.6% |
| Kindergarten | 327 | 7.0% |
| Elementary School | 643 | 13.7% |
| Middle School | 779 | 16.7% |
| High School | 408 | 8.7% |
| College / Undergraduate | 1,798 | 38.4% |
| Graduate / Professional | 464 | 9.9% |
| Total | 4,679 | 100.0% |
School Enrollment by Age by Funding Source in Norwood
Out of a total of 4,679 students who are enrolled in schools in Norwood, 1,932 (41.3%) attend a private institution, while the remaining 2,747 (58.7%) are enrolled in public schools. The age group of 18 to 19 year olds has the highest likelihood of being enrolled in private schools, with 112 (62.6% in the age bracket) enrolled. Conversely, the age group of 25 to 34 year olds has the lowest likelihood of being enrolled in a private school, with 421 (84.5% in the age bracket) attending a public institution.
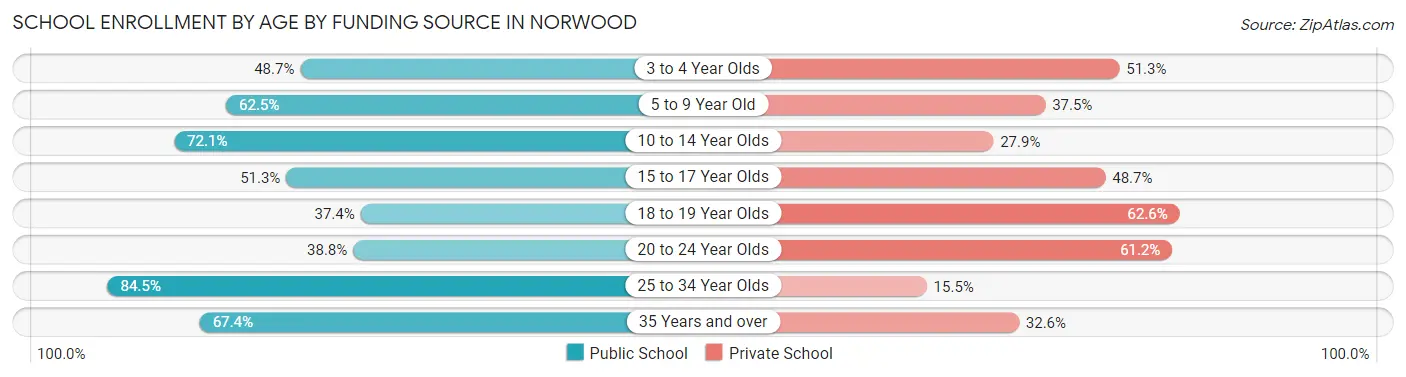
| Age Bracket | Public School | Private School |
| 3 to 4 Year Olds | 109 (48.7%) | 115 (51.3%) |
| 5 to 9 Year Old | 554 (62.5%) | 333 (37.5%) |
| 10 to 14 Year Olds | 725 (72.1%) | 280 (27.9%) |
| 15 to 17 Year Olds | 121 (51.3%) | 115 (48.7%) |
| 18 to 19 Year Olds | 67 (37.4%) | 112 (62.6%) |
| 20 to 24 Year Olds | 494 (38.8%) | 779 (61.2%) |
| 25 to 34 Year Olds | 421 (84.5%) | 77 (15.5%) |
| 35 Years and over | 254 (67.4%) | 123 (32.6%) |
| Total | 2,747 (58.7%) | 1,932 (41.3%) |
Educational Attainment by Field of Study in Norwood
Business (883 | 18.0%), education (466 | 9.5%), arts & humanities (416 | 8.5%), engineering (388 | 7.9%), and social sciences (377 | 7.7%) are the most common fields of study among 4,894 individuals in Norwood who have obtained a bachelor's degree or higher.
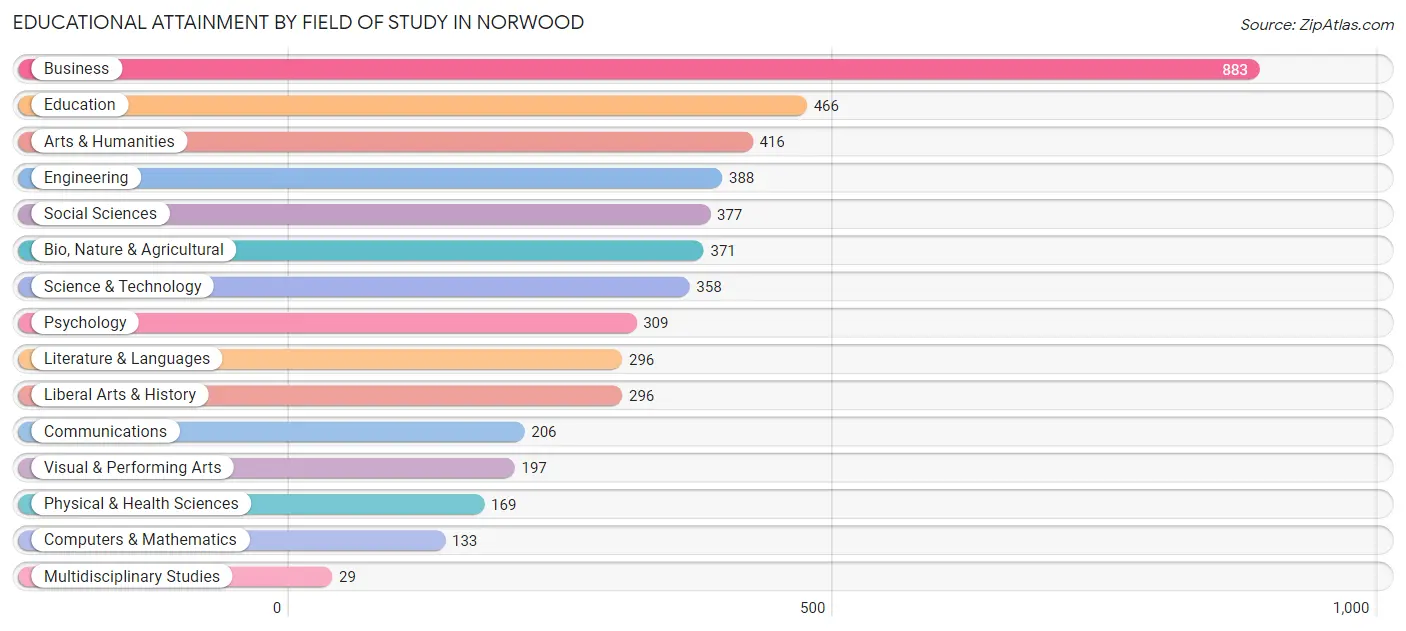
| Field of Study | # Graduates | % Graduates |
| Computers & Mathematics | 133 | 2.7% |
| Bio, Nature & Agricultural | 371 | 7.6% |
| Physical & Health Sciences | 169 | 3.5% |
| Psychology | 309 | 6.3% |
| Social Sciences | 377 | 7.7% |
| Engineering | 388 | 7.9% |
| Multidisciplinary Studies | 29 | 0.6% |
| Science & Technology | 358 | 7.3% |
| Business | 883 | 18.0% |
| Education | 466 | 9.5% |
| Literature & Languages | 296 | 6.0% |
| Liberal Arts & History | 296 | 6.0% |
| Visual & Performing Arts | 197 | 4.0% |
| Communications | 206 | 4.2% |
| Arts & Humanities | 416 | 8.5% |
| Total | 4,894 | 100.0% |
Transportation & Commute in Norwood
Vehicle Availability by Sex in Norwood
The most prevalent vehicle ownership categories in Norwood are males with 2 vehicles (2,229, accounting for 37.8%) and females with 2 vehicles (1,872, making up 48.7%).
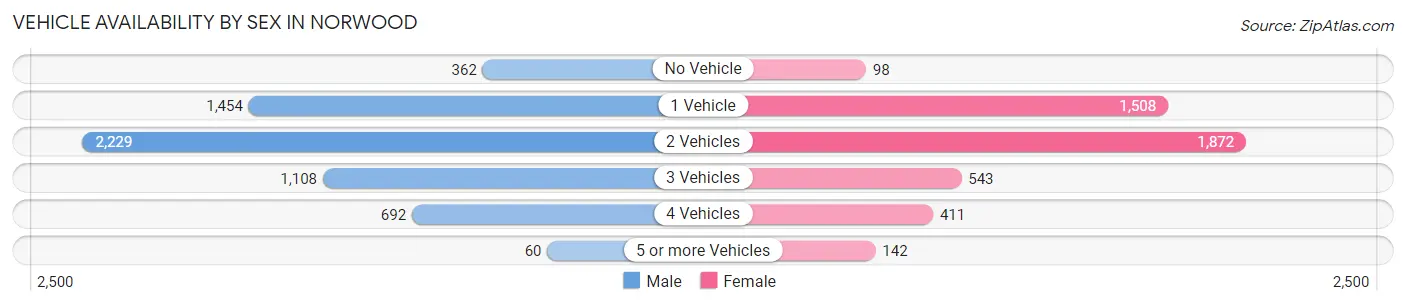
| Vehicles Available | Male | Female |
| No Vehicle | 362 (6.1%) | 98 (2.1%) |
| 1 Vehicle | 1,454 (24.6%) | 1,508 (33.0%) |
| 2 Vehicles | 2,229 (37.8%) | 1,872 (40.9%) |
| 3 Vehicles | 1,108 (18.8%) | 543 (11.9%) |
| 4 Vehicles | 692 (11.7%) | 411 (9.0%) |
| 5 or more Vehicles | 60 (1.0%) | 142 (3.1%) |
| Total | 5,905 (100.0%) | 4,574 (100.0%) |
Commute Time in Norwood
The most frequently occuring commute durations in Norwood are 10 to 14 minutes (1,858 commuters, 19.8%), 15 to 19 minutes (1,787 commuters, 19.1%), and 20 to 24 minutes (1,635 commuters, 17.4%).
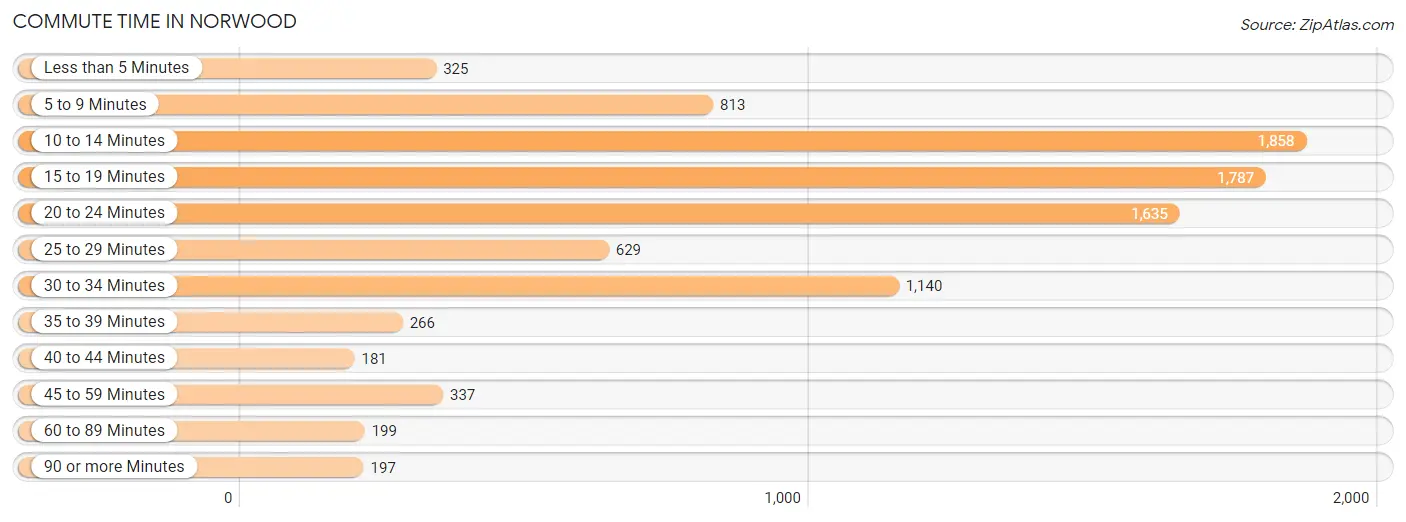
| Commute Time | # Commuters | % Commuters |
| Less than 5 Minutes | 325 | 3.5% |
| 5 to 9 Minutes | 813 | 8.7% |
| 10 to 14 Minutes | 1,858 | 19.8% |
| 15 to 19 Minutes | 1,787 | 19.1% |
| 20 to 24 Minutes | 1,635 | 17.4% |
| 25 to 29 Minutes | 629 | 6.7% |
| 30 to 34 Minutes | 1,140 | 12.2% |
| 35 to 39 Minutes | 266 | 2.8% |
| 40 to 44 Minutes | 181 | 1.9% |
| 45 to 59 Minutes | 337 | 3.6% |
| 60 to 89 Minutes | 199 | 2.1% |
| 90 or more Minutes | 197 | 2.1% |
Commute Time by Sex in Norwood
The most common commute times in Norwood are 15 to 19 minutes (1,107 commuters, 20.5%) for males and 10 to 14 minutes (913 commuters, 23.0%) for females.
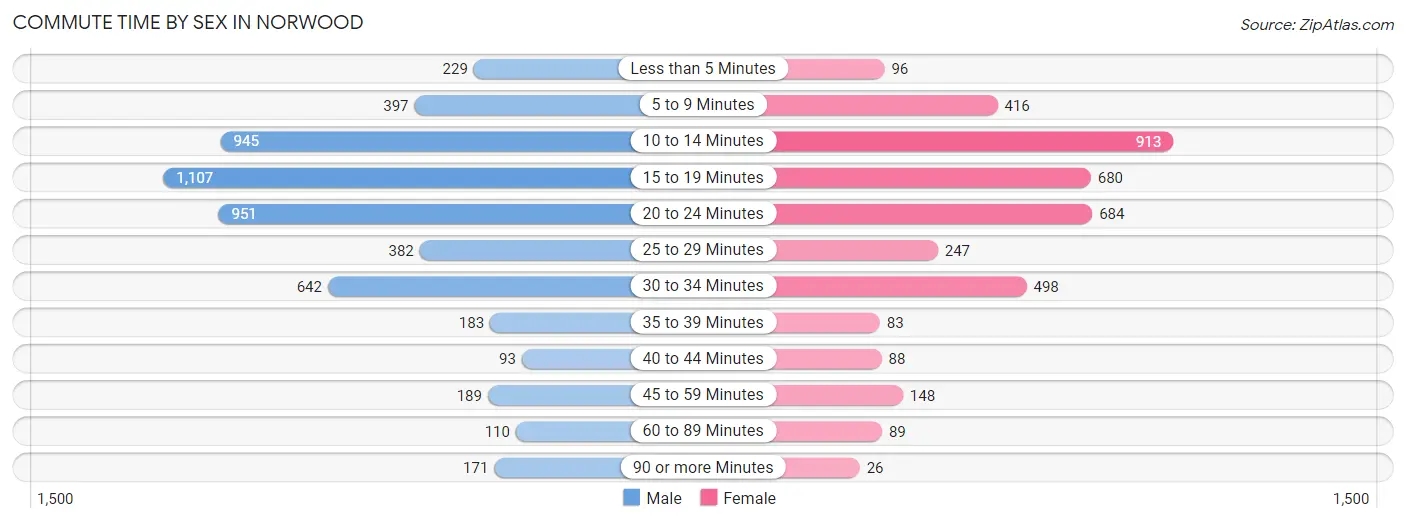
| Commute Time | Male | Female |
| Less than 5 Minutes | 229 (4.2%) | 96 (2.4%) |
| 5 to 9 Minutes | 397 (7.3%) | 416 (10.5%) |
| 10 to 14 Minutes | 945 (17.5%) | 913 (23.0%) |
| 15 to 19 Minutes | 1,107 (20.5%) | 680 (17.1%) |
| 20 to 24 Minutes | 951 (17.6%) | 684 (17.2%) |
| 25 to 29 Minutes | 382 (7.1%) | 247 (6.2%) |
| 30 to 34 Minutes | 642 (11.9%) | 498 (12.6%) |
| 35 to 39 Minutes | 183 (3.4%) | 83 (2.1%) |
| 40 to 44 Minutes | 93 (1.7%) | 88 (2.2%) |
| 45 to 59 Minutes | 189 (3.5%) | 148 (3.7%) |
| 60 to 89 Minutes | 110 (2.0%) | 89 (2.2%) |
| 90 or more Minutes | 171 (3.2%) | 26 (0.7%) |
Time of Departure to Work by Sex in Norwood
The most frequent times of departure to work in Norwood are 7:00 AM to 7:29 AM (987, 18.3%) for males and 7:00 AM to 7:29 AM (644, 16.2%) for females.
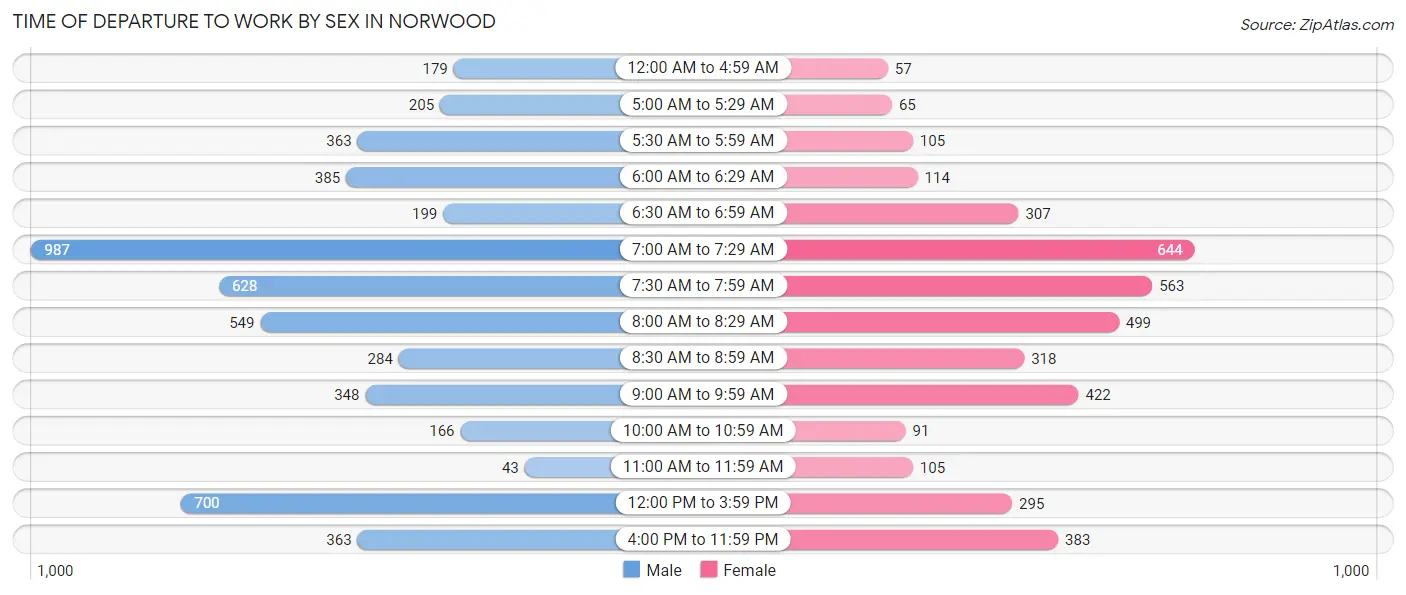
| Time of Departure | Male | Female |
| 12:00 AM to 4:59 AM | 179 (3.3%) | 57 (1.4%) |
| 5:00 AM to 5:29 AM | 205 (3.8%) | 65 (1.6%) |
| 5:30 AM to 5:59 AM | 363 (6.7%) | 105 (2.6%) |
| 6:00 AM to 6:29 AM | 385 (7.1%) | 114 (2.9%) |
| 6:30 AM to 6:59 AM | 199 (3.7%) | 307 (7.7%) |
| 7:00 AM to 7:29 AM | 987 (18.3%) | 644 (16.2%) |
| 7:30 AM to 7:59 AM | 628 (11.6%) | 563 (14.2%) |
| 8:00 AM to 8:29 AM | 549 (10.2%) | 499 (12.6%) |
| 8:30 AM to 8:59 AM | 284 (5.3%) | 318 (8.0%) |
| 9:00 AM to 9:59 AM | 348 (6.5%) | 422 (10.6%) |
| 10:00 AM to 10:59 AM | 166 (3.1%) | 91 (2.3%) |
| 11:00 AM to 11:59 AM | 43 (0.8%) | 105 (2.6%) |
| 12:00 PM to 3:59 PM | 700 (13.0%) | 295 (7.4%) |
| 4:00 PM to 11:59 PM | 363 (6.7%) | 383 (9.7%) |
| Total | 5,399 (100.0%) | 3,968 (100.0%) |
Housing Occupancy in Norwood
Occupancy by Ownership in Norwood
Of the total 8,638 dwellings in Norwood, owner-occupied units account for 4,007 (46.4%), while renter-occupied units make up 4,631 (53.6%).
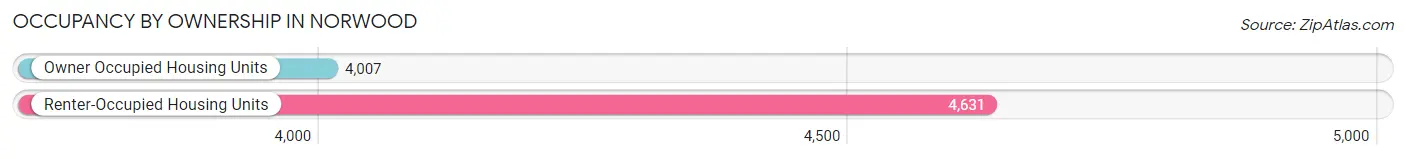
| Occupancy | # Housing Units | % Housing Units |
| Owner Occupied Housing Units | 4,007 | 46.4% |
| Renter-Occupied Housing Units | 4,631 | 53.6% |
| Total Occupied Housing Units | 8,638 | 100.0% |
Occupancy by Household Size in Norwood
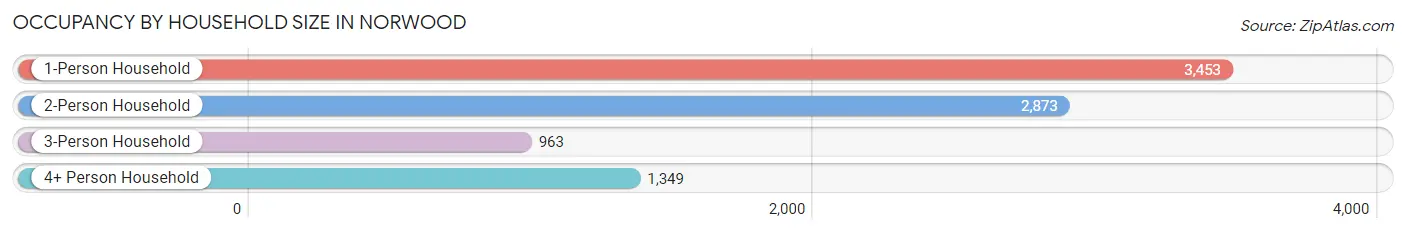
| Household Size | # Housing Units | % Housing Units |
| 1-Person Household | 3,453 | 40.0% |
| 2-Person Household | 2,873 | 33.3% |
| 3-Person Household | 963 | 11.2% |
| 4+ Person Household | 1,349 | 15.6% |
| Total Housing Units | 8,638 | 100.0% |
Occupancy by Ownership by Household Size in Norwood
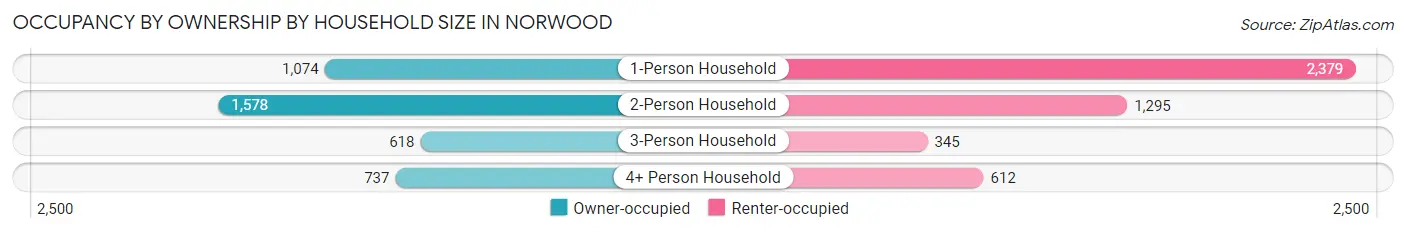
| Household Size | Owner-occupied | Renter-occupied |
| 1-Person Household | 1,074 (31.1%) | 2,379 (68.9%) |
| 2-Person Household | 1,578 (54.9%) | 1,295 (45.1%) |
| 3-Person Household | 618 (64.2%) | 345 (35.8%) |
| 4+ Person Household | 737 (54.6%) | 612 (45.4%) |
| Total Housing Units | 4,007 (46.4%) | 4,631 (53.6%) |
Occupancy by Educational Attainment in Norwood
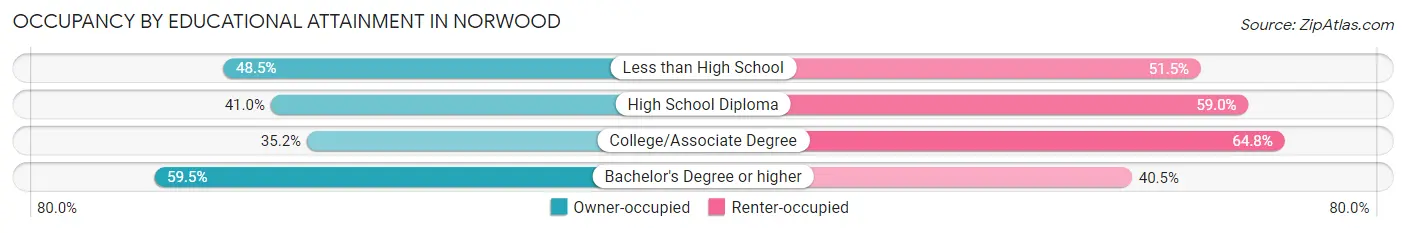
| Household Size | Owner-occupied | Renter-occupied |
| Less than High School | 307 (48.5%) | 326 (51.5%) |
| High School Diploma | 1,054 (41.0%) | 1,519 (59.0%) |
| College/Associate Degree | 848 (35.2%) | 1,560 (64.8%) |
| Bachelor's Degree or higher | 1,798 (59.5%) | 1,226 (40.5%) |
Occupancy by Age of Householder in Norwood
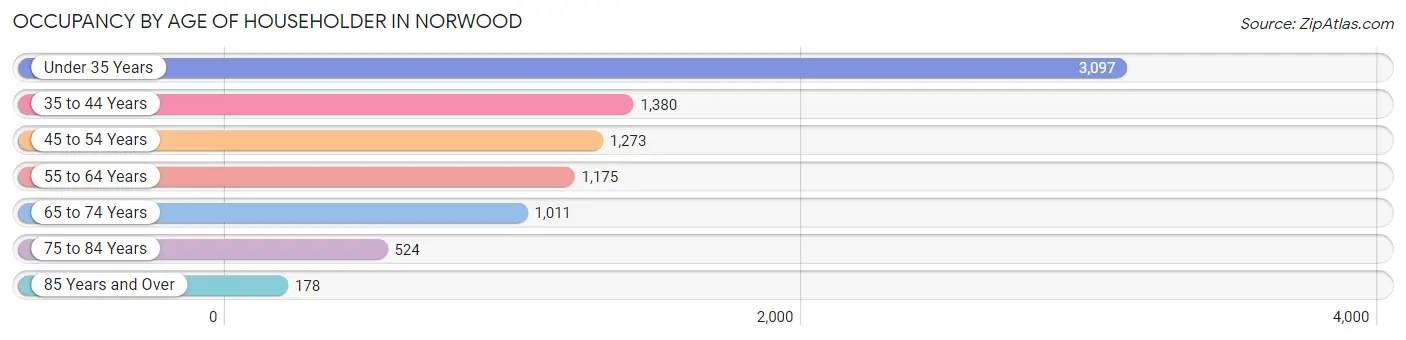
| Age Bracket | # Households | % Households |
| Under 35 Years | 3,097 | 35.8% |
| 35 to 44 Years | 1,380 | 16.0% |
| 45 to 54 Years | 1,273 | 14.7% |
| 55 to 64 Years | 1,175 | 13.6% |
| 65 to 74 Years | 1,011 | 11.7% |
| 75 to 84 Years | 524 | 6.1% |
| 85 Years and Over | 178 | 2.1% |
| Total | 8,638 | 100.0% |
Housing Finances in Norwood
Median Income by Occupancy in Norwood
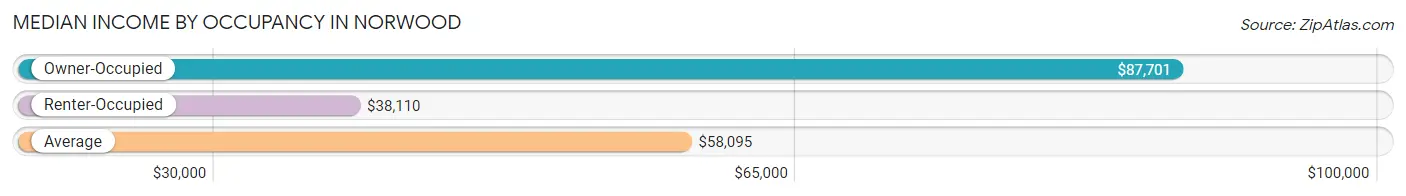
| Occupancy Type | # Households | Median Income |
| Owner-Occupied | 4,007 (46.4%) | $87,701 |
| Renter-Occupied | 4,631 (53.6%) | $38,110 |
| Average | 8,638 (100.0%) | $58,095 |
Occupancy by Householder Income Bracket in Norwood
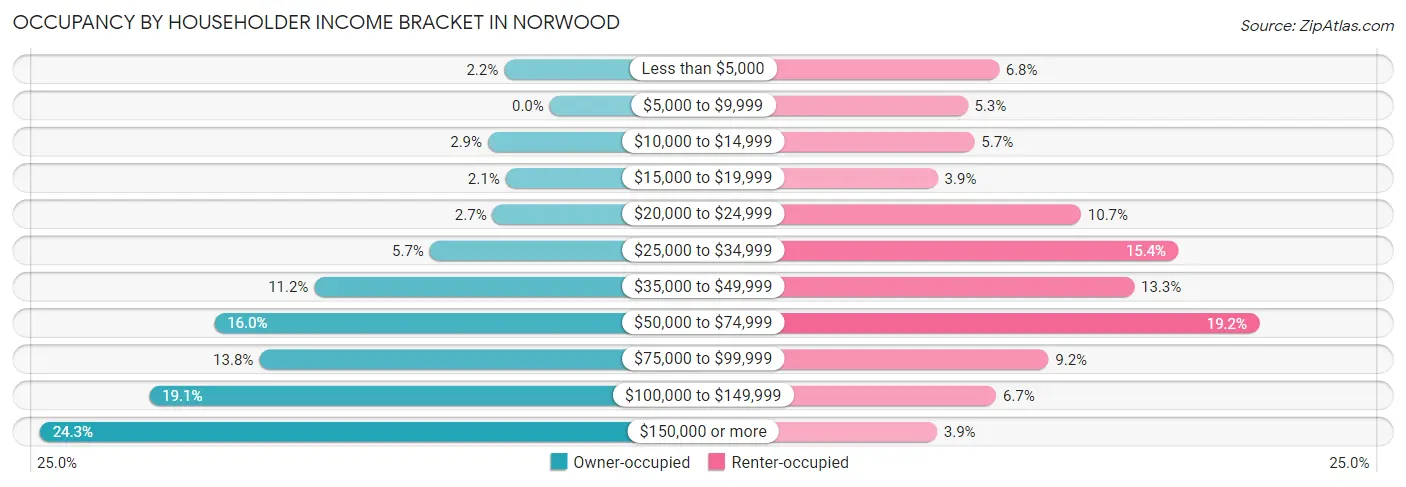
| Income Bracket | Owner-occupied | Renter-occupied |
| Less than $5,000 | 87 (2.2%) | 316 (6.8%) |
| $5,000 to $9,999 | 0 (0.0%) | 247 (5.3%) |
| $10,000 to $14,999 | 118 (2.9%) | 262 (5.7%) |
| $15,000 to $19,999 | 84 (2.1%) | 181 (3.9%) |
| $20,000 to $24,999 | 109 (2.7%) | 497 (10.7%) |
| $25,000 to $34,999 | 229 (5.7%) | 711 (15.3%) |
| $35,000 to $49,999 | 449 (11.2%) | 614 (13.3%) |
| $50,000 to $74,999 | 640 (16.0%) | 889 (19.2%) |
| $75,000 to $99,999 | 554 (13.8%) | 425 (9.2%) |
| $100,000 to $149,999 | 764 (19.1%) | 310 (6.7%) |
| $150,000 or more | 973 (24.3%) | 179 (3.9%) |
| Total | 4,007 (100.0%) | 4,631 (100.0%) |
Monthly Housing Cost Tiers in Norwood
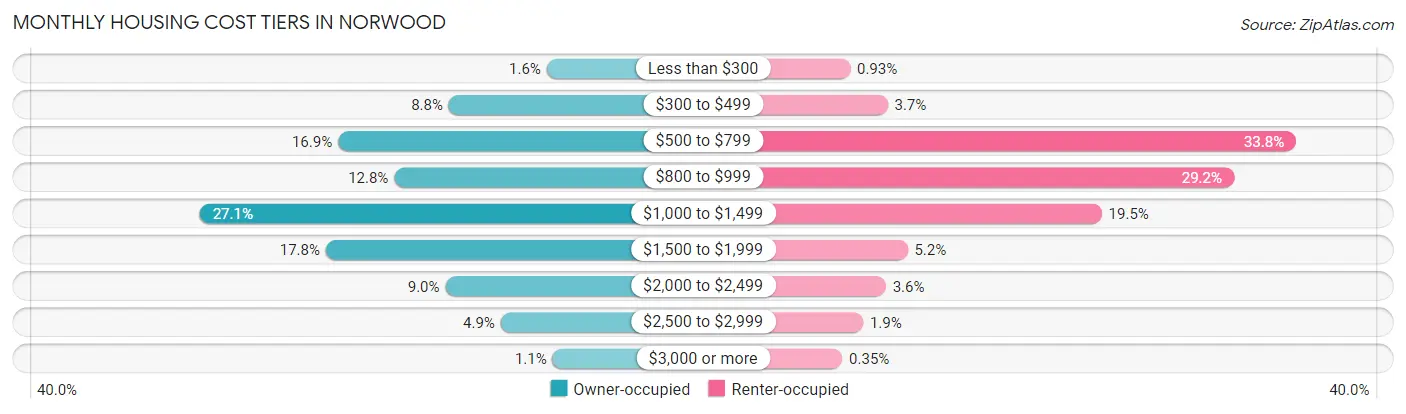
| Monthly Cost | Owner-occupied | Renter-occupied |
| Less than $300 | 62 (1.5%) | 43 (0.9%) |
| $300 to $499 | 351 (8.8%) | 171 (3.7%) |
| $500 to $799 | 678 (16.9%) | 1,564 (33.8%) |
| $800 to $999 | 512 (12.8%) | 1,352 (29.2%) |
| $1,000 to $1,499 | 1,086 (27.1%) | 901 (19.5%) |
| $1,500 to $1,999 | 714 (17.8%) | 239 (5.2%) |
| $2,000 to $2,499 | 361 (9.0%) | 165 (3.6%) |
| $2,500 to $2,999 | 198 (4.9%) | 87 (1.9%) |
| $3,000 or more | 45 (1.1%) | 16 (0.4%) |
| Total | 4,007 (100.0%) | 4,631 (100.0%) |
Physical Housing Characteristics in Norwood
Housing Structures in Norwood
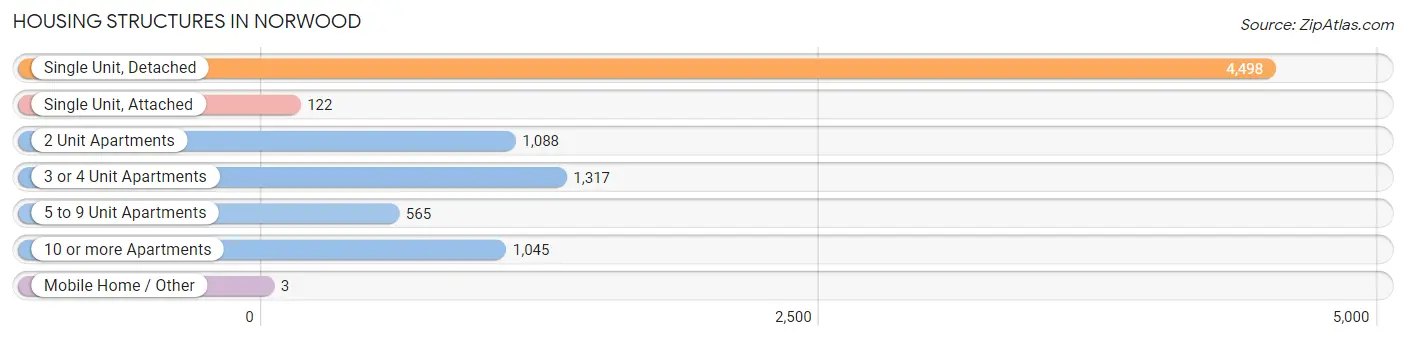
| Structure Type | # Housing Units | % Housing Units |
| Single Unit, Detached | 4,498 | 52.1% |
| Single Unit, Attached | 122 | 1.4% |
| 2 Unit Apartments | 1,088 | 12.6% |
| 3 or 4 Unit Apartments | 1,317 | 15.2% |
| 5 to 9 Unit Apartments | 565 | 6.5% |
| 10 or more Apartments | 1,045 | 12.1% |
| Mobile Home / Other | 3 | 0.0% |
| Total | 8,638 | 100.0% |
Housing Structures by Occupancy in Norwood
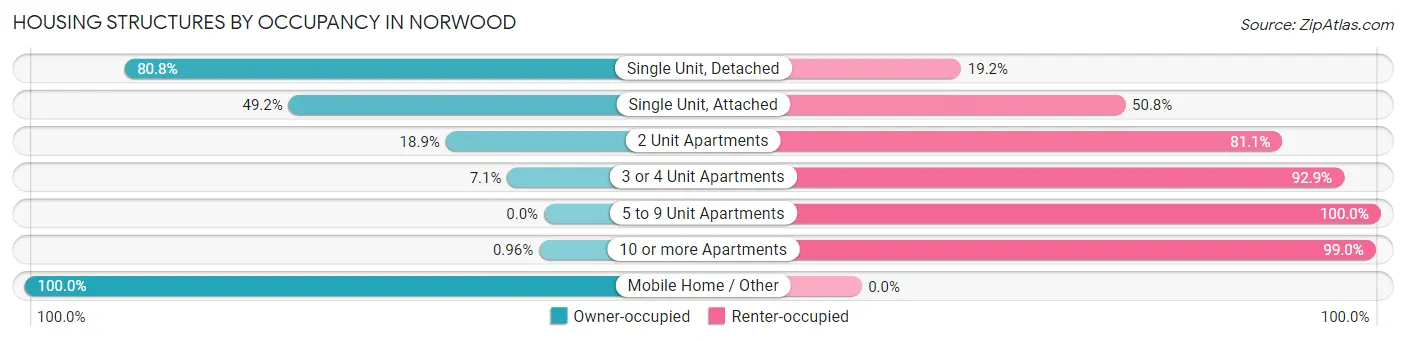
| Structure Type | Owner-occupied | Renter-occupied |
| Single Unit, Detached | 3,635 (80.8%) | 863 (19.2%) |
| Single Unit, Attached | 60 (49.2%) | 62 (50.8%) |
| 2 Unit Apartments | 206 (18.9%) | 882 (81.1%) |
| 3 or 4 Unit Apartments | 93 (7.1%) | 1,224 (92.9%) |
| 5 to 9 Unit Apartments | 0 (0.0%) | 565 (100.0%) |
| 10 or more Apartments | 10 (1.0%) | 1,035 (99.0%) |
| Mobile Home / Other | 3 (100.0%) | 0 (0.0%) |
| Total | 4,007 (46.4%) | 4,631 (53.6%) |
Housing Structures by Number of Rooms in Norwood
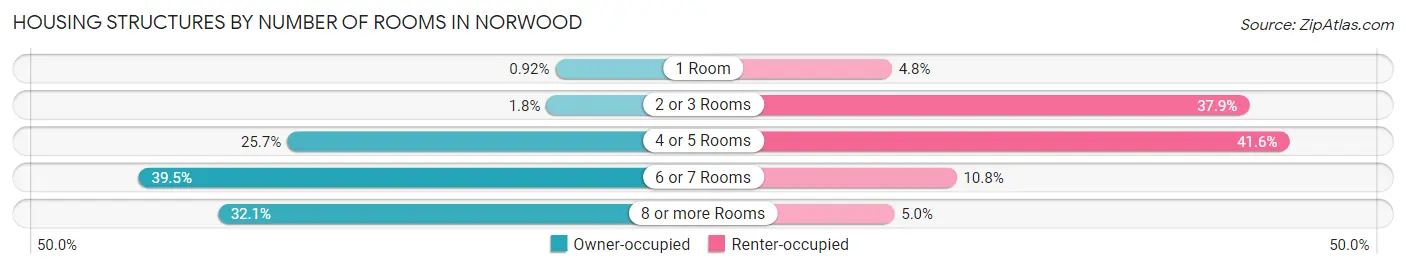
| Number of Rooms | Owner-occupied | Renter-occupied |
| 1 Room | 37 (0.9%) | 222 (4.8%) |
| 2 or 3 Rooms | 70 (1.8%) | 1,753 (37.9%) |
| 4 or 5 Rooms | 1,031 (25.7%) | 1,924 (41.5%) |
| 6 or 7 Rooms | 1,581 (39.5%) | 499 (10.8%) |
| 8 or more Rooms | 1,288 (32.1%) | 233 (5.0%) |
| Total | 4,007 (100.0%) | 4,631 (100.0%) |
Housing Structure by Heating Type in Norwood
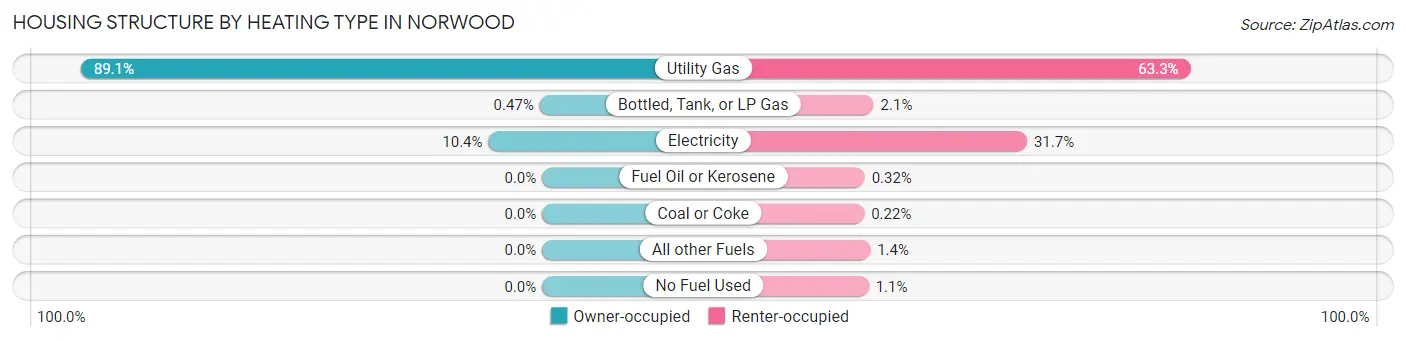
| Heating Type | Owner-occupied | Renter-occupied |
| Utility Gas | 3,572 (89.1%) | 2,929 (63.2%) |
| Bottled, Tank, or LP Gas | 19 (0.5%) | 95 (2.1%) |
| Electricity | 416 (10.4%) | 1,467 (31.7%) |
| Fuel Oil or Kerosene | 0 (0.0%) | 15 (0.3%) |
| Coal or Coke | 0 (0.0%) | 10 (0.2%) |
| All other Fuels | 0 (0.0%) | 64 (1.4%) |
| No Fuel Used | 0 (0.0%) | 51 (1.1%) |
| Total | 4,007 (100.0%) | 4,631 (100.0%) |
Household Vehicle Usage in Norwood
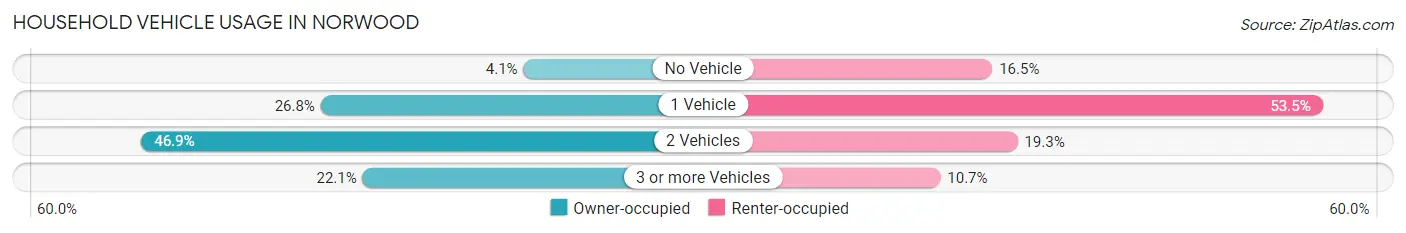
| Vehicles per Household | Owner-occupied | Renter-occupied |
| No Vehicle | 165 (4.1%) | 764 (16.5%) |
| 1 Vehicle | 1,075 (26.8%) | 2,477 (53.5%) |
| 2 Vehicles | 1,880 (46.9%) | 895 (19.3%) |
| 3 or more Vehicles | 887 (22.1%) | 495 (10.7%) |
| Total | 4,007 (100.0%) | 4,631 (100.0%) |
Real Estate & Mortgages in Norwood
Real Estate and Mortgage Overview in Norwood
| Characteristic | Without Mortgage | With Mortgage |
| Housing Units | 1,177 | 2,830 |
| Median Property Value | $163,400 | $219,600 |
| Median Household Income | $49,708 | $879 |
| Monthly Housing Costs | $570 | $45 |
| Real Estate Taxes | $2,413 | $88 |
Property Value by Mortgage Status in Norwood
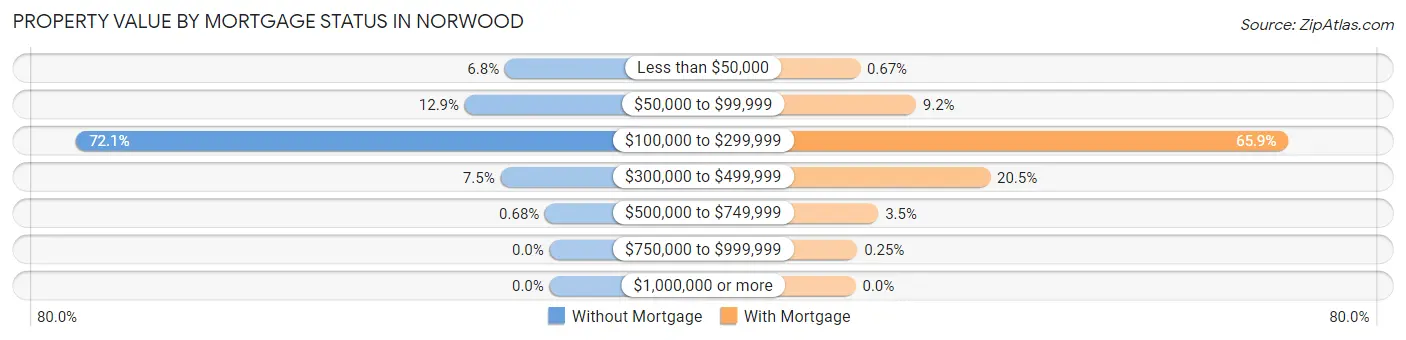
| Property Value | Without Mortgage | With Mortgage |
| Less than $50,000 | 80 (6.8%) | 19 (0.7%) |
| $50,000 to $99,999 | 152 (12.9%) | 260 (9.2%) |
| $100,000 to $299,999 | 849 (72.1%) | 1,866 (65.9%) |
| $300,000 to $499,999 | 88 (7.5%) | 580 (20.5%) |
| $500,000 to $749,999 | 8 (0.7%) | 98 (3.5%) |
| $750,000 to $999,999 | 0 (0.0%) | 7 (0.3%) |
| $1,000,000 or more | 0 (0.0%) | 0 (0.0%) |
| Total | 1,177 (100.0%) | 2,830 (100.0%) |
Household Income by Mortgage Status in Norwood
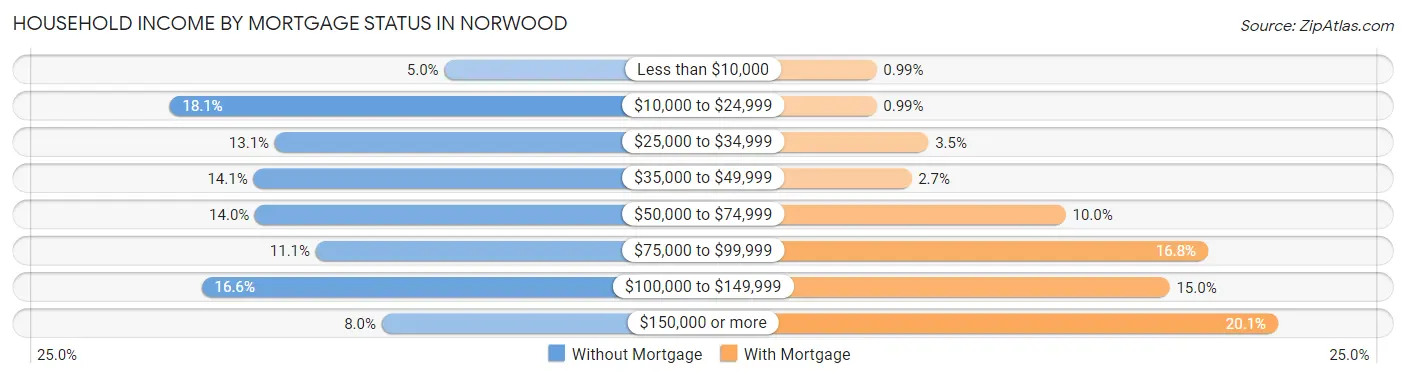
| Household Income | Without Mortgage | With Mortgage |
| Less than $10,000 | 59 (5.0%) | 28 (1.0%) |
| $10,000 to $24,999 | 213 (18.1%) | 28 (1.0%) |
| $25,000 to $34,999 | 154 (13.1%) | 98 (3.5%) |
| $35,000 to $49,999 | 166 (14.1%) | 75 (2.6%) |
| $50,000 to $74,999 | 165 (14.0%) | 283 (10.0%) |
| $75,000 to $99,999 | 131 (11.1%) | 475 (16.8%) |
| $100,000 to $149,999 | 195 (16.6%) | 423 (14.9%) |
| $150,000 or more | 94 (8.0%) | 569 (20.1%) |
| Total | 1,177 (100.0%) | 2,830 (100.0%) |
Property Value to Household Income Ratio in Norwood
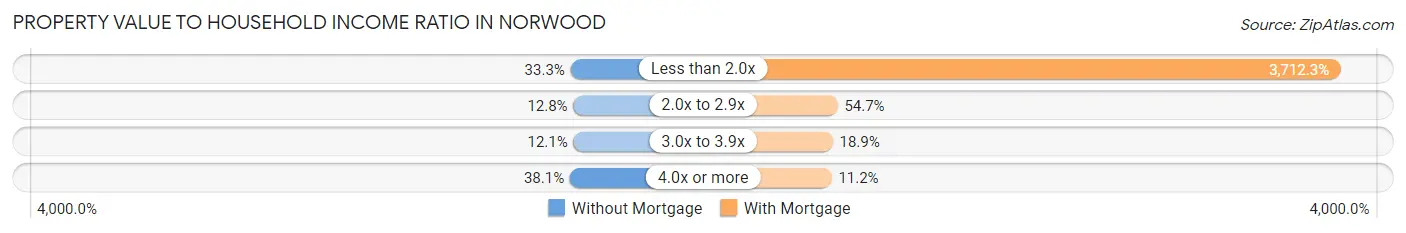
| Value-to-Income Ratio | Without Mortgage | With Mortgage |
| Less than 2.0x | 392 (33.3%) | 105,057 (3,712.3%) |
| 2.0x to 2.9x | 151 (12.8%) | 1,549 (54.7%) |
| 3.0x to 3.9x | 142 (12.1%) | 534 (18.9%) |
| 4.0x or more | 448 (38.1%) | 317 (11.2%) |
| Total | 1,177 (100.0%) | 2,830 (100.0%) |
Real Estate Taxes by Mortgage Status in Norwood
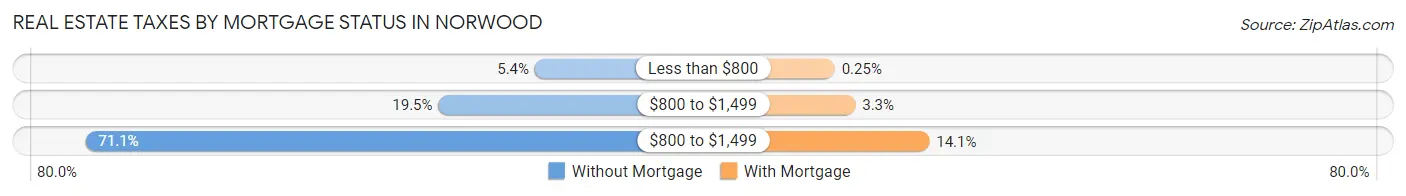
| Property Taxes | Without Mortgage | With Mortgage |
| Less than $800 | 64 (5.4%) | 7 (0.3%) |
| $800 to $1,499 | 230 (19.5%) | 92 (3.3%) |
| $800 to $1,499 | 837 (71.1%) | 398 (14.1%) |
| Total | 1,177 (100.0%) | 2,830 (100.0%) |
Health & Disability in Norwood
Health Insurance Coverage by Age in Norwood
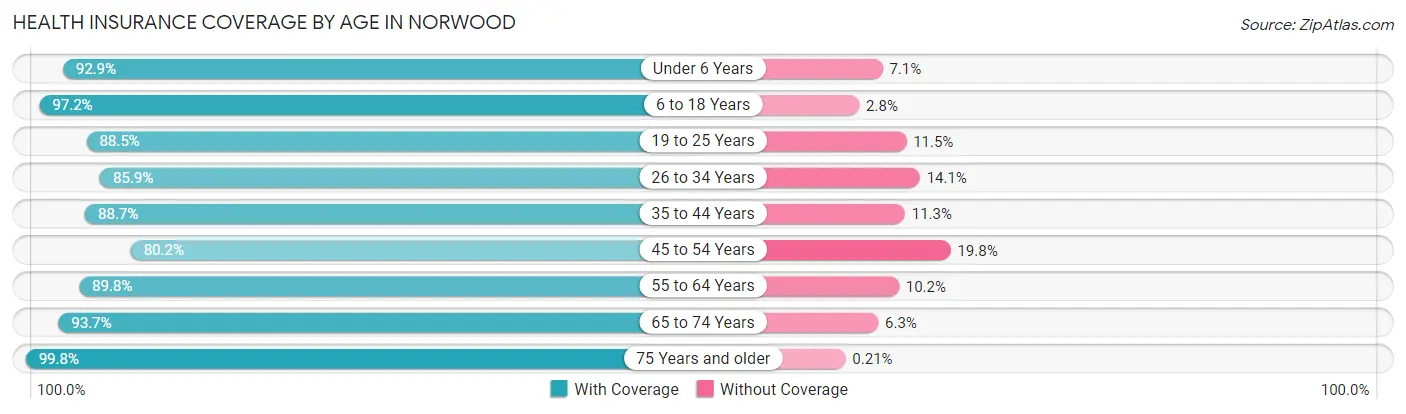
| Age Bracket | With Coverage | Without Coverage |
| Under 6 Years | 1,250 (92.9%) | 96 (7.1%) |
| 6 to 18 Years | 1,895 (97.2%) | 54 (2.8%) |
| 19 to 25 Years | 2,722 (88.5%) | 355 (11.5%) |
| 26 to 34 Years | 3,112 (85.9%) | 509 (14.1%) |
| 35 to 44 Years | 2,248 (88.7%) | 286 (11.3%) |
| 45 to 54 Years | 1,677 (80.2%) | 414 (19.8%) |
| 55 to 64 Years | 1,688 (89.8%) | 191 (10.2%) |
| 65 to 74 Years | 1,324 (93.7%) | 89 (6.3%) |
| 75 Years and older | 934 (99.8%) | 2 (0.2%) |
| Total | 16,850 (89.4%) | 1,996 (10.6%) |
Health Insurance Coverage by Citizenship Status in Norwood
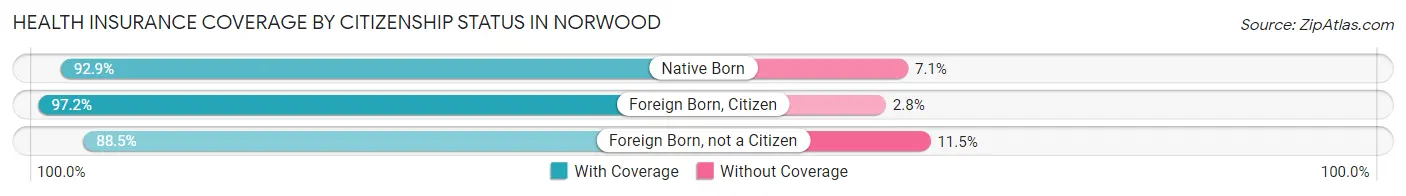
| Citizenship Status | With Coverage | Without Coverage |
| Native Born | 1,250 (92.9%) | 96 (7.1%) |
| Foreign Born, Citizen | 1,895 (97.2%) | 54 (2.8%) |
| Foreign Born, not a Citizen | 2,722 (88.5%) | 355 (11.5%) |
Health Insurance Coverage by Household Income in Norwood
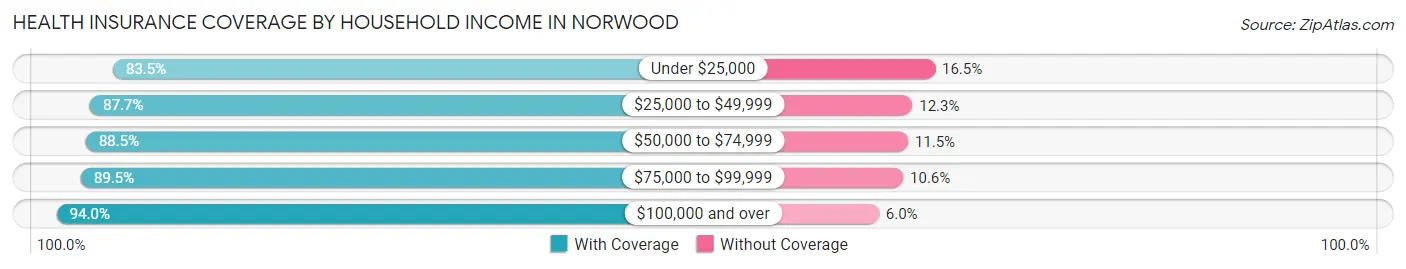
| Household Income | With Coverage | Without Coverage |
| Under $25,000 | 2,677 (83.5%) | 530 (16.5%) |
| $25,000 to $49,999 | 3,046 (87.7%) | 426 (12.3%) |
| $50,000 to $74,999 | 3,058 (88.5%) | 396 (11.5%) |
| $75,000 to $99,999 | 2,052 (89.4%) | 242 (10.5%) |
| $100,000 and over | 5,939 (94.0%) | 379 (6.0%) |
Public vs Private Health Insurance Coverage by Age in Norwood
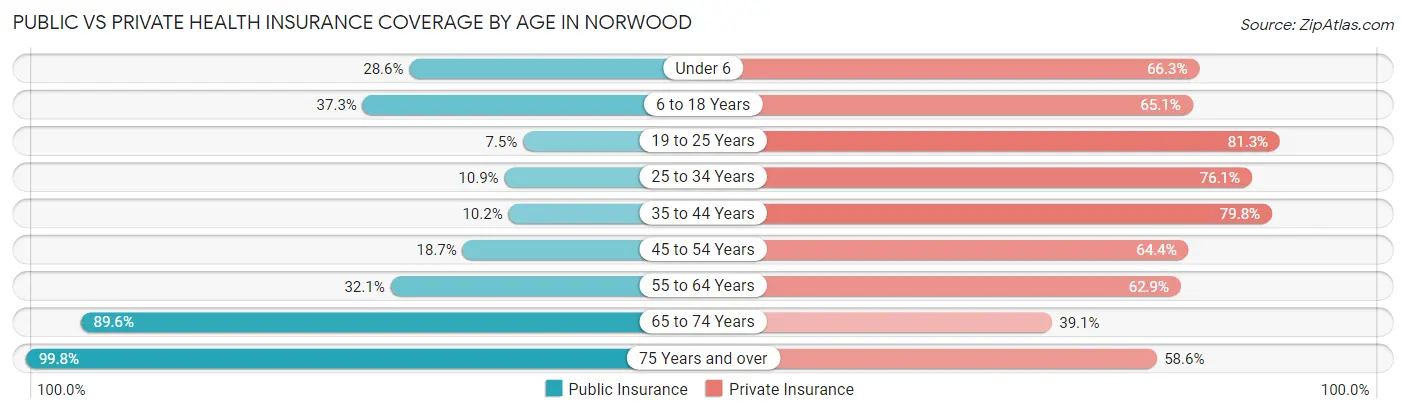
| Age Bracket | Public Insurance | Private Insurance |
| Under 6 | 385 (28.6%) | 893 (66.3%) |
| 6 to 18 Years | 726 (37.2%) | 1,269 (65.1%) |
| 19 to 25 Years | 230 (7.5%) | 2,502 (81.3%) |
| 25 to 34 Years | 396 (10.9%) | 2,756 (76.1%) |
| 35 to 44 Years | 258 (10.2%) | 2,023 (79.8%) |
| 45 to 54 Years | 391 (18.7%) | 1,346 (64.4%) |
| 55 to 64 Years | 603 (32.1%) | 1,182 (62.9%) |
| 65 to 74 Years | 1,266 (89.6%) | 552 (39.1%) |
| 75 Years and over | 934 (99.8%) | 548 (58.6%) |
| Total | 5,189 (27.5%) | 13,071 (69.4%) |
Disability Status by Sex by Age in Norwood
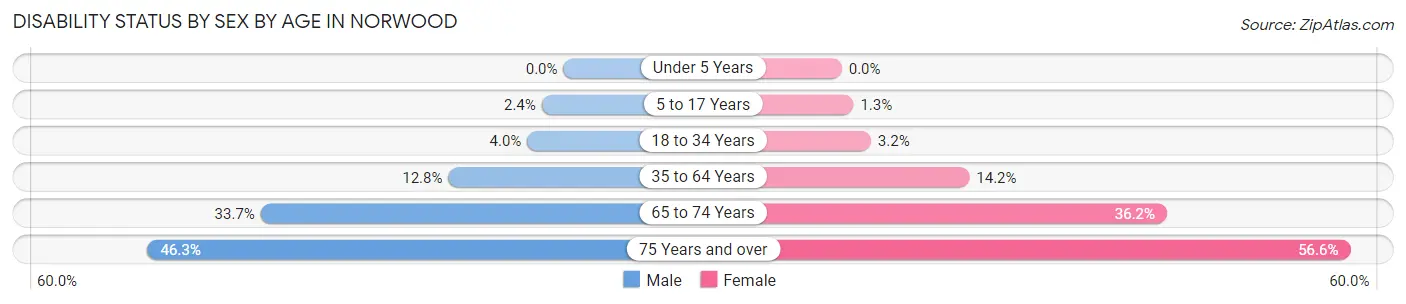
| Age Bracket | Male | Female |
| Under 5 Years | 0 (0.0%) | 0 (0.0%) |
| 5 to 17 Years | 25 (2.4%) | 15 (1.3%) |
| 18 to 34 Years | 149 (4.0%) | 99 (3.2%) |
| 35 to 64 Years | 468 (12.8%) | 405 (14.2%) |
| 65 to 74 Years | 210 (33.7%) | 286 (36.2%) |
| 75 Years and over | 157 (46.3%) | 338 (56.6%) |
Disability Class by Sex by Age in Norwood
Disability Class: Hearing Difficulty
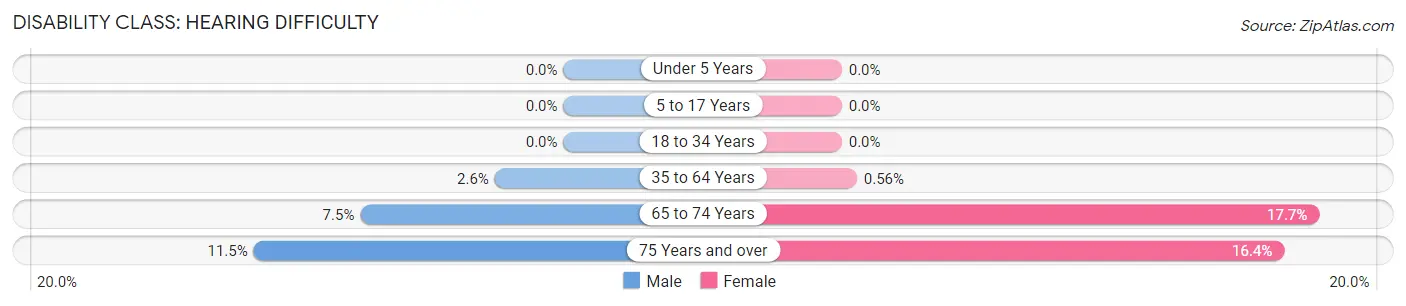
| Age Bracket | Male | Female |
| Under 5 Years | 0 (0.0%) | 0 (0.0%) |
| 5 to 17 Years | 0 (0.0%) | 0 (0.0%) |
| 18 to 34 Years | 0 (0.0%) | 0 (0.0%) |
| 35 to 64 Years | 93 (2.5%) | 16 (0.6%) |
| 65 to 74 Years | 47 (7.5%) | 140 (17.7%) |
| 75 Years and over | 39 (11.5%) | 98 (16.4%) |
Disability Class: Vision Difficulty
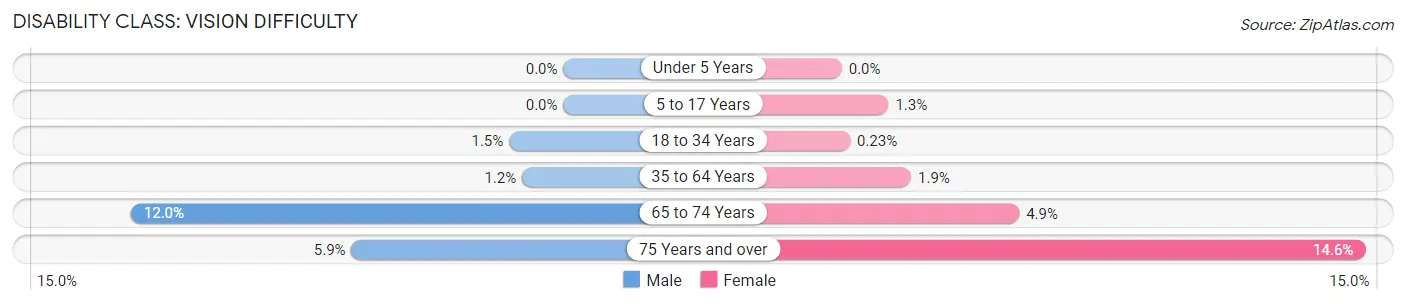
| Age Bracket | Male | Female |
| Under 5 Years | 0 (0.0%) | 0 (0.0%) |
| 5 to 17 Years | 0 (0.0%) | 15 (1.3%) |
| 18 to 34 Years | 56 (1.5%) | 7 (0.2%) |
| 35 to 64 Years | 42 (1.1%) | 55 (1.9%) |
| 65 to 74 Years | 75 (12.0%) | 39 (4.9%) |
| 75 Years and over | 20 (5.9%) | 87 (14.6%) |
Disability Class: Cognitive Difficulty
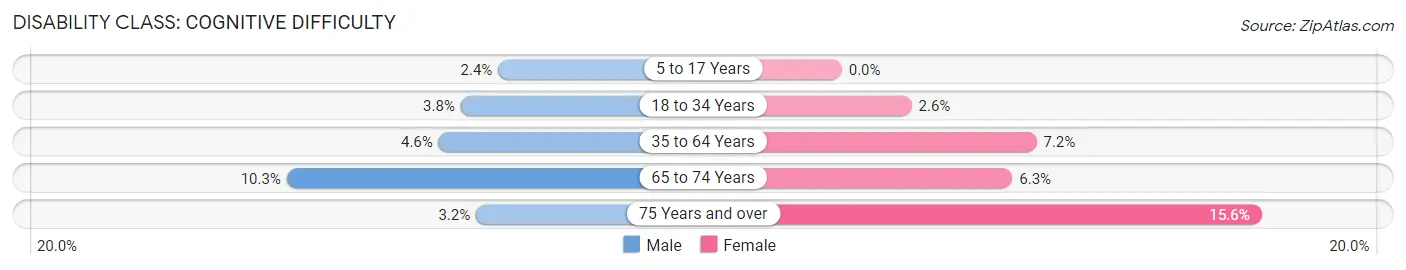
| Age Bracket | Male | Female |
| 5 to 17 Years | 25 (2.4%) | 0 (0.0%) |
| 18 to 34 Years | 141 (3.8%) | 79 (2.6%) |
| 35 to 64 Years | 169 (4.6%) | 206 (7.2%) |
| 65 to 74 Years | 64 (10.3%) | 50 (6.3%) |
| 75 Years and over | 11 (3.2%) | 93 (15.6%) |
Disability Class: Ambulatory Difficulty
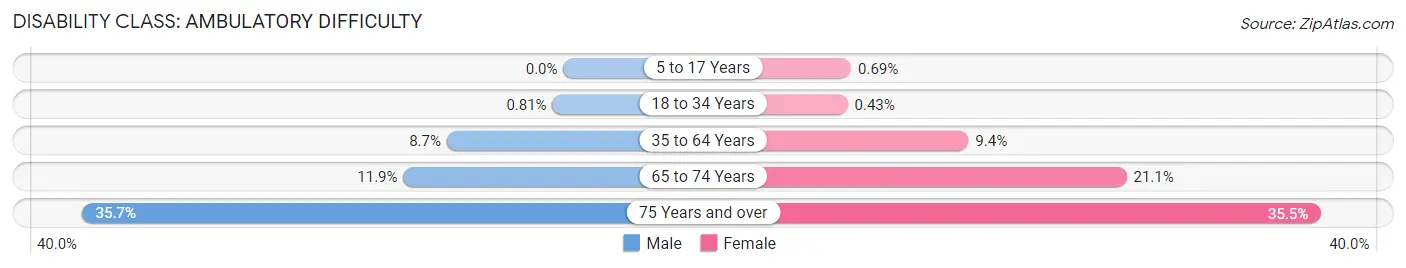
| Age Bracket | Male | Female |
| 5 to 17 Years | 0 (0.0%) | 8 (0.7%) |
| 18 to 34 Years | 30 (0.8%) | 13 (0.4%) |
| 35 to 64 Years | 316 (8.6%) | 268 (9.4%) |
| 65 to 74 Years | 74 (11.9%) | 167 (21.1%) |
| 75 Years and over | 121 (35.7%) | 212 (35.5%) |
Disability Class: Self-Care Difficulty
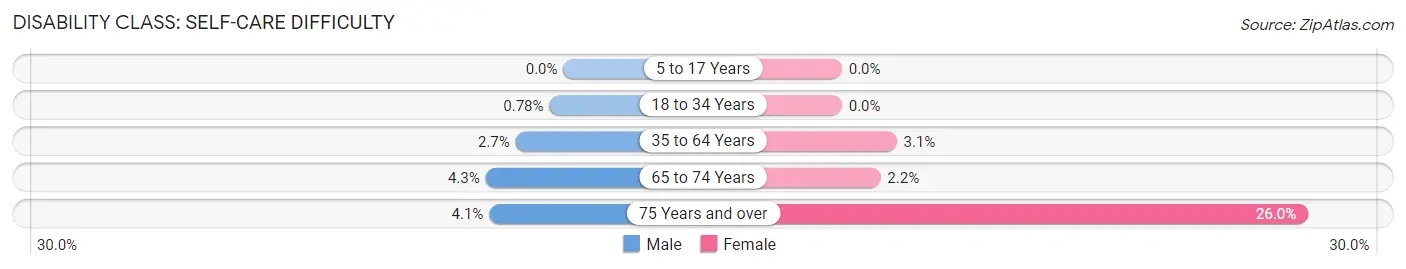
| Age Bracket | Male | Female |
| 5 to 17 Years | 0 (0.0%) | 0 (0.0%) |
| 18 to 34 Years | 29 (0.8%) | 0 (0.0%) |
| 35 to 64 Years | 97 (2.7%) | 87 (3.0%) |
| 65 to 74 Years | 27 (4.3%) | 17 (2.1%) |
| 75 Years and over | 14 (4.1%) | 155 (26.0%) |
Technology Access in Norwood
Computing Device Access in Norwood
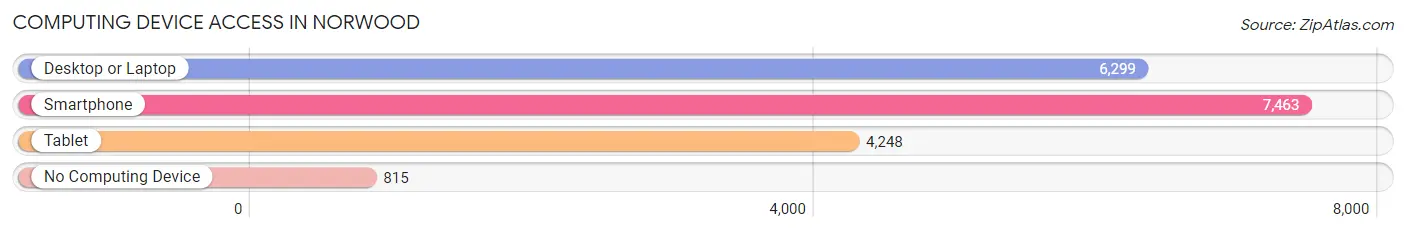
| Device Type | # Households | % Households |
| Desktop or Laptop | 6,299 | 72.9% |
| Smartphone | 7,463 | 86.4% |
| Tablet | 4,248 | 49.2% |
| No Computing Device | 815 | 9.4% |
| Total | 8,638 | 100.0% |
Internet Access in Norwood
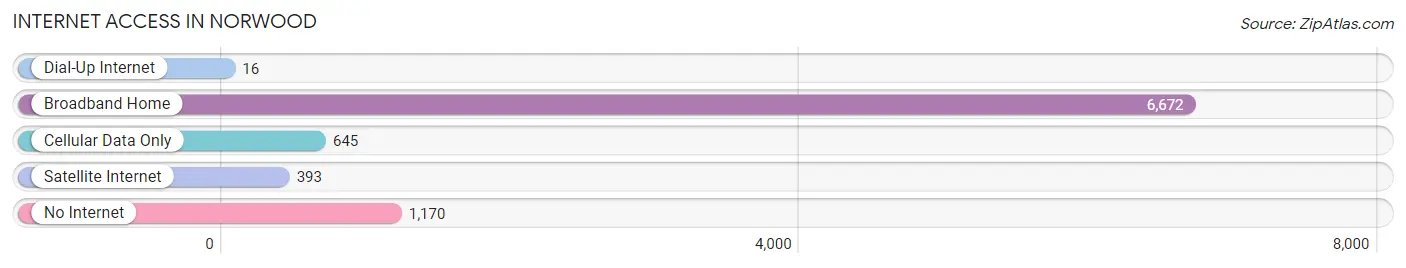
| Internet Type | # Households | % Households |
| Dial-Up Internet | 16 | 0.2% |
| Broadband Home | 6,672 | 77.2% |
| Cellular Data Only | 645 | 7.5% |
| Satellite Internet | 393 | 4.5% |
| No Internet | 1,170 | 13.5% |
| Total | 8,638 | 100.0% |
Norwood Summary
Norwood is a city located in Hamilton County, Ohio, United States. It is situated on the east side of the Little Miami River, approximately 8 miles northeast of downtown Cincinnati. The population was 19,207 at the 2010 census.
History
Norwood was founded in 1869 by John Kilgour, a Scottish immigrant. The city was named after Norwood, Massachusetts, which was the hometown of one of the original settlers. The city was incorporated in 1873.
In the late 19th century, Norwood was a major manufacturing center, with several factories producing a variety of products. The city was home to the Norwood Sash and Door Company, which produced doors and windows for many of the homes in the area. The city also had a large number of foundries and machine shops, which produced a variety of products, including railroad cars, engines, and other machinery.
In the early 20th century, Norwood was a major center for the automobile industry. The city was home to the Norwood Auto Company, which produced the Norwood automobile from 1906 to 1910. The city was also home to the Norwood Motor Company, which produced the Norwood automobile from 1910 to 1915.
Geography
Norwood is located at 39°10′17″N 84°27′17″W (39.171445, -84.454720). According to the United States Census Bureau, the city has a total area of 4.45 square miles (11.54 km2), all land.
Economy
Norwood is home to a variety of businesses and industries. The city is home to several large employers, including Procter & Gamble, the University of Cincinnati Medical Center, and the Cincinnati Children’s Hospital Medical Center. The city is also home to several smaller businesses, including restaurants, retail stores, and professional services.
Demographics
As of the census of 2010, there were 19,207 people, 8,093 households, and 4,845 families residing in the city. The population density was 4,303.3 people per square mile (1,660.2/km2). There were 8,837 housing units at an average density of 1,988.2 per square mile (766.3/km2). The racial makeup of the city was 79.2% White, 14.3% African American, 0.2% Native American, 2.2% Asian, 0.1% Pacific Islander, 1.3% from other races, and 2.8% from two or more races. Hispanic or Latino of any race were 3.7% of the population.
There were 8,093 households, out of which 28.2% had children under the age of 18 living with them, 39.2% were married couples living together, 15.2% had a female householder with no husband present, and 41.2% were non-families. 33.7% of all households were made up of individuals, and 11.2% had someone living alone who was 65 years of age or older. The average household size was 2.35 and the average family size was 3.02.
In the city, the population was spread out, with 24.2% under the age of 18, 9.2% from 18 to 24, 30.2% from 25 to 44, 22.3% from 45 to 64, and 14.1% who were 65 years of age or older. The median age was 36 years. For every 100 females, there were 91.2 males. For every 100 females age 18 and over, there were 87.2 males.
The median income for a household in the city was $37,890, and the median income for a family was $45,945. Males had a median income of $35,945 versus $27,945 for females. The per capita income for the city was $20,945. About 8.7% of families and 11.2% of the population were below the poverty line, including 15.2% of those under age 18 and 8.2% of those age 65 or over.
Common Questions
What is the Total Population of Norwood?
Total Population of Norwood is 19,018.
What is the Total Male Population of Norwood?
Total Male Population of Norwood is 9,903.
What is the Total Female Population of Norwood?
Total Female Population of Norwood is 9,115.
What is the Ratio of Males per 100 Females in Norwood?
There are 108.65 Males per 100 Females in Norwood.
What is the Ratio of Females per 100 Males in Norwood?
There are 92.04 Females per 100 Males in Norwood.
What is the Median Population Age in Norwood?
Median Population Age in Norwood is 33.5 Years.
What is the Average Family Size in Norwood
Average Family Size in Norwood is 3.0 People.
What is the Average Household Size in Norwood
Average Household Size in Norwood is 2.2 People.
What is Per Capita Income in Norwood?
Per Capita income in Norwood is $36,286.
What is the Median Family Income in Norwood?
Median Family Income in Norwood is $81,334.
What is the Median Household income in Norwood?
Median Household Income in Norwood is $58,095.
What is Income or Wage Gap in Norwood?
Income or Wage Gap in Norwood is 19.5%.
Women in Norwood earn 80.5 cents for every dollar earned by a man.
What is Inequality or Gini Index in Norwood?
Inequality or Gini Index in Norwood is 0.46.
How Large is the Labor Force in Norwood?
There are 11,215 People in the Labor Forcein in Norwood.
What is the Percentage of People in the Labor Force in Norwood?
70.4% of People are in the Labor Force in Norwood.
What is the Unemployment Rate in Norwood?
Unemployment Rate in Norwood is 4.5%.