Cities with the Highest Percentage of Population Employed in Material Moving in Ohio
RELATED REPORTS & OPTIONS
Material Moving
Ohio
Compare Cities
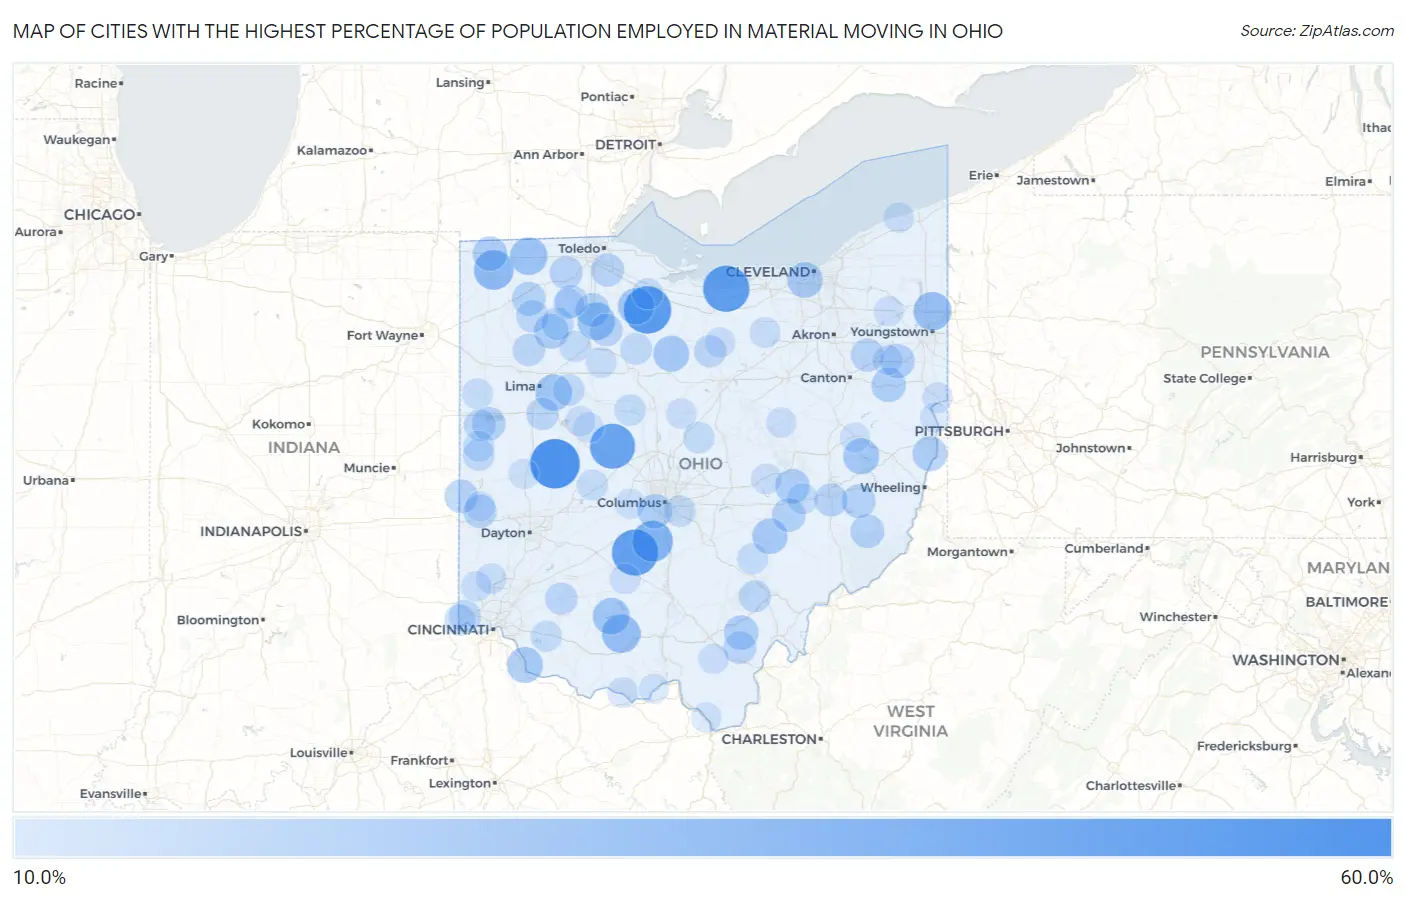
Map of Cities with the Highest Percentage of Population Employed in Material Moving in Ohio
0.0%
60.0%
Cities with the Highest Percentage of Population Employed in Material Moving in Ohio
| City | % Employed | vs State | vs National | |
| 1. | Rosewood | 58.2% | 4.9%(+53.3)#1 | 3.8%(+54.4)#72 |
| 2. | Old Fort | 53.1% | 4.9%(+48.1)#2 | 3.8%(+49.2)#90 |
| 3. | Mitiwanga | 50.6% | 4.9%(+45.6)#3 | 3.8%(+46.7)#97 |
| 4. | Pancoastburg | 50.0% | 4.9%(+45.1)#4 | 3.8%(+46.2)#102 |
| 5. | Mount Hope | 48.1% | 4.9%(+43.1)#5 | 3.8%(+44.2)#111 |
| 6. | Raymond | 47.8% | 4.9%(+42.8)#6 | 3.8%(+43.9)#112 |
| 7. | Darbyville | 37.6% | 4.9%(+32.7)#7 | 3.8%(+33.8)#187 |
| 8. | Pulaski | 34.9% | 4.9%(+29.9)#8 | 3.8%(+31.1)#219 |
| 9. | Sinking Spring | 31.6% | 4.9%(+26.7)#9 | 3.8%(+27.8)#272 |
| 10. | Vienna Center | 31.4% | 4.9%(+26.4)#10 | 3.8%(+27.5)#281 |
| 11. | Tedrow | 30.0% | 4.9%(+25.1)#11 | 3.8%(+26.2)#308 |
| 12. | Bairdstown | 29.8% | 4.9%(+24.9)#12 | 3.8%(+26.0)#310 |
| 13. | Highland Holiday | 28.2% | 4.9%(+23.2)#13 | 3.8%(+24.3)#351 |
| 14. | Burgoon | 27.7% | 4.9%(+22.7)#14 | 3.8%(+23.8)#365 |
| 15. | Westminster | 27.4% | 4.9%(+22.5)#15 | 3.8%(+23.6)#371 |
| 16. | Tippecanoe | 26.7% | 4.9%(+21.7)#16 | 3.8%(+22.8)#387 |
| 17. | Chatfield | 26.2% | 4.9%(+21.3)#17 | 3.8%(+22.4)#400 |
| 18. | Moscow | 26.0% | 4.9%(+21.1)#18 | 3.8%(+22.2)#404 |
| 19. | Linndale | 25.4% | 4.9%(+20.4)#19 | 3.8%(+21.5)#429 |
| 20. | Rose Farm | 25.0% | 4.9%(+20.1)#20 | 3.8%(+21.2)#442 |
| 21. | New Alexandria | 23.7% | 4.9%(+18.7)#21 | 3.8%(+19.9)#503 |
| 22. | West Leipsic | 23.5% | 4.9%(+18.5)#22 | 3.8%(+19.7)#510 |
| 23. | Adamsville | 23.3% | 4.9%(+18.4)#23 | 3.8%(+19.5)#519 |
| 24. | Urbancrest | 23.2% | 4.9%(+18.2)#24 | 3.8%(+19.4)#528 |
| 25. | Holiday City | 23.1% | 4.9%(+18.1)#25 | 3.8%(+19.2)#535 |
| 26. | Wilkesville | 22.8% | 4.9%(+17.9)#26 | 3.8%(+19.0)#551 |
| 27. | East Rochester | 22.8% | 4.9%(+17.9)#27 | 3.8%(+19.0)#552 |
| 28. | Damascus | 22.5% | 4.9%(+17.6)#28 | 3.8%(+18.7)#566 |
| 29. | Cygnet | 21.4% | 4.9%(+16.5)#29 | 3.8%(+17.6)#625 |
| 30. | Florida | 21.4% | 4.9%(+16.4)#30 | 3.8%(+17.5)#634 |
| 31. | Lewisville | 21.3% | 4.9%(+16.4)#31 | 3.8%(+17.5)#636 |
| 32. | Quaker City | 21.2% | 4.9%(+16.3)#32 | 3.8%(+17.4)#640 |
| 33. | Duncan Falls | 21.2% | 4.9%(+16.2)#33 | 3.8%(+17.3)#643 |
| 34. | East Alliance | 20.8% | 4.9%(+15.9)#34 | 3.8%(+17.0)#667 |
| 35. | Hollansburg | 20.8% | 4.9%(+15.8)#35 | 3.8%(+16.9)#671 |
| 36. | West Manchester | 20.7% | 4.9%(+15.8)#36 | 3.8%(+16.9)#675 |
| 37. | Montezuma | 20.5% | 4.9%(+15.5)#37 | 3.8%(+16.6)#699 |
| 38. | Stony Ridge | 20.2% | 4.9%(+15.3)#38 | 3.8%(+16.4)#710 |
| 39. | Marlboro | 20.2% | 4.9%(+15.2)#39 | 3.8%(+16.3)#714 |
| 40. | Byesville | 19.7% | 4.9%(+14.8)#40 | 3.8%(+15.9)#744 |
| 41. | Neapolis | 19.7% | 4.9%(+14.7)#41 | 3.8%(+15.8)#751 |
| 42. | Vinton | 19.4% | 4.9%(+14.4)#42 | 3.8%(+15.5)#769 |
| 43. | Arcadia | 18.8% | 4.9%(+13.9)#43 | 3.8%(+15.0)#814 |
| 44. | Milton Center | 18.8% | 4.9%(+13.8)#44 | 3.8%(+14.9)#822 |
| 45. | New Bavaria | 18.8% | 4.9%(+13.8)#45 | 3.8%(+14.9)#824 |
| 46. | St Johns | 18.7% | 4.9%(+13.7)#46 | 3.8%(+14.8)#832 |
| 47. | Midland | 18.6% | 4.9%(+13.7)#47 | 3.8%(+14.8)#833 |
| 48. | Belmore | 18.4% | 4.9%(+13.5)#48 | 3.8%(+14.6)#863 |
| 49. | Kalida | 18.3% | 4.9%(+13.3)#49 | 3.8%(+14.4)#876 |
| 50. | Miller | 18.2% | 4.9%(+13.2)#50 | 3.8%(+14.4)#882 |
| 51. | Shiloh | 18.0% | 4.9%(+13.0)#51 | 3.8%(+14.1)#913 |
| 52. | Hooven | 17.8% | 4.9%(+12.8)#52 | 3.8%(+13.9)#931 |
| 53. | New Marshfield | 17.6% | 4.9%(+12.7)#53 | 3.8%(+13.8)#943 |
| 54. | Coldwater | 17.6% | 4.9%(+12.6)#54 | 3.8%(+13.7)#962 |
| 55. | Mccutchenville | 17.1% | 4.9%(+12.1)#55 | 3.8%(+13.2)#1,032 |
| 56. | Rossburg | 16.9% | 4.9%(+12.0)#56 | 3.8%(+13.1)#1,048 |
| 57. | Alger | 16.6% | 4.9%(+11.7)#57 | 3.8%(+12.8)#1,104 |
| 58. | Sparta | 16.4% | 4.9%(+11.5)#58 | 3.8%(+12.6)#1,120 |
| 59. | Blacklick Estates | 16.4% | 4.9%(+11.4)#59 | 3.8%(+12.5)#1,131 |
| 60. | New Bloomington | 16.1% | 4.9%(+11.2)#60 | 3.8%(+12.3)#1,172 |
| 61. | Benton Ridge | 16.1% | 4.9%(+11.1)#61 | 3.8%(+12.2)#1,181 |
| 62. | Elizabethtown | 15.9% | 4.9%(+11.0)#62 | 3.8%(+12.1)#1,201 |
| 63. | Jersey | 15.8% | 4.9%(+10.8)#63 | 3.8%(+12.0)#1,224 |
| 64. | Lawrenceville | 15.7% | 4.9%(+10.8)#64 | 3.8%(+11.9)#1,239 |
| 65. | Norwich | 15.6% | 4.9%(+10.6)#65 | 3.8%(+11.7)#1,269 |
| 66. | New Straitsville | 15.4% | 4.9%(+10.5)#66 | 3.8%(+11.6)#1,293 |
| 67. | Suffield | 15.4% | 4.9%(+10.4)#67 | 3.8%(+11.6)#1,299 |
| 68. | Newport Cdp Shelby County | 15.4% | 4.9%(+10.4)#68 | 3.8%(+11.6)#1,305 |
| 69. | New Weston | 15.4% | 4.9%(+10.4)#69 | 3.8%(+11.6)#1,306 |
| 70. | Mutual | 15.4% | 4.9%(+10.4)#70 | 3.8%(+11.6)#1,309 |
| 71. | Stony Prairie | 15.2% | 4.9%(+10.3)#71 | 3.8%(+11.4)#1,331 |
| 72. | Guilford Lake | 15.2% | 4.9%(+10.2)#72 | 3.8%(+11.3)#1,341 |
| 73. | Williamsburg | 15.2% | 4.9%(+10.2)#73 | 3.8%(+11.3)#1,342 |
| 74. | Mount Blanchard | 15.0% | 4.9%(+10.1)#74 | 3.8%(+11.2)#1,377 |
| 75. | Rockford | 14.9% | 4.9%(+9.93)#75 | 3.8%(+11.0)#1,403 |
| 76. | Williamsdale | 14.7% | 4.9%(+9.76)#76 | 3.8%(+10.9)#1,437 |
| 77. | Custar | 14.5% | 4.9%(+9.57)#77 | 3.8%(+10.7)#1,481 |
| 78. | Spencer | 14.5% | 4.9%(+9.50)#78 | 3.8%(+10.6)#1,497 |
| 79. | Frazeysburg | 14.4% | 4.9%(+9.44)#79 | 3.8%(+10.6)#1,507 |
| 80. | North Industry | 14.3% | 4.9%(+9.34)#80 | 3.8%(+10.5)#1,523 |
| 81. | Rome Stout | 14.3% | 4.9%(+9.34)#81 | 3.8%(+10.5)#1,549 |
| 82. | Millville | 14.2% | 4.9%(+9.29)#82 | 3.8%(+10.4)#1,559 |
| 83. | Maple Ridge | 14.1% | 4.9%(+9.18)#83 | 3.8%(+10.3)#1,574 |
| 84. | Good Hope | 14.1% | 4.9%(+9.17)#84 | 3.8%(+10.3)#1,579 |
| 85. | Oak Hill | 14.1% | 4.9%(+9.12)#85 | 3.8%(+10.2)#1,591 |
| 86. | Greenwich | 14.0% | 4.9%(+9.09)#86 | 3.8%(+10.2)#1,605 |
| 87. | Glenmoor | 14.0% | 4.9%(+9.03)#87 | 3.8%(+10.1)#1,617 |
| 88. | Edison | 14.0% | 4.9%(+9.03)#88 | 3.8%(+10.1)#1,623 |
| 89. | Geneva On The Lake | 13.9% | 4.9%(+9.00)#89 | 3.8%(+10.1)#1,626 |
| 90. | Rushsylvania | 13.9% | 4.9%(+9.00)#90 | 3.8%(+10.1)#1,627 |
| 91. | Killbuck | 13.9% | 4.9%(+8.95)#91 | 3.8%(+10.1)#1,641 |
| 92. | Windham | 13.7% | 4.9%(+8.78)#92 | 3.8%(+9.90)#1,691 |
| 93. | Belle Center | 13.6% | 4.9%(+8.68)#93 | 3.8%(+9.79)#1,728 |
| 94. | Coal Grove | 13.5% | 4.9%(+8.59)#94 | 3.8%(+9.70)#1,758 |
| 95. | Piqua | 13.5% | 4.9%(+8.55)#95 | 3.8%(+9.67)#1,767 |
| 96. | Stratton | 13.4% | 4.9%(+8.43)#96 | 3.8%(+9.55)#1,792 |
| 97. | West Jefferson | 13.4% | 4.9%(+8.41)#97 | 3.8%(+9.53)#1,797 |
| 98. | Castine | 13.3% | 4.9%(+8.38)#98 | 3.8%(+9.50)#1,815 |
| 99. | Friendship | 13.3% | 4.9%(+8.36)#99 | 3.8%(+9.48)#1,822 |
| 100. | Dennison | 13.2% | 4.9%(+8.28)#100 | 3.8%(+9.39)#1,842 |
Common Questions
What are the Top 10 Cities with the Highest Percentage of Population Employed in Material Moving in Ohio?
Top 10 Cities with the Highest Percentage of Population Employed in Material Moving in Ohio are:
#1
58.2%
#2
53.1%
#3
50.6%
#4
50.0%
#5
47.8%
#6
37.6%
#7
34.9%
#8
31.6%
#9
31.4%
#10
30.0%
What city has the Highest Percentage of Population Employed in Material Moving in Ohio?
Rosewood has the Highest Percentage of Population Employed in Material Moving in Ohio with 58.2%.
What is the Percentage of Population Employed in Material Moving in the State of Ohio?
Percentage of Population Employed in Material Moving in Ohio is 4.9%.
What is the Percentage of Population Employed in Material Moving in the United States?
Percentage of Population Employed in Material Moving in the United States is 3.8%.