Springfield, OH
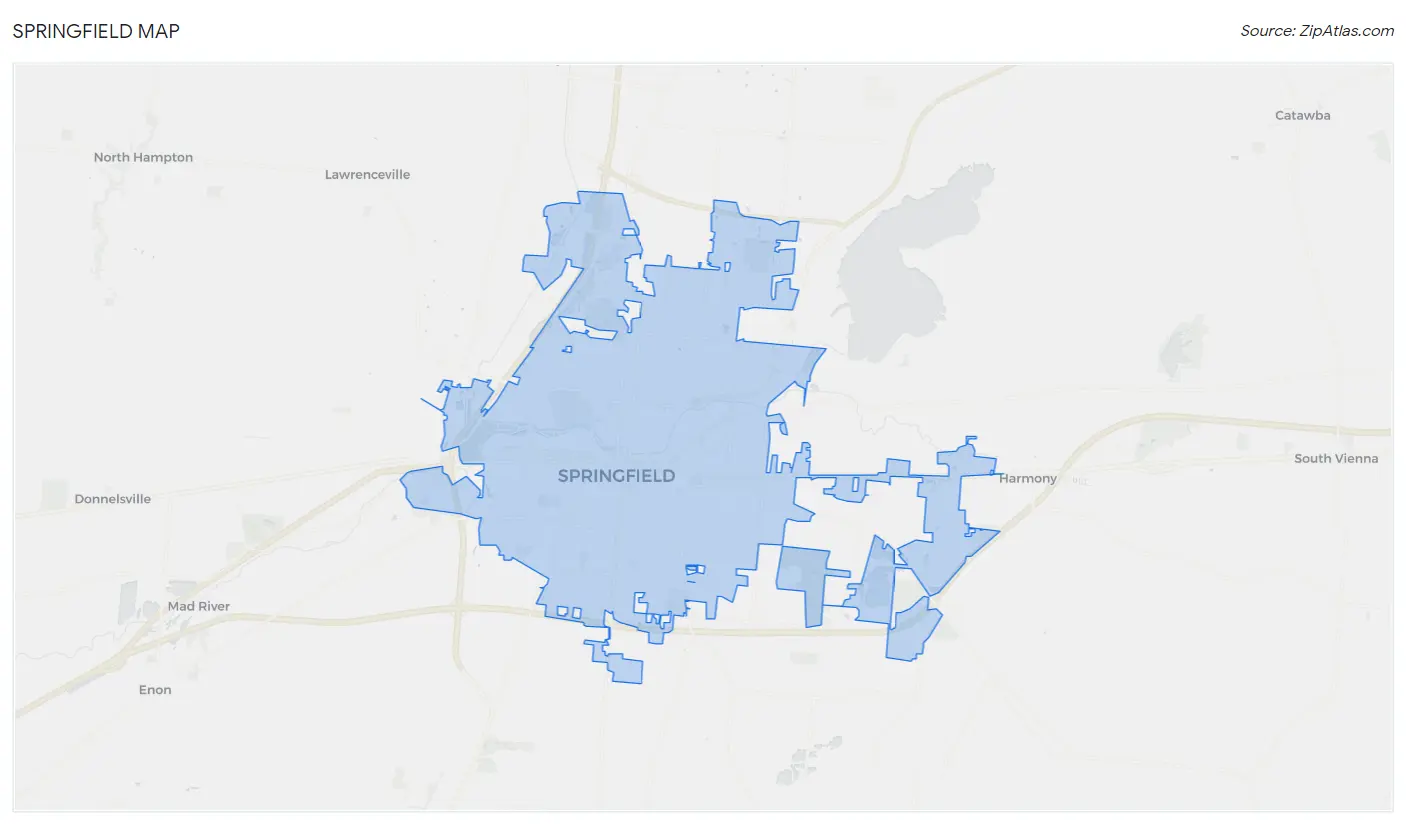
Springfield Map
Springfield Overview
58,645
TOTAL POPULATION
28,248
MALE POPULATION
30,397
FEMALE POPULATION
92.93
MALES / 100 FEMALES
107.61
FEMALES / 100 MALES
37.1
MEDIAN AGE
3.0
AVG FAMILY SIZE
2.3
AVG HOUSEHOLD SIZE
$24,701
PER CAPITA INCOME
$54,509
AVG FAMILY INCOME
$45,113
AVG HOUSEHOLD INCOME
24.8%
WAGE / INCOME GAP [ % ]
75.2¢/ $1
WAGE / INCOME GAP [ $ ]
$12,535
FAMILY INCOME DEFICIT
0.44
INEQUALITY / GINI INDEX
26,905
LABOR FORCE [ PEOPLE ]
58.5%
PERCENT IN LABOR FORCE
9.1%
UNEMPLOYMENT RATE
Springfield Area Codes
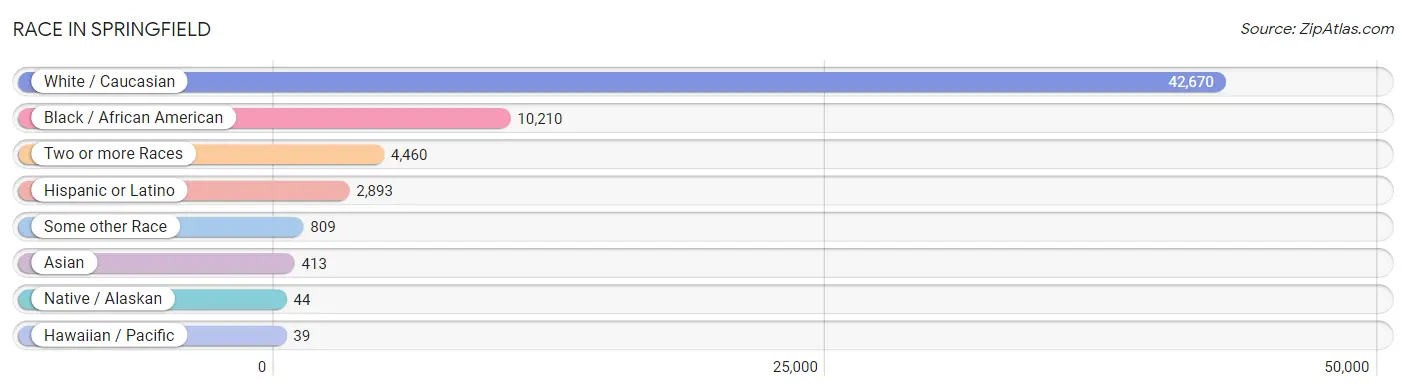
Race in Springfield
The most populous races in Springfield are White / Caucasian (42,670 | 72.8%), Black / African American (10,210 | 17.4%), and Two or more Races (4,460 | 7.6%).
| Race | # Population | % Population |
| Asian | 413 | 0.7% |
| Black / African American | 10,210 | 17.4% |
| Hawaiian / Pacific | 39 | 0.1% |
| Hispanic or Latino | 2,893 | 4.9% |
| Native / Alaskan | 44 | 0.1% |
| White / Caucasian | 42,670 | 72.8% |
| Two or more Races | 4,460 | 7.6% |
| Some other Race | 809 | 1.4% |
| Total | 58,645 | 100.0% |
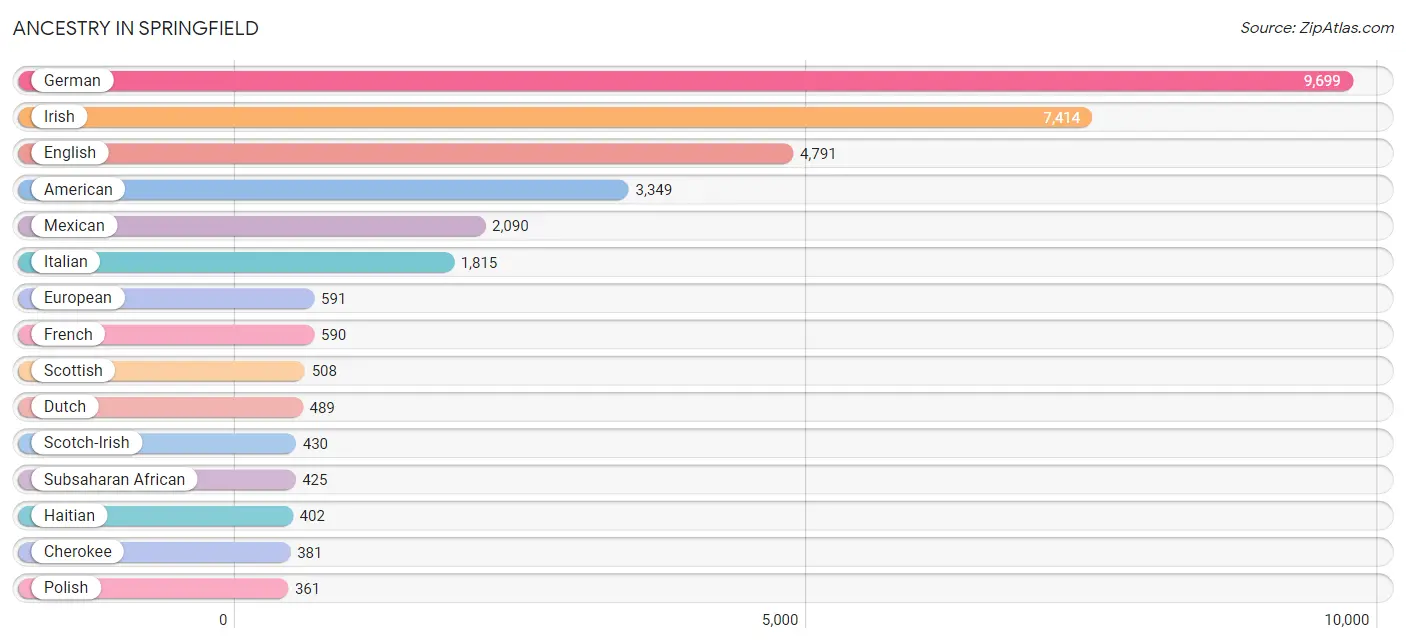
Ancestry in Springfield
The most populous ancestries reported in Springfield are German (9,699 | 16.5%), Irish (7,414 | 12.6%), English (4,791 | 8.2%), American (3,349 | 5.7%), and Mexican (2,090 | 3.6%), together accounting for 46.6% of all Springfield residents.
| Ancestry | # Population | % Population |
| African | 229 | 0.4% |
| Alsatian | 13 | 0.0% |
| American | 3,349 | 5.7% |
| Arab | 134 | 0.2% |
| Armenian | 4 | 0.0% |
| Australian | 6 | 0.0% |
| Austrian | 40 | 0.1% |
| Bhutanese | 48 | 0.1% |
| Blackfeet | 301 | 0.5% |
| British | 140 | 0.2% |
| Burmese | 85 | 0.1% |
| Canadian | 176 | 0.3% |
| Celtic | 7 | 0.0% |
| Central American | 65 | 0.1% |
| Central American Indian | 46 | 0.1% |
| Cherokee | 381 | 0.6% |
| Chilean | 40 | 0.1% |
| Chippewa | 23 | 0.0% |
| Cree | 5 | 0.0% |
| Croatian | 8 | 0.0% |
| Cuban | 38 | 0.1% |
| Czech | 120 | 0.2% |
| Czechoslovakian | 43 | 0.1% |
| Danish | 85 | 0.1% |
| Dominican | 86 | 0.2% |
| Dutch | 489 | 0.8% |
| Eastern European | 233 | 0.4% |
| Egyptian | 30 | 0.1% |
| English | 4,791 | 8.2% |
| Ethiopian | 92 | 0.2% |
| European | 591 | 1.0% |
| Filipino | 10 | 0.0% |
| French | 590 | 1.0% |
| French Canadian | 72 | 0.1% |
| German | 9,699 | 16.5% |
| Greek | 146 | 0.3% |
| Guamanian / Chamorro | 28 | 0.1% |
| Guatemalan | 22 | 0.0% |
| Haitian | 402 | 0.7% |
| Honduran | 12 | 0.0% |
| Hungarian | 108 | 0.2% |
| Indian (Asian) | 155 | 0.3% |
| Indonesian | 27 | 0.1% |
| Iranian | 5 | 0.0% |
| Irish | 7,414 | 12.6% |
| Israeli | 5 | 0.0% |
| Italian | 1,815 | 3.1% |
| Korean | 321 | 0.5% |
| Lebanese | 10 | 0.0% |
| Lithuanian | 22 | 0.0% |
| Macedonian | 10 | 0.0% |
| Mexican | 2,090 | 3.6% |
| Mexican American Indian | 59 | 0.1% |
| Nicaraguan | 11 | 0.0% |
| Nigerian | 41 | 0.1% |
| Norwegian | 140 | 0.2% |
| Palestinian | 18 | 0.0% |
| Panamanian | 8 | 0.0% |
| Pennsylvania German | 17 | 0.0% |
| Polish | 361 | 0.6% |
| Portuguese | 23 | 0.0% |
| Puerto Rican | 349 | 0.6% |
| Romanian | 17 | 0.0% |
| Russian | 23 | 0.0% |
| Salvadoran | 12 | 0.0% |
| Samoan | 39 | 0.1% |
| Scandinavian | 207 | 0.4% |
| Scotch-Irish | 430 | 0.7% |
| Scottish | 508 | 0.9% |
| Sierra Leonean | 4 | 0.0% |
| Slavic | 14 | 0.0% |
| Slovak | 44 | 0.1% |
| Slovene | 120 | 0.2% |
| South American | 80 | 0.1% |
| Spaniard | 36 | 0.1% |
| Spanish | 27 | 0.1% |
| Sri Lankan | 30 | 0.1% |
| Subsaharan African | 425 | 0.7% |
| Swedish | 127 | 0.2% |
| Swiss | 189 | 0.3% |
| Thai | 156 | 0.3% |
| Ukrainian | 23 | 0.0% |
| Welsh | 345 | 0.6% |
| West Indian | 6 | 0.0% |
| Yugoslavian | 1 | 0.0% | View All 85 Rows |
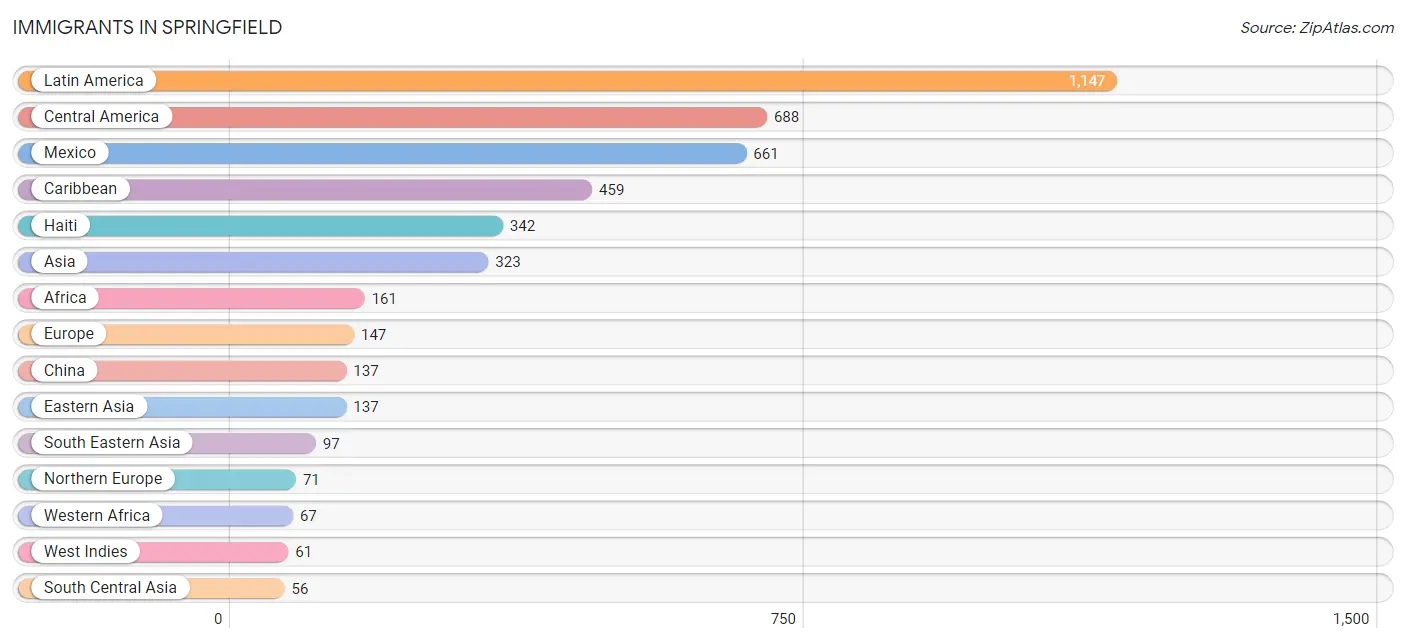
Immigrants in Springfield
The most numerous immigrant groups reported in Springfield came from Latin America (1,147 | 2.0%), Central America (688 | 1.2%), Mexico (661 | 1.1%), Caribbean (459 | 0.8%), and Haiti (342 | 0.6%), together accounting for 5.6% of all Springfield residents.
| Immigration Origin | # Population | % Population |
| Africa | 161 | 0.3% |
| Asia | 323 | 0.5% |
| Canada | 17 | 0.0% |
| Caribbean | 459 | 0.8% |
| Central America | 688 | 1.2% |
| China | 137 | 0.2% |
| Denmark | 10 | 0.0% |
| Dominican Republic | 48 | 0.1% |
| Eastern Africa | 55 | 0.1% |
| Eastern Asia | 137 | 0.2% |
| Eastern Europe | 4 | 0.0% |
| El Salvador | 12 | 0.0% |
| Eritrea | 22 | 0.0% |
| Ethiopia | 17 | 0.0% |
| Europe | 147 | 0.3% |
| France | 2 | 0.0% |
| Germany | 39 | 0.1% |
| Guatemala | 4 | 0.0% |
| Haiti | 342 | 0.6% |
| Hong Kong | 18 | 0.0% |
| India | 51 | 0.1% |
| Iran | 5 | 0.0% |
| Ireland | 6 | 0.0% |
| Israel | 33 | 0.1% |
| Latin America | 1,147 | 2.0% |
| Mexico | 661 | 1.1% |
| Netherlands | 5 | 0.0% |
| Nicaragua | 11 | 0.0% |
| Nigeria | 16 | 0.0% |
| Northern Africa | 39 | 0.1% |
| Northern Europe | 71 | 0.1% |
| Philippines | 40 | 0.1% |
| Romania | 4 | 0.0% |
| Scotland | 12 | 0.0% |
| Senegal | 33 | 0.1% |
| Sierra Leone | 4 | 0.0% |
| South Central Asia | 56 | 0.1% |
| South Eastern Asia | 97 | 0.2% |
| Southern Europe | 26 | 0.0% |
| Spain | 26 | 0.0% |
| Thailand | 20 | 0.0% |
| Vietnam | 30 | 0.1% |
| West Indies | 61 | 0.1% |
| Western Africa | 67 | 0.1% |
| Western Asia | 33 | 0.1% |
| Western Europe | 46 | 0.1% | View All 46 Rows |
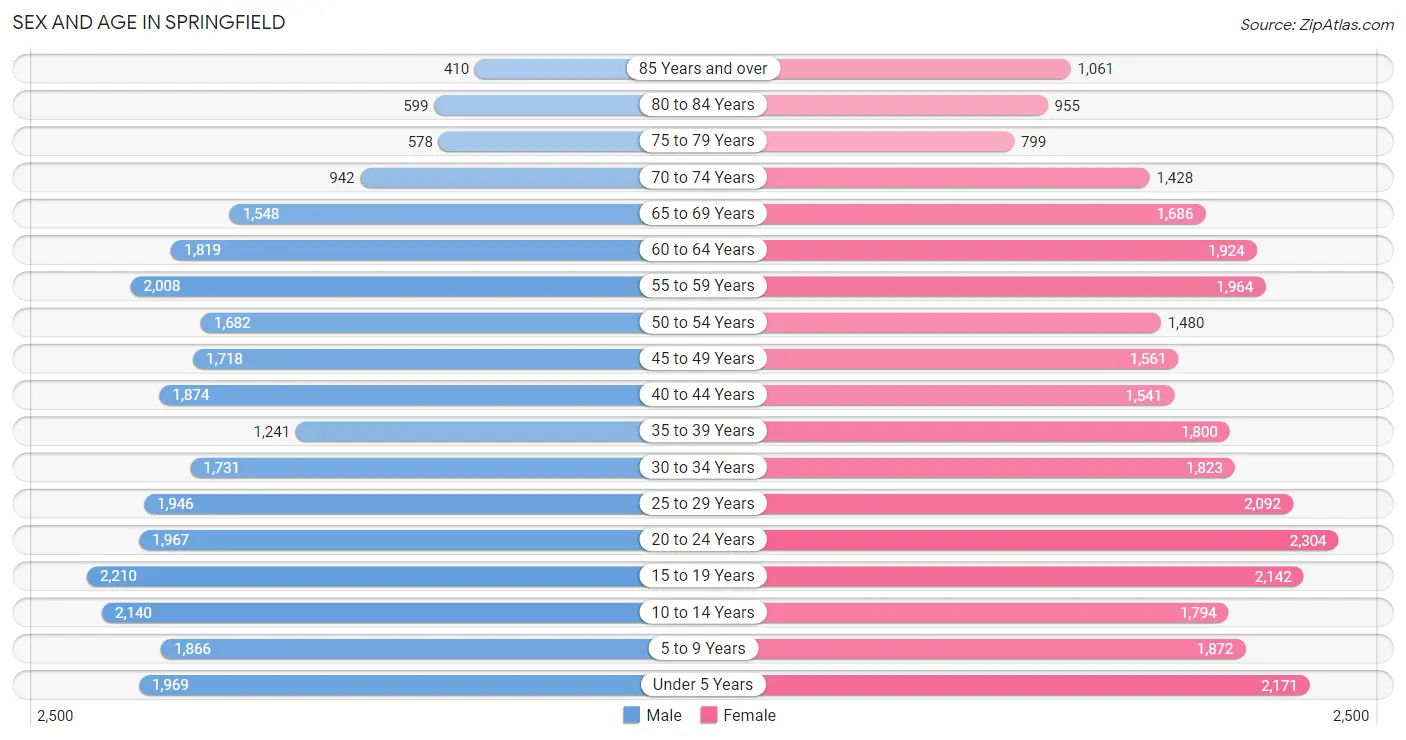
Sex and Age in Springfield
Sex and Age in Springfield
The most populous age groups in Springfield are 15 to 19 Years (2,210 | 7.8%) for men and 20 to 24 Years (2,304 | 7.6%) for women.
| Age Bracket | Male | Female |
| Under 5 Years | 1,969 (7.0%) | 2,171 (7.1%) |
| 5 to 9 Years | 1,866 (6.6%) | 1,872 (6.2%) |
| 10 to 14 Years | 2,140 (7.6%) | 1,794 (5.9%) |
| 15 to 19 Years | 2,210 (7.8%) | 2,142 (7.0%) |
| 20 to 24 Years | 1,967 (7.0%) | 2,304 (7.6%) |
| 25 to 29 Years | 1,946 (6.9%) | 2,092 (6.9%) |
| 30 to 34 Years | 1,731 (6.1%) | 1,823 (6.0%) |
| 35 to 39 Years | 1,241 (4.4%) | 1,800 (5.9%) |
| 40 to 44 Years | 1,874 (6.6%) | 1,541 (5.1%) |
| 45 to 49 Years | 1,718 (6.1%) | 1,561 (5.1%) |
| 50 to 54 Years | 1,682 (5.9%) | 1,480 (4.9%) |
| 55 to 59 Years | 2,008 (7.1%) | 1,964 (6.5%) |
| 60 to 64 Years | 1,819 (6.4%) | 1,924 (6.3%) |
| 65 to 69 Years | 1,548 (5.5%) | 1,686 (5.6%) |
| 70 to 74 Years | 942 (3.3%) | 1,428 (4.7%) |
| 75 to 79 Years | 578 (2.1%) | 799 (2.6%) |
| 80 to 84 Years | 599 (2.1%) | 955 (3.1%) |
| 85 Years and over | 410 (1.5%) | 1,061 (3.5%) |
| Total | 28,248 (100.0%) | 30,397 (100.0%) |
Families and Households in Springfield
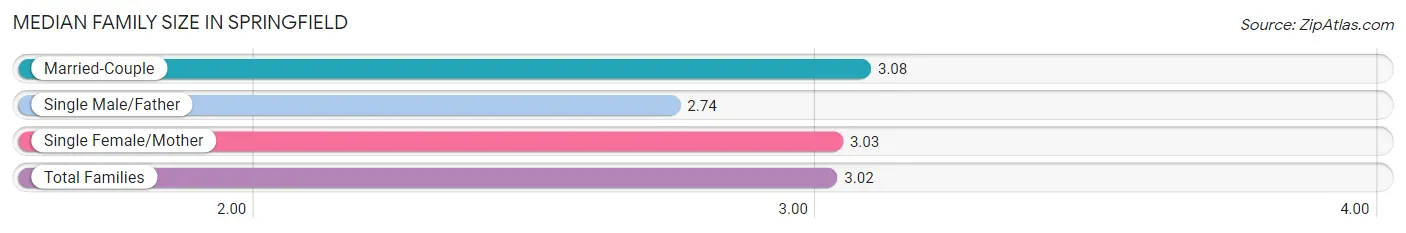
Median Family Size in Springfield
The median family size in Springfield is 3.02 persons per family, with married-couple families (7,211 | 54.5%) accounting for the largest median family size of 3.08 persons per family. On the other hand, single male/father families (1,641 | 12.4%) represent the smallest median family size with 2.74 persons per family.
| Family Type | # Families | Family Size |
| Married-Couple | 7,211 (54.5%) | 3.08 |
| Single Male/Father | 1,641 (12.4%) | 2.74 |
| Single Female/Mother | 4,378 (33.1%) | 3.03 |
| Total Families | 13,230 (100.0%) | 3.02 |
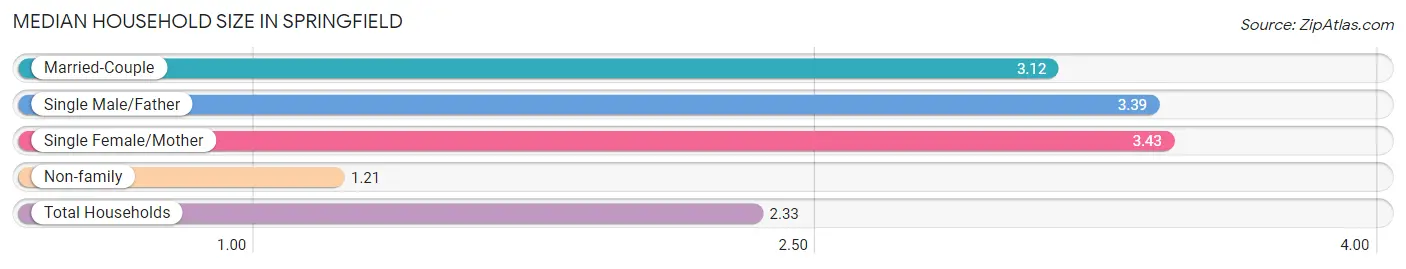
Median Household Size in Springfield
The median household size in Springfield is 2.33 persons per household, with single female/mother households (4,378 | 18.1%) accounting for the largest median household size of 3.43 persons per household. non-family households (10,902 | 45.2%) represent the smallest median household size with 1.21 persons per household.
| Household Type | # Households | Household Size |
| Married-Couple | 7,211 (29.9%) | 3.12 |
| Single Male/Father | 1,641 (6.8%) | 3.39 |
| Single Female/Mother | 4,378 (18.1%) | 3.43 |
| Non-family | 10,902 (45.2%) | 1.21 |
| Total Households | 24,132 (100.0%) | 2.33 |
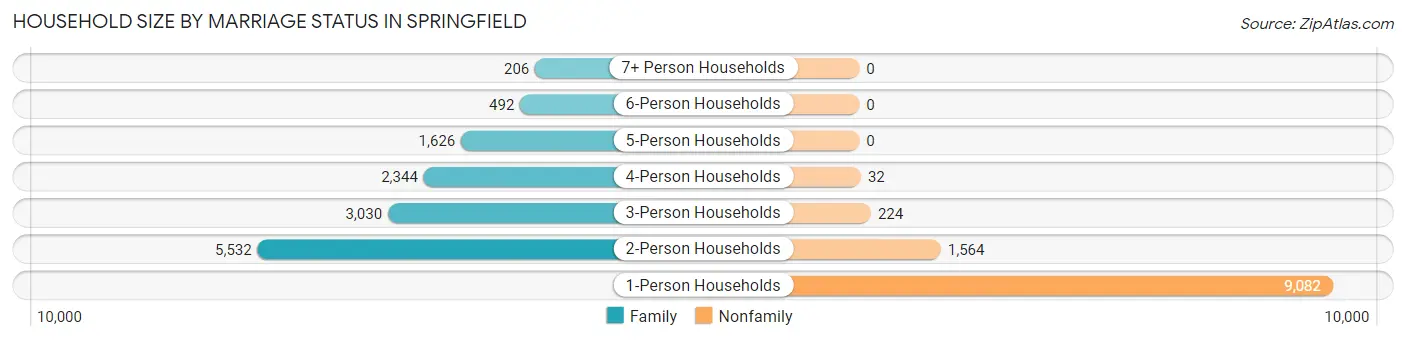
Household Size by Marriage Status in Springfield
Out of a total of 24,132 households in Springfield, 13,230 (54.8%) are family households, while 10,902 (45.2%) are nonfamily households. The most numerous type of family households are 2-person households, comprising 5,532, and the most common type of nonfamily households are 1-person households, comprising 9,082.
| Household Size | Family Households | Nonfamily Households |
| 1-Person Households | - | 9,082 (37.6%) |
| 2-Person Households | 5,532 (22.9%) | 1,564 (6.5%) |
| 3-Person Households | 3,030 (12.6%) | 224 (0.9%) |
| 4-Person Households | 2,344 (9.7%) | 32 (0.1%) |
| 5-Person Households | 1,626 (6.7%) | 0 (0.0%) |
| 6-Person Households | 492 (2.0%) | 0 (0.0%) |
| 7+ Person Households | 206 (0.9%) | 0 (0.0%) |
| Total | 13,230 (54.8%) | 10,902 (45.2%) |
Female Fertility in Springfield
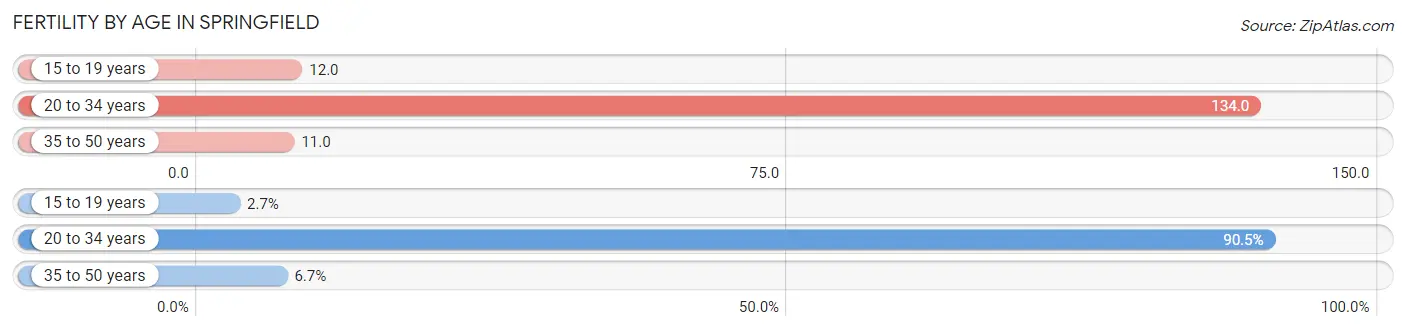
Fertility by Age in Springfield
Average fertility rate in Springfield is 67.0 births per 1,000 women. Women in the age bracket of 20 to 34 years have the highest fertility rate with 134.0 births per 1,000 women. Women in the age bracket of 20 to 34 years acount for 90.5% of all women with births.
| Age Bracket | Women with Births | Births / 1,000 Women |
| 15 to 19 years | 25 (2.7%) | 12.0 |
| 20 to 34 years | 833 (90.5%) | 134.0 |
| 35 to 50 years | 62 (6.7%) | 11.0 |
| Total | 920 (100.0%) | 67.0 |
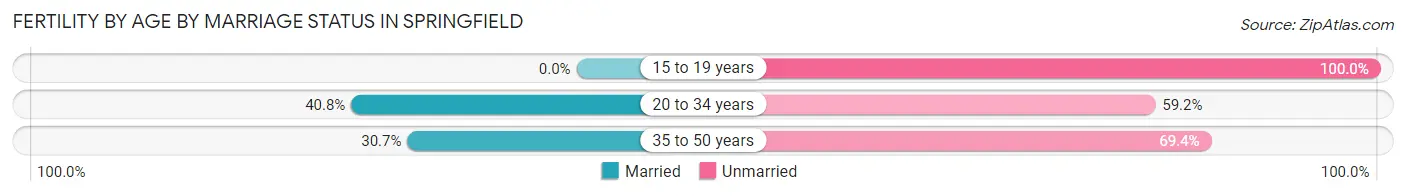
Fertility by Age by Marriage Status in Springfield
39.0% of women with births (920) in Springfield are married. The highest percentage of unmarried women with births falls into 15 to 19 years age bracket with 100.0% of them unmarried at the time of birth, while the lowest percentage of unmarried women with births belong to 20 to 34 years age bracket with 59.2% of them unmarried.
| Age Bracket | Married | Unmarried |
| 15 to 19 years | 0 (0.0%) | 25 (100.0%) |
| 20 to 34 years | 340 (40.8%) | 493 (59.2%) |
| 35 to 50 years | 19 (30.6%) | 43 (69.4%) |
| Total | 359 (39.0%) | 561 (61.0%) |
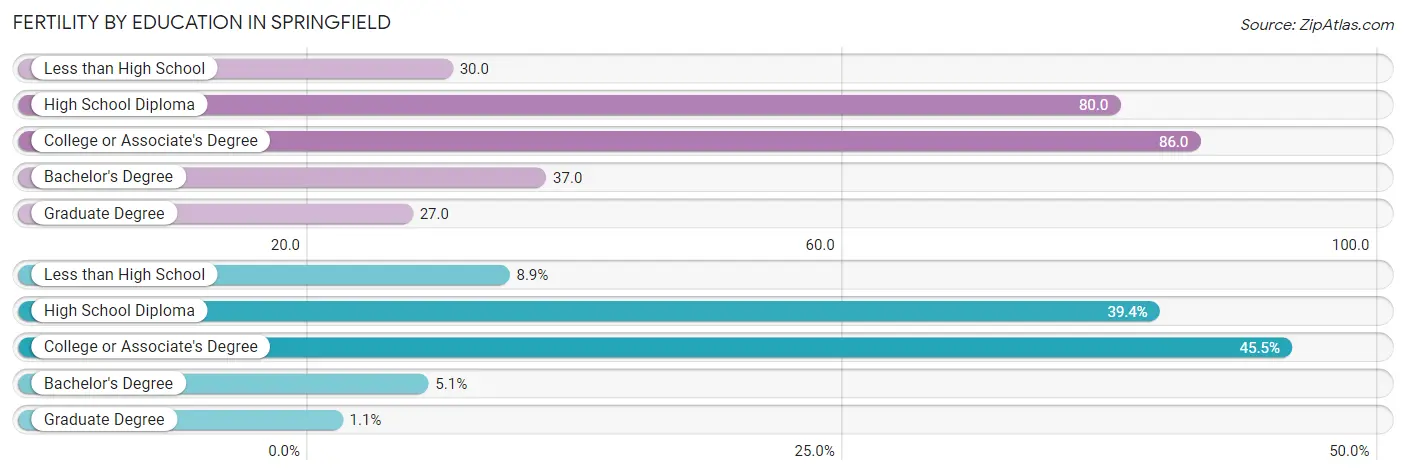
Fertility by Education in Springfield
Average fertility rate in Springfield is 67.0 births per 1,000 women. Women with the education attainment of college or associate's degree have the highest fertility rate of 86.0 births per 1,000 women, while women with the education attainment of graduate degree have the lowest fertility at 27.0 births per 1,000 women. Women with the education attainment of college or associate's degree represent 45.5% of all women with births.
| Educational Attainment | Women with Births | Births / 1,000 Women |
| Less than High School | 82 (8.9%) | 30.0 |
| High School Diploma | 362 (39.4%) | 80.0 |
| College or Associate's Degree | 419 (45.5%) | 86.0 |
| Bachelor's Degree | 47 (5.1%) | 37.0 |
| Graduate Degree | 10 (1.1%) | 27.0 |
| Total | 920 (100.0%) | 67.0 |
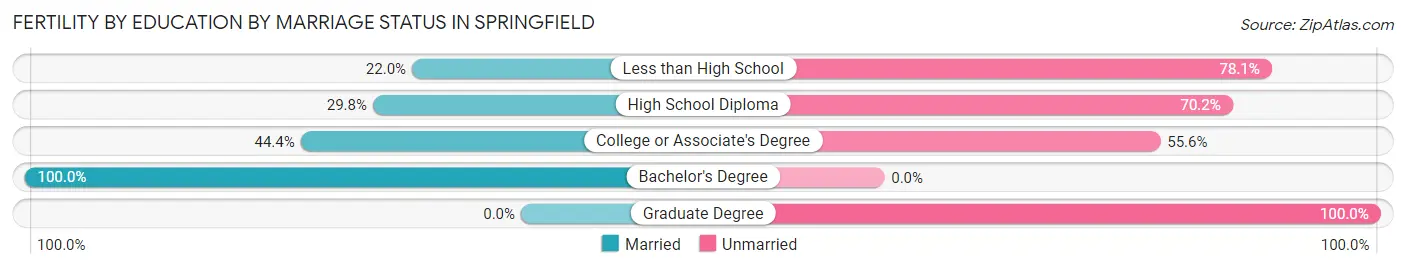
Fertility by Education by Marriage Status in Springfield
61.0% of women with births in Springfield are unmarried. Women with the educational attainment of bachelor's degree are most likely to be married with 100.0% of them married at childbirth, while women with the educational attainment of graduate degree are least likely to be married with 100.0% of them unmarried at childbirth.
| Educational Attainment | Married | Unmarried |
| Less than High School | 18 (22.0%) | 64 (78.0%) |
| High School Diploma | 108 (29.8%) | 254 (70.2%) |
| College or Associate's Degree | 186 (44.4%) | 233 (55.6%) |
| Bachelor's Degree | 47 (100.0%) | 0 (0.0%) |
| Graduate Degree | 0 (0.0%) | 10 (100.0%) |
| Total | 359 (39.0%) | 561 (61.0%) |
Income in Springfield
Income Overview in Springfield
Per Capita Income in Springfield is $24,701, while median incomes of families and households are $54,509 and $45,113 respectively.
| Characteristic | Number | Measure |
| Per Capita Income | 58,645 | $24,701 |
| Median Family Income | 13,230 | $54,509 |
| Mean Family Income | 13,230 | $68,309 |
| Median Household Income | 24,132 | $45,113 |
| Mean Household Income | 24,132 | $57,752 |
| Income Deficit | 13,230 | $12,535 |
| Wage / Income Gap (%) | 58,645 | 24.80% |
| Wage / Income Gap ($) | 58,645 | 75.20¢ per $1 |
| Gini / Inequality Index | 58,645 | 0.44 |
Earnings by Sex in Springfield
Average Earnings in Springfield are $30,500, $35,257 for men and $26,513 for women, a difference of 24.8%.
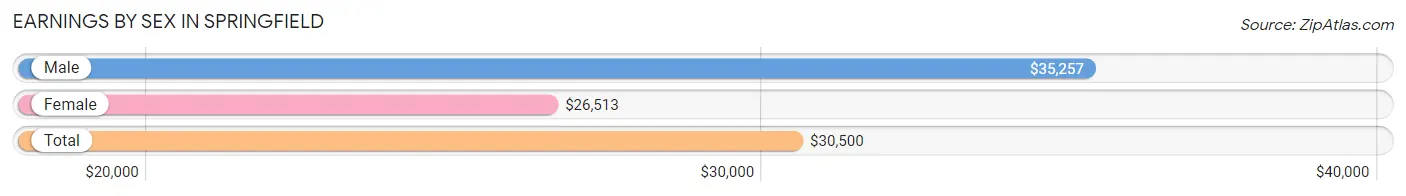
| Sex | Number | Average Earnings |
| Male | 14,619 (51.4%) | $35,257 |
| Female | 13,811 (48.6%) | $26,513 |
| Total | 28,430 (100.0%) | $30,500 |
Earnings by Sex by Income Bracket in Springfield
The most common earnings brackets in Springfield are $55,000 to $64,999 for men (1,459 | 10.0%) and $30,000 to $34,999 for women (1,494 | 10.8%).
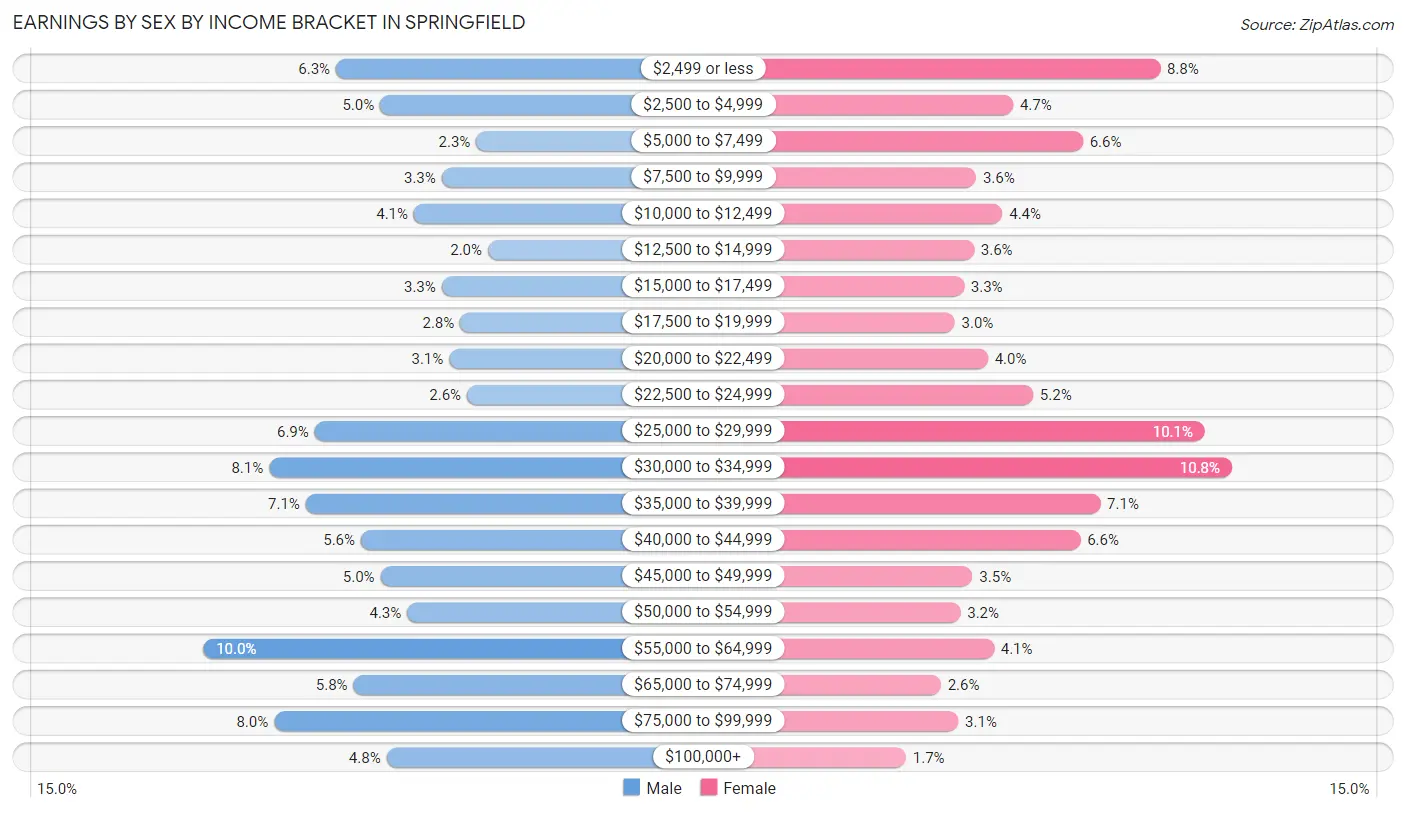
| Income | Male | Female |
| $2,499 or less | 913 (6.2%) | 1,215 (8.8%) |
| $2,500 to $4,999 | 732 (5.0%) | 645 (4.7%) |
| $5,000 to $7,499 | 337 (2.3%) | 915 (6.6%) |
| $7,500 to $9,999 | 480 (3.3%) | 501 (3.6%) |
| $10,000 to $12,499 | 593 (4.1%) | 603 (4.4%) |
| $12,500 to $14,999 | 290 (2.0%) | 493 (3.6%) |
| $15,000 to $17,499 | 479 (3.3%) | 454 (3.3%) |
| $17,500 to $19,999 | 403 (2.8%) | 419 (3.0%) |
| $20,000 to $22,499 | 449 (3.1%) | 547 (4.0%) |
| $22,500 to $24,999 | 376 (2.6%) | 722 (5.2%) |
| $25,000 to $29,999 | 1,002 (6.9%) | 1,389 (10.1%) |
| $30,000 to $34,999 | 1,188 (8.1%) | 1,494 (10.8%) |
| $35,000 to $39,999 | 1,038 (7.1%) | 984 (7.1%) |
| $40,000 to $44,999 | 812 (5.6%) | 906 (6.6%) |
| $45,000 to $49,999 | 731 (5.0%) | 487 (3.5%) |
| $50,000 to $54,999 | 621 (4.3%) | 441 (3.2%) |
| $55,000 to $64,999 | 1,459 (10.0%) | 570 (4.1%) |
| $65,000 to $74,999 | 842 (5.8%) | 365 (2.6%) |
| $75,000 to $99,999 | 1,168 (8.0%) | 432 (3.1%) |
| $100,000+ | 706 (4.8%) | 229 (1.7%) |
| Total | 14,619 (100.0%) | 13,811 (100.0%) |
Earnings by Sex by Educational Attainment in Springfield
Average earnings in Springfield are $40,000 for men and $30,336 for women, a difference of 24.2%. Men with an educational attainment of graduate degree enjoy the highest average annual earnings of $77,734, while those with less than high school education earn the least with $34,758. Women with an educational attainment of graduate degree earn the most with the average annual earnings of $67,692, while those with less than high school education have the smallest earnings of $22,572.
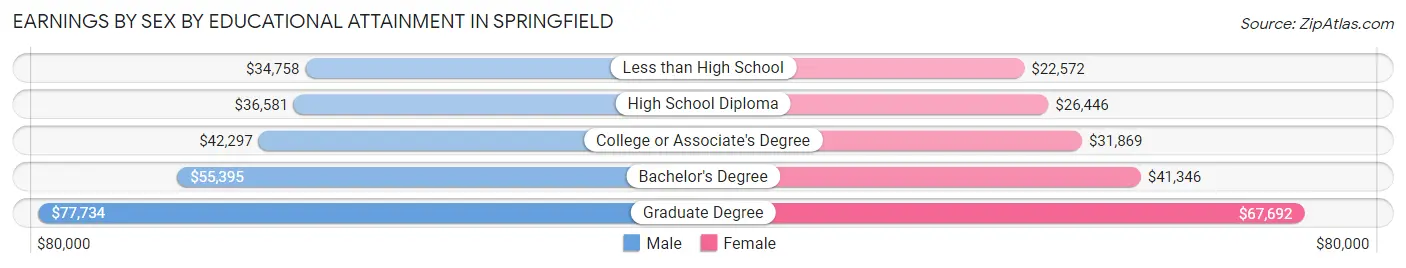
| Educational Attainment | Male Income | Female Income |
| Less than High School | $34,758 | $22,572 |
| High School Diploma | $36,581 | $26,446 |
| College or Associate's Degree | $42,297 | $31,869 |
| Bachelor's Degree | $55,395 | $41,346 |
| Graduate Degree | $77,734 | $67,692 |
| Total | $40,000 | $30,336 |
Family Income in Springfield
Family Income Brackets in Springfield
According to the Springfield family income data, there are 2,778 families falling into the $50,000 to $74,999 income range, which is the most common income bracket and makes up 21.0% of all families. Conversely, the $200,000+ income bracket is the least frequent group with only 331 families (2.5%) belonging to this category.
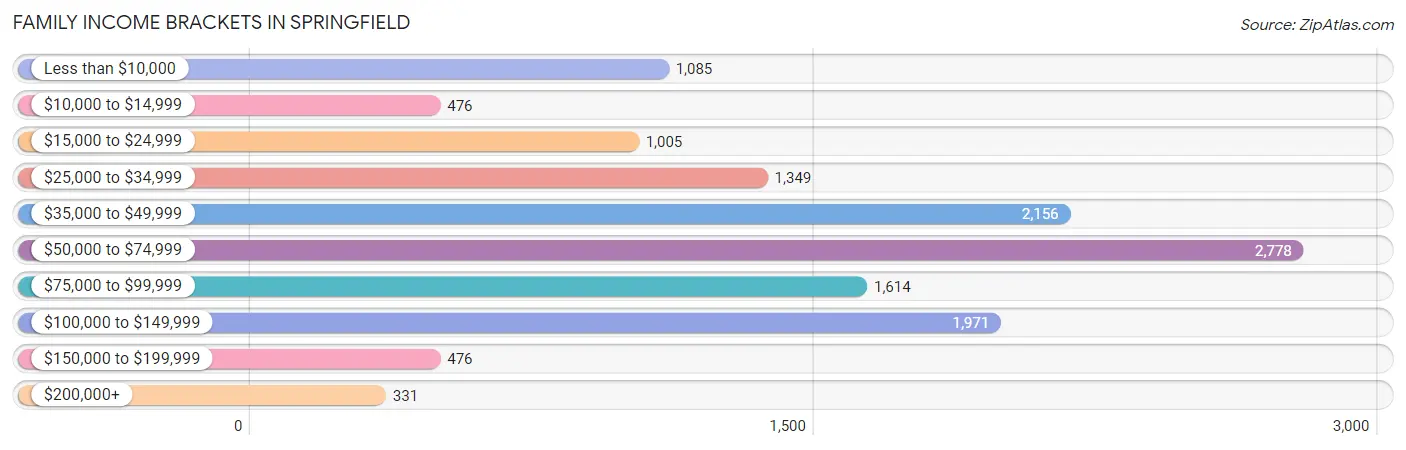
| Income Bracket | # Families | % Families |
| Less than $10,000 | 1,085 | 8.2% |
| $10,000 to $14,999 | 476 | 3.6% |
| $15,000 to $24,999 | 1,005 | 7.6% |
| $25,000 to $34,999 | 1,349 | 10.2% |
| $35,000 to $49,999 | 2,156 | 16.3% |
| $50,000 to $74,999 | 2,778 | 21.0% |
| $75,000 to $99,999 | 1,614 | 12.2% |
| $100,000 to $149,999 | 1,971 | 14.9% |
| $150,000 to $199,999 | 476 | 3.6% |
| $200,000+ | 331 | 2.5% |
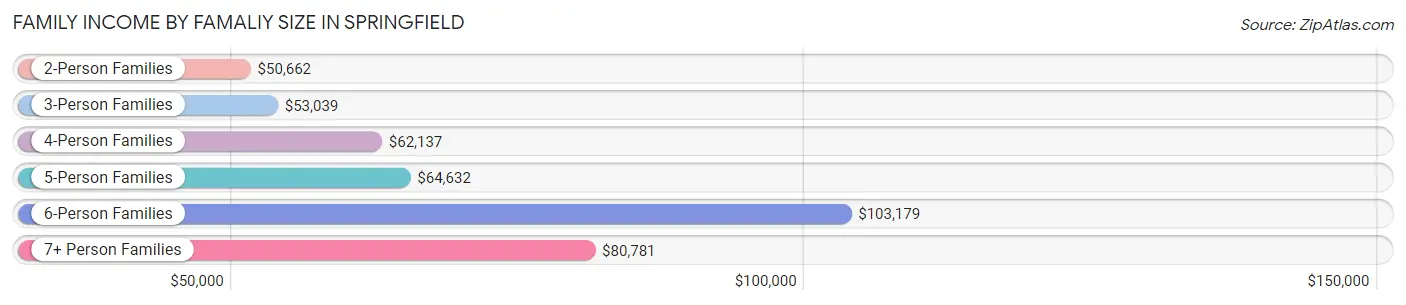
Family Income by Famaliy Size in Springfield
6-person families (267 | 2.0%) account for the highest median family income in Springfield with $103,179 per family, while 2-person families (6,400 | 48.4%) have the highest median income of $25,331 per family member.
| Income Bracket | # Families | Median Income |
| 2-Person Families | 6,400 (48.4%) | $50,662 |
| 3-Person Families | 2,981 (22.5%) | $53,039 |
| 4-Person Families | 2,261 (17.1%) | $62,137 |
| 5-Person Families | 1,178 (8.9%) | $64,632 |
| 6-Person Families | 267 (2.0%) | $103,179 |
| 7+ Person Families | 143 (1.1%) | $80,781 |
| Total | 13,230 (100.0%) | $54,509 |
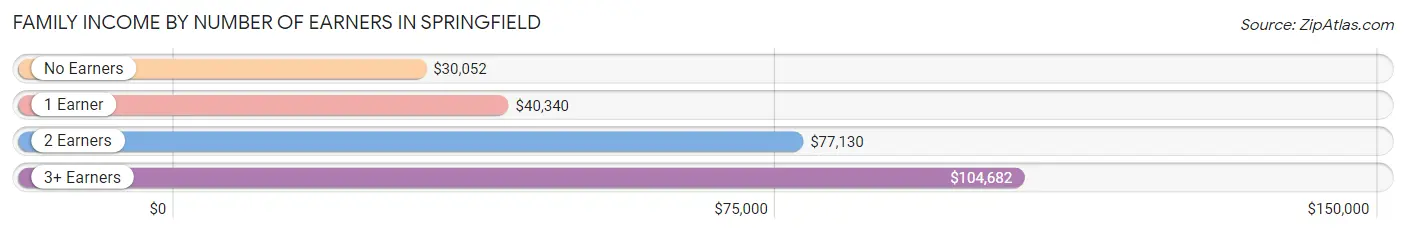
Family Income by Number of Earners in Springfield
The median family income in Springfield is $54,509, with families comprising 3+ earners (1,098) having the highest median family income of $104,682, while families with no earners (2,371) have the lowest median family income of $30,052, accounting for 8.3% and 17.9% of families, respectively.
| Number of Earners | # Families | Median Income |
| No Earners | 2,371 (17.9%) | $30,052 |
| 1 Earner | 5,243 (39.6%) | $40,340 |
| 2 Earners | 4,518 (34.2%) | $77,130 |
| 3+ Earners | 1,098 (8.3%) | $104,682 |
| Total | 13,230 (100.0%) | $54,509 |
Household Income in Springfield
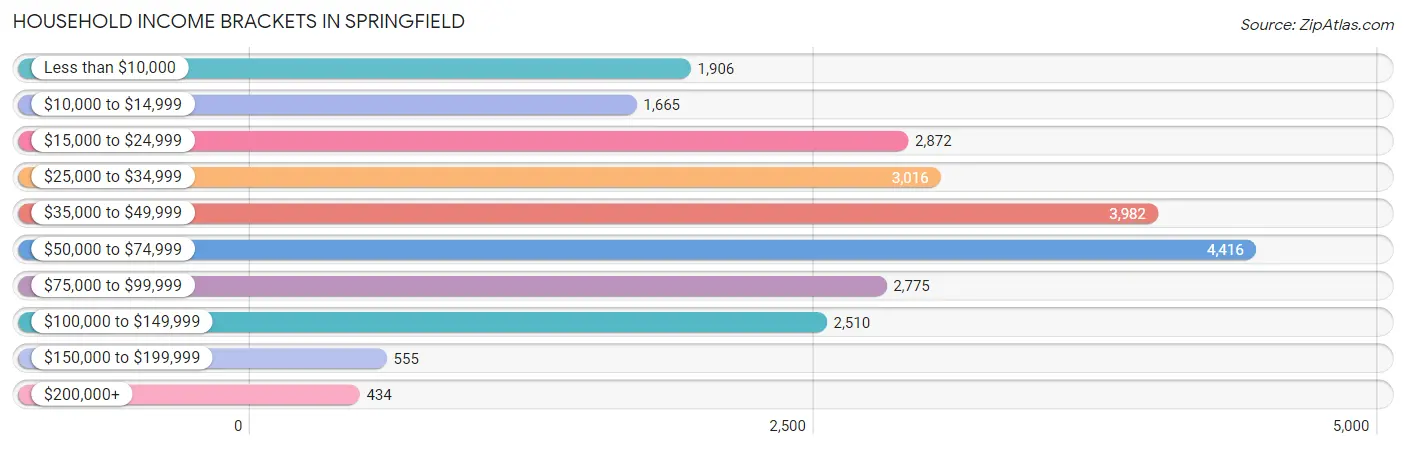
Household Income Brackets in Springfield
With 4,416 households falling in the category, the $50,000 to $74,999 income range is the most frequent in Springfield, accounting for 18.3% of all households. In contrast, only 434 households (1.8%) fall into the $200,000+ income bracket, making it the least populous group.
| Income Bracket | # Households | % Households |
| Less than $10,000 | 1,906 | 7.9% |
| $10,000 to $14,999 | 1,665 | 6.9% |
| $15,000 to $24,999 | 2,872 | 11.9% |
| $25,000 to $34,999 | 3,016 | 12.5% |
| $35,000 to $49,999 | 3,982 | 16.5% |
| $50,000 to $74,999 | 4,416 | 18.3% |
| $75,000 to $99,999 | 2,775 | 11.5% |
| $100,000 to $149,999 | 2,510 | 10.4% |
| $150,000 to $199,999 | 555 | 2.3% |
| $200,000+ | 434 | 1.8% |
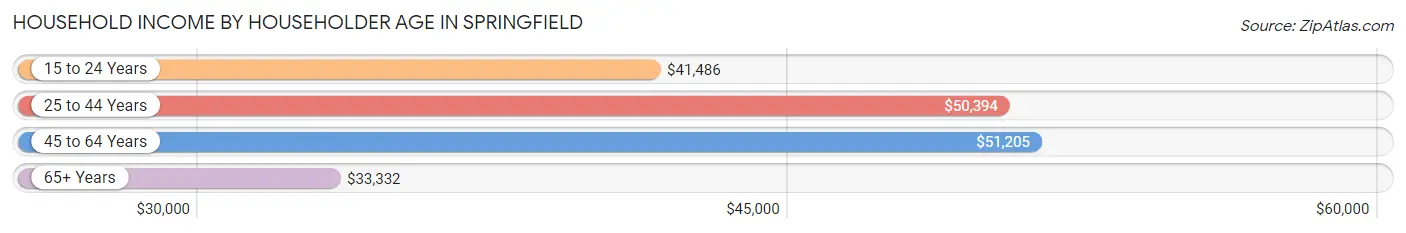
Household Income by Householder Age in Springfield
The median household income in Springfield is $45,113, with the highest median household income of $51,205 found in the 45 to 64 years age bracket for the primary householder. A total of 8,114 households (33.6%) fall into this category. Meanwhile, the 65+ years age bracket for the primary householder has the lowest median household income of $33,332, with 7,045 households (29.2%) in this group.
| Income Bracket | # Households | Median Income |
| 15 to 24 Years | 1,526 (6.3%) | $41,486 |
| 25 to 44 Years | 7,447 (30.9%) | $50,394 |
| 45 to 64 Years | 8,114 (33.6%) | $51,205 |
| 65+ Years | 7,045 (29.2%) | $33,332 |
| Total | 24,132 (100.0%) | $45,113 |
Poverty in Springfield
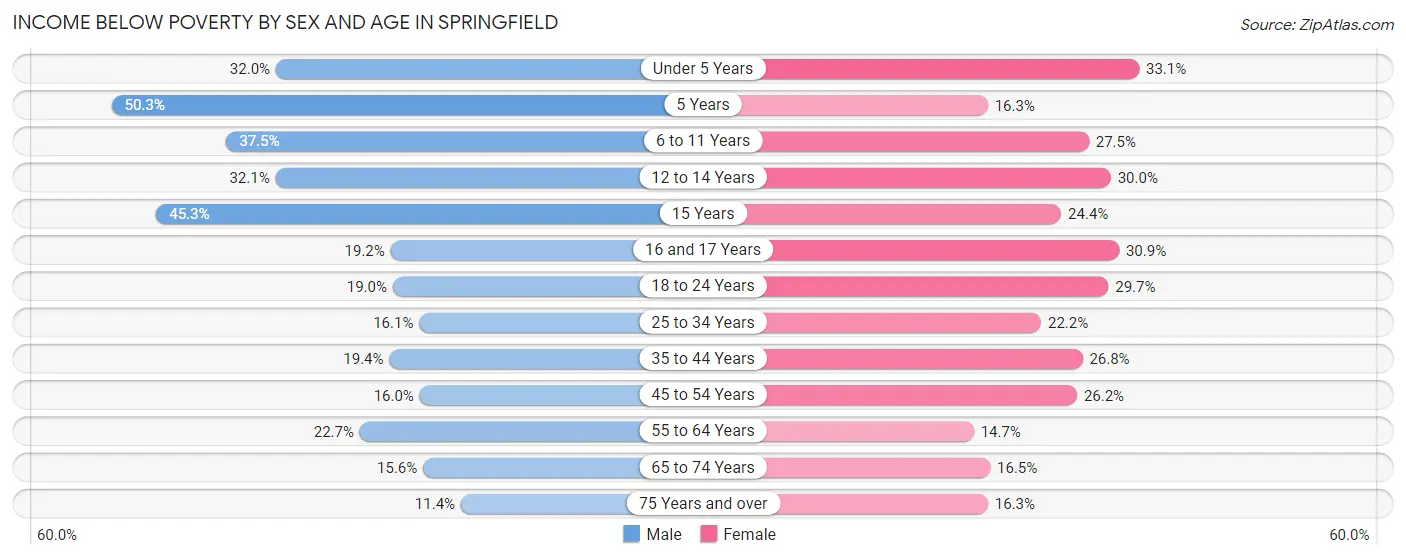
Income Below Poverty by Sex and Age in Springfield
With 22.1% poverty level for males and 23.3% for females among the residents of Springfield, 5 year old males and under 5 year old females are the most vulnerable to poverty, with 160 males (50.3%) and 695 females (33.1%) in their respective age groups living below the poverty level.
| Age Bracket | Male | Female |
| Under 5 Years | 615 (32.0%) | 695 (33.1%) |
| 5 Years | 160 (50.3%) | 78 (16.3%) |
| 6 to 11 Years | 886 (37.5%) | 520 (27.5%) |
| 12 to 14 Years | 343 (32.1%) | 330 (29.9%) |
| 15 Years | 257 (45.3%) | 64 (24.4%) |
| 16 and 17 Years | 132 (19.2%) | 255 (30.9%) |
| 18 to 24 Years | 479 (19.0%) | 785 (29.7%) |
| 25 to 34 Years | 585 (16.1%) | 865 (22.2%) |
| 35 to 44 Years | 590 (19.4%) | 887 (26.8%) |
| 45 to 54 Years | 526 (16.0%) | 791 (26.2%) |
| 55 to 64 Years | 855 (22.7%) | 565 (14.7%) |
| 65 to 74 Years | 377 (15.6%) | 489 (16.5%) |
| 75 Years and over | 165 (11.4%) | 406 (16.3%) |
| Total | 5,970 (22.1%) | 6,730 (23.3%) |
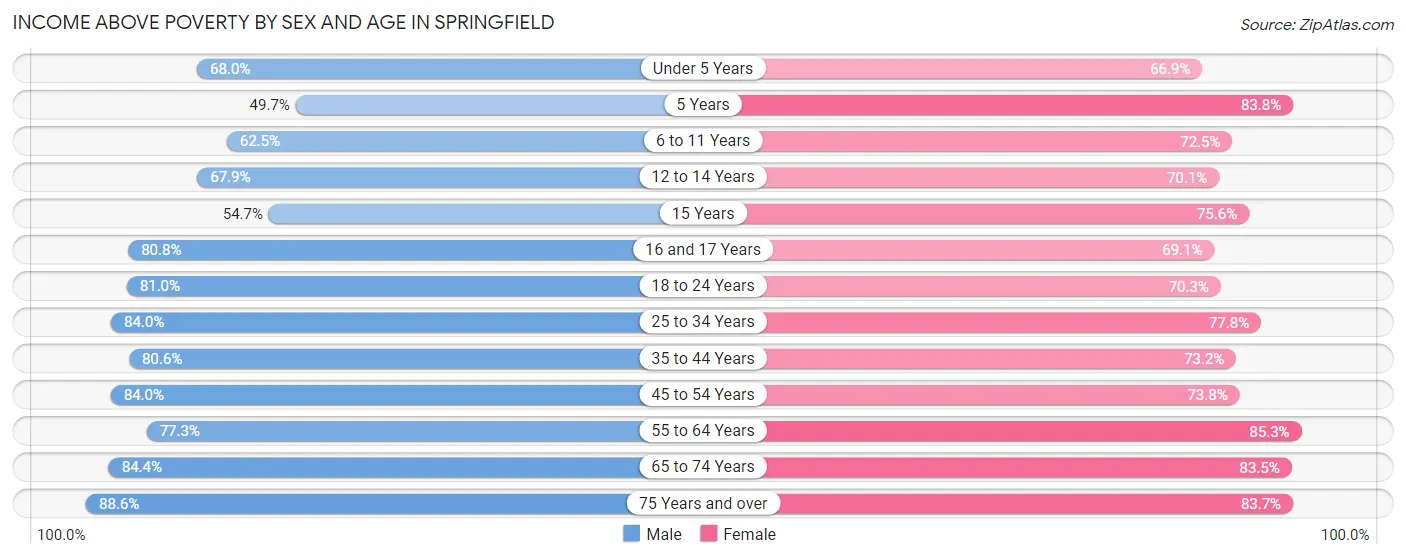
Income Above Poverty by Sex and Age in Springfield
According to the poverty statistics in Springfield, males aged 75 years and over and females aged 55 to 64 years are the age groups that are most secure financially, with 88.6% of males and 85.3% of females in these age groups living above the poverty line.
| Age Bracket | Male | Female |
| Under 5 Years | 1,306 (68.0%) | 1,405 (66.9%) |
| 5 Years | 158 (49.7%) | 402 (83.8%) |
| 6 to 11 Years | 1,475 (62.5%) | 1,370 (72.5%) |
| 12 to 14 Years | 727 (67.9%) | 772 (70.1%) |
| 15 Years | 310 (54.7%) | 198 (75.6%) |
| 16 and 17 Years | 554 (80.8%) | 571 (69.1%) |
| 18 to 24 Years | 2,044 (81.0%) | 1,860 (70.3%) |
| 25 to 34 Years | 3,060 (84.0%) | 3,034 (77.8%) |
| 35 to 44 Years | 2,454 (80.6%) | 2,423 (73.2%) |
| 45 to 54 Years | 2,761 (84.0%) | 2,229 (73.8%) |
| 55 to 64 Years | 2,916 (77.3%) | 3,282 (85.3%) |
| 65 to 74 Years | 2,035 (84.4%) | 2,471 (83.5%) |
| 75 Years and over | 1,281 (88.6%) | 2,089 (83.7%) |
| Total | 21,081 (77.9%) | 22,106 (76.7%) |
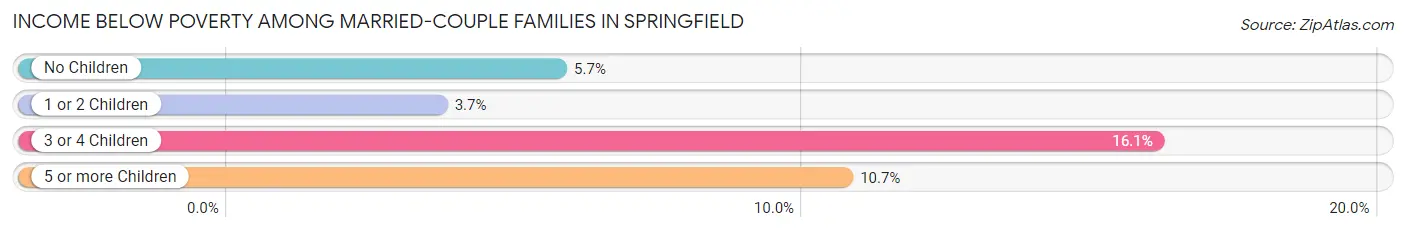
Income Below Poverty Among Married-Couple Families in Springfield
The poverty statistics for married-couple families in Springfield show that 6.0% or 436 of the total 7,211 families live below the poverty line. Families with 3 or 4 children have the highest poverty rate of 16.1%, comprising of 105 families. On the other hand, families with 1 or 2 children have the lowest poverty rate of 3.6%, which includes 84 families.
| Children | Above Poverty | Below Poverty |
| No Children | 3,963 (94.3%) | 241 (5.7%) |
| 1 or 2 Children | 2,216 (96.4%) | 84 (3.6%) |
| 3 or 4 Children | 546 (83.9%) | 105 (16.1%) |
| 5 or more Children | 50 (89.3%) | 6 (10.7%) |
| Total | 6,775 (94.0%) | 436 (6.0%) |
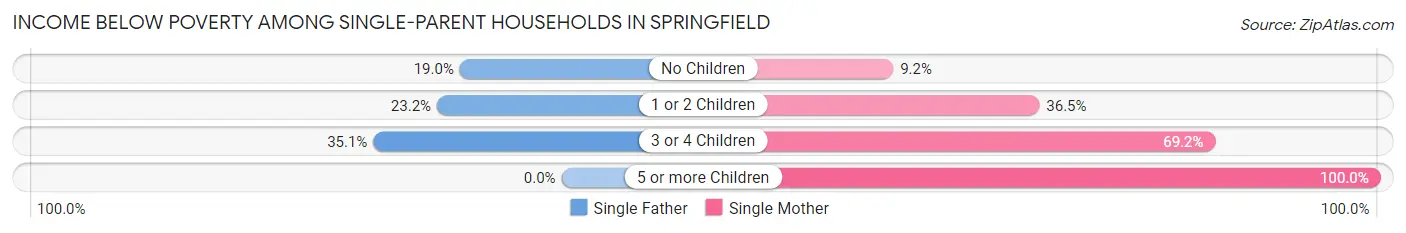
Income Below Poverty Among Single-Parent Households in Springfield
According to the poverty data in Springfield, 22.8% or 374 single-father households and 34.5% or 1,511 single-mother households are living below the poverty line. Among single-father households, those with 3 or 4 children have the highest poverty rate, with 47 households (35.1%) experiencing poverty. Likewise, among single-mother households, those with 5 or more children have the highest poverty rate, with 22 households (100.0%) falling below the poverty line.
| Children | Single Father | Single Mother |
| No Children | 101 (19.0%) | 113 (9.2%) |
| 1 or 2 Children | 226 (23.2%) | 881 (36.4%) |
| 3 or 4 Children | 47 (35.1%) | 495 (69.2%) |
| 5 or more Children | 0 (0.0%) | 22 (100.0%) |
| Total | 374 (22.8%) | 1,511 (34.5%) |
Income Below Poverty Among Married-Couple vs Single-Parent Households in Springfield
The poverty data for Springfield shows that 436 of the married-couple family households (6.0%) and 1,885 of the single-parent households (31.3%) are living below the poverty level. Within the married-couple family households, those with 3 or 4 children have the highest poverty rate, with 105 households (16.1%) falling below the poverty line. Among the single-parent households, those with 5 or more children have the highest poverty rate, with 22 household (100.0%) living below poverty.
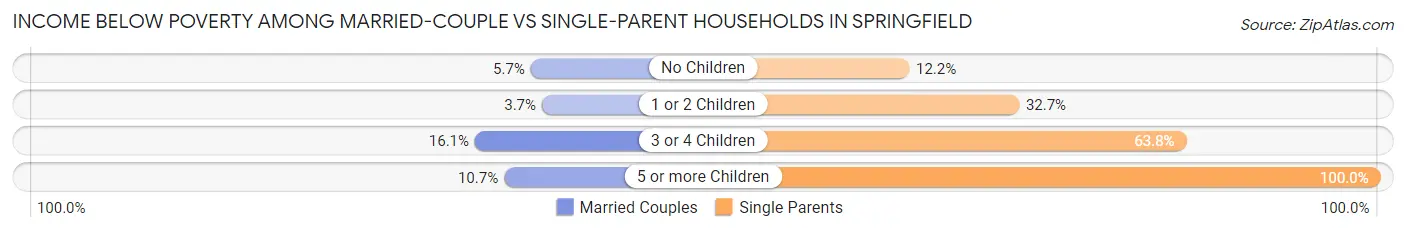
| Children | Married-Couple Families | Single-Parent Households |
| No Children | 241 (5.7%) | 214 (12.2%) |
| 1 or 2 Children | 84 (3.6%) | 1,107 (32.7%) |
| 3 or 4 Children | 105 (16.1%) | 542 (63.8%) |
| 5 or more Children | 6 (10.7%) | 22 (100.0%) |
| Total | 436 (6.0%) | 1,885 (31.3%) |
Employment Characteristics in Springfield
Employment by Class of Employer in Springfield
Among the 24,131 employed individuals in Springfield, private company employees (17,703 | 73.4%), not-for-profit organizations (2,084 | 8.6%), and self-employed (not incorporated) (1,349 | 5.6%) make up the most common classes of employment.
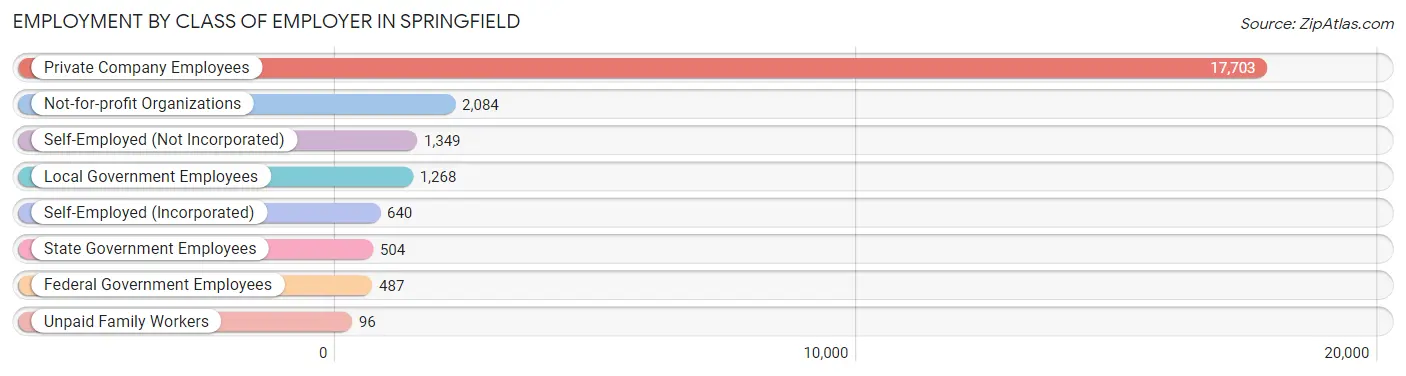
| Employer Class | # Employees | % Employees |
| Private Company Employees | 17,703 | 73.4% |
| Self-Employed (Incorporated) | 640 | 2.6% |
| Self-Employed (Not Incorporated) | 1,349 | 5.6% |
| Not-for-profit Organizations | 2,084 | 8.6% |
| Local Government Employees | 1,268 | 5.2% |
| State Government Employees | 504 | 2.1% |
| Federal Government Employees | 487 | 2.0% |
| Unpaid Family Workers | 96 | 0.4% |
| Total | 24,131 | 100.0% |
Employment Status by Age in Springfield
According to the labor force statistics for Springfield, out of the total population over 16 years of age (45,992), 58.5% or 26,905 individuals are in the labor force, with 9.1% or 2,448 of them unemployed. The age group with the highest labor force participation rate is 25 to 29 years, with 85.5% or 3,452 individuals in the labor force. Within the labor force, the 16 to 19 years age range has the highest percentage of unemployed individuals, with 18.8% or 302 of them being unemployed.
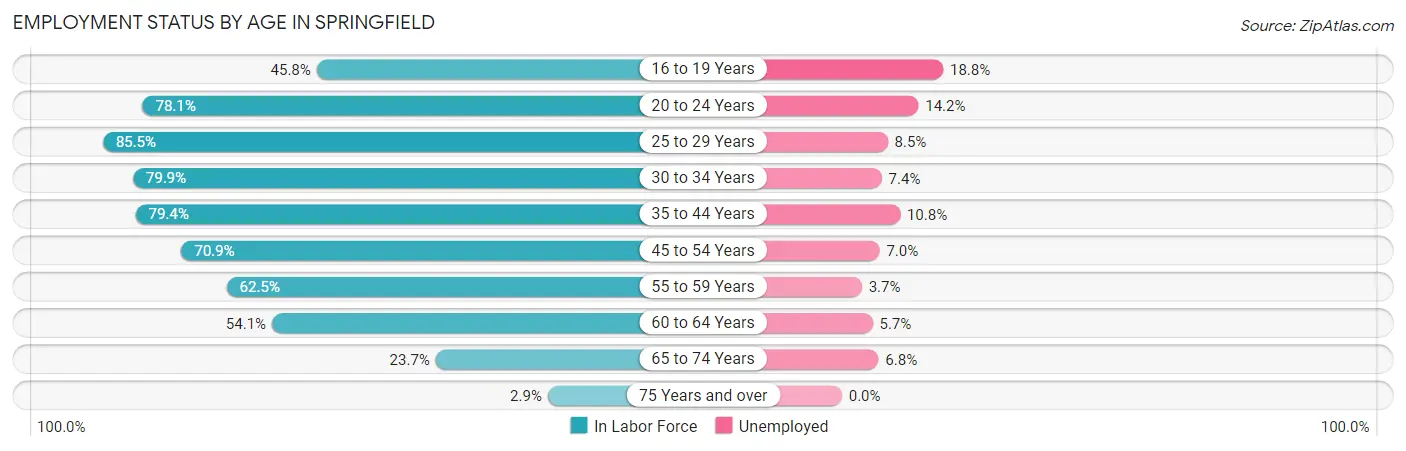
| Age Bracket | In Labor Force | Unemployed |
| 16 to 19 Years | 1,608 (45.8%) | 302 (18.8%) |
| 20 to 24 Years | 3,336 (78.1%) | 474 (14.2%) |
| 25 to 29 Years | 3,452 (85.5%) | 293 (8.5%) |
| 30 to 34 Years | 2,840 (79.9%) | 210 (7.4%) |
| 35 to 44 Years | 5,126 (79.4%) | 554 (10.8%) |
| 45 to 54 Years | 4,567 (70.9%) | 320 (7.0%) |
| 55 to 59 Years | 2,482 (62.5%) | 92 (3.7%) |
| 60 to 64 Years | 2,025 (54.1%) | 115 (5.7%) |
| 65 to 74 Years | 1,328 (23.7%) | 90 (6.8%) |
| 75 Years and over | 128 (2.9%) | 0 (0.0%) |
| Total | 26,905 (58.5%) | 2,448 (9.1%) |
Employment Status by Educational Attainment in Springfield
According to labor force statistics for Springfield, 72.7% of individuals (20,504) out of the total population between 25 and 64 years of age (28,204) are in the labor force, with 7.7% or 1,579 of them being unemployed. The group with the highest labor force participation rate are those with the educational attainment of bachelor's degree or higher, with 85.0% or 3,616 individuals in the labor force. Within the labor force, individuals with high school diploma education have the highest percentage of unemployment, with 11.0% or 777 of them being unemployed.
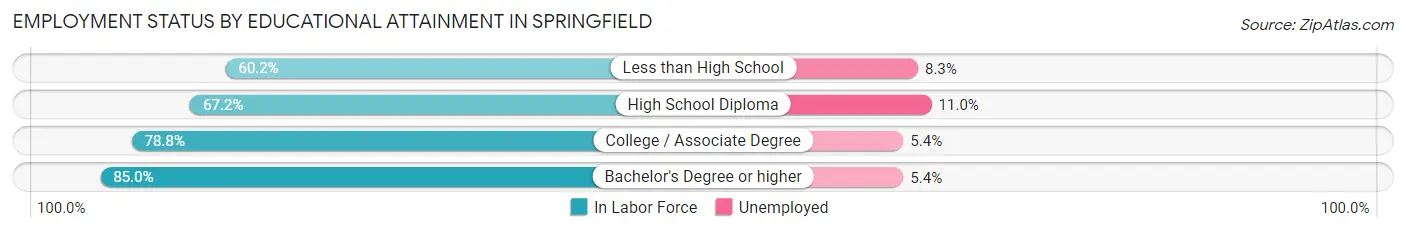
| Educational Attainment | In Labor Force | Unemployed |
| Less than High School | 2,513 (60.2%) | 347 (8.3%) |
| High School Diploma | 7,068 (67.2%) | 1,157 (11.0%) |
| College / Associate Degree | 7,295 (78.8%) | 500 (5.4%) |
| Bachelor's Degree or higher | 3,616 (85.0%) | 230 (5.4%) |
| Total | 20,504 (72.7%) | 2,172 (7.7%) |
Employment Occupations by Sex in Springfield
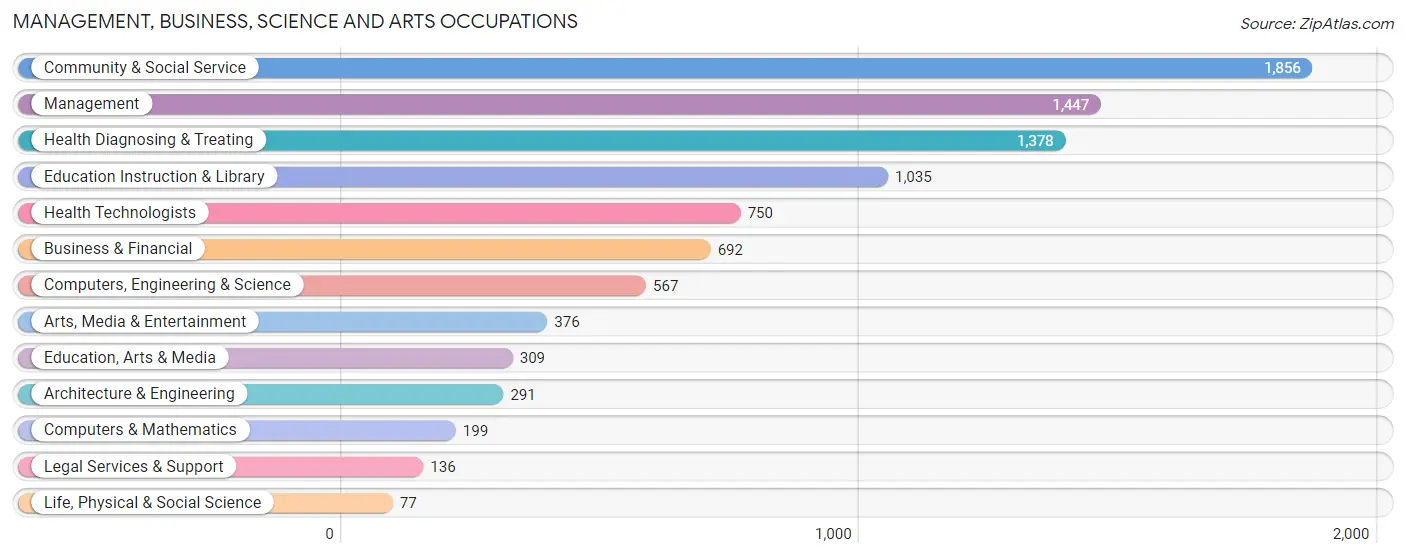
Management, Business, Science and Arts Occupations
The most common Management, Business, Science and Arts occupations in Springfield are Community & Social Service (1,856 | 7.6%), Management (1,447 | 5.9%), Health Diagnosing & Treating (1,378 | 5.7%), Education Instruction & Library (1,035 | 4.2%), and Health Technologists (750 | 3.1%).
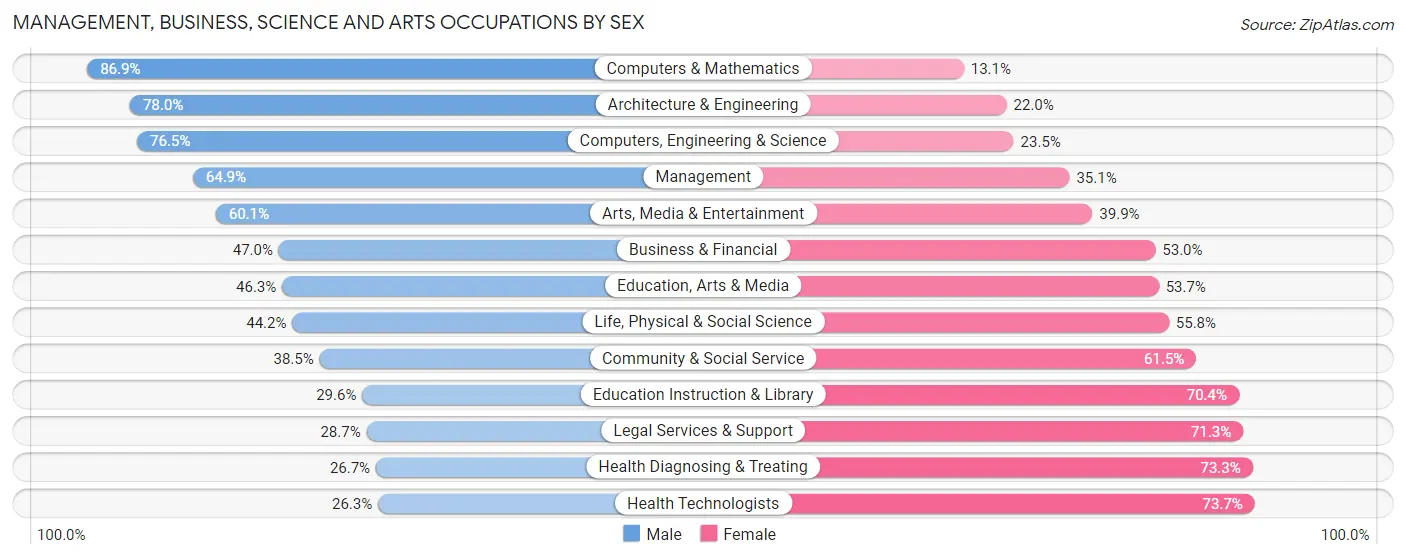
Management, Business, Science and Arts Occupations by Sex
Within the Management, Business, Science and Arts occupations in Springfield, the most male-oriented occupations are Computers & Mathematics (86.9%), Architecture & Engineering (78.0%), and Computers, Engineering & Science (76.5%), while the most female-oriented occupations are Health Technologists (73.7%), Health Diagnosing & Treating (73.3%), and Legal Services & Support (71.3%).
| Occupation | Male | Female |
| Management | 939 (64.9%) | 508 (35.1%) |
| Business & Financial | 325 (47.0%) | 367 (53.0%) |
| Computers, Engineering & Science | 434 (76.5%) | 133 (23.5%) |
| Computers & Mathematics | 173 (86.9%) | 26 (13.1%) |
| Architecture & Engineering | 227 (78.0%) | 64 (22.0%) |
| Life, Physical & Social Science | 34 (44.2%) | 43 (55.8%) |
| Community & Social Service | 714 (38.5%) | 1,142 (61.5%) |
| Education, Arts & Media | 143 (46.3%) | 166 (53.7%) |
| Legal Services & Support | 39 (28.7%) | 97 (71.3%) |
| Education Instruction & Library | 306 (29.6%) | 729 (70.4%) |
| Arts, Media & Entertainment | 226 (60.1%) | 150 (39.9%) |
| Health Diagnosing & Treating | 368 (26.7%) | 1,010 (73.3%) |
| Health Technologists | 197 (26.3%) | 553 (73.7%) |
| Total (Category) | 2,780 (46.8%) | 3,160 (53.2%) |
| Total (Overall) | 12,629 (51.7%) | 11,776 (48.2%) |
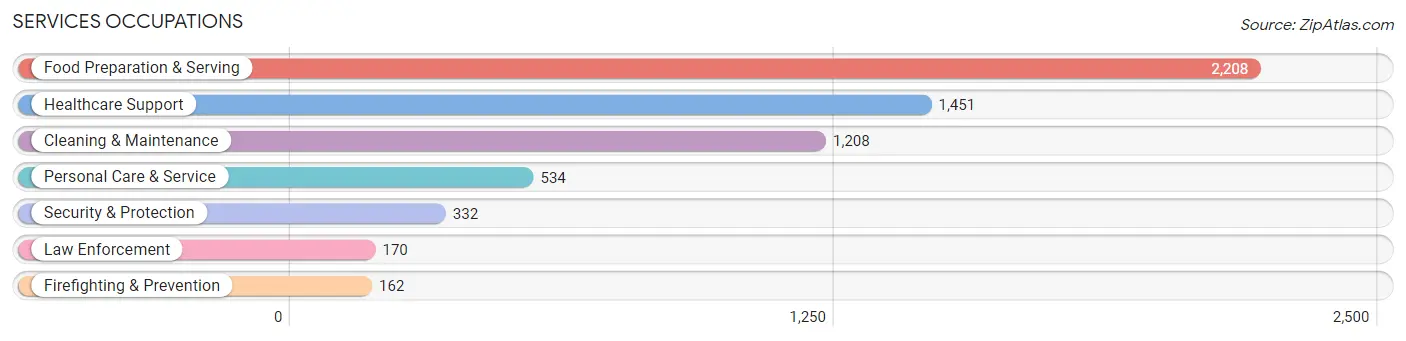
Services Occupations
The most common Services occupations in Springfield are Food Preparation & Serving (2,208 | 9.0%), Healthcare Support (1,451 | 5.9%), Cleaning & Maintenance (1,208 | 5.0%), Personal Care & Service (534 | 2.2%), and Security & Protection (332 | 1.4%).
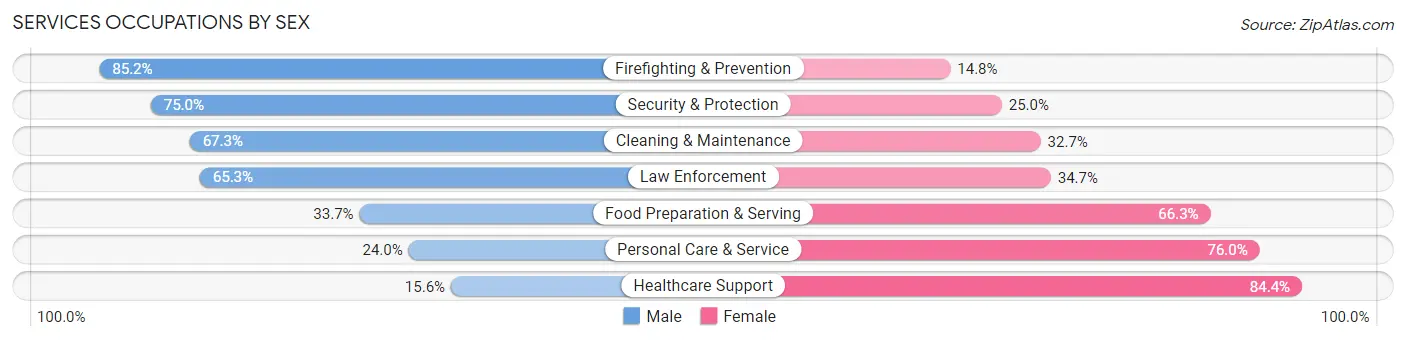
Services Occupations by Sex
Within the Services occupations in Springfield, the most male-oriented occupations are Firefighting & Prevention (85.2%), Security & Protection (75.0%), and Cleaning & Maintenance (67.3%), while the most female-oriented occupations are Healthcare Support (84.4%), Personal Care & Service (76.0%), and Food Preparation & Serving (66.3%).
| Occupation | Male | Female |
| Healthcare Support | 226 (15.6%) | 1,225 (84.4%) |
| Security & Protection | 249 (75.0%) | 83 (25.0%) |
| Firefighting & Prevention | 138 (85.2%) | 24 (14.8%) |
| Law Enforcement | 111 (65.3%) | 59 (34.7%) |
| Food Preparation & Serving | 744 (33.7%) | 1,464 (66.3%) |
| Cleaning & Maintenance | 813 (67.3%) | 395 (32.7%) |
| Personal Care & Service | 128 (24.0%) | 406 (76.0%) |
| Total (Category) | 2,160 (37.7%) | 3,573 (62.3%) |
| Total (Overall) | 12,629 (51.7%) | 11,776 (48.2%) |
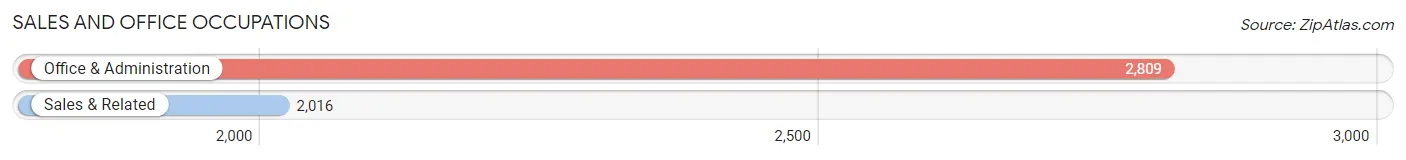
Sales and Office Occupations
The most common Sales and Office occupations in Springfield are Office & Administration (2,809 | 11.5%), and Sales & Related (2,016 | 8.3%).
Sales and Office Occupations by Sex
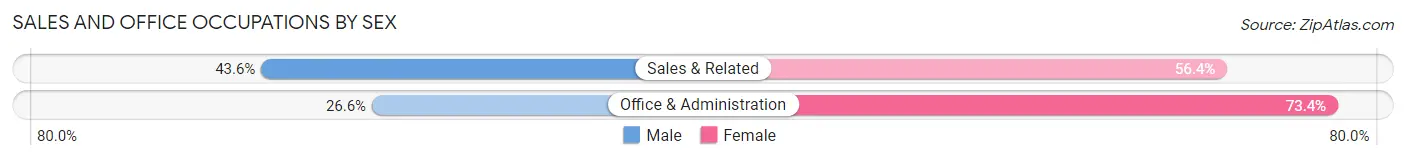
| Occupation | Male | Female |
| Sales & Related | 879 (43.6%) | 1,137 (56.4%) |
| Office & Administration | 746 (26.6%) | 2,063 (73.4%) |
| Total (Category) | 1,625 (33.7%) | 3,200 (66.3%) |
| Total (Overall) | 12,629 (51.7%) | 11,776 (48.2%) |
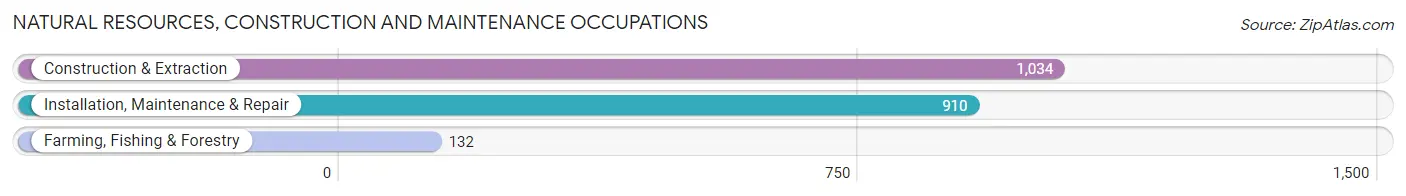
Natural Resources, Construction and Maintenance Occupations
The most common Natural Resources, Construction and Maintenance occupations in Springfield are Construction & Extraction (1,034 | 4.2%), Installation, Maintenance & Repair (910 | 3.7%), and Farming, Fishing & Forestry (132 | 0.5%).
Natural Resources, Construction and Maintenance Occupations by Sex
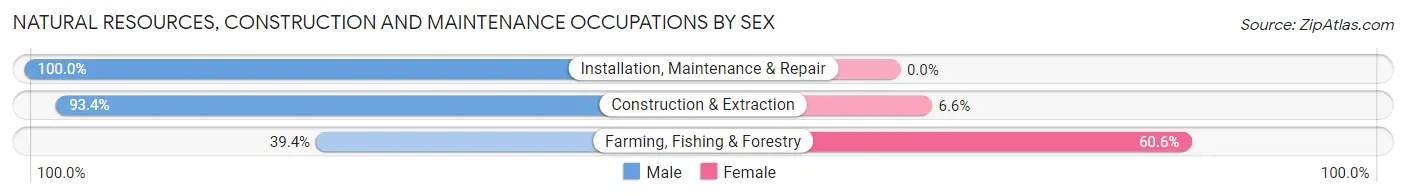
| Occupation | Male | Female |
| Farming, Fishing & Forestry | 52 (39.4%) | 80 (60.6%) |
| Construction & Extraction | 966 (93.4%) | 68 (6.6%) |
| Installation, Maintenance & Repair | 910 (100.0%) | 0 (0.0%) |
| Total (Category) | 1,928 (92.9%) | 148 (7.1%) |
| Total (Overall) | 12,629 (51.7%) | 11,776 (48.2%) |
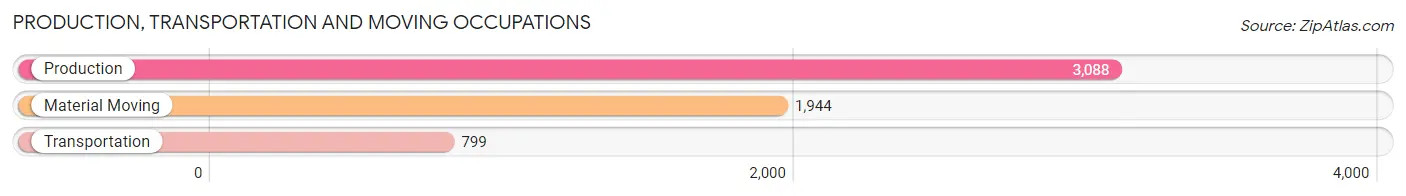
Production, Transportation and Moving Occupations
The most common Production, Transportation and Moving occupations in Springfield are Production (3,088 | 12.7%), Material Moving (1,944 | 8.0%), and Transportation (799 | 3.3%).
Production, Transportation and Moving Occupations by Sex
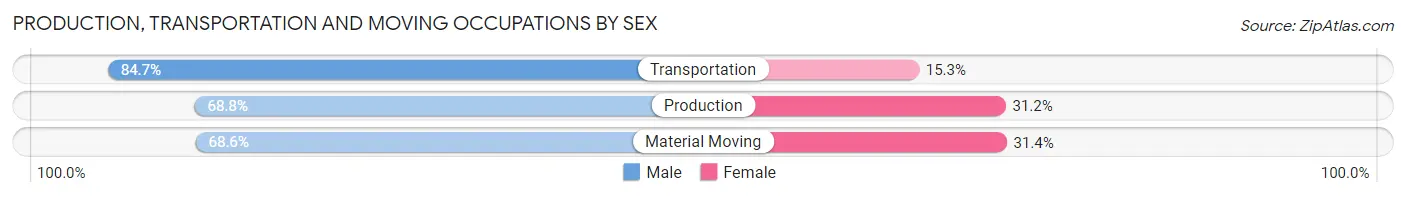
| Occupation | Male | Female |
| Production | 2,125 (68.8%) | 963 (31.2%) |
| Transportation | 677 (84.7%) | 122 (15.3%) |
| Material Moving | 1,334 (68.6%) | 610 (31.4%) |
| Total (Category) | 4,136 (70.9%) | 1,695 (29.1%) |
| Total (Overall) | 12,629 (51.7%) | 11,776 (48.2%) |
Employment Industries by Sex in Springfield
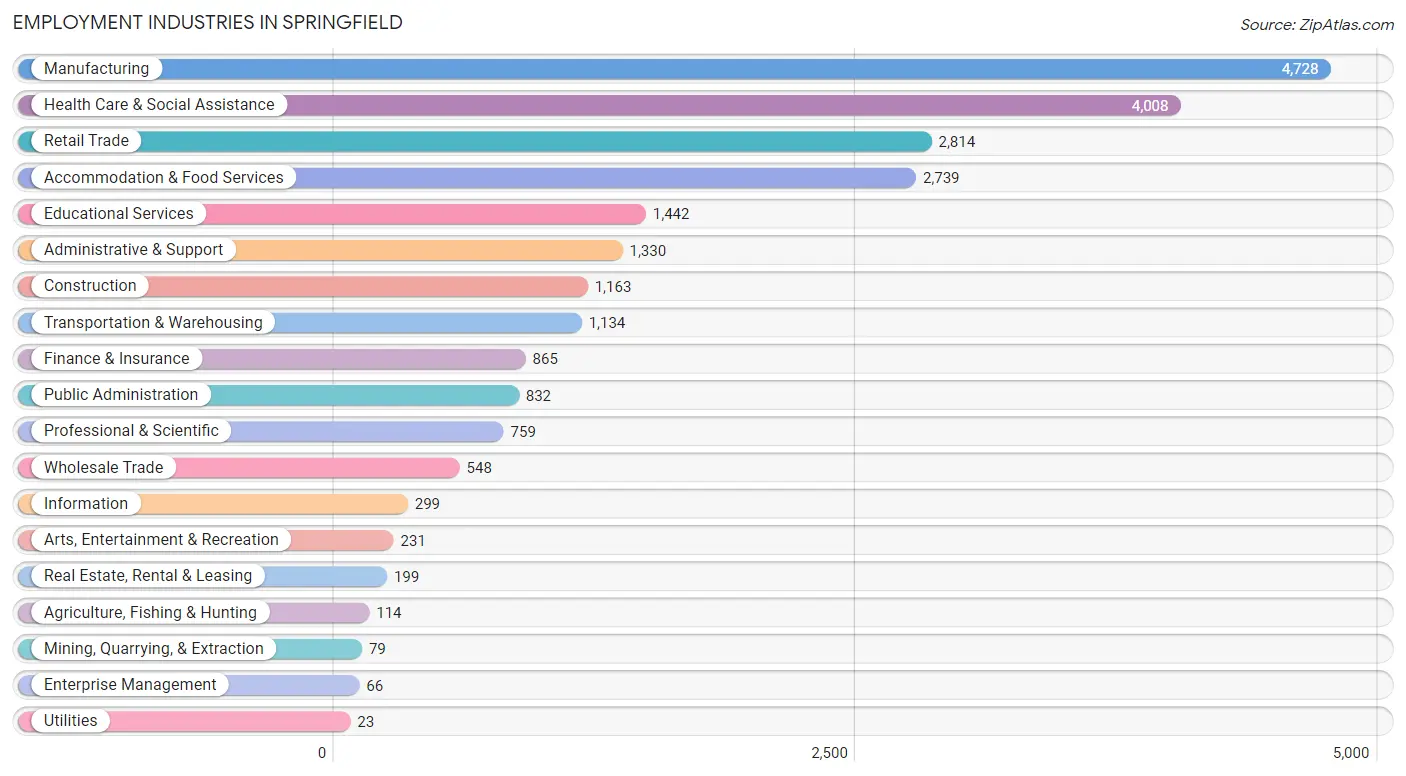
Employment Industries in Springfield
The major employment industries in Springfield include Manufacturing (4,728 | 19.4%), Health Care & Social Assistance (4,008 | 16.4%), Retail Trade (2,814 | 11.5%), Accommodation & Food Services (2,739 | 11.2%), and Educational Services (1,442 | 5.9%).
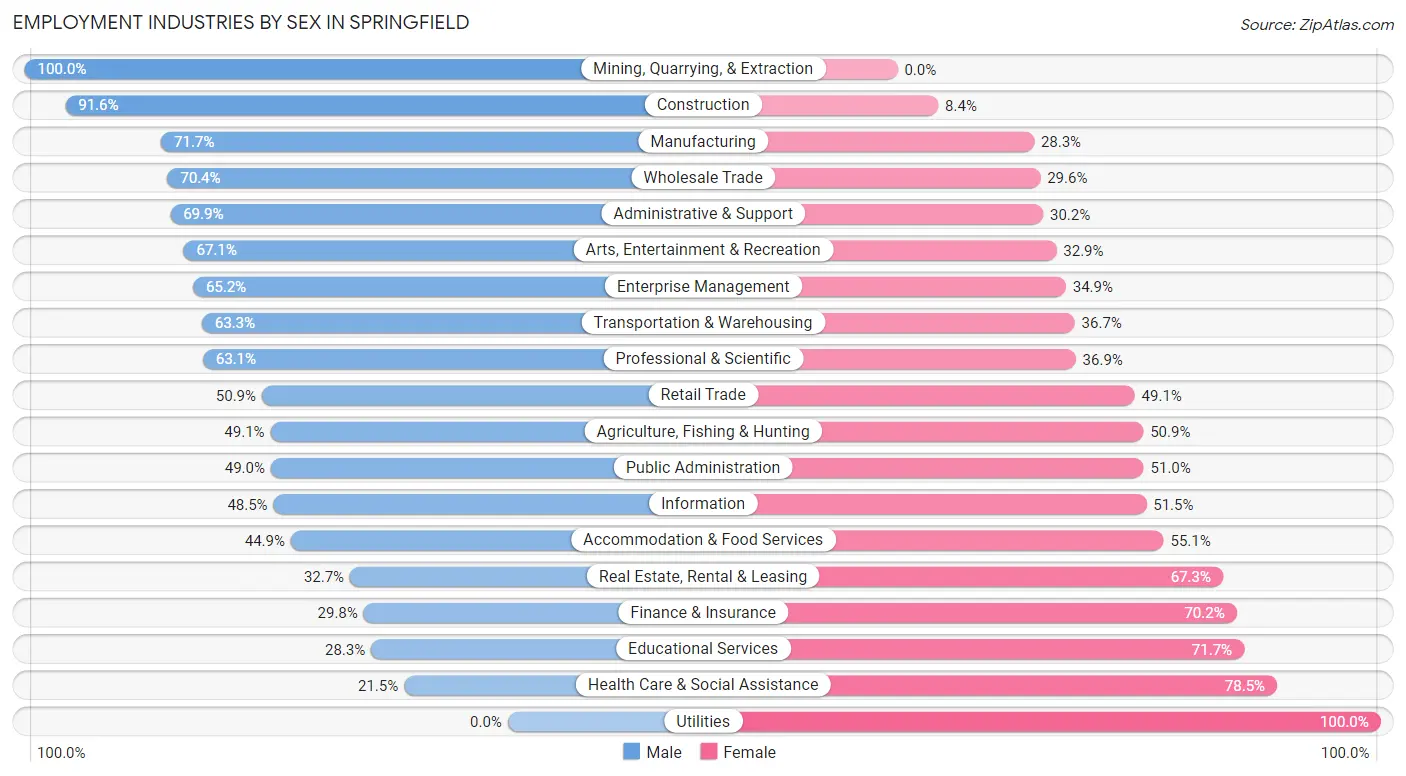
Employment Industries by Sex in Springfield
The Springfield industries that see more men than women are Mining, Quarrying, & Extraction (100.0%), Construction (91.6%), and Manufacturing (71.7%), whereas the industries that tend to have a higher number of women are Utilities (100.0%), Health Care & Social Assistance (78.5%), and Educational Services (71.7%).
| Industry | Male | Female |
| Agriculture, Fishing & Hunting | 56 (49.1%) | 58 (50.9%) |
| Mining, Quarrying, & Extraction | 79 (100.0%) | 0 (0.0%) |
| Construction | 1,065 (91.6%) | 98 (8.4%) |
| Manufacturing | 3,392 (71.7%) | 1,336 (28.3%) |
| Wholesale Trade | 386 (70.4%) | 162 (29.6%) |
| Retail Trade | 1,432 (50.9%) | 1,382 (49.1%) |
| Transportation & Warehousing | 718 (63.3%) | 416 (36.7%) |
| Utilities | 0 (0.0%) | 23 (100.0%) |
| Information | 145 (48.5%) | 154 (51.5%) |
| Finance & Insurance | 258 (29.8%) | 607 (70.2%) |
| Real Estate, Rental & Leasing | 65 (32.7%) | 134 (67.3%) |
| Professional & Scientific | 479 (63.1%) | 280 (36.9%) |
| Enterprise Management | 43 (65.1%) | 23 (34.8%) |
| Administrative & Support | 929 (69.9%) | 401 (30.1%) |
| Educational Services | 408 (28.3%) | 1,034 (71.7%) |
| Health Care & Social Assistance | 860 (21.5%) | 3,148 (78.5%) |
| Arts, Entertainment & Recreation | 155 (67.1%) | 76 (32.9%) |
| Accommodation & Food Services | 1,230 (44.9%) | 1,509 (55.1%) |
| Public Administration | 408 (49.0%) | 424 (51.0%) |
| Total | 12,629 (51.7%) | 11,776 (48.2%) |
Education in Springfield
School Enrollment in Springfield
The most common levels of schooling among the 13,855 students in Springfield are high school (3,359 | 24.2%), middle school (2,960 | 21.4%), and elementary school (2,788 | 20.1%).
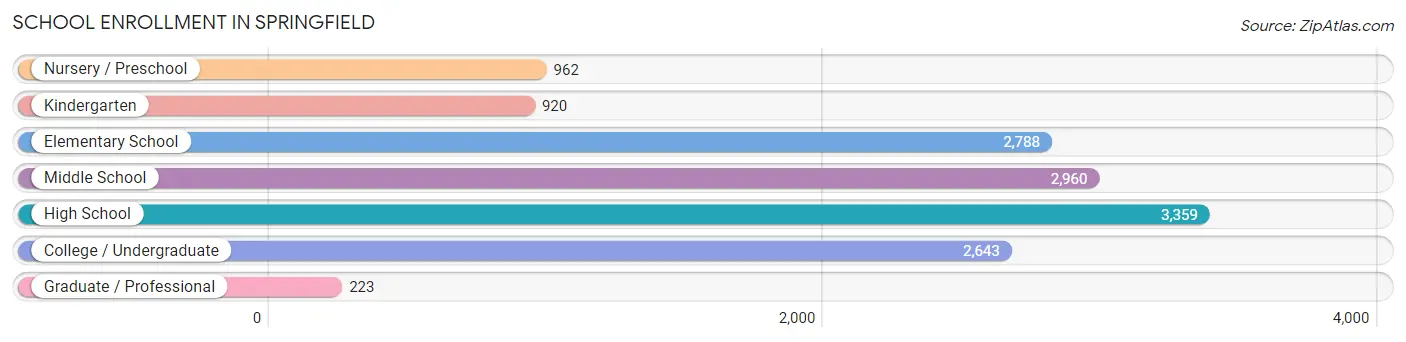
| School Level | # Students | % Students |
| Nursery / Preschool | 962 | 6.9% |
| Kindergarten | 920 | 6.6% |
| Elementary School | 2,788 | 20.1% |
| Middle School | 2,960 | 21.4% |
| High School | 3,359 | 24.2% |
| College / Undergraduate | 2,643 | 19.1% |
| Graduate / Professional | 223 | 1.6% |
| Total | 13,855 | 100.0% |
School Enrollment by Age by Funding Source in Springfield
Out of a total of 13,855 students who are enrolled in schools in Springfield, 3,228 (23.3%) attend a private institution, while the remaining 10,627 (76.7%) are enrolled in public schools. The age group of 18 to 19 year olds has the highest likelihood of being enrolled in private schools, with 816 (60.9% in the age bracket) enrolled. Conversely, the age group of 3 to 4 year olds has the lowest likelihood of being enrolled in a private school, with 643 (91.5% in the age bracket) attending a public institution.
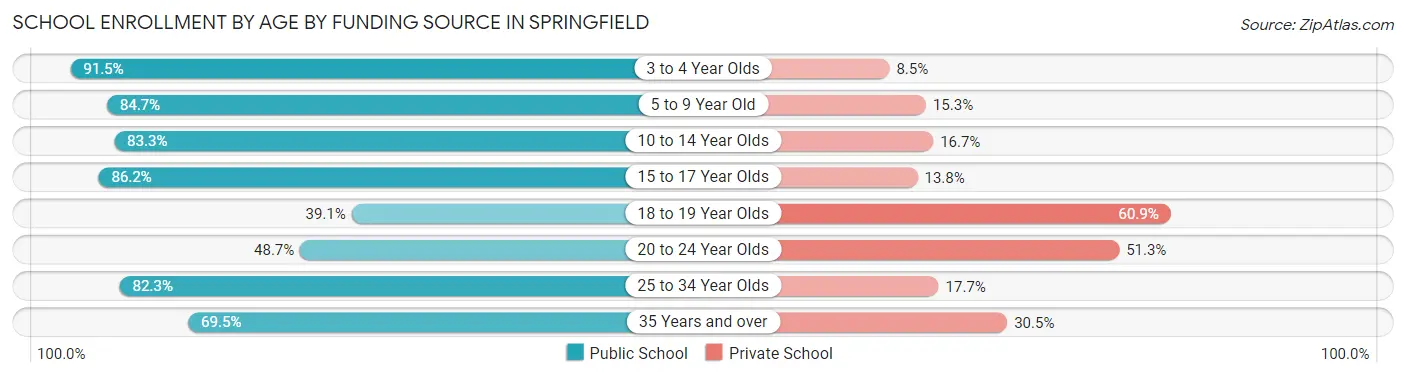
| Age Bracket | Public School | Private School |
| 3 to 4 Year Olds | 643 (91.5%) | 60 (8.5%) |
| 5 to 9 Year Old | 2,889 (84.7%) | 523 (15.3%) |
| 10 to 14 Year Olds | 3,181 (83.3%) | 637 (16.7%) |
| 15 to 17 Year Olds | 1,975 (86.2%) | 315 (13.8%) |
| 18 to 19 Year Olds | 524 (39.1%) | 816 (60.9%) |
| 20 to 24 Year Olds | 589 (48.7%) | 621 (51.3%) |
| 25 to 34 Year Olds | 507 (82.3%) | 109 (17.7%) |
| 35 Years and over | 324 (69.5%) | 142 (30.5%) |
| Total | 10,627 (76.7%) | 3,228 (23.3%) |
Educational Attainment by Field of Study in Springfield
Education (1,109 | 18.8%), business (1,080 | 18.3%), science & technology (746 | 12.6%), social sciences (613 | 10.4%), and arts & humanities (397 | 6.7%) are the most common fields of study among 5,908 individuals in Springfield who have obtained a bachelor's degree or higher.
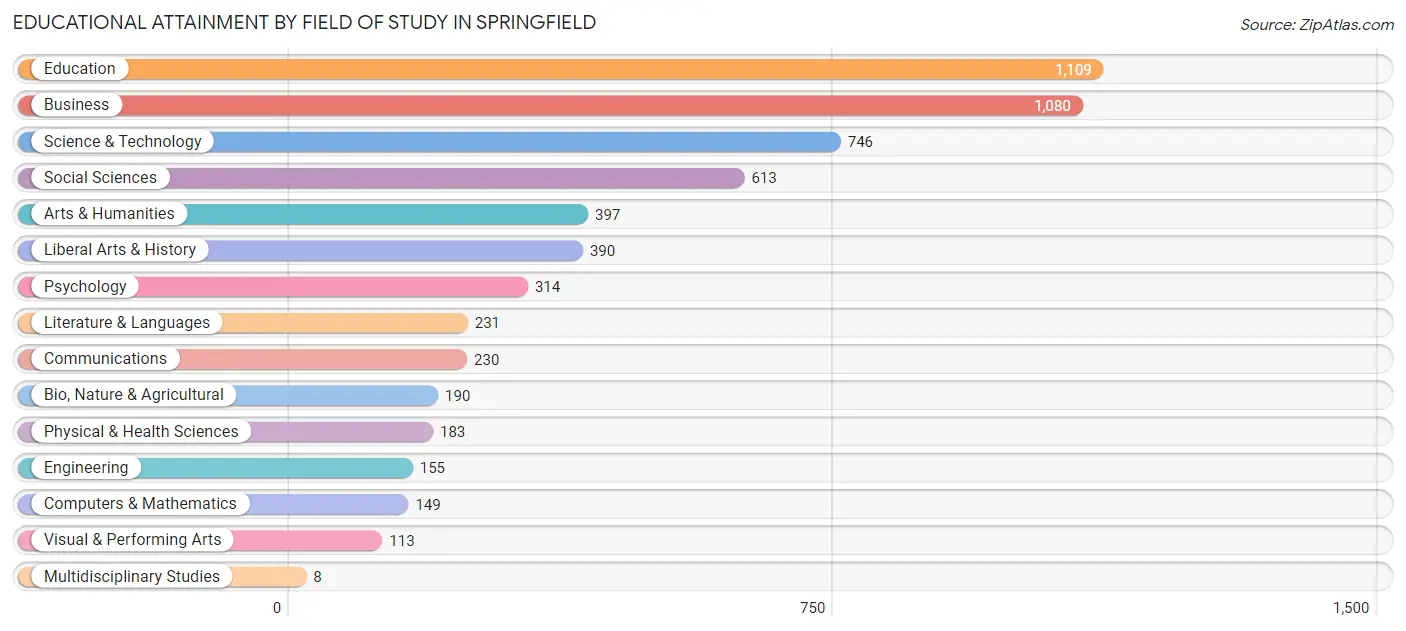
| Field of Study | # Graduates | % Graduates |
| Computers & Mathematics | 149 | 2.5% |
| Bio, Nature & Agricultural | 190 | 3.2% |
| Physical & Health Sciences | 183 | 3.1% |
| Psychology | 314 | 5.3% |
| Social Sciences | 613 | 10.4% |
| Engineering | 155 | 2.6% |
| Multidisciplinary Studies | 8 | 0.1% |
| Science & Technology | 746 | 12.6% |
| Business | 1,080 | 18.3% |
| Education | 1,109 | 18.8% |
| Literature & Languages | 231 | 3.9% |
| Liberal Arts & History | 390 | 6.6% |
| Visual & Performing Arts | 113 | 1.9% |
| Communications | 230 | 3.9% |
| Arts & Humanities | 397 | 6.7% |
| Total | 5,908 | 100.0% |
Transportation & Commute in Springfield
Vehicle Availability by Sex in Springfield
The most prevalent vehicle ownership categories in Springfield are males with 2 vehicles (4,849, accounting for 39.1%) and females with 2 vehicles (4,514, making up 43.3%).
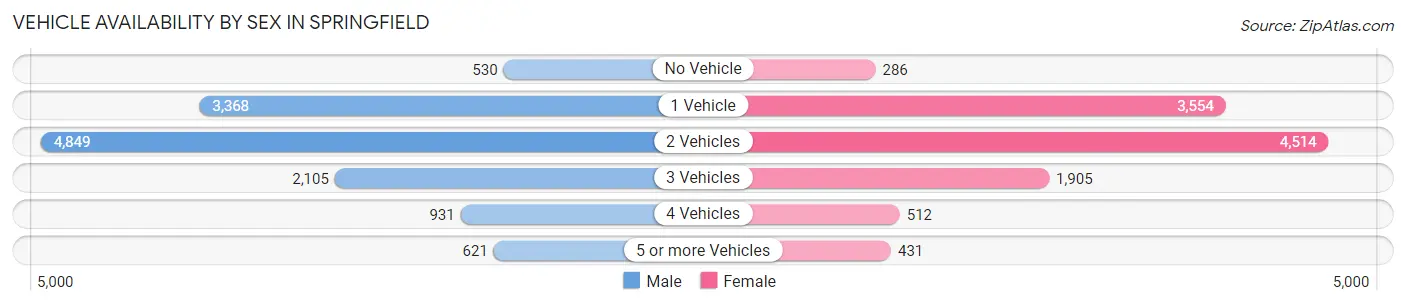
| Vehicles Available | Male | Female |
| No Vehicle | 530 (4.3%) | 286 (2.5%) |
| 1 Vehicle | 3,368 (27.2%) | 3,554 (31.7%) |
| 2 Vehicles | 4,849 (39.1%) | 4,514 (40.3%) |
| 3 Vehicles | 2,105 (17.0%) | 1,905 (17.0%) |
| 4 Vehicles | 931 (7.5%) | 512 (4.6%) |
| 5 or more Vehicles | 621 (5.0%) | 431 (3.8%) |
| Total | 12,404 (100.0%) | 11,202 (100.0%) |
Commute Time in Springfield
The most frequently occuring commute durations in Springfield are 15 to 19 minutes (4,448 commuters, 19.6%), 10 to 14 minutes (4,313 commuters, 19.0%), and 5 to 9 minutes (3,822 commuters, 16.8%).
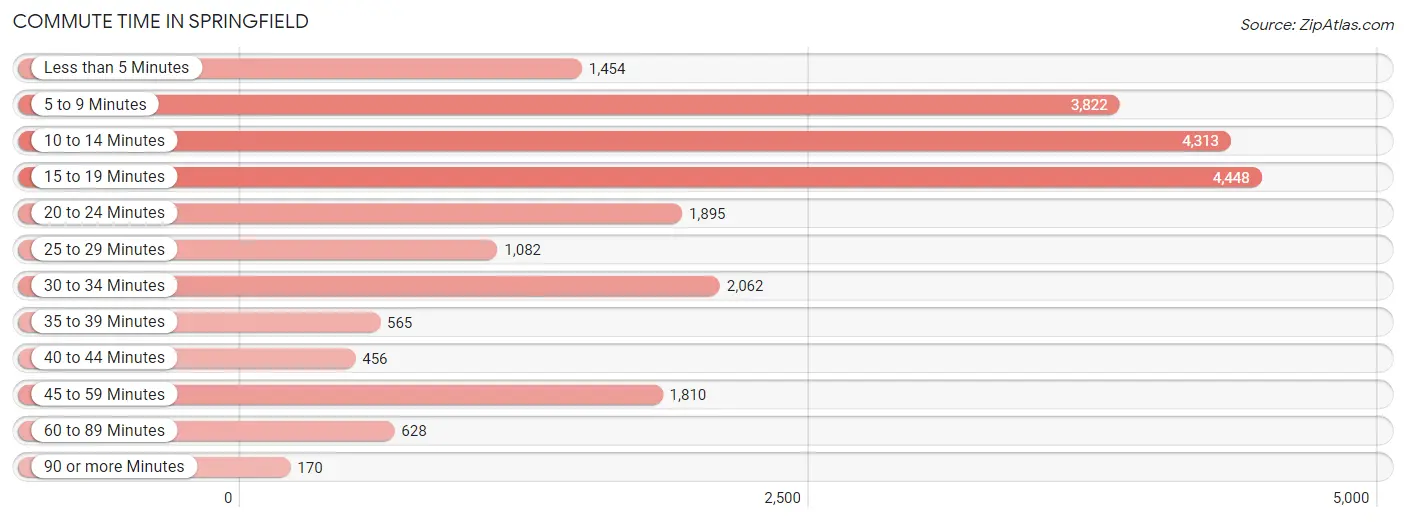
| Commute Time | # Commuters | % Commuters |
| Less than 5 Minutes | 1,454 | 6.4% |
| 5 to 9 Minutes | 3,822 | 16.8% |
| 10 to 14 Minutes | 4,313 | 19.0% |
| 15 to 19 Minutes | 4,448 | 19.6% |
| 20 to 24 Minutes | 1,895 | 8.4% |
| 25 to 29 Minutes | 1,082 | 4.8% |
| 30 to 34 Minutes | 2,062 | 9.1% |
| 35 to 39 Minutes | 565 | 2.5% |
| 40 to 44 Minutes | 456 | 2.0% |
| 45 to 59 Minutes | 1,810 | 8.0% |
| 60 to 89 Minutes | 628 | 2.8% |
| 90 or more Minutes | 170 | 0.7% |
Commute Time by Sex in Springfield
The most common commute times in Springfield are 15 to 19 minutes (2,342 commuters, 19.4%) for males and 10 to 14 minutes (2,385 commuters, 22.4%) for females.
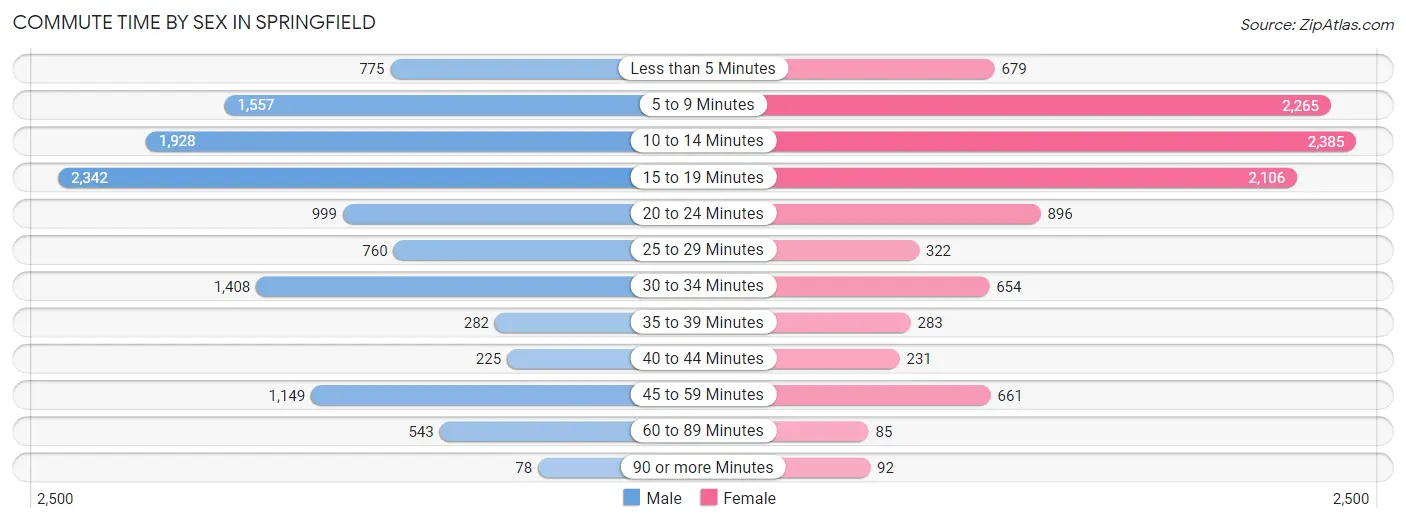
| Commute Time | Male | Female |
| Less than 5 Minutes | 775 (6.4%) | 679 (6.4%) |
| 5 to 9 Minutes | 1,557 (12.9%) | 2,265 (21.2%) |
| 10 to 14 Minutes | 1,928 (16.0%) | 2,385 (22.4%) |
| 15 to 19 Minutes | 2,342 (19.4%) | 2,106 (19.8%) |
| 20 to 24 Minutes | 999 (8.3%) | 896 (8.4%) |
| 25 to 29 Minutes | 760 (6.3%) | 322 (3.0%) |
| 30 to 34 Minutes | 1,408 (11.7%) | 654 (6.1%) |
| 35 to 39 Minutes | 282 (2.3%) | 283 (2.7%) |
| 40 to 44 Minutes | 225 (1.9%) | 231 (2.2%) |
| 45 to 59 Minutes | 1,149 (9.5%) | 661 (6.2%) |
| 60 to 89 Minutes | 543 (4.5%) | 85 (0.8%) |
| 90 or more Minutes | 78 (0.6%) | 92 (0.9%) |
Time of Departure to Work by Sex in Springfield
The most frequent times of departure to work in Springfield are 4:00 PM to 11:59 PM (1,715, 14.2%) for males and 7:30 AM to 7:59 AM (1,431, 13.4%) for females.
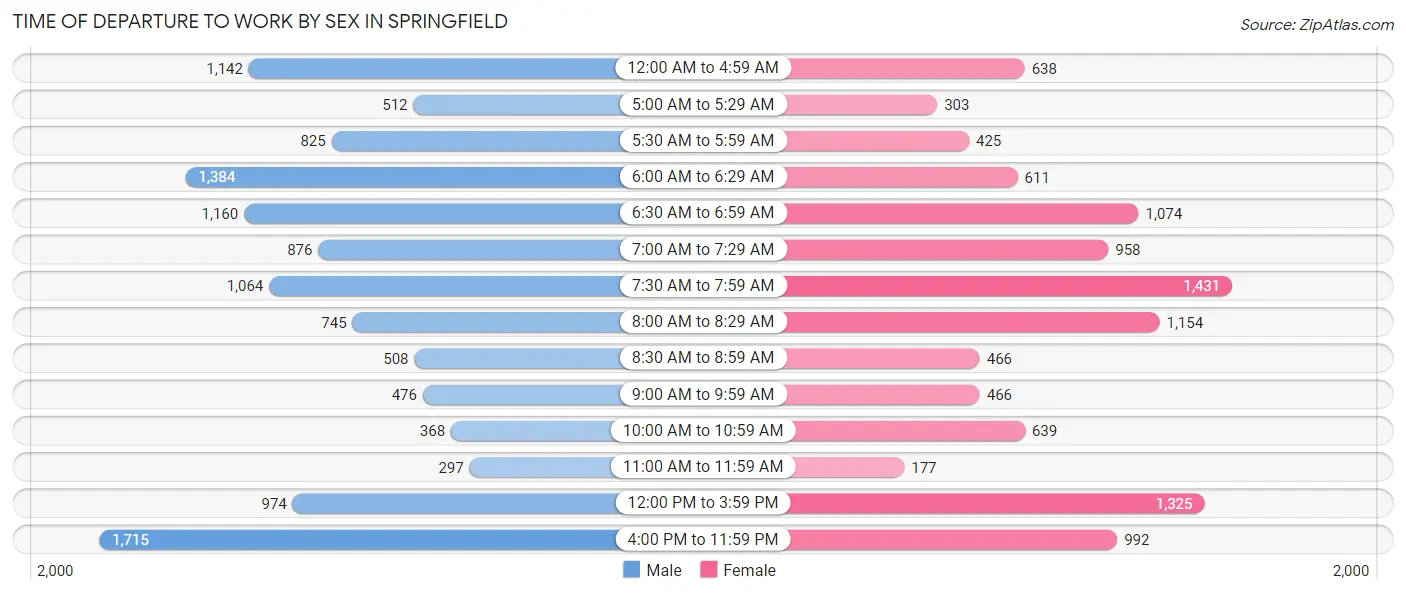
| Time of Departure | Male | Female |
| 12:00 AM to 4:59 AM | 1,142 (9.5%) | 638 (6.0%) |
| 5:00 AM to 5:29 AM | 512 (4.3%) | 303 (2.8%) |
| 5:30 AM to 5:59 AM | 825 (6.9%) | 425 (4.0%) |
| 6:00 AM to 6:29 AM | 1,384 (11.5%) | 611 (5.7%) |
| 6:30 AM to 6:59 AM | 1,160 (9.6%) | 1,074 (10.1%) |
| 7:00 AM to 7:29 AM | 876 (7.3%) | 958 (9.0%) |
| 7:30 AM to 7:59 AM | 1,064 (8.8%) | 1,431 (13.4%) |
| 8:00 AM to 8:29 AM | 745 (6.2%) | 1,154 (10.8%) |
| 8:30 AM to 8:59 AM | 508 (4.2%) | 466 (4.4%) |
| 9:00 AM to 9:59 AM | 476 (4.0%) | 466 (4.4%) |
| 10:00 AM to 10:59 AM | 368 (3.0%) | 639 (6.0%) |
| 11:00 AM to 11:59 AM | 297 (2.5%) | 177 (1.7%) |
| 12:00 PM to 3:59 PM | 974 (8.1%) | 1,325 (12.4%) |
| 4:00 PM to 11:59 PM | 1,715 (14.2%) | 992 (9.3%) |
| Total | 12,046 (100.0%) | 10,659 (100.0%) |
Housing Occupancy in Springfield
Occupancy by Ownership in Springfield
Of the total 24,132 dwellings in Springfield, owner-occupied units account for 12,410 (51.4%), while renter-occupied units make up 11,722 (48.6%).
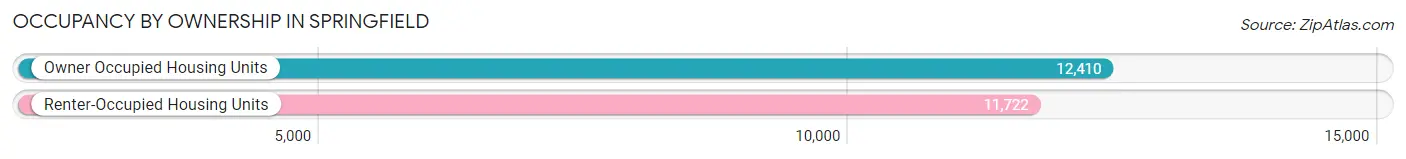
| Occupancy | # Housing Units | % Housing Units |
| Owner Occupied Housing Units | 12,410 | 51.4% |
| Renter-Occupied Housing Units | 11,722 | 48.6% |
| Total Occupied Housing Units | 24,132 | 100.0% |
Occupancy by Household Size in Springfield
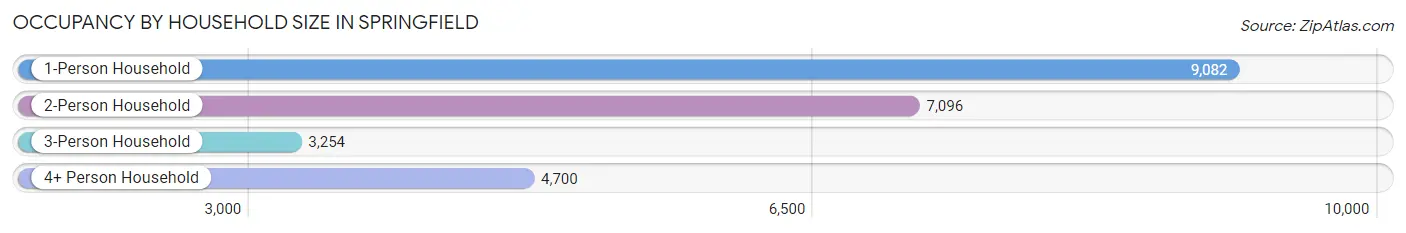
| Household Size | # Housing Units | % Housing Units |
| 1-Person Household | 9,082 | 37.6% |
| 2-Person Household | 7,096 | 29.4% |
| 3-Person Household | 3,254 | 13.5% |
| 4+ Person Household | 4,700 | 19.5% |
| Total Housing Units | 24,132 | 100.0% |
Occupancy by Ownership by Household Size in Springfield
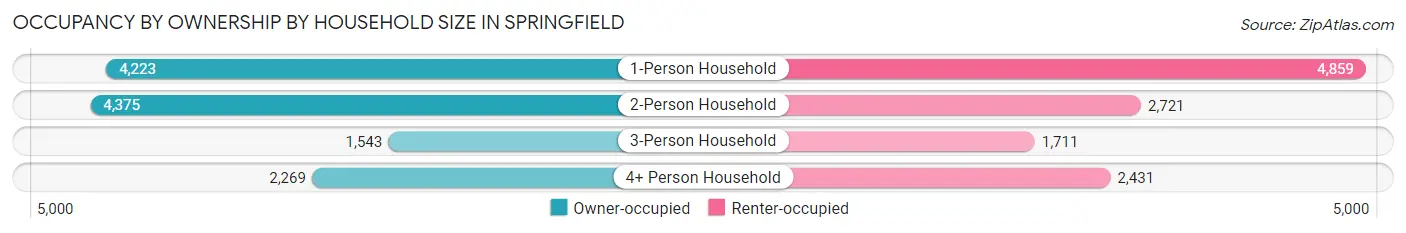
| Household Size | Owner-occupied | Renter-occupied |
| 1-Person Household | 4,223 (46.5%) | 4,859 (53.5%) |
| 2-Person Household | 4,375 (61.7%) | 2,721 (38.4%) |
| 3-Person Household | 1,543 (47.4%) | 1,711 (52.6%) |
| 4+ Person Household | 2,269 (48.3%) | 2,431 (51.7%) |
| Total Housing Units | 12,410 (51.4%) | 11,722 (48.6%) |
Occupancy by Educational Attainment in Springfield
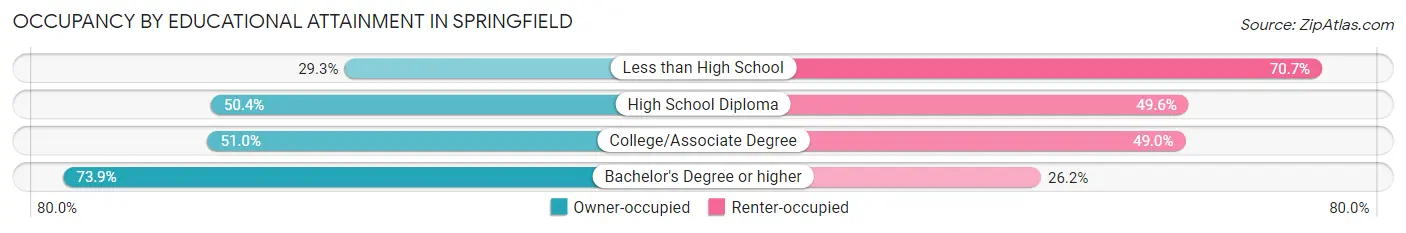
| Household Size | Owner-occupied | Renter-occupied |
| Less than High School | 952 (29.3%) | 2,297 (70.7%) |
| High School Diploma | 4,383 (50.4%) | 4,306 (49.6%) |
| College/Associate Degree | 4,302 (51.0%) | 4,137 (49.0%) |
| Bachelor's Degree or higher | 2,773 (73.9%) | 982 (26.2%) |
Occupancy by Age of Householder in Springfield
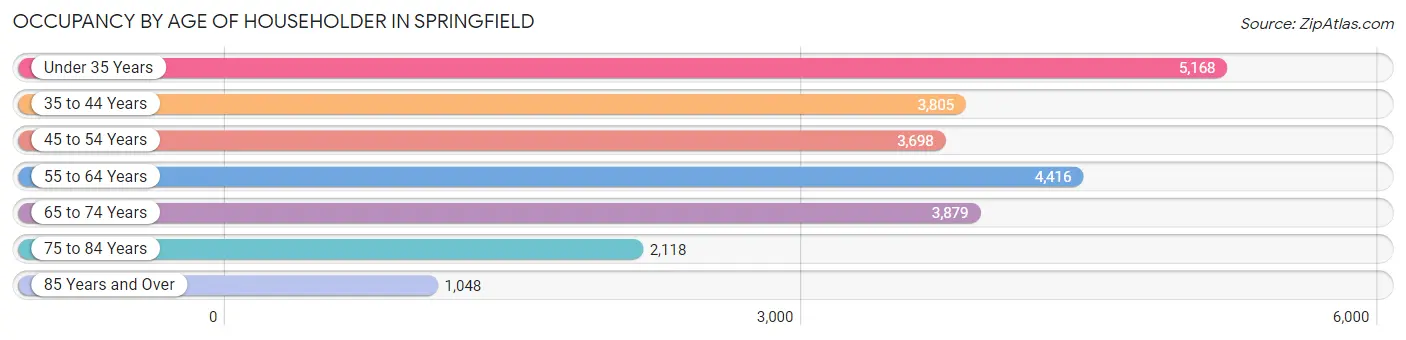
| Age Bracket | # Households | % Households |
| Under 35 Years | 5,168 | 21.4% |
| 35 to 44 Years | 3,805 | 15.8% |
| 45 to 54 Years | 3,698 | 15.3% |
| 55 to 64 Years | 4,416 | 18.3% |
| 65 to 74 Years | 3,879 | 16.1% |
| 75 to 84 Years | 2,118 | 8.8% |
| 85 Years and Over | 1,048 | 4.3% |
| Total | 24,132 | 100.0% |
Housing Finances in Springfield
Median Income by Occupancy in Springfield
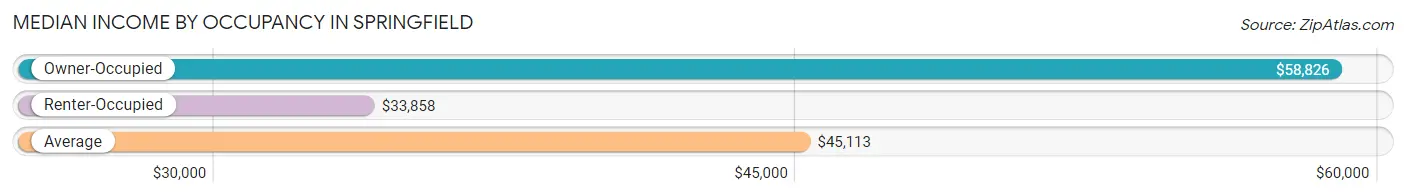
| Occupancy Type | # Households | Median Income |
| Owner-Occupied | 12,410 (51.4%) | $58,826 |
| Renter-Occupied | 11,722 (48.6%) | $33,858 |
| Average | 24,132 (100.0%) | $45,113 |
Occupancy by Householder Income Bracket in Springfield
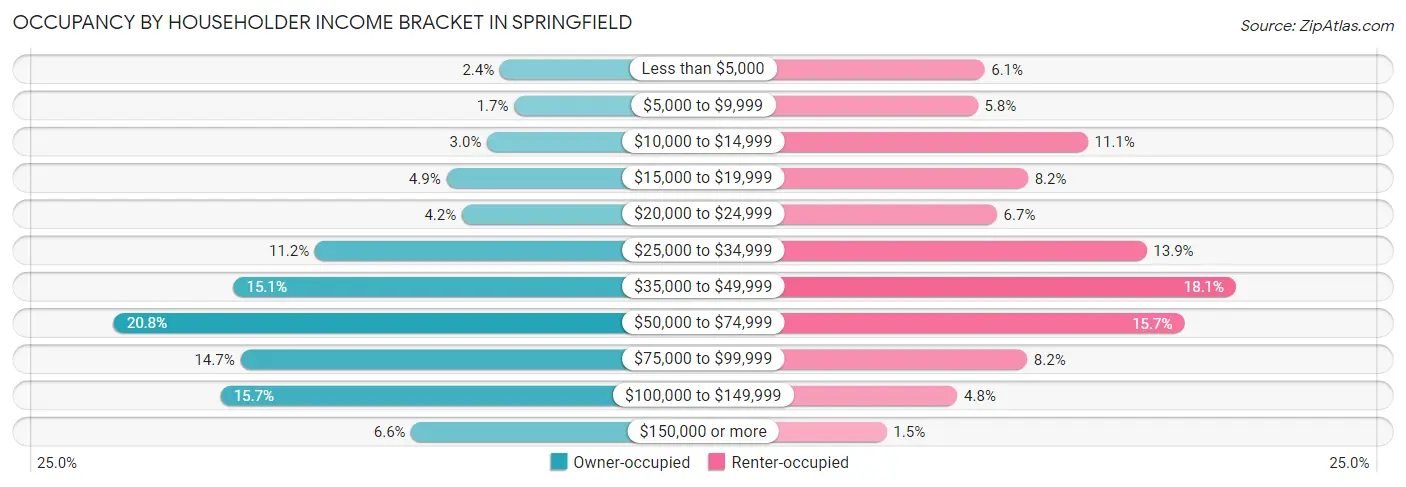
| Income Bracket | Owner-occupied | Renter-occupied |
| Less than $5,000 | 293 (2.4%) | 719 (6.1%) |
| $5,000 to $9,999 | 208 (1.7%) | 681 (5.8%) |
| $10,000 to $14,999 | 368 (3.0%) | 1,295 (11.1%) |
| $15,000 to $19,999 | 609 (4.9%) | 961 (8.2%) |
| $20,000 to $24,999 | 517 (4.2%) | 788 (6.7%) |
| $25,000 to $34,999 | 1,386 (11.2%) | 1,624 (13.9%) |
| $35,000 to $49,999 | 1,868 (15.0%) | 2,123 (18.1%) |
| $50,000 to $74,999 | 2,575 (20.7%) | 1,835 (15.7%) |
| $75,000 to $99,999 | 1,827 (14.7%) | 957 (8.2%) |
| $100,000 to $149,999 | 1,943 (15.7%) | 567 (4.8%) |
| $150,000 or more | 816 (6.6%) | 172 (1.5%) |
| Total | 12,410 (100.0%) | 11,722 (100.0%) |
Monthly Housing Cost Tiers in Springfield
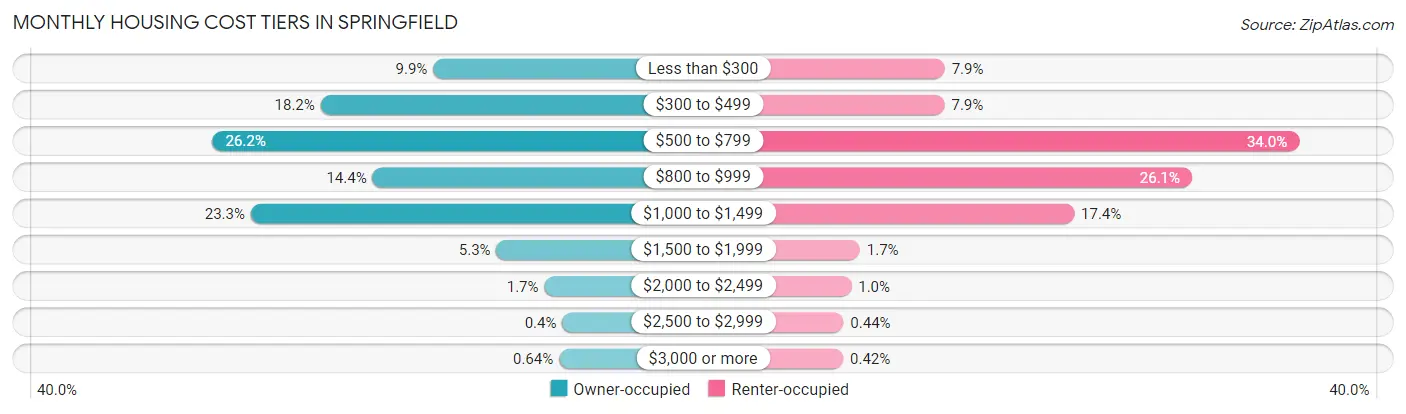
| Monthly Cost | Owner-occupied | Renter-occupied |
| Less than $300 | 1,230 (9.9%) | 926 (7.9%) |
| $300 to $499 | 2,259 (18.2%) | 925 (7.9%) |
| $500 to $799 | 3,246 (26.2%) | 3,984 (34.0%) |
| $800 to $999 | 1,785 (14.4%) | 3,059 (26.1%) |
| $1,000 to $1,499 | 2,896 (23.3%) | 2,043 (17.4%) |
| $1,500 to $1,999 | 651 (5.2%) | 193 (1.7%) |
| $2,000 to $2,499 | 213 (1.7%) | 120 (1.0%) |
| $2,500 to $2,999 | 50 (0.4%) | 51 (0.4%) |
| $3,000 or more | 80 (0.6%) | 49 (0.4%) |
| Total | 12,410 (100.0%) | 11,722 (100.0%) |
Physical Housing Characteristics in Springfield
Housing Structures in Springfield
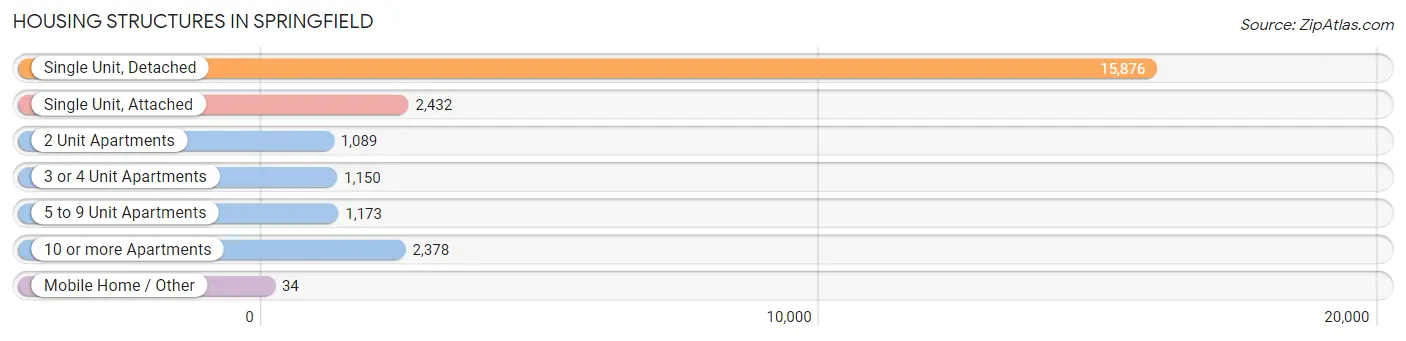
| Structure Type | # Housing Units | % Housing Units |
| Single Unit, Detached | 15,876 | 65.8% |
| Single Unit, Attached | 2,432 | 10.1% |
| 2 Unit Apartments | 1,089 | 4.5% |
| 3 or 4 Unit Apartments | 1,150 | 4.8% |
| 5 to 9 Unit Apartments | 1,173 | 4.9% |
| 10 or more Apartments | 2,378 | 9.9% |
| Mobile Home / Other | 34 | 0.1% |
| Total | 24,132 | 100.0% |
Housing Structures by Occupancy in Springfield
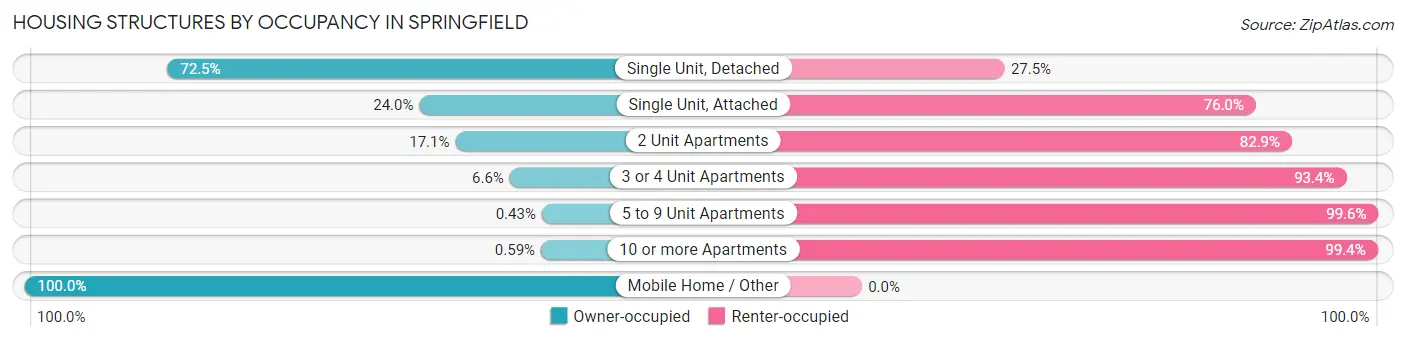
| Structure Type | Owner-occupied | Renter-occupied |
| Single Unit, Detached | 11,511 (72.5%) | 4,365 (27.5%) |
| Single Unit, Attached | 584 (24.0%) | 1,848 (76.0%) |
| 2 Unit Apartments | 186 (17.1%) | 903 (82.9%) |
| 3 or 4 Unit Apartments | 76 (6.6%) | 1,074 (93.4%) |
| 5 to 9 Unit Apartments | 5 (0.4%) | 1,168 (99.6%) |
| 10 or more Apartments | 14 (0.6%) | 2,364 (99.4%) |
| Mobile Home / Other | 34 (100.0%) | 0 (0.0%) |
| Total | 12,410 (51.4%) | 11,722 (48.6%) |
Housing Structures by Number of Rooms in Springfield
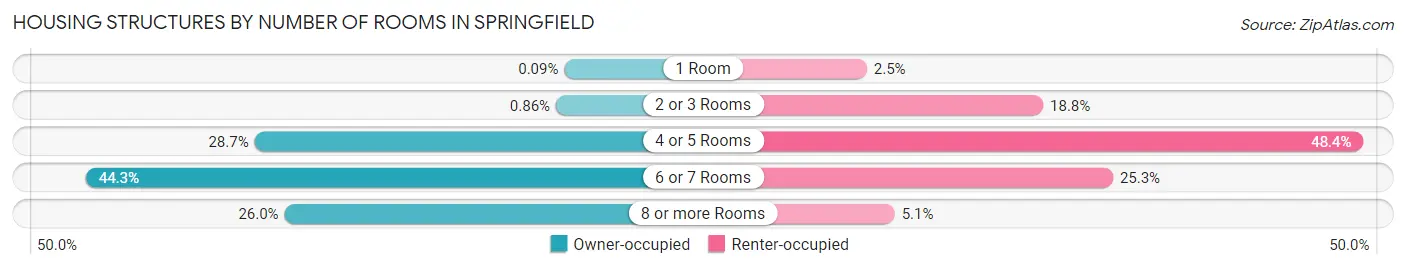
| Number of Rooms | Owner-occupied | Renter-occupied |
| 1 Room | 11 (0.1%) | 292 (2.5%) |
| 2 or 3 Rooms | 107 (0.9%) | 2,202 (18.8%) |
| 4 or 5 Rooms | 3,567 (28.7%) | 5,674 (48.4%) |
| 6 or 7 Rooms | 5,502 (44.3%) | 2,960 (25.3%) |
| 8 or more Rooms | 3,223 (26.0%) | 594 (5.1%) |
| Total | 12,410 (100.0%) | 11,722 (100.0%) |
Housing Structure by Heating Type in Springfield
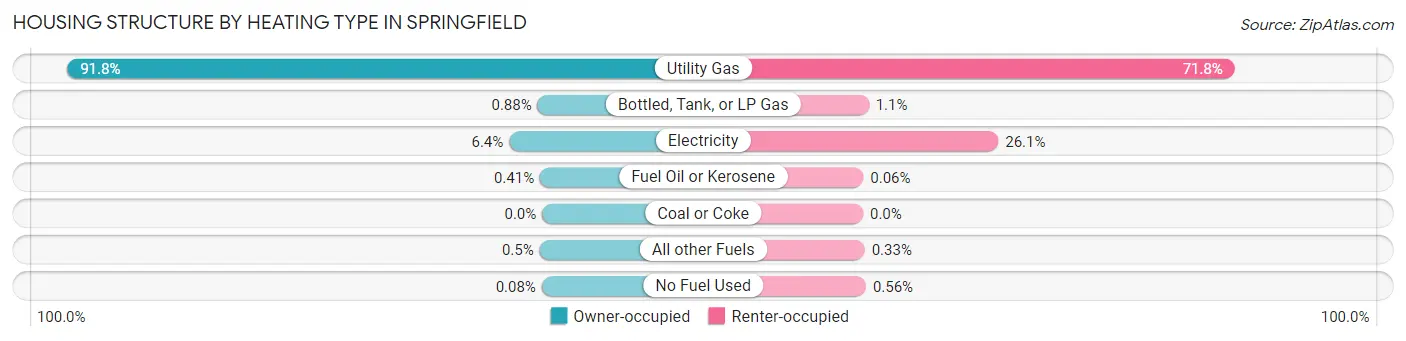
| Heating Type | Owner-occupied | Renter-occupied |
| Utility Gas | 11,387 (91.8%) | 8,417 (71.8%) |
| Bottled, Tank, or LP Gas | 109 (0.9%) | 129 (1.1%) |
| Electricity | 791 (6.4%) | 3,064 (26.1%) |
| Fuel Oil or Kerosene | 51 (0.4%) | 7 (0.1%) |
| Coal or Coke | 0 (0.0%) | 0 (0.0%) |
| All other Fuels | 62 (0.5%) | 39 (0.3%) |
| No Fuel Used | 10 (0.1%) | 66 (0.6%) |
| Total | 12,410 (100.0%) | 11,722 (100.0%) |
Household Vehicle Usage in Springfield
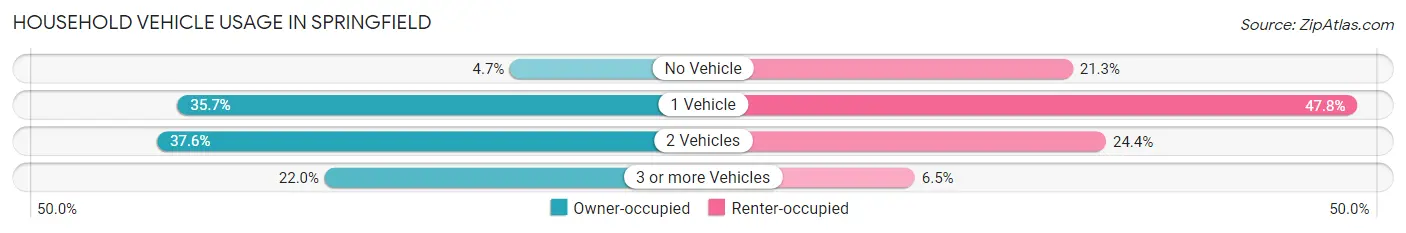
| Vehicles per Household | Owner-occupied | Renter-occupied |
| No Vehicle | 579 (4.7%) | 2,493 (21.3%) |
| 1 Vehicle | 4,434 (35.7%) | 5,605 (47.8%) |
| 2 Vehicles | 4,671 (37.6%) | 2,858 (24.4%) |
| 3 or more Vehicles | 2,726 (22.0%) | 766 (6.5%) |
| Total | 12,410 (100.0%) | 11,722 (100.0%) |
Real Estate & Mortgages in Springfield
Real Estate and Mortgage Overview in Springfield
| Characteristic | Without Mortgage | With Mortgage |
| Housing Units | 5,142 | 7,268 |
| Median Property Value | $93,500 | $106,300 |
| Median Household Income | $42,665 | $517 |
| Monthly Housing Costs | $430 | $73 |
| Real Estate Taxes | $1,237 | $173 |
Property Value by Mortgage Status in Springfield
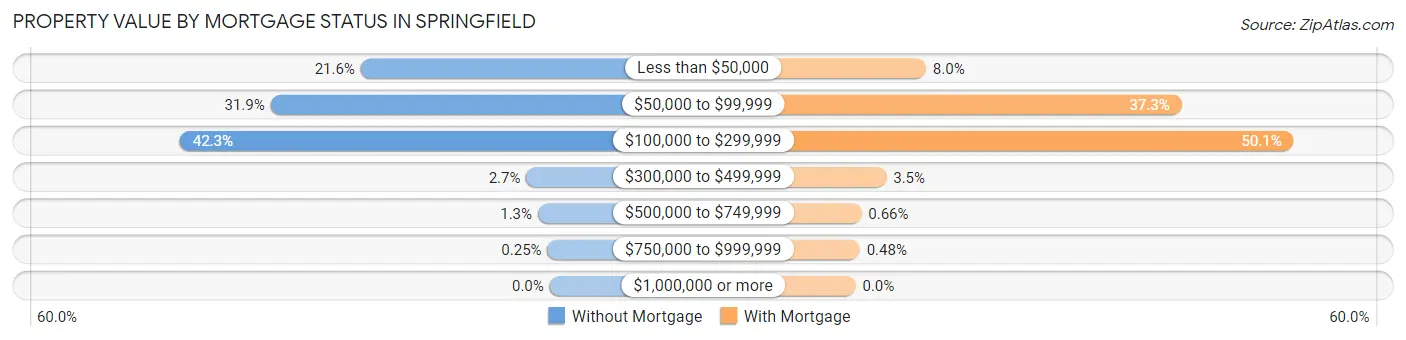
| Property Value | Without Mortgage | With Mortgage |
| Less than $50,000 | 1,110 (21.6%) | 584 (8.0%) |
| $50,000 to $99,999 | 1,640 (31.9%) | 2,708 (37.3%) |
| $100,000 to $299,999 | 2,173 (42.3%) | 3,638 (50.1%) |
| $300,000 to $499,999 | 137 (2.7%) | 255 (3.5%) |
| $500,000 to $749,999 | 69 (1.3%) | 48 (0.7%) |
| $750,000 to $999,999 | 13 (0.3%) | 35 (0.5%) |
| $1,000,000 or more | 0 (0.0%) | 0 (0.0%) |
| Total | 5,142 (100.0%) | 7,268 (100.0%) |
Household Income by Mortgage Status in Springfield
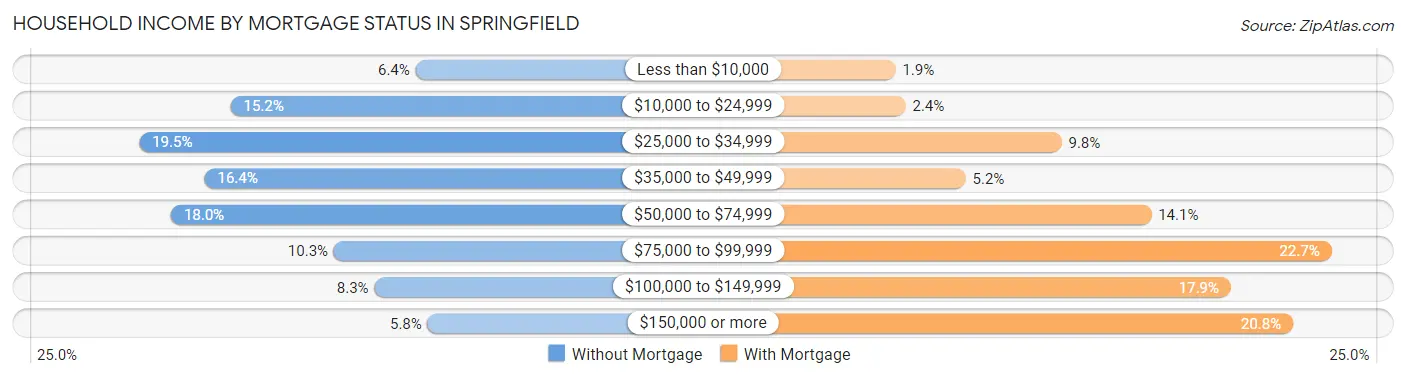
| Household Income | Without Mortgage | With Mortgage |
| Less than $10,000 | 328 (6.4%) | 138 (1.9%) |
| $10,000 to $24,999 | 781 (15.2%) | 173 (2.4%) |
| $25,000 to $34,999 | 1,005 (19.5%) | 713 (9.8%) |
| $35,000 to $49,999 | 845 (16.4%) | 381 (5.2%) |
| $50,000 to $74,999 | 927 (18.0%) | 1,023 (14.1%) |
| $75,000 to $99,999 | 528 (10.3%) | 1,648 (22.7%) |
| $100,000 to $149,999 | 429 (8.3%) | 1,299 (17.9%) |
| $150,000 or more | 299 (5.8%) | 1,514 (20.8%) |
| Total | 5,142 (100.0%) | 7,268 (100.0%) |
Property Value to Household Income Ratio in Springfield
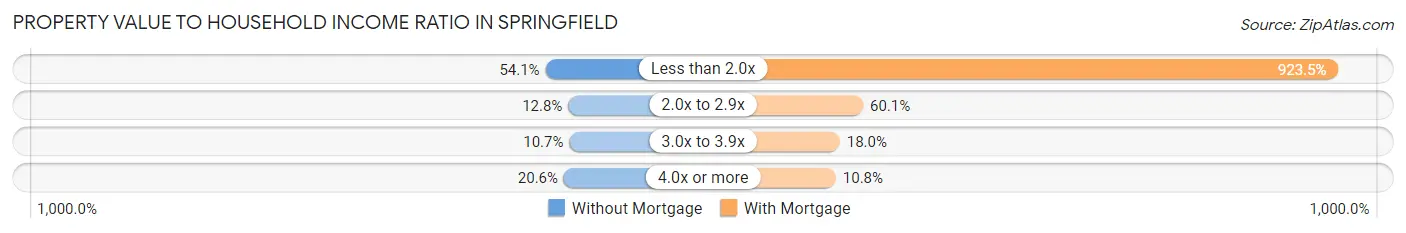
| Value-to-Income Ratio | Without Mortgage | With Mortgage |
| Less than 2.0x | 2,782 (54.1%) | 67,118 (923.5%) |
| 2.0x to 2.9x | 656 (12.8%) | 4,370 (60.1%) |
| 3.0x to 3.9x | 551 (10.7%) | 1,306 (18.0%) |
| 4.0x or more | 1,061 (20.6%) | 781 (10.7%) |
| Total | 5,142 (100.0%) | 7,268 (100.0%) |
Real Estate Taxes by Mortgage Status in Springfield
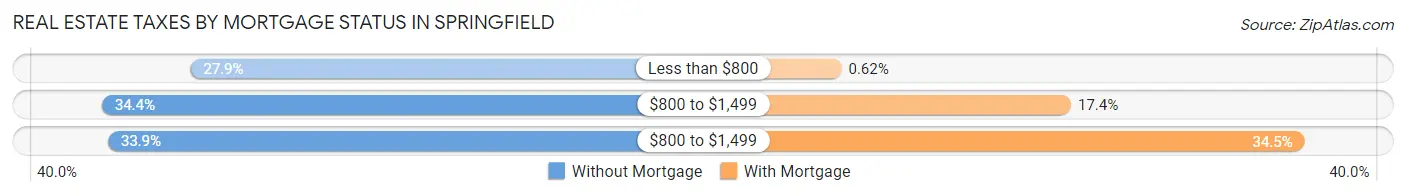
| Property Taxes | Without Mortgage | With Mortgage |
| Less than $800 | 1,434 (27.9%) | 45 (0.6%) |
| $800 to $1,499 | 1,767 (34.4%) | 1,264 (17.4%) |
| $800 to $1,499 | 1,744 (33.9%) | 2,504 (34.4%) |
| Total | 5,142 (100.0%) | 7,268 (100.0%) |
Health & Disability in Springfield
Health Insurance Coverage by Age in Springfield
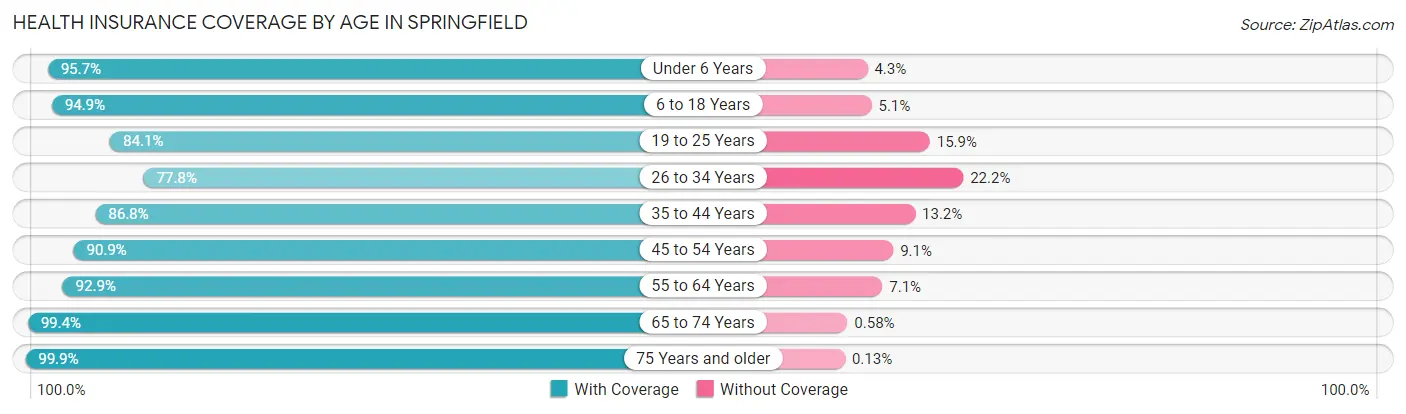
| Age Bracket | With Coverage | Without Coverage |
| Under 6 Years | 4,849 (95.7%) | 219 (4.3%) |
| 6 to 18 Years | 9,581 (94.9%) | 513 (5.1%) |
| 19 to 25 Years | 4,827 (84.1%) | 915 (15.9%) |
| 26 to 34 Years | 5,431 (77.8%) | 1,548 (22.2%) |
| 35 to 44 Years | 5,498 (86.8%) | 836 (13.2%) |
| 45 to 54 Years | 5,732 (90.9%) | 575 (9.1%) |
| 55 to 64 Years | 7,077 (92.9%) | 541 (7.1%) |
| 65 to 74 Years | 5,341 (99.4%) | 31 (0.6%) |
| 75 Years and older | 3,936 (99.9%) | 5 (0.1%) |
| Total | 52,272 (91.0%) | 5,183 (9.0%) |
Health Insurance Coverage by Citizenship Status in Springfield
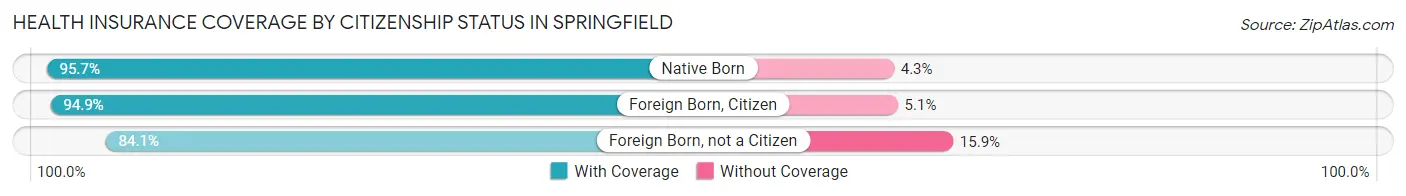
| Citizenship Status | With Coverage | Without Coverage |
| Native Born | 4,849 (95.7%) | 219 (4.3%) |
| Foreign Born, Citizen | 9,581 (94.9%) | 513 (5.1%) |
| Foreign Born, not a Citizen | 4,827 (84.1%) | 915 (15.9%) |
Health Insurance Coverage by Household Income in Springfield
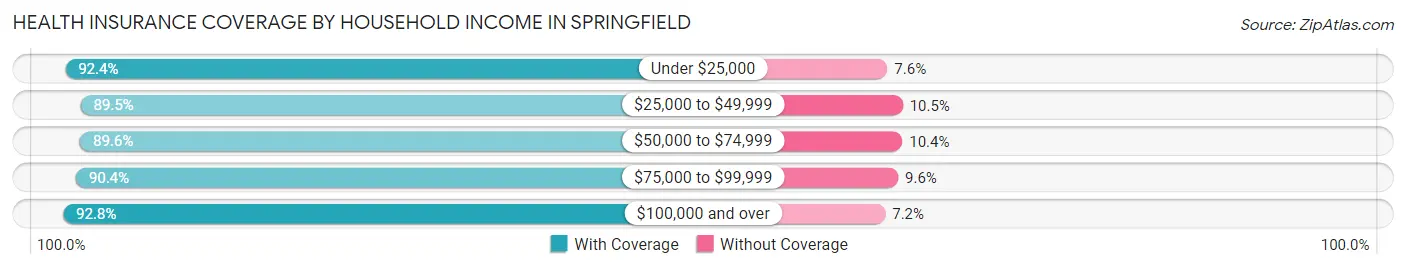
| Household Income | With Coverage | Without Coverage |
| Under $25,000 | 10,265 (92.4%) | 845 (7.6%) |
| $25,000 to $49,999 | 13,014 (89.5%) | 1,522 (10.5%) |
| $50,000 to $74,999 | 9,782 (89.6%) | 1,135 (10.4%) |
| $75,000 to $99,999 | 7,286 (90.4%) | 775 (9.6%) |
| $100,000 and over | 10,717 (92.8%) | 833 (7.2%) |
Public vs Private Health Insurance Coverage by Age in Springfield
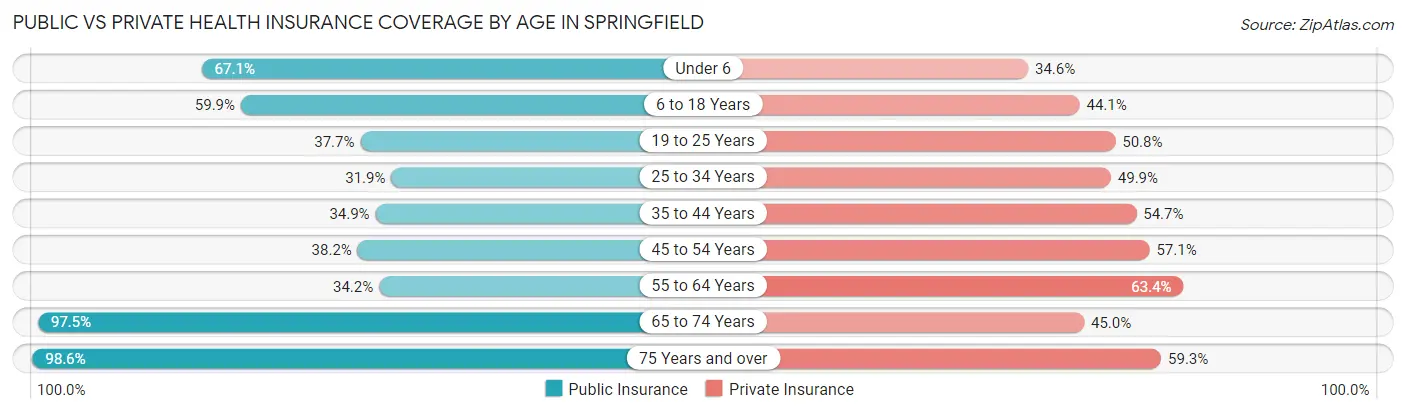
| Age Bracket | Public Insurance | Private Insurance |
| Under 6 | 3,402 (67.1%) | 1,752 (34.6%) |
| 6 to 18 Years | 6,042 (59.9%) | 4,454 (44.1%) |
| 19 to 25 Years | 2,164 (37.7%) | 2,915 (50.8%) |
| 25 to 34 Years | 2,229 (31.9%) | 3,485 (49.9%) |
| 35 to 44 Years | 2,209 (34.9%) | 3,462 (54.7%) |
| 45 to 54 Years | 2,408 (38.2%) | 3,602 (57.1%) |
| 55 to 64 Years | 2,606 (34.2%) | 4,830 (63.4%) |
| 65 to 74 Years | 5,240 (97.5%) | 2,415 (45.0%) |
| 75 Years and over | 3,884 (98.6%) | 2,336 (59.3%) |
| Total | 30,184 (52.5%) | 29,251 (50.9%) |
Disability Status by Sex by Age in Springfield
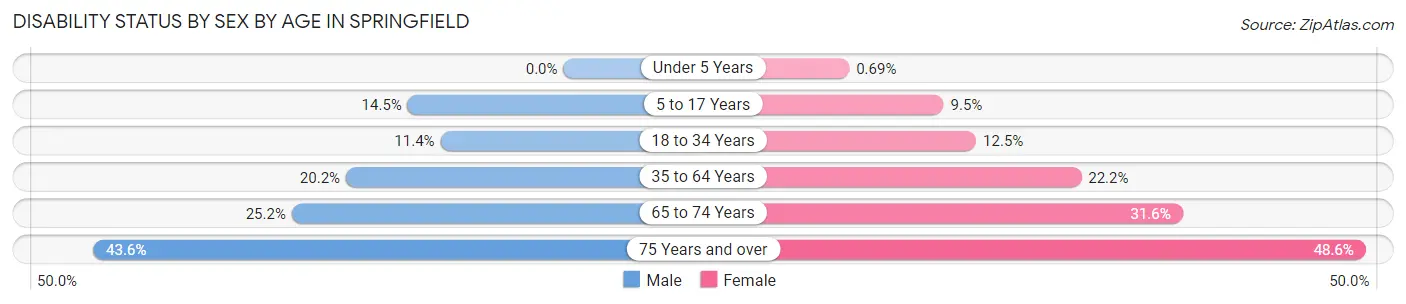
| Age Bracket | Male | Female |
| Under 5 Years | 0 (0.0%) | 15 (0.7%) |
| 5 to 17 Years | 759 (14.4%) | 449 (9.5%) |
| 18 to 34 Years | 741 (11.4%) | 903 (12.5%) |
| 35 to 64 Years | 2,035 (20.2%) | 2,262 (22.2%) |
| 65 to 74 Years | 608 (25.2%) | 936 (31.6%) |
| 75 Years and over | 631 (43.6%) | 1,213 (48.6%) |
Disability Class by Sex by Age in Springfield
Disability Class: Hearing Difficulty
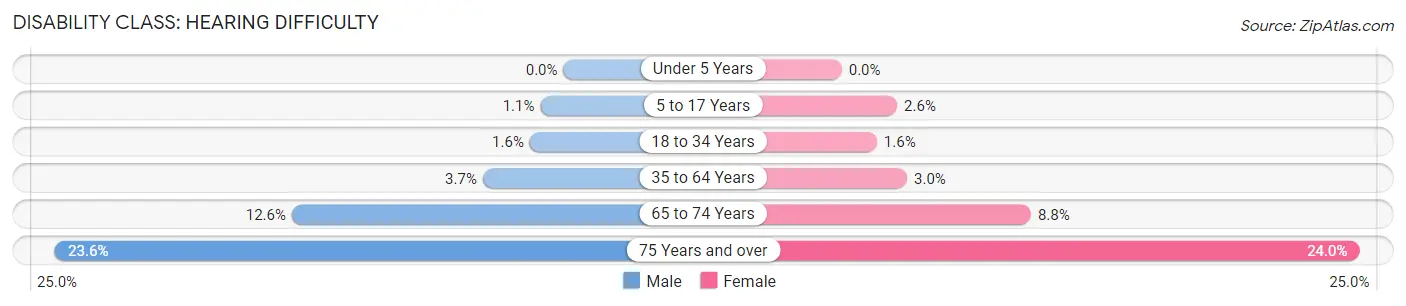
| Age Bracket | Male | Female |
| Under 5 Years | 0 (0.0%) | 0 (0.0%) |
| 5 to 17 Years | 56 (1.1%) | 122 (2.6%) |
| 18 to 34 Years | 101 (1.6%) | 118 (1.6%) |
| 35 to 64 Years | 377 (3.7%) | 308 (3.0%) |
| 65 to 74 Years | 304 (12.6%) | 260 (8.8%) |
| 75 Years and over | 341 (23.6%) | 599 (24.0%) |
Disability Class: Vision Difficulty
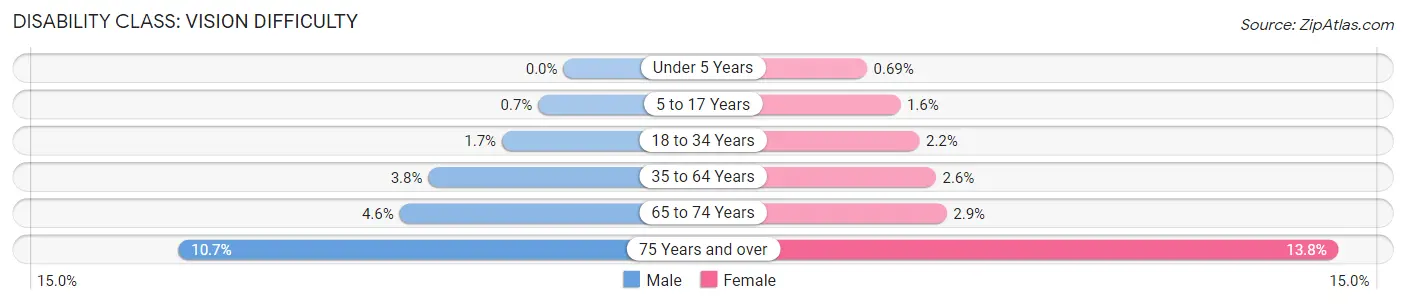
| Age Bracket | Male | Female |
| Under 5 Years | 0 (0.0%) | 15 (0.7%) |
| 5 to 17 Years | 37 (0.7%) | 77 (1.6%) |
| 18 to 34 Years | 111 (1.7%) | 156 (2.1%) |
| 35 to 64 Years | 379 (3.8%) | 266 (2.6%) |
| 65 to 74 Years | 110 (4.6%) | 86 (2.9%) |
| 75 Years and over | 155 (10.7%) | 345 (13.8%) |
Disability Class: Cognitive Difficulty
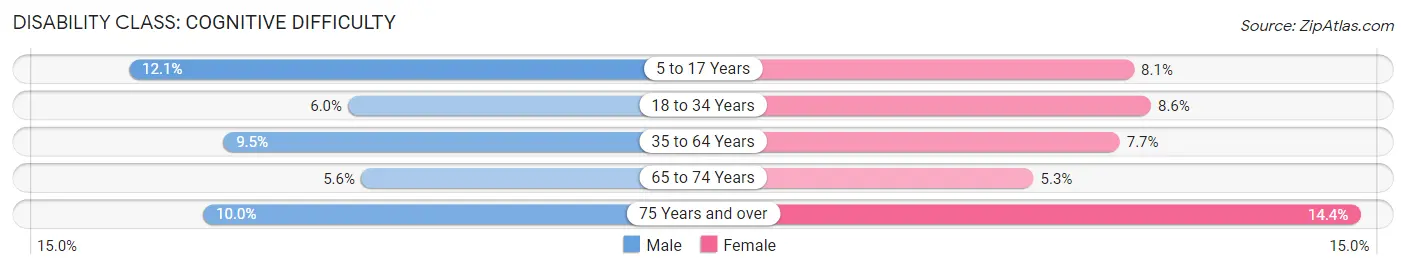
| Age Bracket | Male | Female |
| 5 to 17 Years | 635 (12.1%) | 387 (8.1%) |
| 18 to 34 Years | 390 (6.0%) | 624 (8.6%) |
| 35 to 64 Years | 955 (9.5%) | 788 (7.7%) |
| 65 to 74 Years | 136 (5.6%) | 158 (5.3%) |
| 75 Years and over | 145 (10.0%) | 360 (14.4%) |
Disability Class: Ambulatory Difficulty
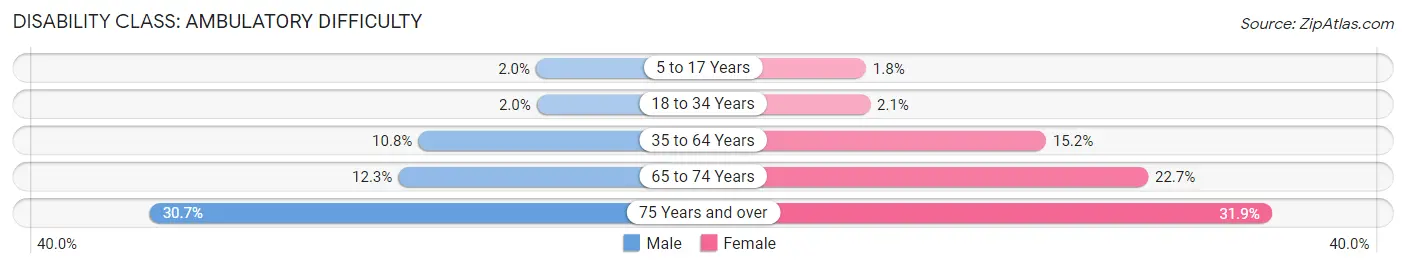
| Age Bracket | Male | Female |
| 5 to 17 Years | 107 (2.0%) | 85 (1.8%) |
| 18 to 34 Years | 129 (2.0%) | 152 (2.1%) |
| 35 to 64 Years | 1,087 (10.8%) | 1,543 (15.2%) |
| 65 to 74 Years | 296 (12.3%) | 673 (22.7%) |
| 75 Years and over | 444 (30.7%) | 796 (31.9%) |
Disability Class: Self-Care Difficulty
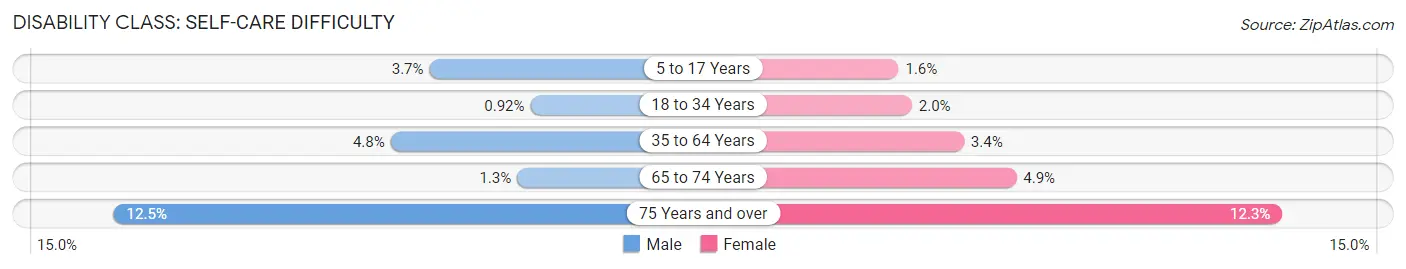
| Age Bracket | Male | Female |
| 5 to 17 Years | 196 (3.7%) | 75 (1.6%) |
| 18 to 34 Years | 60 (0.9%) | 141 (1.9%) |
| 35 to 64 Years | 485 (4.8%) | 346 (3.4%) |
| 65 to 74 Years | 31 (1.3%) | 144 (4.9%) |
| 75 Years and over | 181 (12.5%) | 306 (12.3%) |
Technology Access in Springfield
Computing Device Access in Springfield
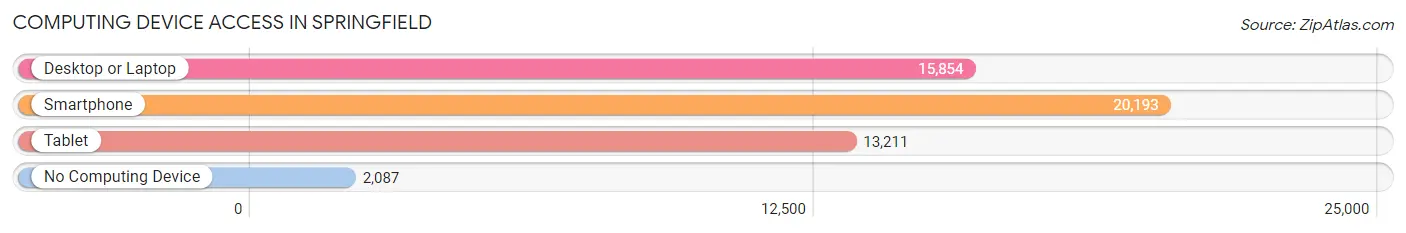
| Device Type | # Households | % Households |
| Desktop or Laptop | 15,854 | 65.7% |
| Smartphone | 20,193 | 83.7% |
| Tablet | 13,211 | 54.7% |
| No Computing Device | 2,087 | 8.6% |
| Total | 24,132 | 100.0% |
Internet Access in Springfield
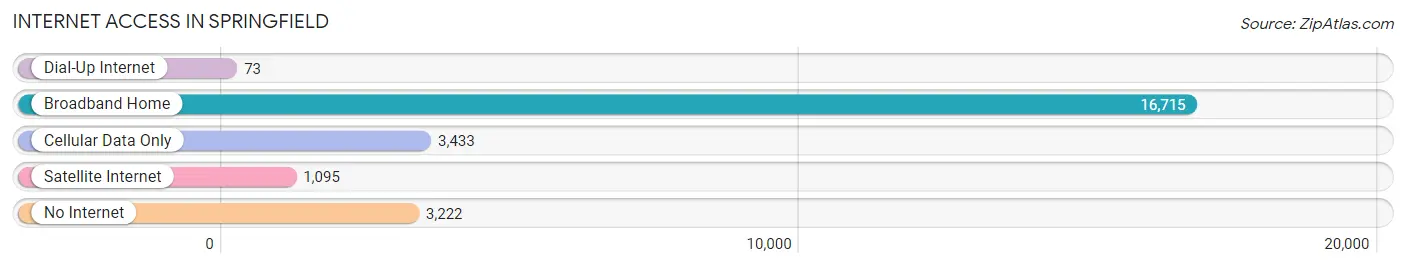
| Internet Type | # Households | % Households |
| Dial-Up Internet | 73 | 0.3% |
| Broadband Home | 16,715 | 69.3% |
| Cellular Data Only | 3,433 | 14.2% |
| Satellite Internet | 1,095 | 4.5% |
| No Internet | 3,222 | 13.4% |
| Total | 24,132 | 100.0% |
Springfield Summary
Springfield, Ohio is a city located in Clark County, Ohio, United States. It is the county seat of Clark County and is located in the southwestern part of the state. The city is situated along the Mad River, Buck Creek and Beaver Creek, and is part of the Dayton metropolitan area. As of the 2010 census, the city had a population of 60,608, making it the third largest city in the state of Ohio.
History
The area that is now Springfield was first settled in 1801 by James Demint, who built a log cabin along the Mad River. The area was known as Demint's Station and was the first settlement in the area. The settlement was later renamed Springfield in 1804, after the nearby town of Springfield, Massachusetts. The city was officially incorporated in 1838 and was designated as the county seat of Clark County in 1842.
In the late 19th century, Springfield became a major industrial center, with several factories and mills located in the city. The city was also home to several major railroads, including the Baltimore and Ohio Railroad, the Pennsylvania Railroad, and the Cincinnati, Hamilton and Dayton Railroad.
In the early 20th century, Springfield experienced a period of growth and prosperity, with the population increasing from 17,000 in 1900 to over 60,000 by the 1950s. The city was also home to several major industries, including the International Harvester Company, the National Cash Register Company, and the Frigidaire Corporation.
Geography
Springfield is located at 39°56'N 83°48'W (39.9333, -83.8000). The city is situated along the Mad River, Buck Creek and Beaver Creek, and is part of the Dayton metropolitan area. The city has a total area of 24.2 square miles (62.7 km2), of which 24.1 square miles (62.5 km2) is land and 0.1 square miles (0.2 km2) is water.
Economy
Springfield's economy is largely based on manufacturing and healthcare. The city is home to several major employers, including Honda of America Manufacturing, Navistar International, and Mercy Health. Other major employers in the city include the Clark County government, Wittenberg University, and the Springfield City School District.
Demographics
As of the 2010 census, the city had a population of 60,608. The racial makeup of the city was 79.2% White, 14.3% African American, 0.3% Native American, 1.7% Asian, 0.1% Pacific Islander, 1.3% from other races, and 2.4% from two or more races. Hispanic or Latino of any race were 4.2% of the population.
The median income for a household in the city was $37,837, and the median income for a family was $45,945. The per capita income for the city was $20,845. About 13.2% of families and 16.7% of the population were below the poverty line, including 25.2% of those under age 18 and 8.2% of those age 65 or over.
Common Questions
What is the Total Population of Springfield?
Total Population of Springfield is 58,645.
What is the Total Male Population of Springfield?
Total Male Population of Springfield is 28,248.
What is the Total Female Population of Springfield?
Total Female Population of Springfield is 30,397.
What is the Ratio of Males per 100 Females in Springfield?
There are 92.93 Males per 100 Females in Springfield.
What is the Ratio of Females per 100 Males in Springfield?
There are 107.61 Females per 100 Males in Springfield.
What is the Median Population Age in Springfield?
Median Population Age in Springfield is 37.1 Years.
What is the Average Family Size in Springfield
Average Family Size in Springfield is 3.0 People.
What is the Average Household Size in Springfield
Average Household Size in Springfield is 2.3 People.
What is Per Capita Income in Springfield?
Per Capita income in Springfield is $24,701.
What is the Median Family Income in Springfield?
Median Family Income in Springfield is $54,509.
What is the Median Household income in Springfield?
Median Household Income in Springfield is $45,113.
What is Income or Wage Gap in Springfield?
Income or Wage Gap in Springfield is 24.8%.
Women in Springfield earn 75.2 cents for every dollar earned by a man.
What is Family Income Deficit in Springfield?
Family Income Deficit in Springfield is $12,535.
Families that are below poverty line in Springfield earn $12,535 less on average than the poverty threshold level.
What is Inequality or Gini Index in Springfield?
Inequality or Gini Index in Springfield is 0.44.
How Large is the Labor Force in Springfield?
There are 26,905 People in the Labor Forcein in Springfield.
What is the Percentage of People in the Labor Force in Springfield?
58.5% of People are in the Labor Force in Springfield.
What is the Unemployment Rate in Springfield?
Unemployment Rate in Springfield is 9.1%.