Pataskala, OH
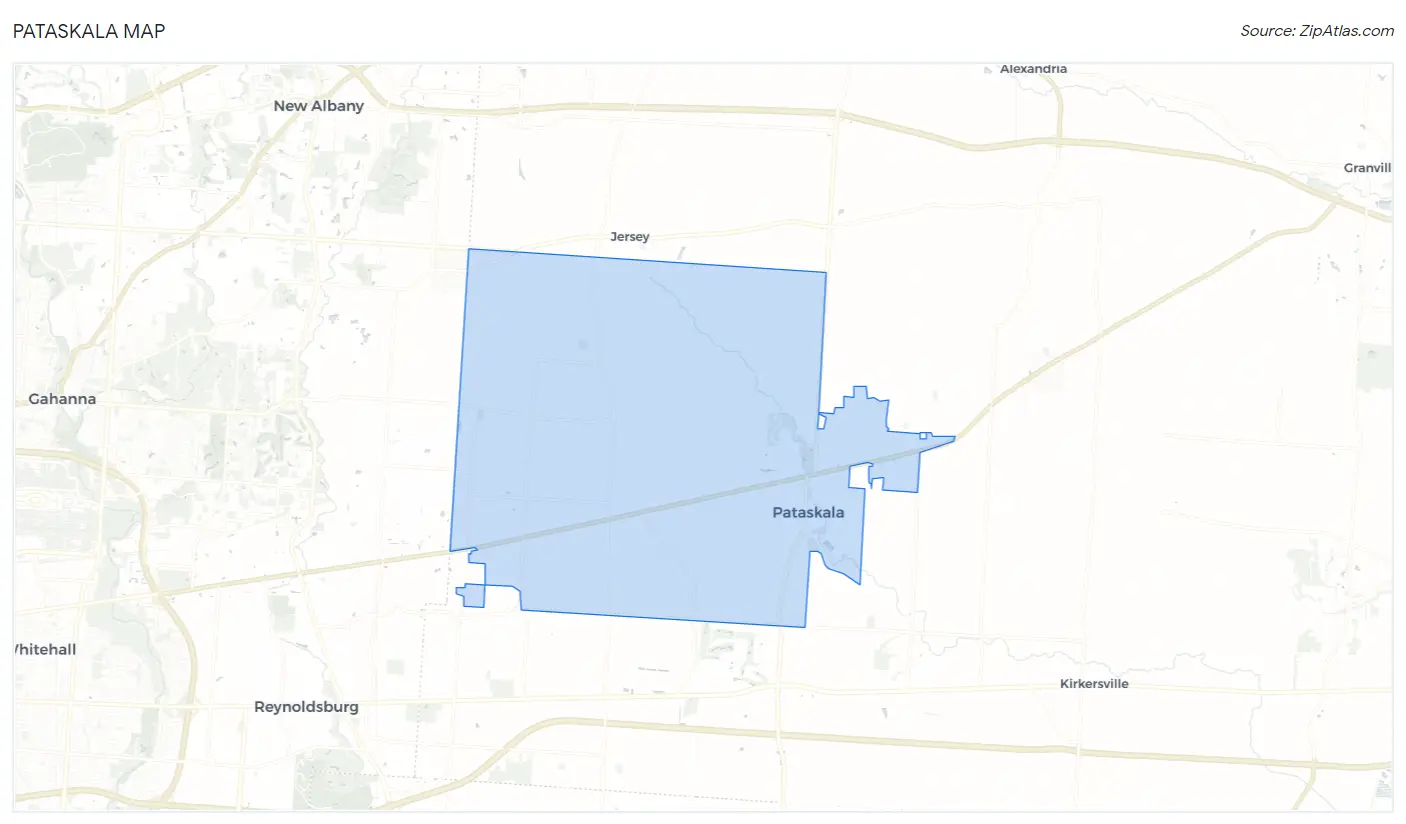
Pataskala Map
Pataskala Overview
17,843
TOTAL POPULATION
8,817
MALE POPULATION
9,026
FEMALE POPULATION
97.68
MALES / 100 FEMALES
102.37
FEMALES / 100 MALES
36.2
MEDIAN AGE
3.0
AVG FAMILY SIZE
2.7
AVG HOUSEHOLD SIZE
$39,393
PER CAPITA INCOME
$93,063
AVG FAMILY INCOME
$87,246
AVG HOUSEHOLD INCOME
19.4%
WAGE / INCOME GAP [ % ]
80.6¢/ $1
WAGE / INCOME GAP [ $ ]
0.40
INEQUALITY / GINI INDEX
9,303
LABOR FORCE [ PEOPLE ]
67.2%
PERCENT IN LABOR FORCE
3.2%
UNEMPLOYMENT RATE
Pataskala Zip Codes
Race in Pataskala
The most populous races in Pataskala are White / Caucasian (13,918 | 78.0%), Black / African American (1,512 | 8.5%), and Asian (1,291 | 7.2%).
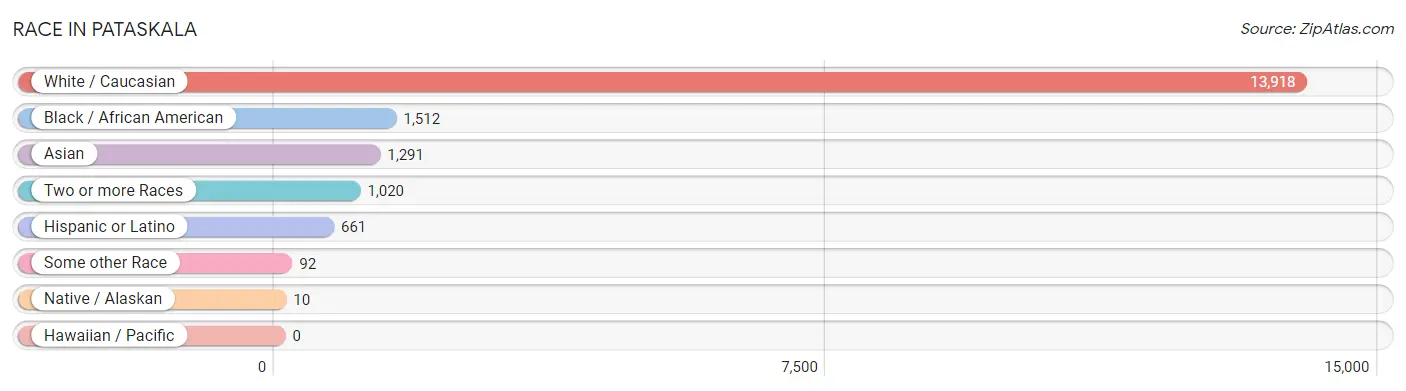
| Race | # Population | % Population |
| Asian | 1,291 | 7.2% |
| Black / African American | 1,512 | 8.5% |
| Hawaiian / Pacific | 0 | 0.0% |
| Hispanic or Latino | 661 | 3.7% |
| Native / Alaskan | 10 | 0.1% |
| White / Caucasian | 13,918 | 78.0% |
| Two or more Races | 1,020 | 5.7% |
| Some other Race | 92 | 0.5% |
| Total | 17,843 | 100.0% |
Ancestry in Pataskala
The most populous ancestries reported in Pataskala are German (5,193 | 29.1%), Irish (2,707 | 15.2%), English (2,108 | 11.8%), American (764 | 4.3%), and Italian (702 | 3.9%), together accounting for 64.3% of all Pataskala residents.
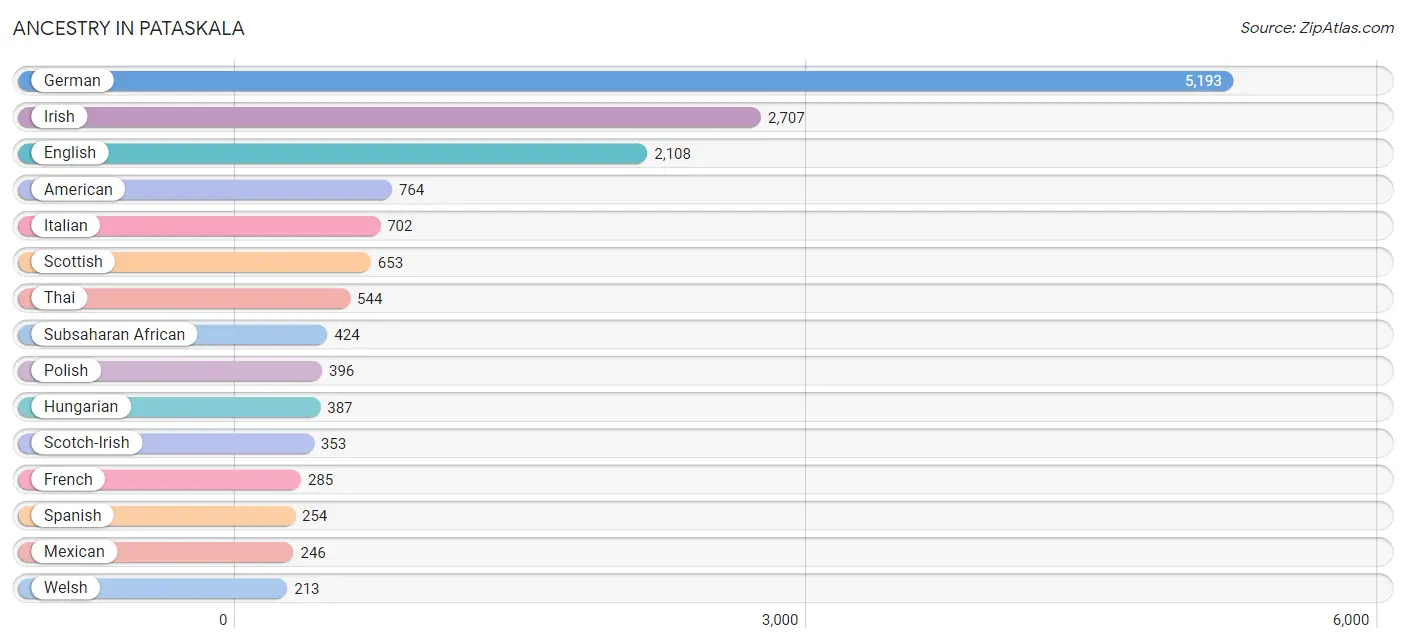
| Ancestry | # Population | % Population |
| African | 77 | 0.4% |
| American | 764 | 4.3% |
| Austrian | 35 | 0.2% |
| Basque | 32 | 0.2% |
| Belgian | 18 | 0.1% |
| Blackfeet | 5 | 0.0% |
| British | 173 | 1.0% |
| Central American | 13 | 0.1% |
| Central American Indian | 13 | 0.1% |
| Cherokee | 61 | 0.3% |
| Cree | 17 | 0.1% |
| Croatian | 13 | 0.1% |
| Cuban | 32 | 0.2% |
| Czech | 5 | 0.0% |
| Danish | 17 | 0.1% |
| Dutch | 81 | 0.4% |
| Eastern European | 141 | 0.8% |
| English | 2,108 | 11.8% |
| European | 123 | 0.7% |
| Filipino | 26 | 0.2% |
| French | 285 | 1.6% |
| French Canadian | 91 | 0.5% |
| German | 5,193 | 29.1% |
| Ghanaian | 51 | 0.3% |
| Greek | 84 | 0.5% |
| Guatemalan | 13 | 0.1% |
| Hungarian | 387 | 2.2% |
| Irish | 2,707 | 15.2% |
| Italian | 702 | 3.9% |
| Japanese | 1 | 0.0% |
| Korean | 58 | 0.3% |
| Macedonian | 17 | 0.1% |
| Mexican | 246 | 1.4% |
| Nigerian | 15 | 0.1% |
| Northern European | 10 | 0.1% |
| Norwegian | 48 | 0.3% |
| Pennsylvania German | 9 | 0.1% |
| Polish | 396 | 2.2% |
| Puerto Rican | 116 | 0.6% |
| Russian | 184 | 1.0% |
| Scandinavian | 41 | 0.2% |
| Scotch-Irish | 353 | 2.0% |
| Scottish | 653 | 3.7% |
| Senegalese | 94 | 0.5% |
| Slovak | 33 | 0.2% |
| Spanish | 254 | 1.4% |
| Subsaharan African | 424 | 2.4% |
| Sudanese | 159 | 0.9% |
| Swedish | 99 | 0.5% |
| Swiss | 29 | 0.2% |
| Thai | 544 | 3.0% |
| Tohono O'Odham | 10 | 0.1% |
| Ukrainian | 6 | 0.0% |
| Welsh | 213 | 1.2% |
| Yugoslavian | 11 | 0.1% | View All 55 Rows |
Immigrants in Pataskala
The most numerous immigrant groups reported in Pataskala came from Asia (966 | 5.4%), South Central Asia (909 | 5.1%), Europe (228 | 1.3%), Nepal (216 | 1.2%), and Africa (206 | 1.1%), together accounting for 14.1% of all Pataskala residents.
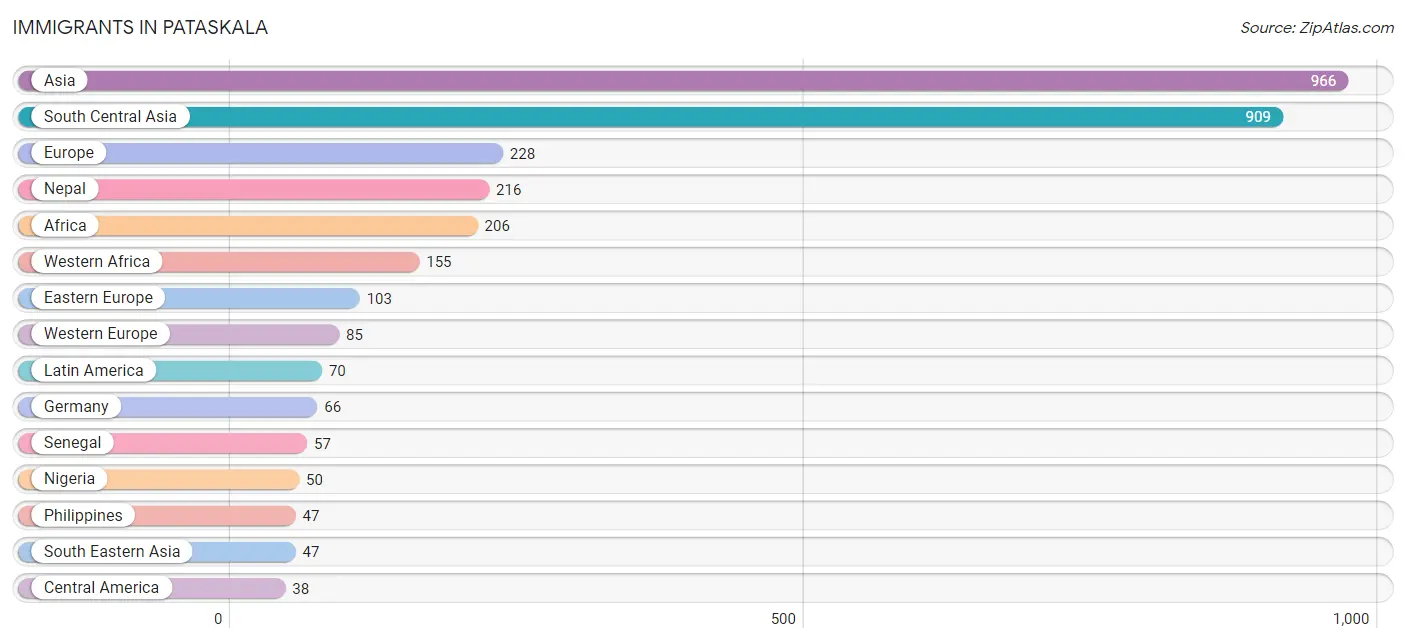
| Immigration Origin | # Population | % Population |
| Africa | 206 | 1.1% |
| Asia | 966 | 5.4% |
| Australia | 17 | 0.1% |
| Cameroon | 18 | 0.1% |
| Caribbean | 32 | 0.2% |
| Central America | 38 | 0.2% |
| China | 10 | 0.1% |
| Cuba | 32 | 0.2% |
| Eastern Asia | 10 | 0.1% |
| Eastern Europe | 103 | 0.6% |
| England | 8 | 0.0% |
| Europe | 228 | 1.3% |
| France | 19 | 0.1% |
| Germany | 66 | 0.4% |
| Ghana | 38 | 0.2% |
| Greece | 26 | 0.2% |
| Guatemala | 13 | 0.1% |
| Hungary | 15 | 0.1% |
| Latin America | 70 | 0.4% |
| Mexico | 25 | 0.1% |
| Middle Africa | 18 | 0.1% |
| Nepal | 216 | 1.2% |
| Nigeria | 50 | 0.3% |
| North Macedonia | 17 | 0.1% |
| Northern Africa | 33 | 0.2% |
| Northern Europe | 14 | 0.1% |
| Oceania | 17 | 0.1% |
| Philippines | 47 | 0.3% |
| Poland | 33 | 0.2% |
| Scotland | 6 | 0.0% |
| Senegal | 57 | 0.3% |
| South Central Asia | 909 | 5.1% |
| South Eastern Asia | 47 | 0.3% |
| Southern Europe | 26 | 0.2% |
| Sudan | 33 | 0.2% |
| Taiwan | 10 | 0.1% |
| Western Africa | 155 | 0.9% |
| Western Europe | 85 | 0.5% | View All 38 Rows |
Sex and Age in Pataskala
Sex and Age in Pataskala
The most populous age groups in Pataskala are 30 to 34 Years (969 | 11.0%) for men and 30 to 34 Years (1,040 | 11.5%) for women.
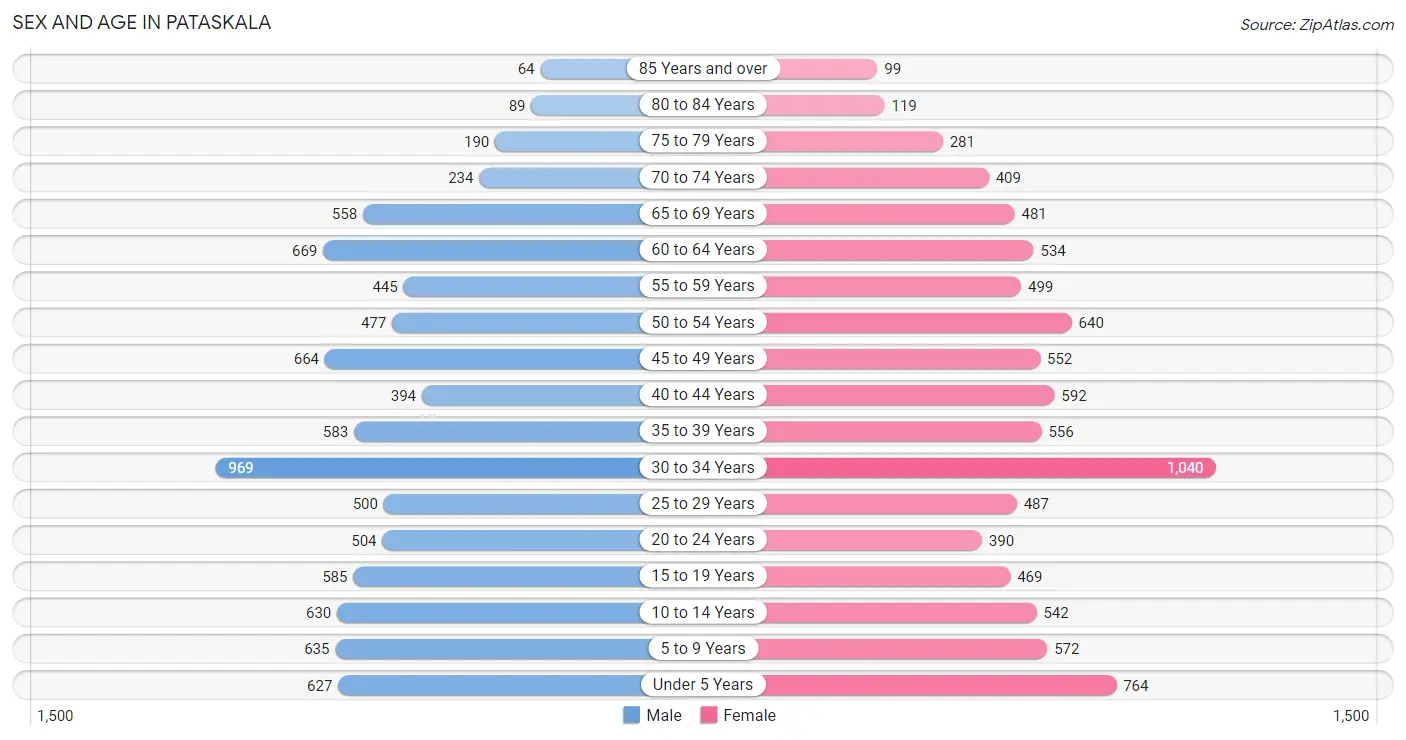
| Age Bracket | Male | Female |
| Under 5 Years | 627 (7.1%) | 764 (8.5%) |
| 5 to 9 Years | 635 (7.2%) | 572 (6.3%) |
| 10 to 14 Years | 630 (7.1%) | 542 (6.0%) |
| 15 to 19 Years | 585 (6.6%) | 469 (5.2%) |
| 20 to 24 Years | 504 (5.7%) | 390 (4.3%) |
| 25 to 29 Years | 500 (5.7%) | 487 (5.4%) |
| 30 to 34 Years | 969 (11.0%) | 1,040 (11.5%) |
| 35 to 39 Years | 583 (6.6%) | 556 (6.2%) |
| 40 to 44 Years | 394 (4.5%) | 592 (6.6%) |
| 45 to 49 Years | 664 (7.5%) | 552 (6.1%) |
| 50 to 54 Years | 477 (5.4%) | 640 (7.1%) |
| 55 to 59 Years | 445 (5.1%) | 499 (5.5%) |
| 60 to 64 Years | 669 (7.6%) | 534 (5.9%) |
| 65 to 69 Years | 558 (6.3%) | 481 (5.3%) |
| 70 to 74 Years | 234 (2.6%) | 409 (4.5%) |
| 75 to 79 Years | 190 (2.1%) | 281 (3.1%) |
| 80 to 84 Years | 89 (1.0%) | 119 (1.3%) |
| 85 Years and over | 64 (0.7%) | 99 (1.1%) |
| Total | 8,817 (100.0%) | 9,026 (100.0%) |
Families and Households in Pataskala
Median Family Size in Pataskala
The median family size in Pataskala is 3.03 persons per family, with single male/father families (163 | 3.3%) accounting for the largest median family size of 3.17 persons per family. On the other hand, single female/mother families (937 | 18.9%) represent the smallest median family size with 2.69 persons per family.
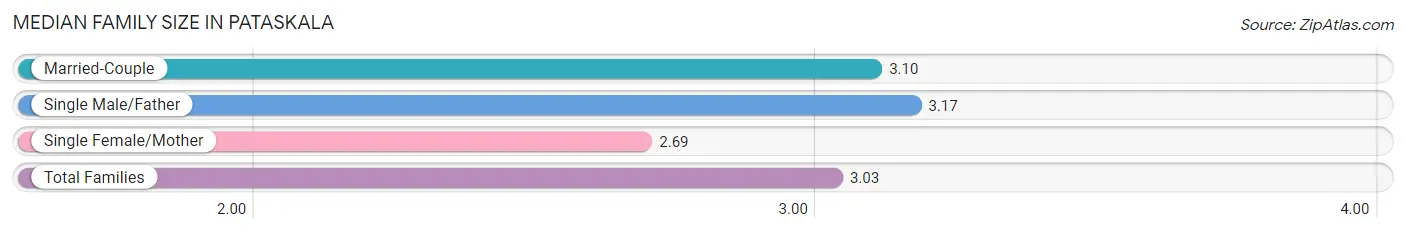
| Family Type | # Families | Family Size |
| Married-Couple | 3,847 (77.8%) | 3.10 |
| Single Male/Father | 163 (3.3%) | 3.17 |
| Single Female/Mother | 937 (18.9%) | 2.69 |
| Total Families | 4,947 (100.0%) | 3.03 |
Median Household Size in Pataskala
The median household size in Pataskala is 2.67 persons per household, with single male/father households (163 | 2.5%) accounting for the largest median household size of 3.29 persons per household. non-family households (1,691 | 25.5%) represent the smallest median household size with 1.32 persons per household.
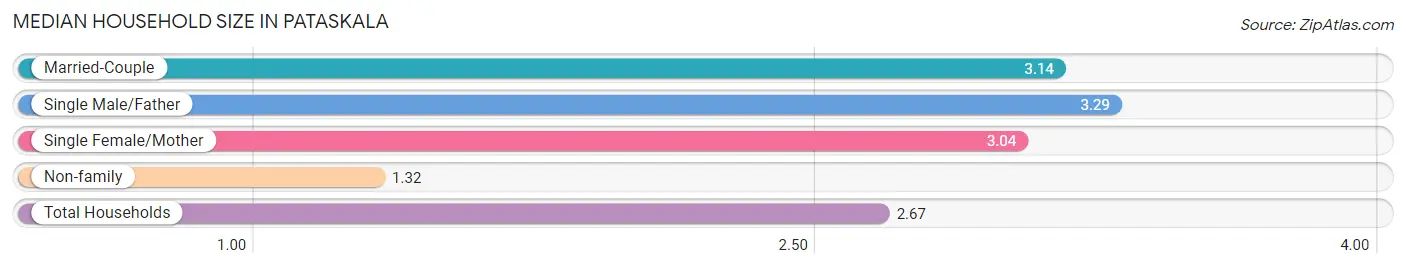
| Household Type | # Households | Household Size |
| Married-Couple | 3,847 (58.0%) | 3.14 |
| Single Male/Father | 163 (2.5%) | 3.29 |
| Single Female/Mother | 937 (14.1%) | 3.04 |
| Non-family | 1,691 (25.5%) | 1.32 |
| Total Households | 6,638 (100.0%) | 2.67 |
Household Size by Marriage Status in Pataskala
Out of a total of 6,638 households in Pataskala, 4,947 (74.5%) are family households, while 1,691 (25.5%) are nonfamily households. The most numerous type of family households are 2-person households, comprising 2,001, and the most common type of nonfamily households are 1-person households, comprising 1,261.
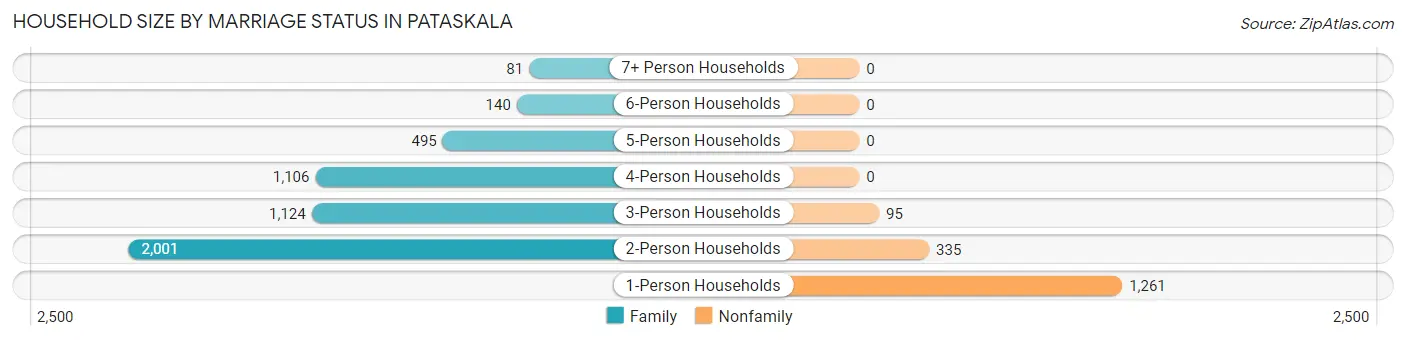
| Household Size | Family Households | Nonfamily Households |
| 1-Person Households | - | 1,261 (19.0%) |
| 2-Person Households | 2,001 (30.1%) | 335 (5.1%) |
| 3-Person Households | 1,124 (16.9%) | 95 (1.4%) |
| 4-Person Households | 1,106 (16.7%) | 0 (0.0%) |
| 5-Person Households | 495 (7.5%) | 0 (0.0%) |
| 6-Person Households | 140 (2.1%) | 0 (0.0%) |
| 7+ Person Households | 81 (1.2%) | 0 (0.0%) |
| Total | 4,947 (74.5%) | 1,691 (25.5%) |
Female Fertility in Pataskala
Fertility by Age in Pataskala
Average fertility rate in Pataskala is 102.0 births per 1,000 women. Women in the age bracket of 20 to 34 years have the highest fertility rate with 195.0 births per 1,000 women. Women in the age bracket of 20 to 34 years acount for 88.0% of all women with births.
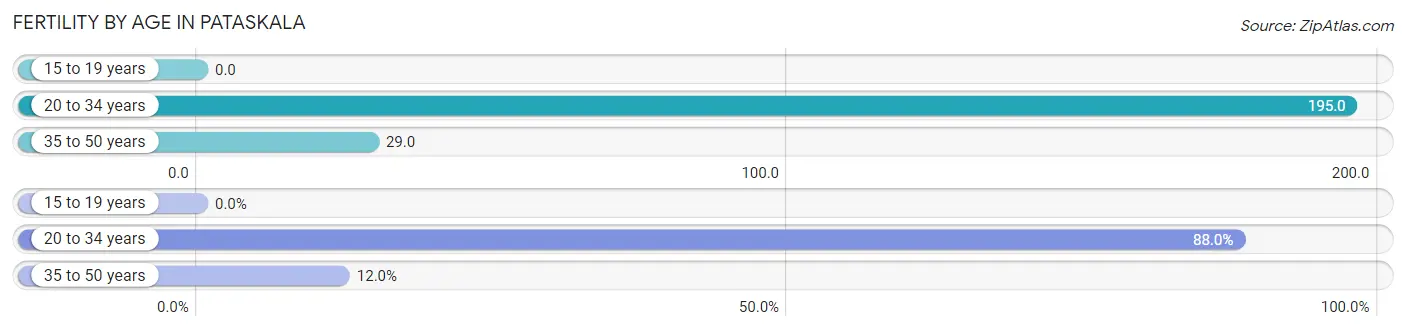
| Age Bracket | Women with Births | Births / 1,000 Women |
| 15 to 19 years | 0 (0.0%) | 0.0 |
| 20 to 34 years | 373 (88.0%) | 195.0 |
| 35 to 50 years | 51 (12.0%) | 29.0 |
| Total | 424 (100.0%) | 102.0 |
Fertility by Age by Marriage Status in Pataskala
68.4% of women with births (424) in Pataskala are married. The highest percentage of unmarried women with births falls into 20 to 34 years age bracket with 35.9% of them unmarried at the time of birth, while the lowest percentage of unmarried women with births belong to 35 to 50 years age bracket with 0.0% of them unmarried.
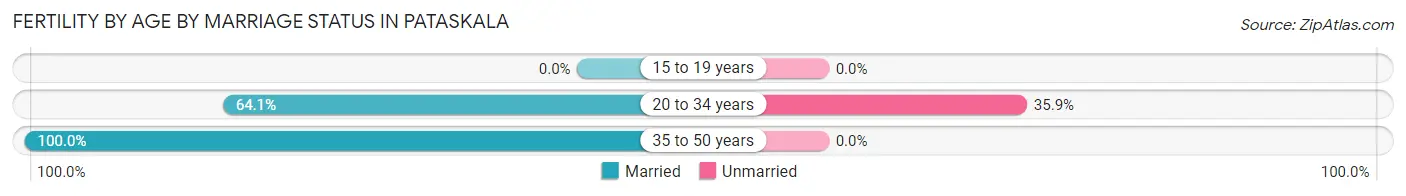
| Age Bracket | Married | Unmarried |
| 15 to 19 years | 0 (0.0%) | 0 (0.0%) |
| 20 to 34 years | 239 (64.1%) | 134 (35.9%) |
| 35 to 50 years | 51 (100.0%) | 0 (0.0%) |
| Total | 290 (68.4%) | 134 (31.6%) |
Fertility by Education in Pataskala
Average fertility rate in Pataskala is 102.0 births per 1,000 women. Women with the education attainment of bachelor's degree have the highest fertility rate of 165.0 births per 1,000 women, while women with the education attainment of graduate degree have the lowest fertility at 42.0 births per 1,000 women. Women with the education attainment of college or associate's degree represent 40.6% of all women with births.
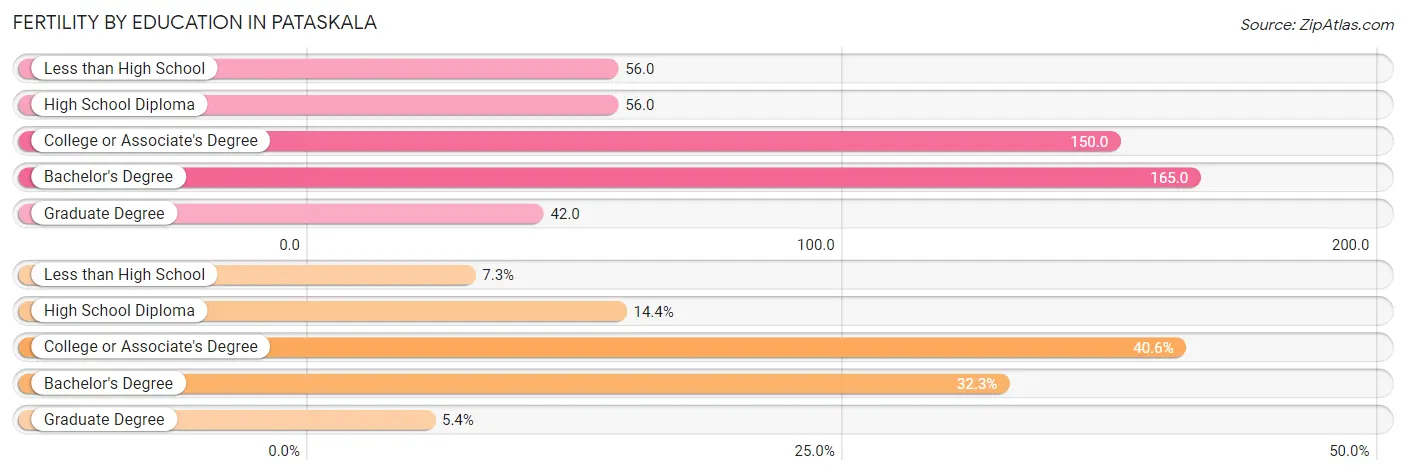
| Educational Attainment | Women with Births | Births / 1,000 Women |
| Less than High School | 31 (7.3%) | 56.0 |
| High School Diploma | 61 (14.4%) | 56.0 |
| College or Associate's Degree | 172 (40.6%) | 150.0 |
| Bachelor's Degree | 137 (32.3%) | 165.0 |
| Graduate Degree | 23 (5.4%) | 42.0 |
| Total | 424 (100.0%) | 102.0 |
Fertility by Education by Marriage Status in Pataskala
31.6% of women with births in Pataskala are unmarried. Women with the educational attainment of graduate degree are most likely to be married with 100.0% of them married at childbirth, while women with the educational attainment of less than high school are least likely to be married with 100.0% of them unmarried at childbirth.
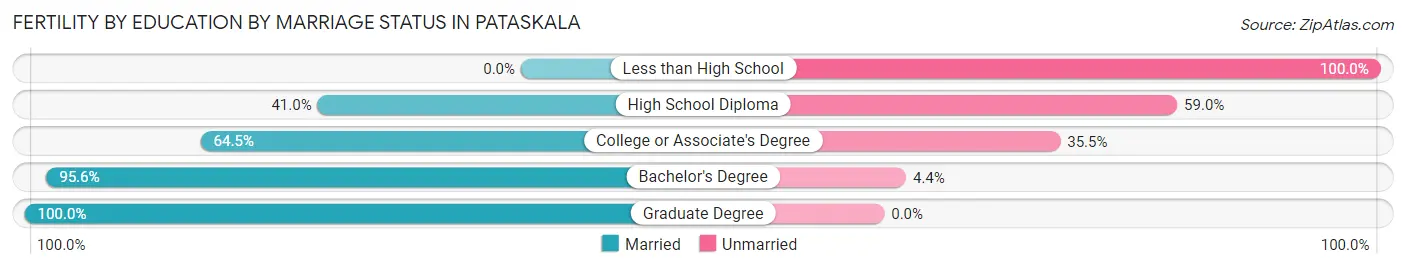
| Educational Attainment | Married | Unmarried |
| Less than High School | 0 (0.0%) | 31 (100.0%) |
| High School Diploma | 25 (41.0%) | 36 (59.0%) |
| College or Associate's Degree | 111 (64.5%) | 61 (35.5%) |
| Bachelor's Degree | 131 (95.6%) | 6 (4.4%) |
| Graduate Degree | 23 (100.0%) | 0 (0.0%) |
| Total | 290 (68.4%) | 134 (31.6%) |
Income in Pataskala
Income Overview in Pataskala
Per Capita Income in Pataskala is $39,393, while median incomes of families and households are $93,063 and $87,246 respectively.
| Characteristic | Number | Measure |
| Per Capita Income | 17,843 | $39,393 |
| Median Family Income | 4,947 | $93,063 |
| Mean Family Income | 4,947 | $108,516 |
| Median Household Income | 6,638 | $87,246 |
| Mean Household Income | 6,638 | $106,148 |
| Income Deficit | 4,947 | $0 |
| Wage / Income Gap (%) | 17,843 | 19.35% |
| Wage / Income Gap ($) | 17,843 | 80.65¢ per $1 |
| Gini / Inequality Index | 17,843 | 0.40 |
Earnings by Sex in Pataskala
Average Earnings in Pataskala are $47,060, $53,054 for men and $42,788 for women, a difference of 19.4%.
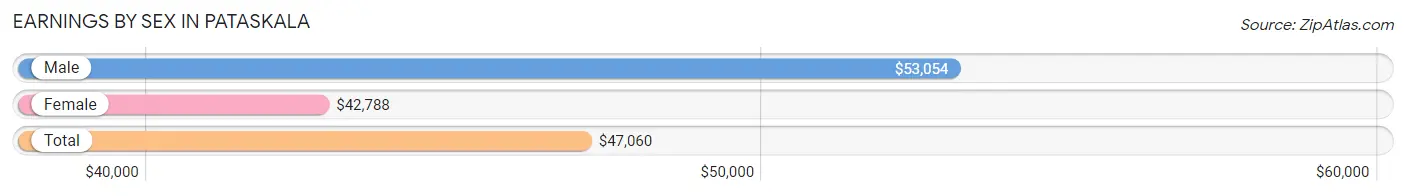
| Sex | Number | Average Earnings |
| Male | 4,947 (51.7%) | $53,054 |
| Female | 4,629 (48.3%) | $42,788 |
| Total | 9,576 (100.0%) | $47,060 |
Earnings by Sex by Income Bracket in Pataskala
The most common earnings brackets in Pataskala are $75,000 to $99,999 for men (805 | 16.3%) and $100,000+ for women (506 | 10.9%).
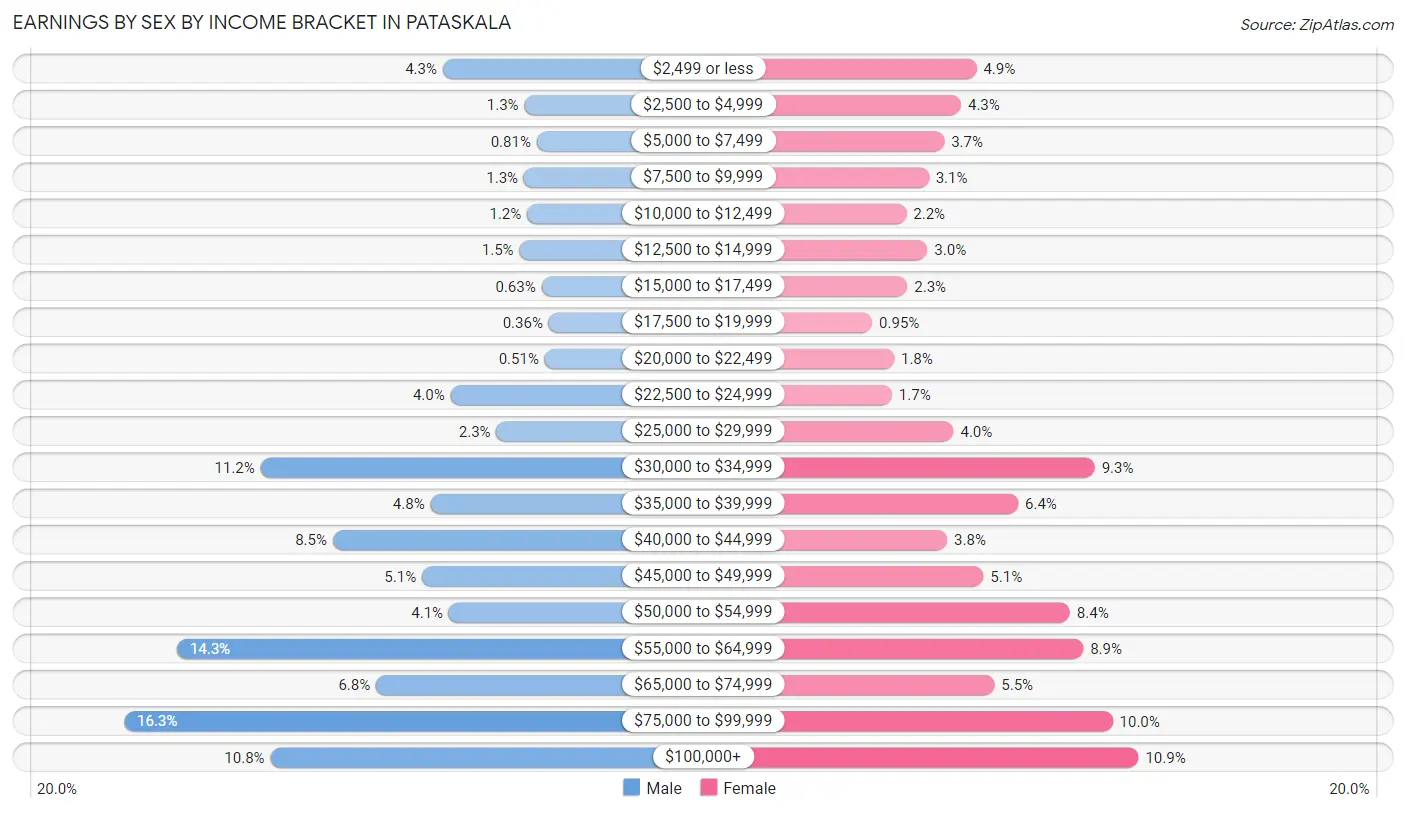
| Income | Male | Female |
| $2,499 or less | 214 (4.3%) | 225 (4.9%) |
| $2,500 to $4,999 | 63 (1.3%) | 198 (4.3%) |
| $5,000 to $7,499 | 40 (0.8%) | 169 (3.6%) |
| $7,500 to $9,999 | 64 (1.3%) | 142 (3.1%) |
| $10,000 to $12,499 | 58 (1.2%) | 103 (2.2%) |
| $12,500 to $14,999 | 72 (1.5%) | 140 (3.0%) |
| $15,000 to $17,499 | 31 (0.6%) | 105 (2.3%) |
| $17,500 to $19,999 | 18 (0.4%) | 44 (0.9%) |
| $20,000 to $22,499 | 25 (0.5%) | 82 (1.8%) |
| $22,500 to $24,999 | 200 (4.0%) | 78 (1.7%) |
| $25,000 to $29,999 | 115 (2.3%) | 185 (4.0%) |
| $30,000 to $34,999 | 552 (11.2%) | 430 (9.3%) |
| $35,000 to $39,999 | 237 (4.8%) | 297 (6.4%) |
| $40,000 to $44,999 | 418 (8.5%) | 174 (3.8%) |
| $45,000 to $49,999 | 253 (5.1%) | 237 (5.1%) |
| $50,000 to $54,999 | 203 (4.1%) | 387 (8.4%) |
| $55,000 to $64,999 | 707 (14.3%) | 410 (8.9%) |
| $65,000 to $74,999 | 338 (6.8%) | 256 (5.5%) |
| $75,000 to $99,999 | 805 (16.3%) | 461 (10.0%) |
| $100,000+ | 534 (10.8%) | 506 (10.9%) |
| Total | 4,947 (100.0%) | 4,629 (100.0%) |
Earnings by Sex by Educational Attainment in Pataskala
Average earnings in Pataskala are $57,115 for men and $46,730 for women, a difference of 18.2%. Men with an educational attainment of graduate degree enjoy the highest average annual earnings of $73,070, while those with high school diploma education earn the least with $43,918. Women with an educational attainment of graduate degree earn the most with the average annual earnings of $64,617, while those with less than high school education have the smallest earnings of $28,929.
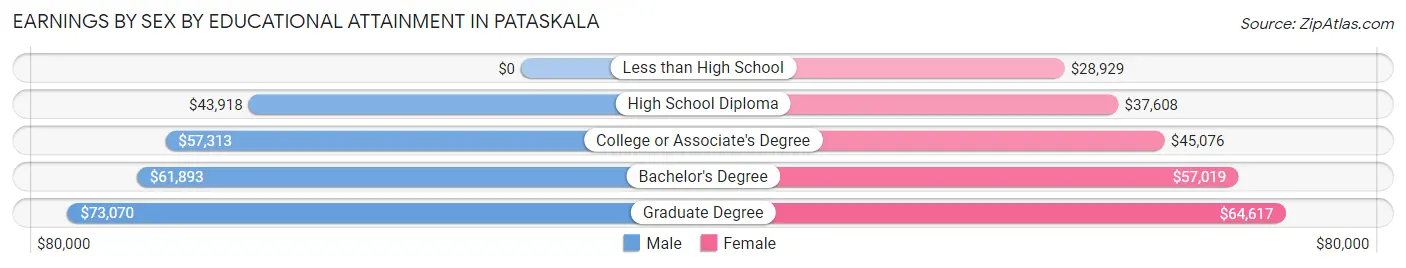
| Educational Attainment | Male Income | Female Income |
| Less than High School | - | - |
| High School Diploma | $43,918 | $37,608 |
| College or Associate's Degree | $57,313 | $45,076 |
| Bachelor's Degree | $61,893 | $57,019 |
| Graduate Degree | $73,070 | $64,617 |
| Total | $57,115 | $46,730 |
Family Income in Pataskala
Family Income Brackets in Pataskala
According to the Pataskala family income data, there are 1,316 families falling into the $100,000 to $149,999 income range, which is the most common income bracket and makes up 26.6% of all families. Conversely, the less than $10,000 income bracket is the least frequent group with only 114 families (2.3%) belonging to this category.
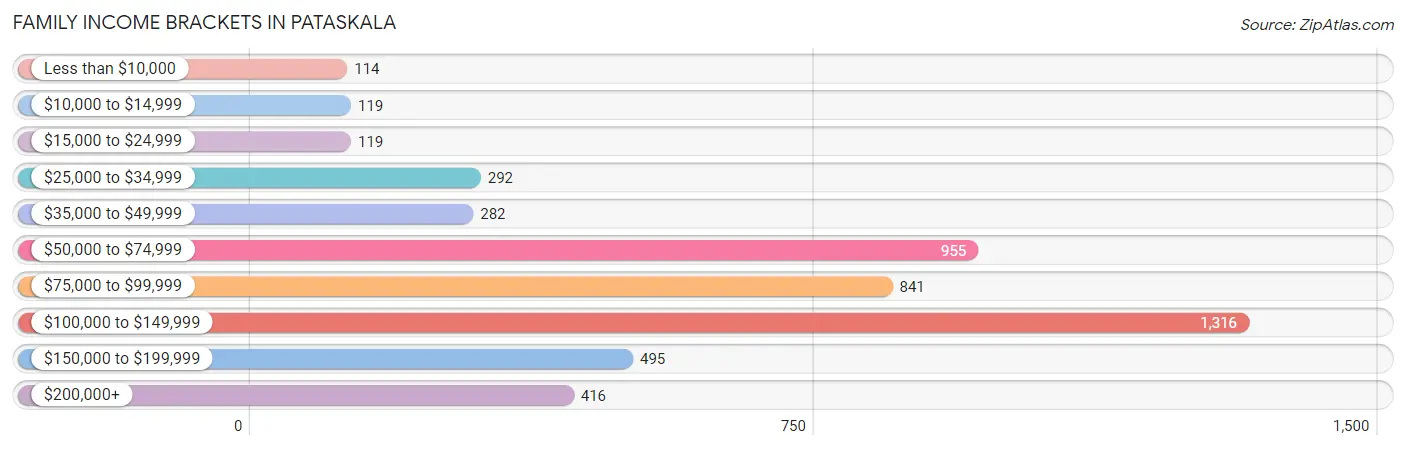
| Income Bracket | # Families | % Families |
| Less than $10,000 | 114 | 2.3% |
| $10,000 to $14,999 | 119 | 2.4% |
| $15,000 to $24,999 | 119 | 2.4% |
| $25,000 to $34,999 | 292 | 5.9% |
| $35,000 to $49,999 | 282 | 5.7% |
| $50,000 to $74,999 | 955 | 19.3% |
| $75,000 to $99,999 | 841 | 17.0% |
| $100,000 to $149,999 | 1,316 | 26.6% |
| $150,000 to $199,999 | 495 | 10.0% |
| $200,000+ | 416 | 8.4% |
Family Income by Famaliy Size in Pataskala
6-person families (140 | 2.8%) account for the highest median family income in Pataskala with $127,500 per family, while 2-person families (2,291 | 46.3%) have the highest median income of $38,910 per family member.
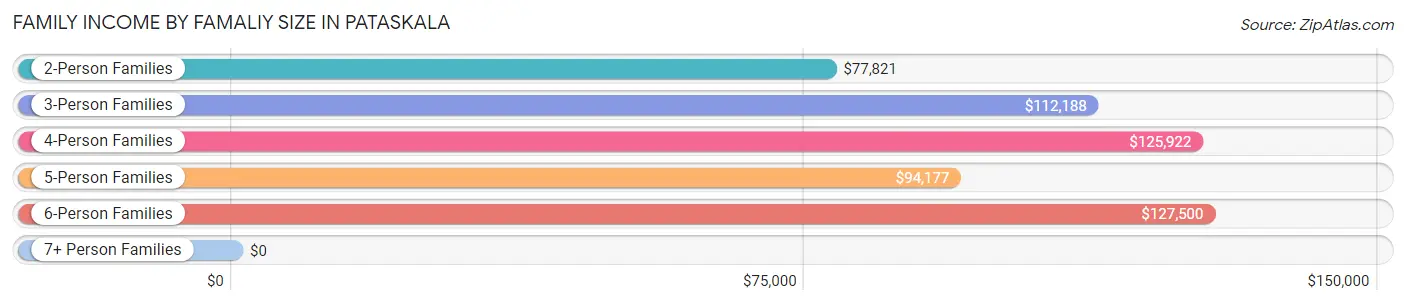
| Income Bracket | # Families | Median Income |
| 2-Person Families | 2,291 (46.3%) | $77,821 |
| 3-Person Families | 1,010 (20.4%) | $112,188 |
| 4-Person Families | 931 (18.8%) | $125,922 |
| 5-Person Families | 495 (10.0%) | $94,177 |
| 6-Person Families | 140 (2.8%) | $127,500 |
| 7+ Person Families | 80 (1.6%) | $0 |
| Total | 4,947 (100.0%) | $93,063 |
Family Income by Number of Earners in Pataskala
The median family income in Pataskala is $93,063, with families comprising 3+ earners (504) having the highest median family income of $148,869, while families with no earners (588) have the lowest median family income of $45,581, accounting for 10.2% and 11.9% of families, respectively.
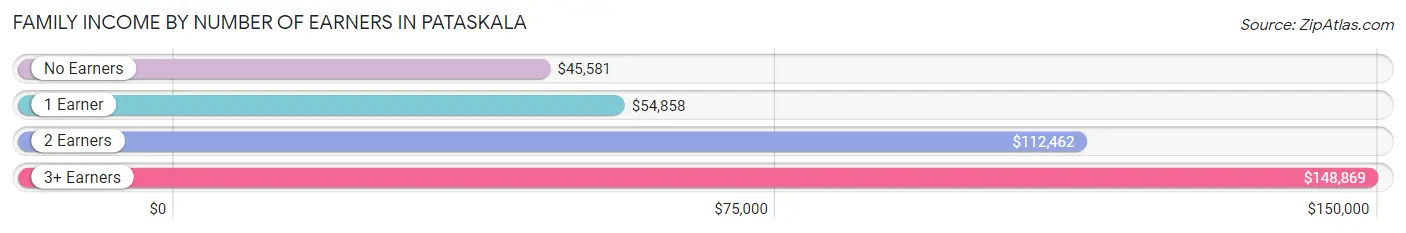
| Number of Earners | # Families | Median Income |
| No Earners | 588 (11.9%) | $45,581 |
| 1 Earner | 1,467 (29.6%) | $54,858 |
| 2 Earners | 2,388 (48.3%) | $112,462 |
| 3+ Earners | 504 (10.2%) | $148,869 |
| Total | 4,947 (100.0%) | $93,063 |
Household Income in Pataskala
Household Income Brackets in Pataskala
With 1,693 households falling in the category, the $100,000 to $149,999 income range is the most frequent in Pataskala, accounting for 25.5% of all households. In contrast, only 126 households (1.9%) fall into the less than $10,000 income bracket, making it the least populous group.
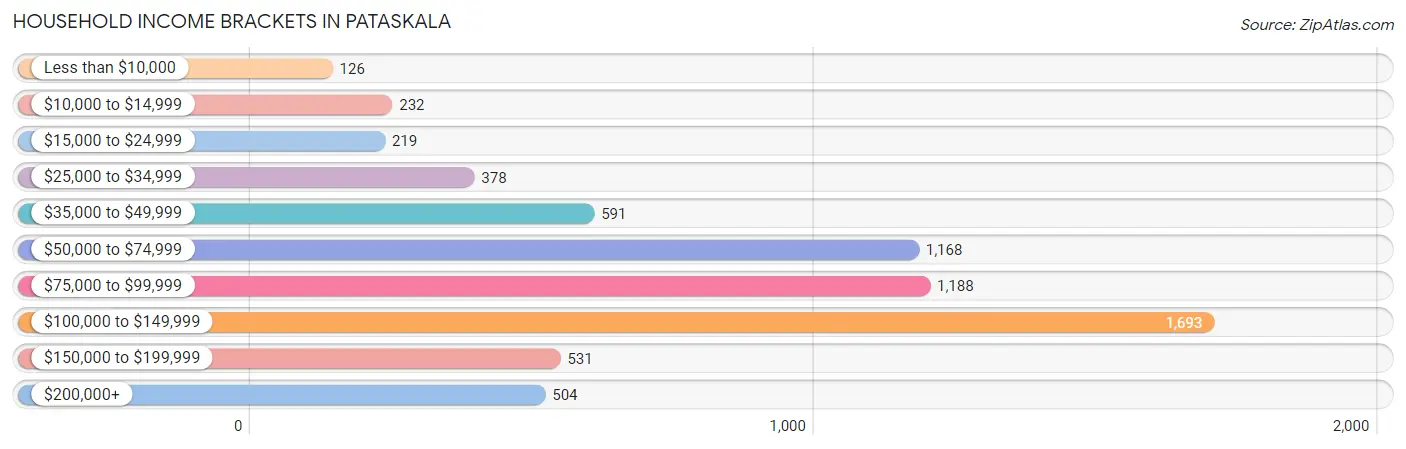
| Income Bracket | # Households | % Households |
| Less than $10,000 | 126 | 1.9% |
| $10,000 to $14,999 | 232 | 3.5% |
| $15,000 to $24,999 | 219 | 3.3% |
| $25,000 to $34,999 | 378 | 5.7% |
| $35,000 to $49,999 | 591 | 8.9% |
| $50,000 to $74,999 | 1,168 | 17.6% |
| $75,000 to $99,999 | 1,188 | 17.9% |
| $100,000 to $149,999 | 1,693 | 25.5% |
| $150,000 to $199,999 | 531 | 8.0% |
| $200,000+ | 504 | 7.6% |
Household Income by Householder Age in Pataskala
The median household income in Pataskala is $87,246, with the highest median household income of $99,725 found in the 45 to 64 years age bracket for the primary householder. A total of 2,561 households (38.6%) fall into this category. Meanwhile, the 15 to 24 years age bracket for the primary householder has the lowest median household income of $0, with 100 households (1.5%) in this group.
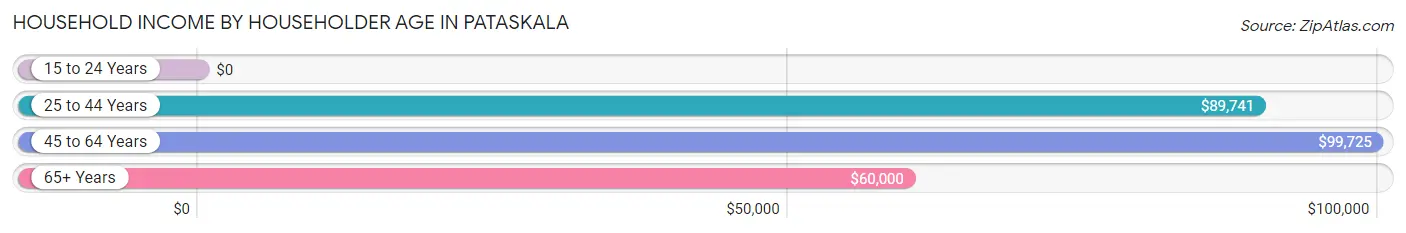
| Income Bracket | # Households | Median Income |
| 15 to 24 Years | 100 (1.5%) | $0 |
| 25 to 44 Years | 2,635 (39.7%) | $89,741 |
| 45 to 64 Years | 2,561 (38.6%) | $99,725 |
| 65+ Years | 1,342 (20.2%) | $60,000 |
| Total | 6,638 (100.0%) | $87,246 |
Poverty in Pataskala
Income Below Poverty by Sex and Age in Pataskala
With 4.5% poverty level for males and 8.6% for females among the residents of Pataskala, under 5 year old males and under 5 year old females are the most vulnerable to poverty, with 131 males (20.9%) and 147 females (19.2%) in their respective age groups living below the poverty level.
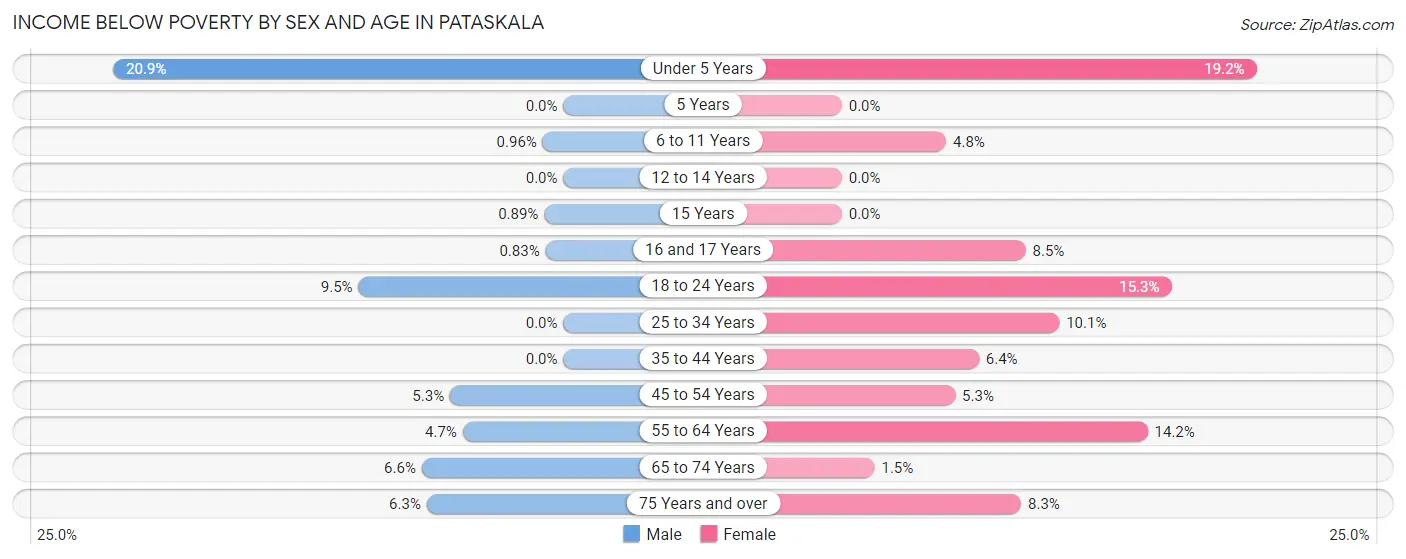
| Age Bracket | Male | Female |
| Under 5 Years | 131 (20.9%) | 147 (19.2%) |
| 5 Years | 0 (0.0%) | 0 (0.0%) |
| 6 to 11 Years | 7 (1.0%) | 40 (4.8%) |
| 12 to 14 Years | 0 (0.0%) | 0 (0.0%) |
| 15 Years | 1 (0.9%) | 0 (0.0%) |
| 16 and 17 Years | 2 (0.8%) | 22 (8.5%) |
| 18 to 24 Years | 70 (9.5%) | 74 (15.3%) |
| 25 to 34 Years | 0 (0.0%) | 154 (10.1%) |
| 35 to 44 Years | 0 (0.0%) | 73 (6.4%) |
| 45 to 54 Years | 60 (5.3%) | 62 (5.3%) |
| 55 to 64 Years | 51 (4.7%) | 143 (14.2%) |
| 65 to 74 Years | 52 (6.6%) | 13 (1.5%) |
| 75 Years and over | 21 (6.3%) | 39 (8.3%) |
| Total | 395 (4.5%) | 767 (8.6%) |
Income Above Poverty by Sex and Age in Pataskala
According to the poverty statistics in Pataskala, males aged 5 years and females aged 5 years are the age groups that are most secure financially, with 100.0% of males and 100.0% of females in these age groups living above the poverty line.
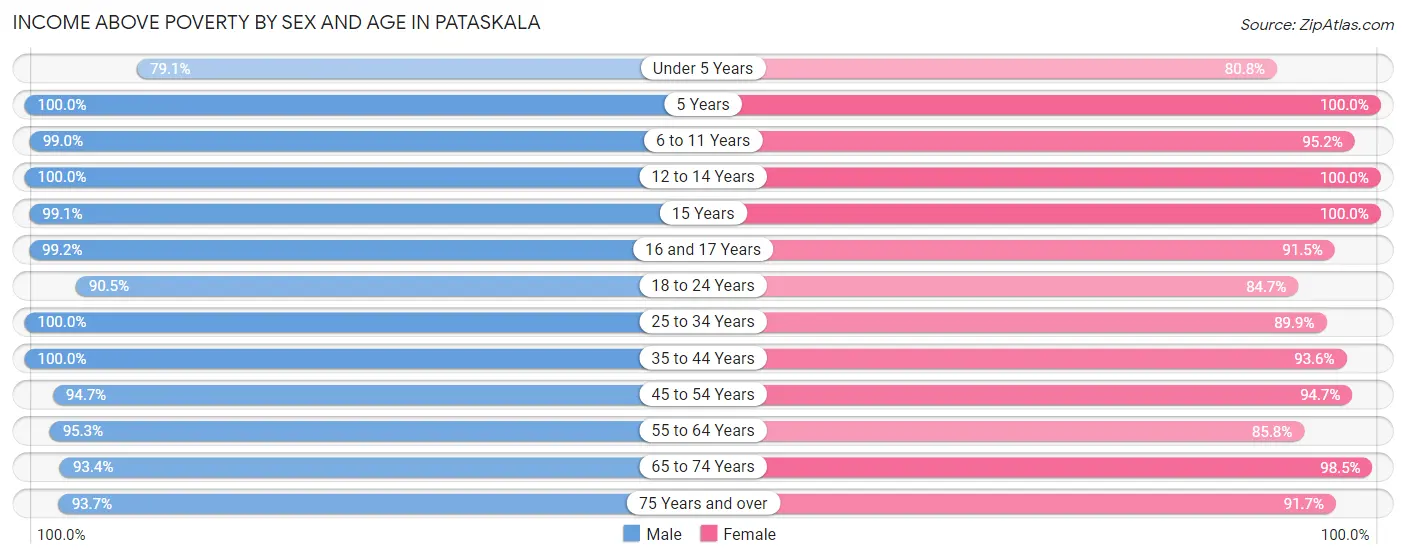
| Age Bracket | Male | Female |
| Under 5 Years | 496 (79.1%) | 617 (80.8%) |
| 5 Years | 61 (100.0%) | 31 (100.0%) |
| 6 to 11 Years | 722 (99.0%) | 787 (95.2%) |
| 12 to 14 Years | 385 (100.0%) | 256 (100.0%) |
| 15 Years | 111 (99.1%) | 117 (100.0%) |
| 16 and 17 Years | 239 (99.2%) | 236 (91.5%) |
| 18 to 24 Years | 666 (90.5%) | 410 (84.7%) |
| 25 to 34 Years | 1,469 (100.0%) | 1,373 (89.9%) |
| 35 to 44 Years | 977 (100.0%) | 1,075 (93.6%) |
| 45 to 54 Years | 1,081 (94.7%) | 1,117 (94.7%) |
| 55 to 64 Years | 1,041 (95.3%) | 865 (85.8%) |
| 65 to 74 Years | 740 (93.4%) | 840 (98.5%) |
| 75 Years and over | 310 (93.7%) | 430 (91.7%) |
| Total | 8,298 (95.5%) | 8,154 (91.4%) |
Income Below Poverty Among Married-Couple Families in Pataskala
The poverty statistics for married-couple families in Pataskala show that 1.8% or 69 of the total 3,847 families live below the poverty line. Families with no children have the highest poverty rate of 3.0%, comprising of 58 families. On the other hand, families with 3 or 4 children have the lowest poverty rate of 0.0%, which includes 0 families.
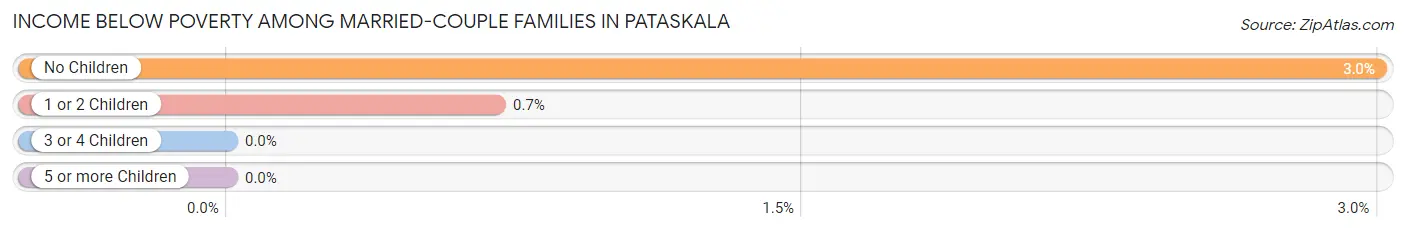
| Children | Above Poverty | Below Poverty |
| No Children | 1,876 (97.0%) | 58 (3.0%) |
| 1 or 2 Children | 1,554 (99.3%) | 11 (0.7%) |
| 3 or 4 Children | 338 (100.0%) | 0 (0.0%) |
| 5 or more Children | 10 (100.0%) | 0 (0.0%) |
| Total | 3,778 (98.2%) | 69 (1.8%) |
Income Below Poverty Among Single-Parent Households in Pataskala
According to the poverty data in Pataskala, 3.7% or 6 single-father households and 25.7% or 241 single-mother households are living below the poverty line. Among single-father households, those with 1 or 2 children have the highest poverty rate, with 6 households (7.6%) experiencing poverty. Likewise, among single-mother households, those with 1 or 2 children have the highest poverty rate, with 241 households (60.4%) falling below the poverty line.
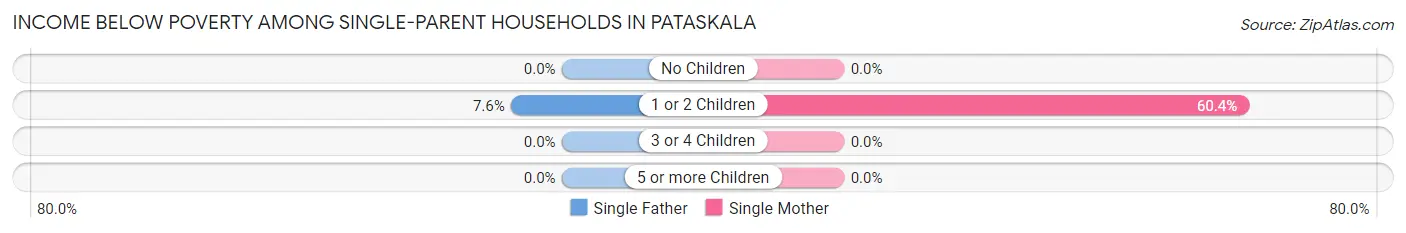
| Children | Single Father | Single Mother |
| No Children | 0 (0.0%) | 0 (0.0%) |
| 1 or 2 Children | 6 (7.6%) | 241 (60.4%) |
| 3 or 4 Children | 0 (0.0%) | 0 (0.0%) |
| 5 or more Children | 0 (0.0%) | 0 (0.0%) |
| Total | 6 (3.7%) | 241 (25.7%) |
Income Below Poverty Among Married-Couple vs Single-Parent Households in Pataskala
The poverty data for Pataskala shows that 69 of the married-couple family households (1.8%) and 247 of the single-parent households (22.5%) are living below the poverty level. Within the married-couple family households, those with no children have the highest poverty rate, with 58 households (3.0%) falling below the poverty line. Among the single-parent households, those with 1 or 2 children have the highest poverty rate, with 247 household (51.7%) living below poverty.
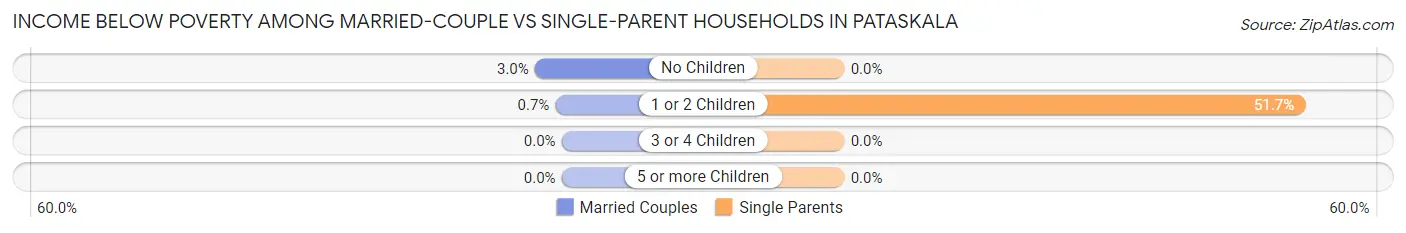
| Children | Married-Couple Families | Single-Parent Households |
| No Children | 58 (3.0%) | 0 (0.0%) |
| 1 or 2 Children | 11 (0.7%) | 247 (51.7%) |
| 3 or 4 Children | 0 (0.0%) | 0 (0.0%) |
| 5 or more Children | 0 (0.0%) | 0 (0.0%) |
| Total | 69 (1.8%) | 247 (22.5%) |
Employment Characteristics in Pataskala
Employment by Class of Employer in Pataskala
Among the 8,823 employed individuals in Pataskala, private company employees (6,117 | 69.3%), local government employees (805 | 9.1%), and not-for-profit organizations (778 | 8.8%) make up the most common classes of employment.
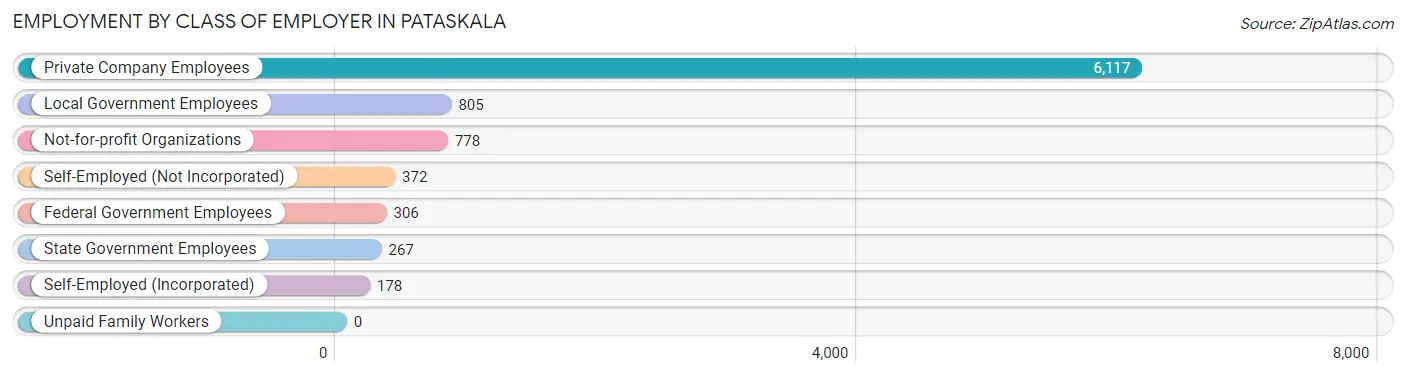
| Employer Class | # Employees | % Employees |
| Private Company Employees | 6,117 | 69.3% |
| Self-Employed (Incorporated) | 178 | 2.0% |
| Self-Employed (Not Incorporated) | 372 | 4.2% |
| Not-for-profit Organizations | 778 | 8.8% |
| Local Government Employees | 805 | 9.1% |
| State Government Employees | 267 | 3.0% |
| Federal Government Employees | 306 | 3.5% |
| Unpaid Family Workers | 0 | 0.0% |
| Total | 8,823 | 100.0% |
Employment Status by Age in Pataskala
According to the labor force statistics for Pataskala, out of the total population over 16 years of age (13,844), 67.2% or 9,303 individuals are in the labor force, with 3.2% or 298 of them unemployed. The age group with the highest labor force participation rate is 25 to 29 years, with 88.4% or 873 individuals in the labor force. Within the labor force, the 20 to 24 years age range has the highest percentage of unemployed individuals, with 14.0% or 102 of them being unemployed.
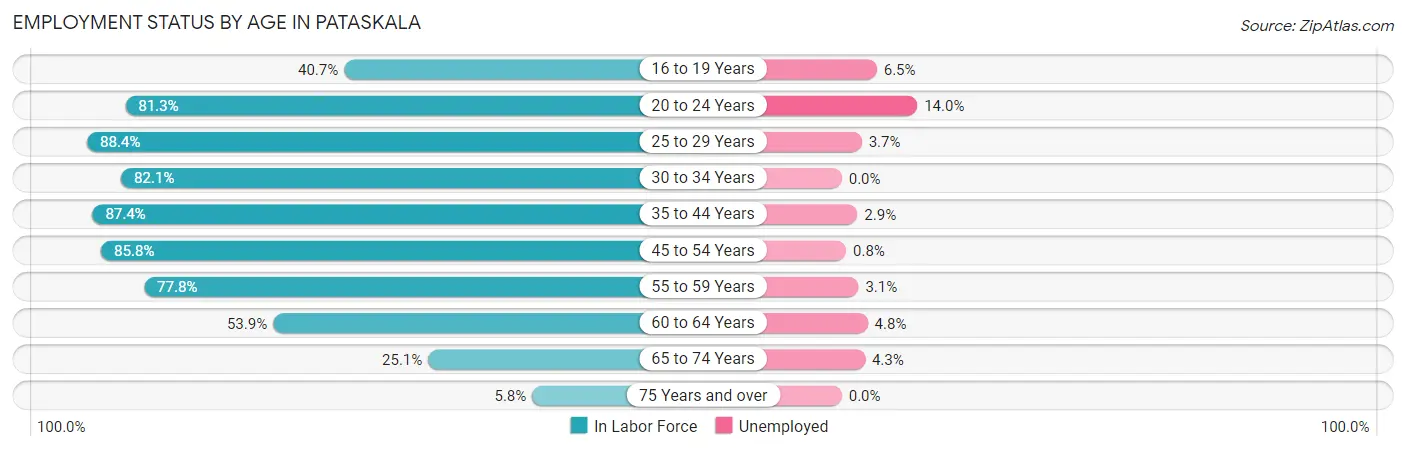
| Age Bracket | In Labor Force | Unemployed |
| 16 to 19 Years | 336 (40.7%) | 22 (6.5%) |
| 20 to 24 Years | 727 (81.3%) | 102 (14.0%) |
| 25 to 29 Years | 873 (88.4%) | 32 (3.7%) |
| 30 to 34 Years | 1,649 (82.1%) | 0 (0.0%) |
| 35 to 44 Years | 1,857 (87.4%) | 54 (2.9%) |
| 45 to 54 Years | 2,002 (85.8%) | 16 (0.8%) |
| 55 to 59 Years | 734 (77.8%) | 23 (3.1%) |
| 60 to 64 Years | 648 (53.9%) | 31 (4.8%) |
| 65 to 74 Years | 422 (25.1%) | 18 (4.3%) |
| 75 Years and over | 49 (5.8%) | 0 (0.0%) |
| Total | 9,303 (67.2%) | 298 (3.2%) |
Employment Status by Educational Attainment in Pataskala
According to labor force statistics for Pataskala, 80.9% of individuals (7,767) out of the total population between 25 and 64 years of age (9,601) are in the labor force, with 2.0% or 155 of them being unemployed. The group with the highest labor force participation rate are those with the educational attainment of bachelor's degree or higher, with 94.1% or 2,750 individuals in the labor force. Within the labor force, individuals with less than high school education have the highest percentage of unemployment, with 5.0% or 15 of them being unemployed.
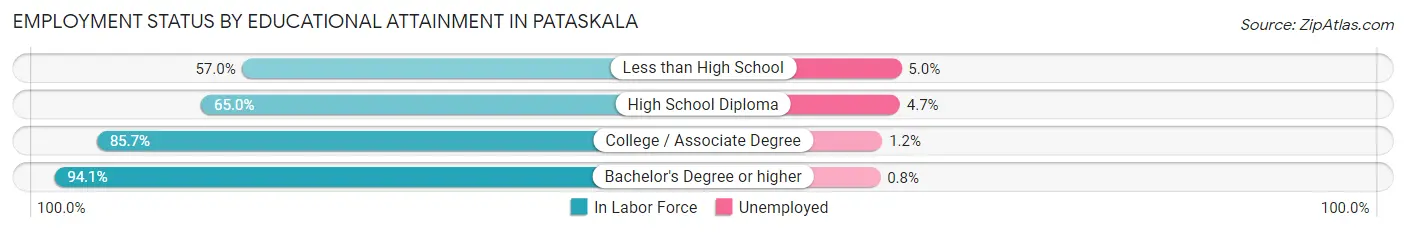
| Educational Attainment | In Labor Force | Unemployed |
| Less than High School | 301 (57.0%) | 26 (5.0%) |
| High School Diploma | 1,754 (65.0%) | 127 (4.7%) |
| College / Associate Degree | 2,959 (85.7%) | 41 (1.2%) |
| Bachelor's Degree or higher | 2,750 (94.1%) | 23 (0.8%) |
| Total | 7,767 (80.9%) | 192 (2.0%) |
Employment Occupations by Sex in Pataskala
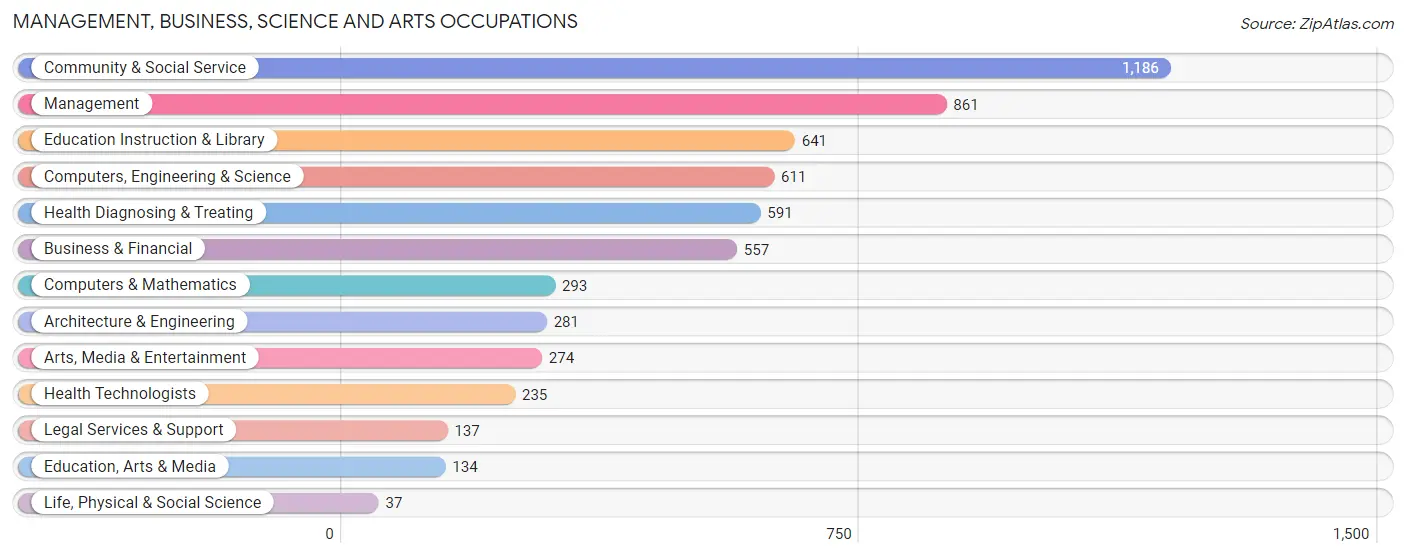
Management, Business, Science and Arts Occupations
The most common Management, Business, Science and Arts occupations in Pataskala are Community & Social Service (1,186 | 13.2%), Management (861 | 9.6%), Education Instruction & Library (641 | 7.2%), Computers, Engineering & Science (611 | 6.8%), and Health Diagnosing & Treating (591 | 6.6%).
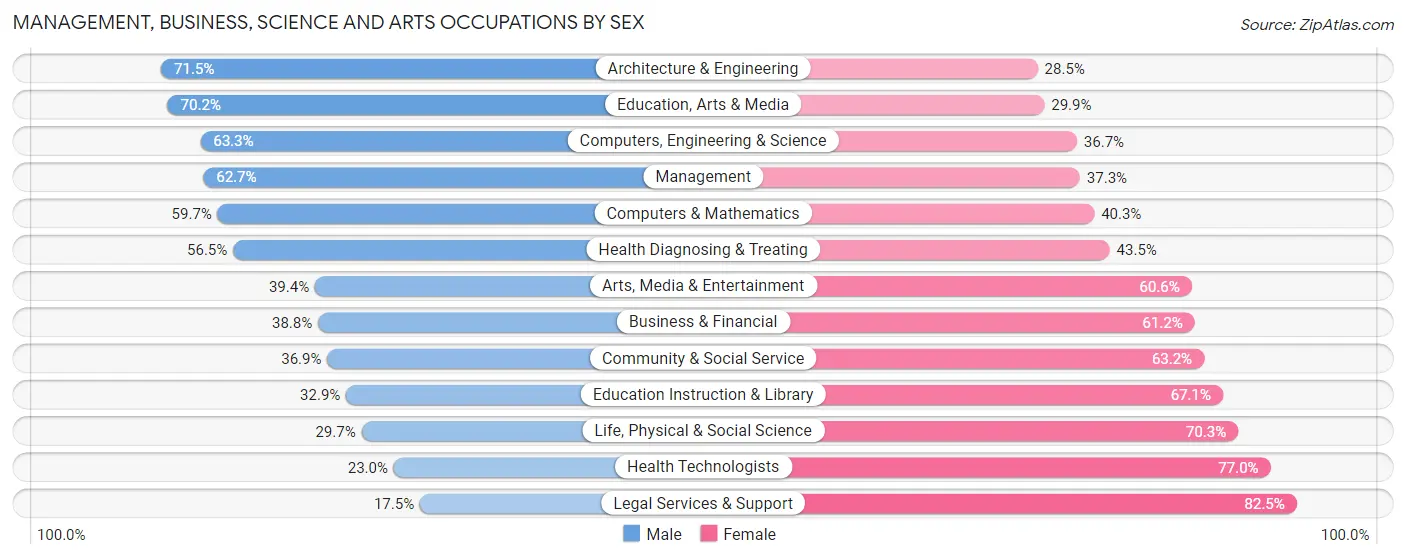
Management, Business, Science and Arts Occupations by Sex
Within the Management, Business, Science and Arts occupations in Pataskala, the most male-oriented occupations are Architecture & Engineering (71.5%), Education, Arts & Media (70.2%), and Computers, Engineering & Science (63.3%), while the most female-oriented occupations are Legal Services & Support (82.5%), Health Technologists (77.0%), and Life, Physical & Social Science (70.3%).
| Occupation | Male | Female |
| Management | 540 (62.7%) | 321 (37.3%) |
| Business & Financial | 216 (38.8%) | 341 (61.2%) |
| Computers, Engineering & Science | 387 (63.3%) | 224 (36.7%) |
| Computers & Mathematics | 175 (59.7%) | 118 (40.3%) |
| Architecture & Engineering | 201 (71.5%) | 80 (28.5%) |
| Life, Physical & Social Science | 11 (29.7%) | 26 (70.3%) |
| Community & Social Service | 437 (36.8%) | 749 (63.1%) |
| Education, Arts & Media | 94 (70.2%) | 40 (29.8%) |
| Legal Services & Support | 24 (17.5%) | 113 (82.5%) |
| Education Instruction & Library | 211 (32.9%) | 430 (67.1%) |
| Arts, Media & Entertainment | 108 (39.4%) | 166 (60.6%) |
| Health Diagnosing & Treating | 334 (56.5%) | 257 (43.5%) |
| Health Technologists | 54 (23.0%) | 181 (77.0%) |
| Total (Category) | 1,914 (50.3%) | 1,892 (49.7%) |
| Total (Overall) | 4,617 (51.5%) | 4,341 (48.5%) |
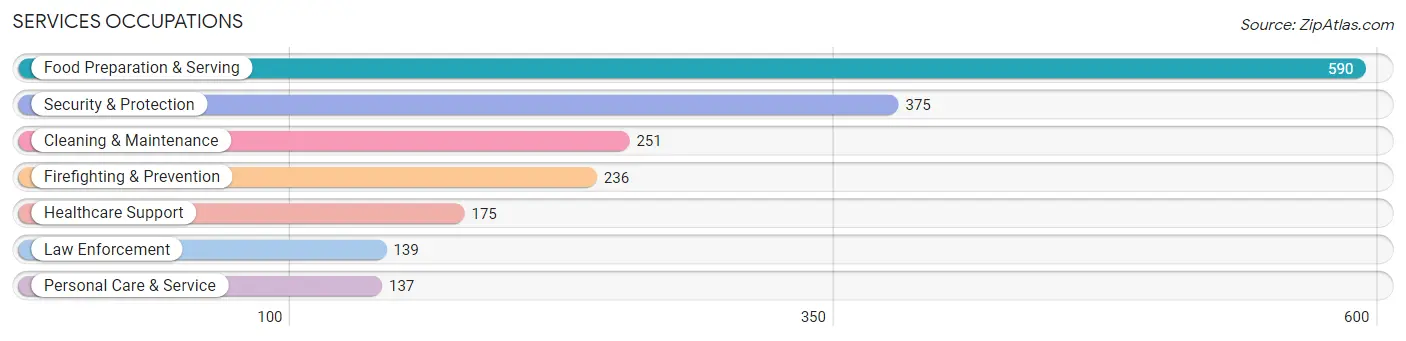
Services Occupations
The most common Services occupations in Pataskala are Food Preparation & Serving (590 | 6.6%), Security & Protection (375 | 4.2%), Cleaning & Maintenance (251 | 2.8%), Firefighting & Prevention (236 | 2.6%), and Healthcare Support (175 | 1.9%).
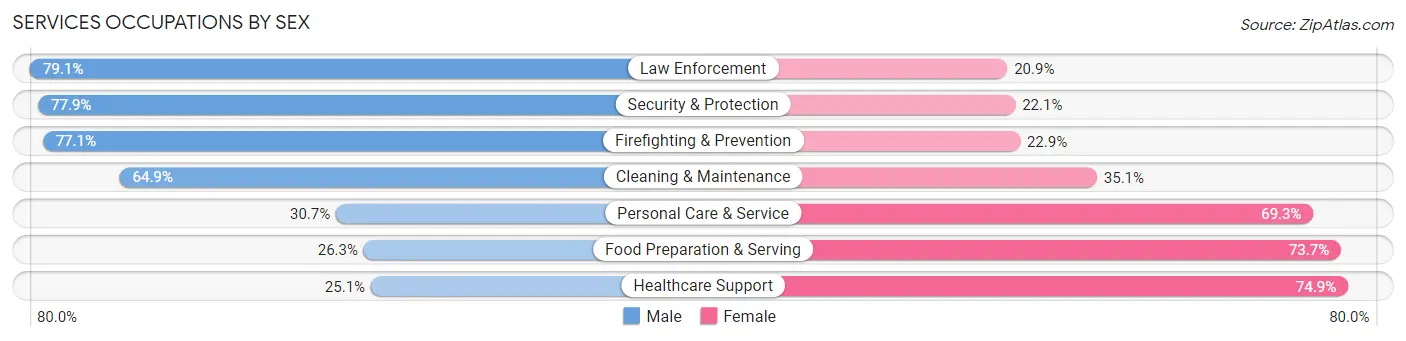
Services Occupations by Sex
Within the Services occupations in Pataskala, the most male-oriented occupations are Law Enforcement (79.1%), Security & Protection (77.9%), and Firefighting & Prevention (77.1%), while the most female-oriented occupations are Healthcare Support (74.9%), Food Preparation & Serving (73.7%), and Personal Care & Service (69.3%).
| Occupation | Male | Female |
| Healthcare Support | 44 (25.1%) | 131 (74.9%) |
| Security & Protection | 292 (77.9%) | 83 (22.1%) |
| Firefighting & Prevention | 182 (77.1%) | 54 (22.9%) |
| Law Enforcement | 110 (79.1%) | 29 (20.9%) |
| Food Preparation & Serving | 155 (26.3%) | 435 (73.7%) |
| Cleaning & Maintenance | 163 (64.9%) | 88 (35.1%) |
| Personal Care & Service | 42 (30.7%) | 95 (69.3%) |
| Total (Category) | 696 (45.6%) | 832 (54.4%) |
| Total (Overall) | 4,617 (51.5%) | 4,341 (48.5%) |
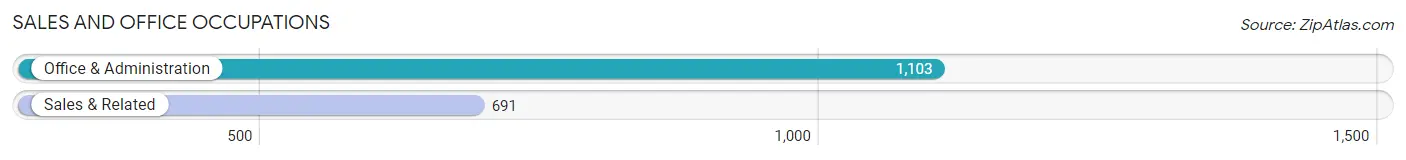
Sales and Office Occupations
The most common Sales and Office occupations in Pataskala are Office & Administration (1,103 | 12.3%), and Sales & Related (691 | 7.7%).
Sales and Office Occupations by Sex
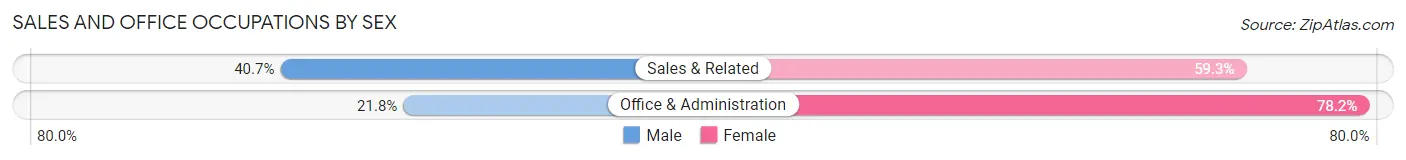
| Occupation | Male | Female |
| Sales & Related | 281 (40.7%) | 410 (59.3%) |
| Office & Administration | 240 (21.8%) | 863 (78.2%) |
| Total (Category) | 521 (29.0%) | 1,273 (71.0%) |
| Total (Overall) | 4,617 (51.5%) | 4,341 (48.5%) |
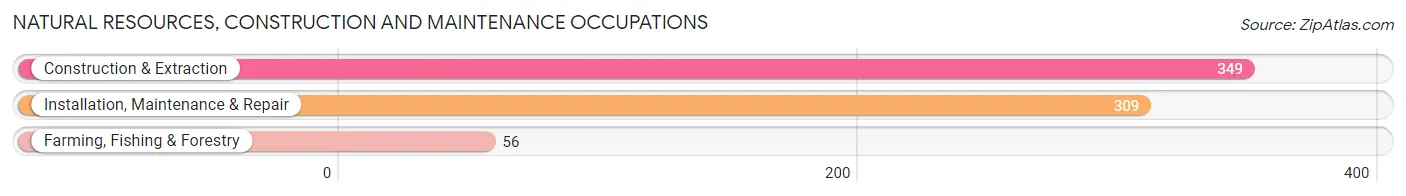
Natural Resources, Construction and Maintenance Occupations
The most common Natural Resources, Construction and Maintenance occupations in Pataskala are Construction & Extraction (349 | 3.9%), Installation, Maintenance & Repair (309 | 3.5%), and Farming, Fishing & Forestry (56 | 0.6%).
Natural Resources, Construction and Maintenance Occupations by Sex
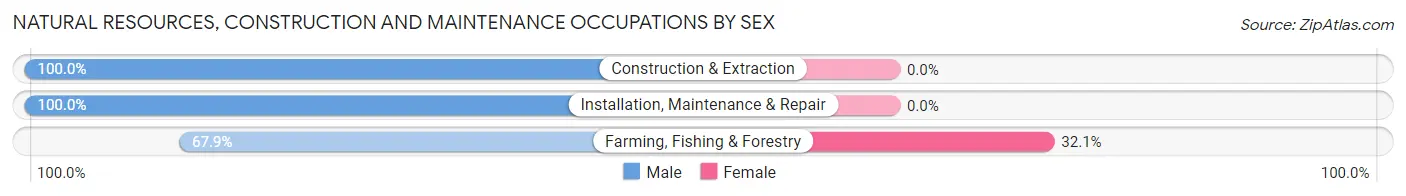
| Occupation | Male | Female |
| Farming, Fishing & Forestry | 38 (67.9%) | 18 (32.1%) |
| Construction & Extraction | 349 (100.0%) | 0 (0.0%) |
| Installation, Maintenance & Repair | 309 (100.0%) | 0 (0.0%) |
| Total (Category) | 696 (97.5%) | 18 (2.5%) |
| Total (Overall) | 4,617 (51.5%) | 4,341 (48.5%) |
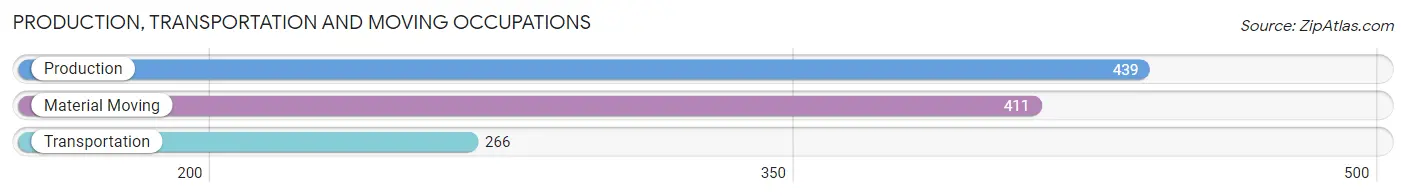
Production, Transportation and Moving Occupations
The most common Production, Transportation and Moving occupations in Pataskala are Production (439 | 4.9%), Material Moving (411 | 4.6%), and Transportation (266 | 3.0%).
Production, Transportation and Moving Occupations by Sex
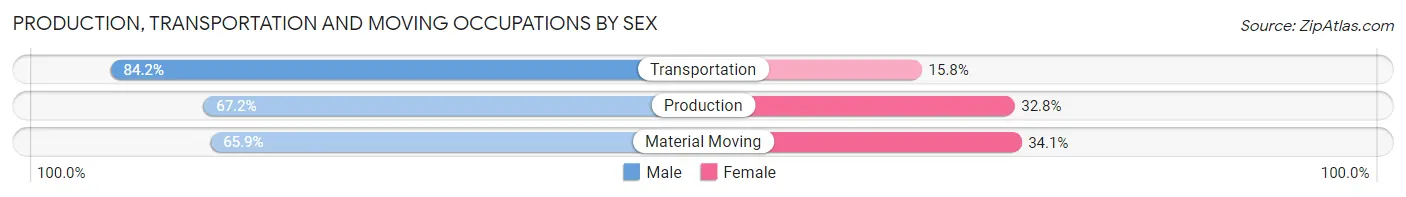
| Occupation | Male | Female |
| Production | 295 (67.2%) | 144 (32.8%) |
| Transportation | 224 (84.2%) | 42 (15.8%) |
| Material Moving | 271 (65.9%) | 140 (34.1%) |
| Total (Category) | 790 (70.8%) | 326 (29.2%) |
| Total (Overall) | 4,617 (51.5%) | 4,341 (48.5%) |
Employment Industries by Sex in Pataskala
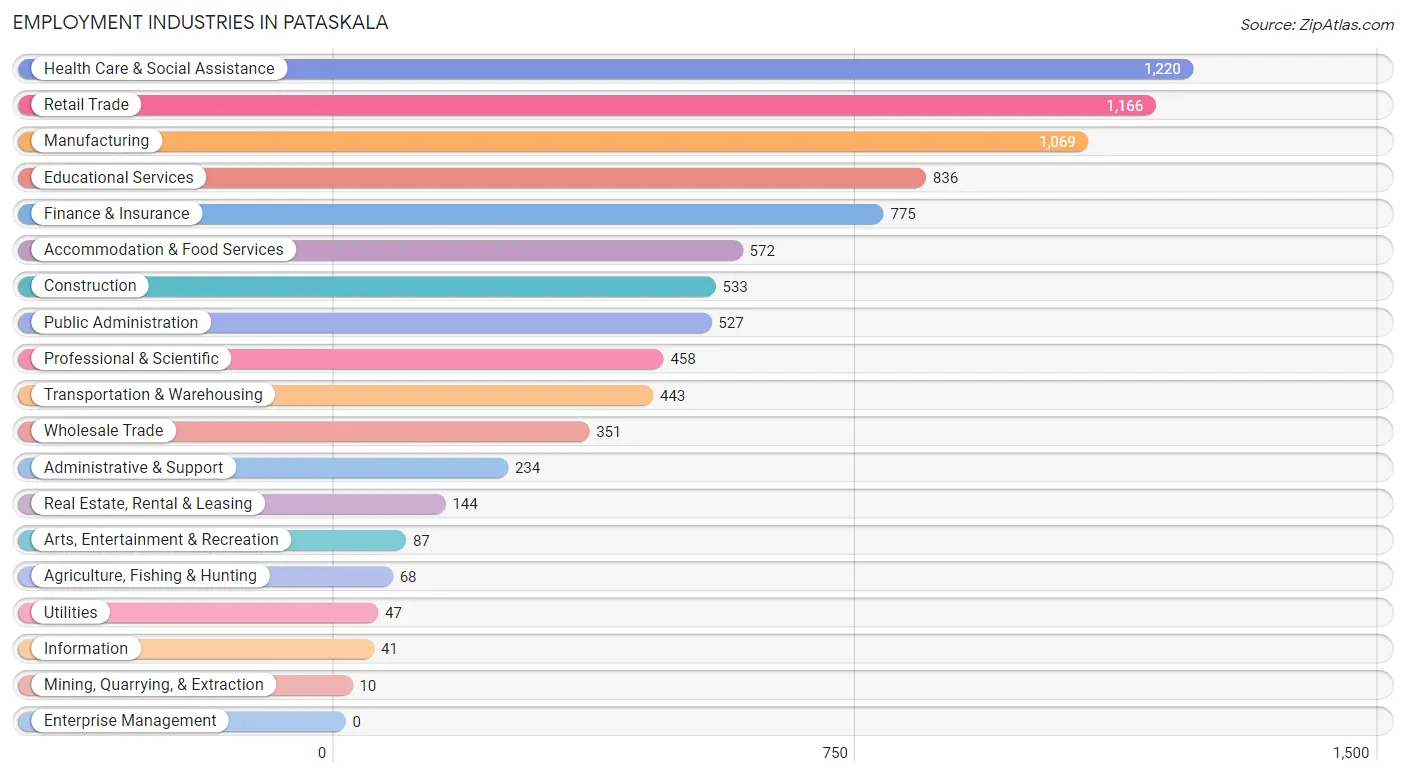
Employment Industries in Pataskala
The major employment industries in Pataskala include Health Care & Social Assistance (1,220 | 13.6%), Retail Trade (1,166 | 13.0%), Manufacturing (1,069 | 11.9%), Educational Services (836 | 9.3%), and Finance & Insurance (775 | 8.6%).
Employment Industries by Sex in Pataskala
The Pataskala industries that see more men than women are Mining, Quarrying, & Extraction (100.0%), Construction (88.6%), and Administrative & Support (70.5%), whereas the industries that tend to have a higher number of women are Information (75.6%), Finance & Insurance (75.3%), and Accommodation & Food Services (68.0%).
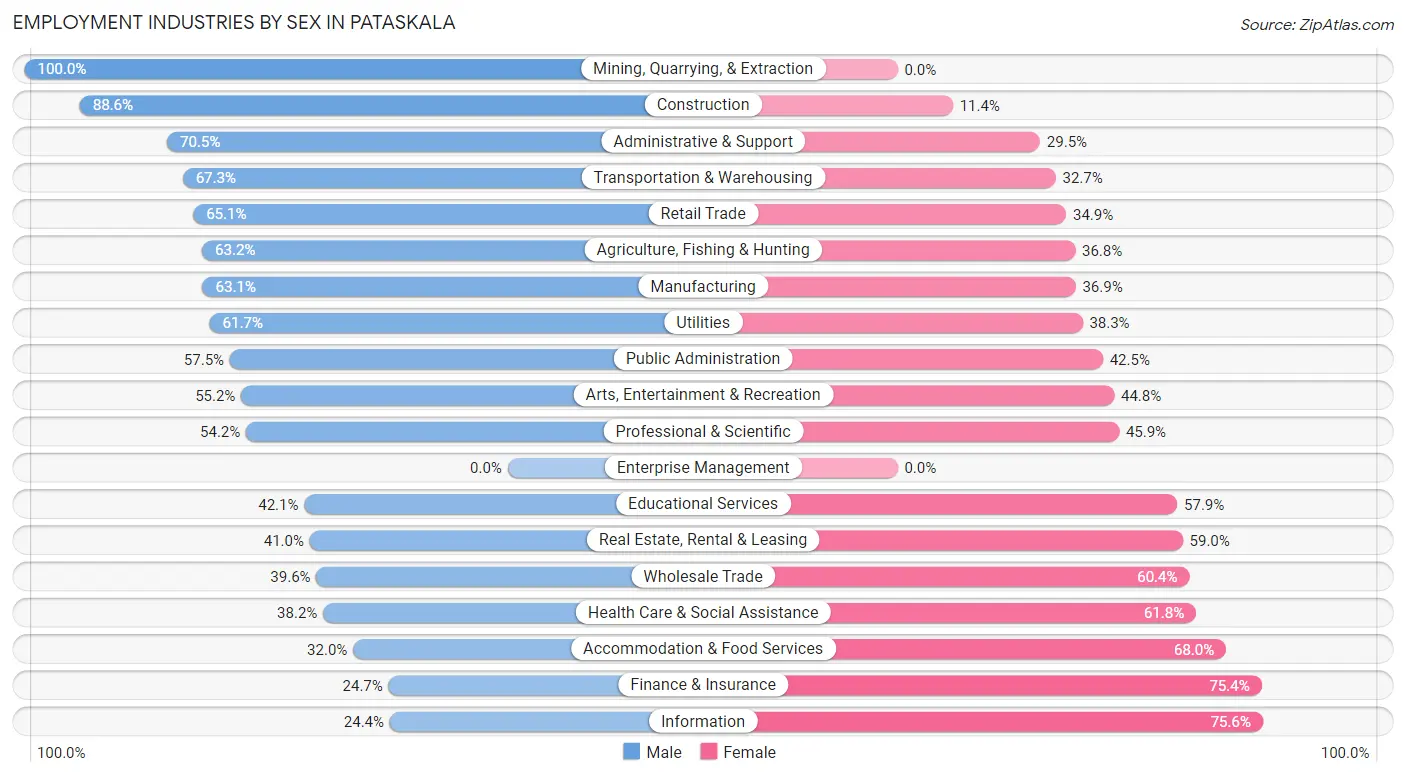
| Industry | Male | Female |
| Agriculture, Fishing & Hunting | 43 (63.2%) | 25 (36.8%) |
| Mining, Quarrying, & Extraction | 10 (100.0%) | 0 (0.0%) |
| Construction | 472 (88.6%) | 61 (11.4%) |
| Manufacturing | 675 (63.1%) | 394 (36.9%) |
| Wholesale Trade | 139 (39.6%) | 212 (60.4%) |
| Retail Trade | 759 (65.1%) | 407 (34.9%) |
| Transportation & Warehousing | 298 (67.3%) | 145 (32.7%) |
| Utilities | 29 (61.7%) | 18 (38.3%) |
| Information | 10 (24.4%) | 31 (75.6%) |
| Finance & Insurance | 191 (24.6%) | 584 (75.3%) |
| Real Estate, Rental & Leasing | 59 (41.0%) | 85 (59.0%) |
| Professional & Scientific | 248 (54.1%) | 210 (45.9%) |
| Enterprise Management | 0 (0.0%) | 0 (0.0%) |
| Administrative & Support | 165 (70.5%) | 69 (29.5%) |
| Educational Services | 352 (42.1%) | 484 (57.9%) |
| Health Care & Social Assistance | 466 (38.2%) | 754 (61.8%) |
| Arts, Entertainment & Recreation | 48 (55.2%) | 39 (44.8%) |
| Accommodation & Food Services | 183 (32.0%) | 389 (68.0%) |
| Public Administration | 303 (57.5%) | 224 (42.5%) |
| Total | 4,617 (51.5%) | 4,341 (48.5%) |
Education in Pataskala
School Enrollment in Pataskala
The most common levels of schooling among the 4,156 students in Pataskala are middle school (987 | 23.7%), elementary school (976 | 23.5%), and high school (943 | 22.7%).
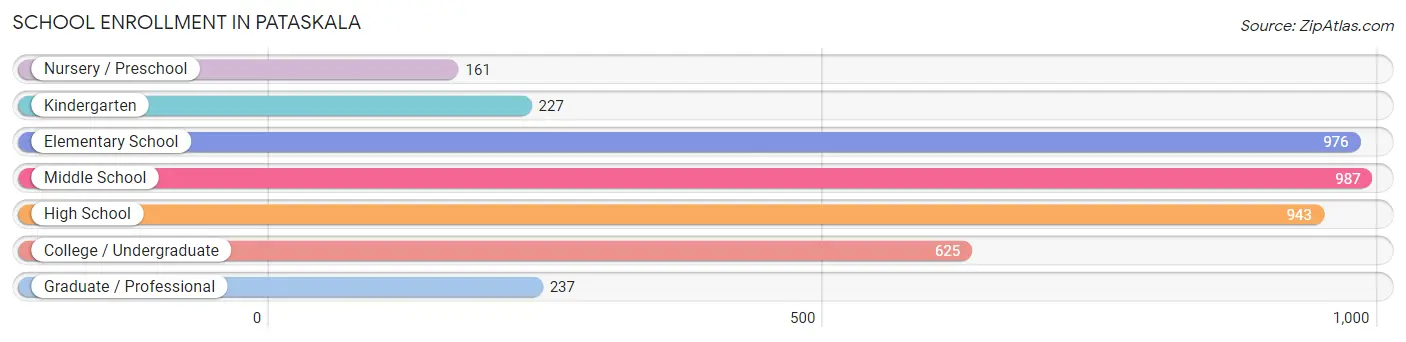
| School Level | # Students | % Students |
| Nursery / Preschool | 161 | 3.9% |
| Kindergarten | 227 | 5.5% |
| Elementary School | 976 | 23.5% |
| Middle School | 987 | 23.7% |
| High School | 943 | 22.7% |
| College / Undergraduate | 625 | 15.0% |
| Graduate / Professional | 237 | 5.7% |
| Total | 4,156 | 100.0% |
School Enrollment by Age by Funding Source in Pataskala
Out of a total of 4,156 students who are enrolled in schools in Pataskala, 524 (12.6%) attend a private institution, while the remaining 3,632 (87.4%) are enrolled in public schools. The age group of 3 to 4 year olds has the highest likelihood of being enrolled in private schools, with 88 (54.7% in the age bracket) enrolled. Conversely, the age group of 10 to 14 year olds has the lowest likelihood of being enrolled in a private school, with 1,056 (93.8% in the age bracket) attending a public institution.
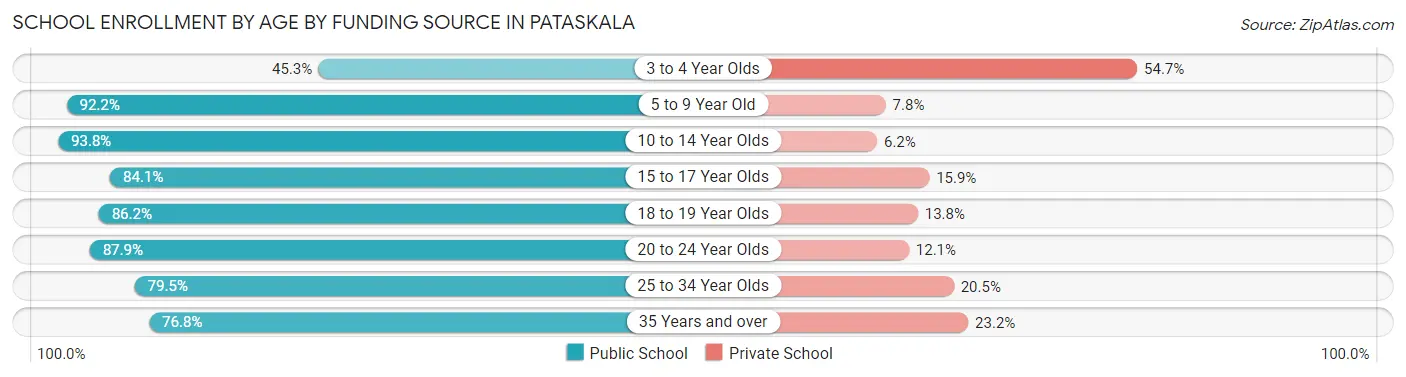
| Age Bracket | Public School | Private School |
| 3 to 4 Year Olds | 73 (45.3%) | 88 (54.7%) |
| 5 to 9 Year Old | 1,049 (92.2%) | 89 (7.8%) |
| 10 to 14 Year Olds | 1,056 (93.8%) | 70 (6.2%) |
| 15 to 17 Year Olds | 612 (84.1%) | 116 (15.9%) |
| 18 to 19 Year Olds | 206 (86.2%) | 33 (13.8%) |
| 20 to 24 Year Olds | 340 (87.9%) | 47 (12.1%) |
| 25 to 34 Year Olds | 190 (79.5%) | 49 (20.5%) |
| 35 Years and over | 106 (76.8%) | 32 (23.2%) |
| Total | 3,632 (87.4%) | 524 (12.6%) |
Educational Attainment by Field of Study in Pataskala
Business (818 | 21.5%), education (534 | 14.1%), science & technology (525 | 13.8%), engineering (248 | 6.5%), and computers & mathematics (231 | 6.1%) are the most common fields of study among 3,800 individuals in Pataskala who have obtained a bachelor's degree or higher.
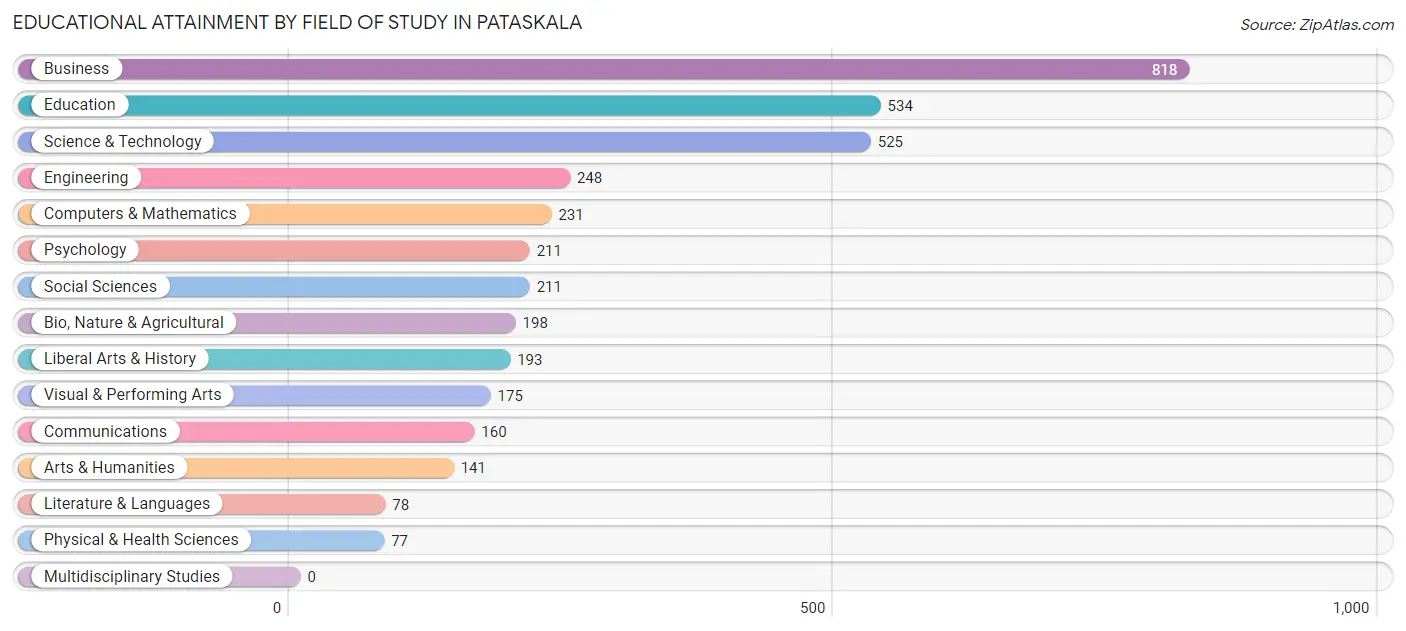
| Field of Study | # Graduates | % Graduates |
| Computers & Mathematics | 231 | 6.1% |
| Bio, Nature & Agricultural | 198 | 5.2% |
| Physical & Health Sciences | 77 | 2.0% |
| Psychology | 211 | 5.6% |
| Social Sciences | 211 | 5.6% |
| Engineering | 248 | 6.5% |
| Multidisciplinary Studies | 0 | 0.0% |
| Science & Technology | 525 | 13.8% |
| Business | 818 | 21.5% |
| Education | 534 | 14.1% |
| Literature & Languages | 78 | 2.1% |
| Liberal Arts & History | 193 | 5.1% |
| Visual & Performing Arts | 175 | 4.6% |
| Communications | 160 | 4.2% |
| Arts & Humanities | 141 | 3.7% |
| Total | 3,800 | 100.0% |
Transportation & Commute in Pataskala
Vehicle Availability by Sex in Pataskala
The most prevalent vehicle ownership categories in Pataskala are males with 2 vehicles (2,656, accounting for 57.2%) and females with 2 vehicles (2,278, making up 63.5%).
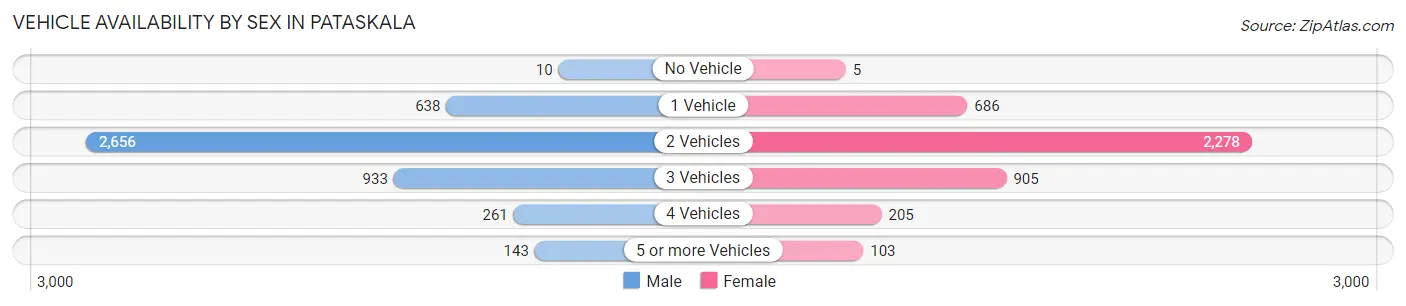
| Vehicles Available | Male | Female |
| No Vehicle | 10 (0.2%) | 5 (0.1%) |
| 1 Vehicle | 638 (13.8%) | 686 (16.4%) |
| 2 Vehicles | 2,656 (57.2%) | 2,278 (54.5%) |
| 3 Vehicles | 933 (20.1%) | 905 (21.6%) |
| 4 Vehicles | 261 (5.6%) | 205 (4.9%) |
| 5 or more Vehicles | 143 (3.1%) | 103 (2.5%) |
| Total | 4,641 (100.0%) | 4,182 (100.0%) |
Commute Time in Pataskala
The most frequently occuring commute durations in Pataskala are 30 to 34 minutes (1,352 commuters, 17.3%), 20 to 24 minutes (1,071 commuters, 13.7%), and 45 to 59 minutes (942 commuters, 12.1%).
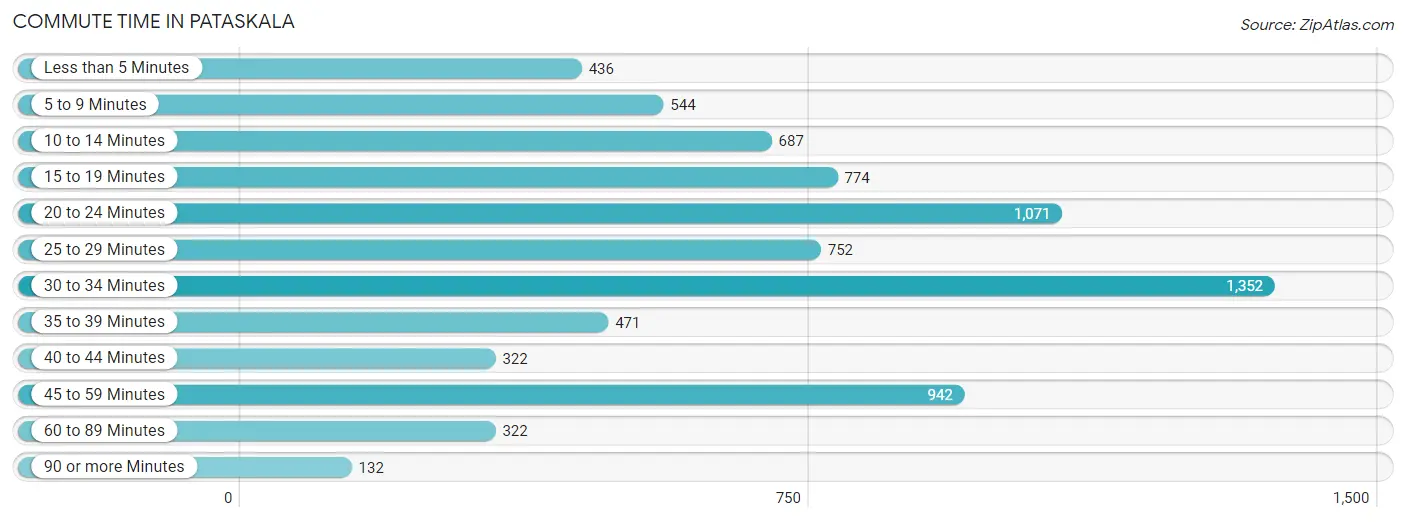
| Commute Time | # Commuters | % Commuters |
| Less than 5 Minutes | 436 | 5.6% |
| 5 to 9 Minutes | 544 | 7.0% |
| 10 to 14 Minutes | 687 | 8.8% |
| 15 to 19 Minutes | 774 | 9.9% |
| 20 to 24 Minutes | 1,071 | 13.7% |
| 25 to 29 Minutes | 752 | 9.6% |
| 30 to 34 Minutes | 1,352 | 17.3% |
| 35 to 39 Minutes | 471 | 6.0% |
| 40 to 44 Minutes | 322 | 4.1% |
| 45 to 59 Minutes | 942 | 12.1% |
| 60 to 89 Minutes | 322 | 4.1% |
| 90 or more Minutes | 132 | 1.7% |
Commute Time by Sex in Pataskala
The most common commute times in Pataskala are 30 to 34 minutes (1,012 commuters, 23.6%) for males and 25 to 29 minutes (457 commuters, 13.0%) for females.
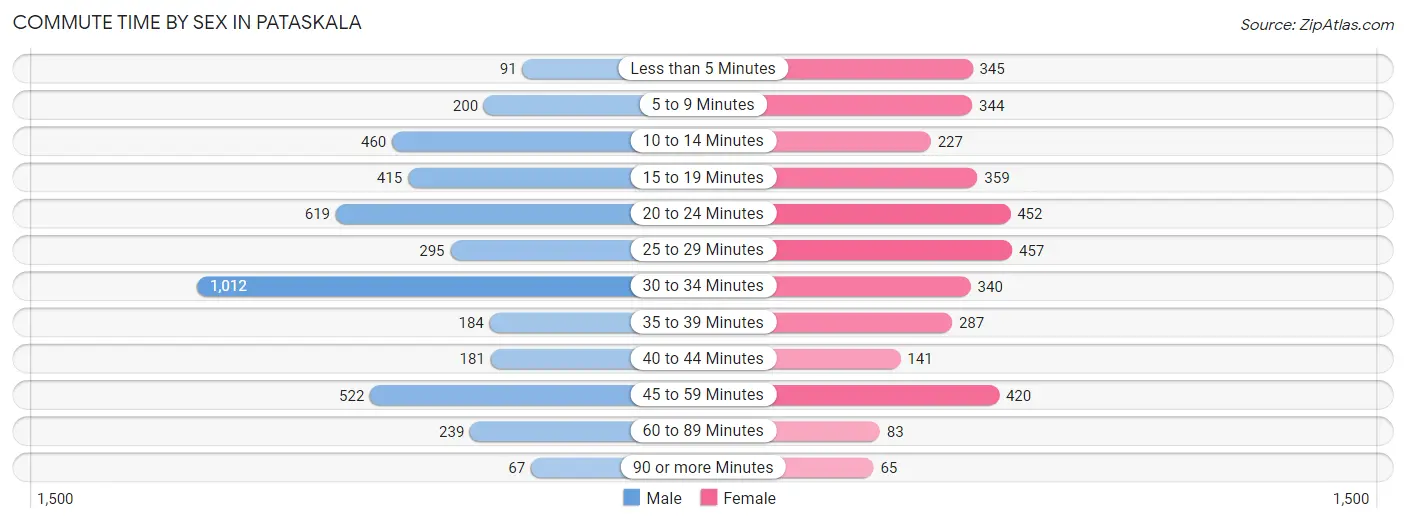
| Commute Time | Male | Female |
| Less than 5 Minutes | 91 (2.1%) | 345 (9.8%) |
| 5 to 9 Minutes | 200 (4.7%) | 344 (9.8%) |
| 10 to 14 Minutes | 460 (10.7%) | 227 (6.5%) |
| 15 to 19 Minutes | 415 (9.7%) | 359 (10.2%) |
| 20 to 24 Minutes | 619 (14.4%) | 452 (12.8%) |
| 25 to 29 Minutes | 295 (6.9%) | 457 (13.0%) |
| 30 to 34 Minutes | 1,012 (23.6%) | 340 (9.7%) |
| 35 to 39 Minutes | 184 (4.3%) | 287 (8.2%) |
| 40 to 44 Minutes | 181 (4.2%) | 141 (4.0%) |
| 45 to 59 Minutes | 522 (12.2%) | 420 (11.9%) |
| 60 to 89 Minutes | 239 (5.6%) | 83 (2.4%) |
| 90 or more Minutes | 67 (1.6%) | 65 (1.8%) |
Time of Departure to Work by Sex in Pataskala
The most frequent times of departure to work in Pataskala are 4:00 PM to 11:59 PM (555, 13.0%) for males and 7:00 AM to 7:29 AM (702, 19.9%) for females.
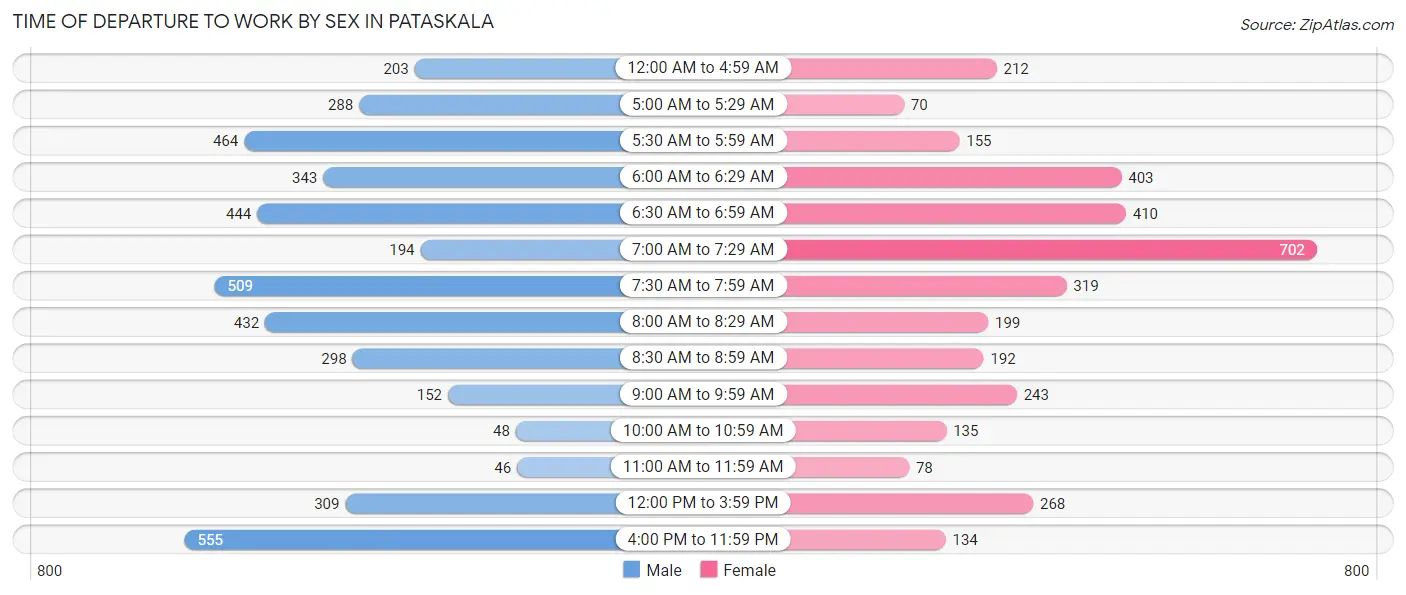
| Time of Departure | Male | Female |
| 12:00 AM to 4:59 AM | 203 (4.7%) | 212 (6.0%) |
| 5:00 AM to 5:29 AM | 288 (6.7%) | 70 (2.0%) |
| 5:30 AM to 5:59 AM | 464 (10.8%) | 155 (4.4%) |
| 6:00 AM to 6:29 AM | 343 (8.0%) | 403 (11.5%) |
| 6:30 AM to 6:59 AM | 444 (10.4%) | 410 (11.7%) |
| 7:00 AM to 7:29 AM | 194 (4.5%) | 702 (19.9%) |
| 7:30 AM to 7:59 AM | 509 (11.9%) | 319 (9.1%) |
| 8:00 AM to 8:29 AM | 432 (10.1%) | 199 (5.7%) |
| 8:30 AM to 8:59 AM | 298 (7.0%) | 192 (5.4%) |
| 9:00 AM to 9:59 AM | 152 (3.5%) | 243 (6.9%) |
| 10:00 AM to 10:59 AM | 48 (1.1%) | 135 (3.8%) |
| 11:00 AM to 11:59 AM | 46 (1.1%) | 78 (2.2%) |
| 12:00 PM to 3:59 PM | 309 (7.2%) | 268 (7.6%) |
| 4:00 PM to 11:59 PM | 555 (13.0%) | 134 (3.8%) |
| Total | 4,285 (100.0%) | 3,520 (100.0%) |
Housing Occupancy in Pataskala
Occupancy by Ownership in Pataskala
Of the total 6,638 dwellings in Pataskala, owner-occupied units account for 4,899 (73.8%), while renter-occupied units make up 1,739 (26.2%).
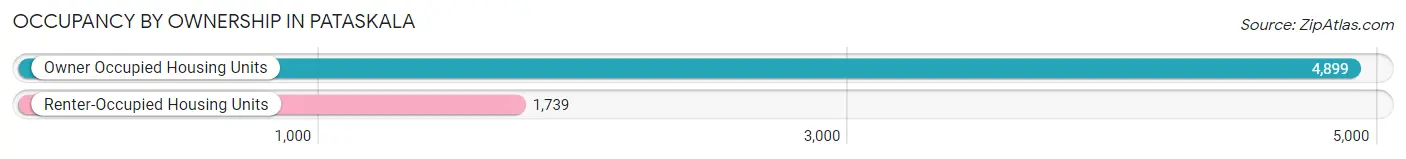
| Occupancy | # Housing Units | % Housing Units |
| Owner Occupied Housing Units | 4,899 | 73.8% |
| Renter-Occupied Housing Units | 1,739 | 26.2% |
| Total Occupied Housing Units | 6,638 | 100.0% |
Occupancy by Household Size in Pataskala
| Household Size | # Housing Units | % Housing Units |
| 1-Person Household | 1,261 | 19.0% |
| 2-Person Household | 2,336 | 35.2% |
| 3-Person Household | 1,219 | 18.4% |
| 4+ Person Household | 1,822 | 27.5% |
| Total Housing Units | 6,638 | 100.0% |
Occupancy by Ownership by Household Size in Pataskala
| Household Size | Owner-occupied | Renter-occupied |
| 1-Person Household | 718 (56.9%) | 543 (43.1%) |
| 2-Person Household | 1,897 (81.2%) | 439 (18.8%) |
| 3-Person Household | 839 (68.8%) | 380 (31.2%) |
| 4+ Person Household | 1,445 (79.3%) | 377 (20.7%) |
| Total Housing Units | 4,899 (73.8%) | 1,739 (26.2%) |
Occupancy by Educational Attainment in Pataskala
| Household Size | Owner-occupied | Renter-occupied |
| Less than High School | 307 (70.9%) | 126 (29.1%) |
| High School Diploma | 1,137 (63.3%) | 660 (36.7%) |
| College/Associate Degree | 1,636 (73.6%) | 587 (26.4%) |
| Bachelor's Degree or higher | 1,819 (83.3%) | 366 (16.8%) |
Occupancy by Age of Householder in Pataskala
| Age Bracket | # Households | % Households |
| Under 35 Years | 1,741 | 26.2% |
| 35 to 44 Years | 994 | 15.0% |
| 45 to 54 Years | 1,390 | 20.9% |
| 55 to 64 Years | 1,171 | 17.6% |
| 65 to 74 Years | 915 | 13.8% |
| 75 to 84 Years | 328 | 4.9% |
| 85 Years and Over | 99 | 1.5% |
| Total | 6,638 | 100.0% |
Housing Finances in Pataskala
Median Income by Occupancy in Pataskala
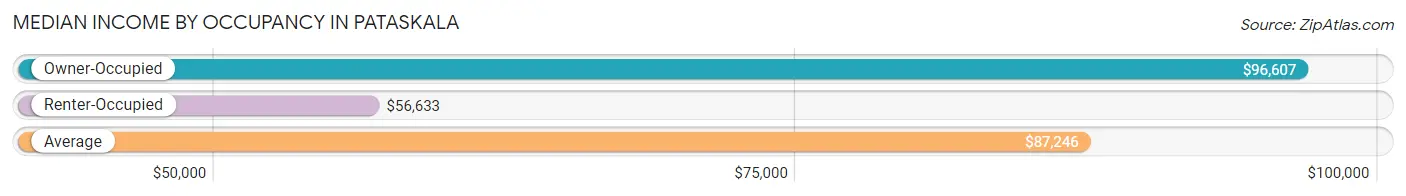
| Occupancy Type | # Households | Median Income |
| Owner-Occupied | 4,899 (73.8%) | $96,607 |
| Renter-Occupied | 1,739 (26.2%) | $56,633 |
| Average | 6,638 (100.0%) | $87,246 |
Occupancy by Householder Income Bracket in Pataskala
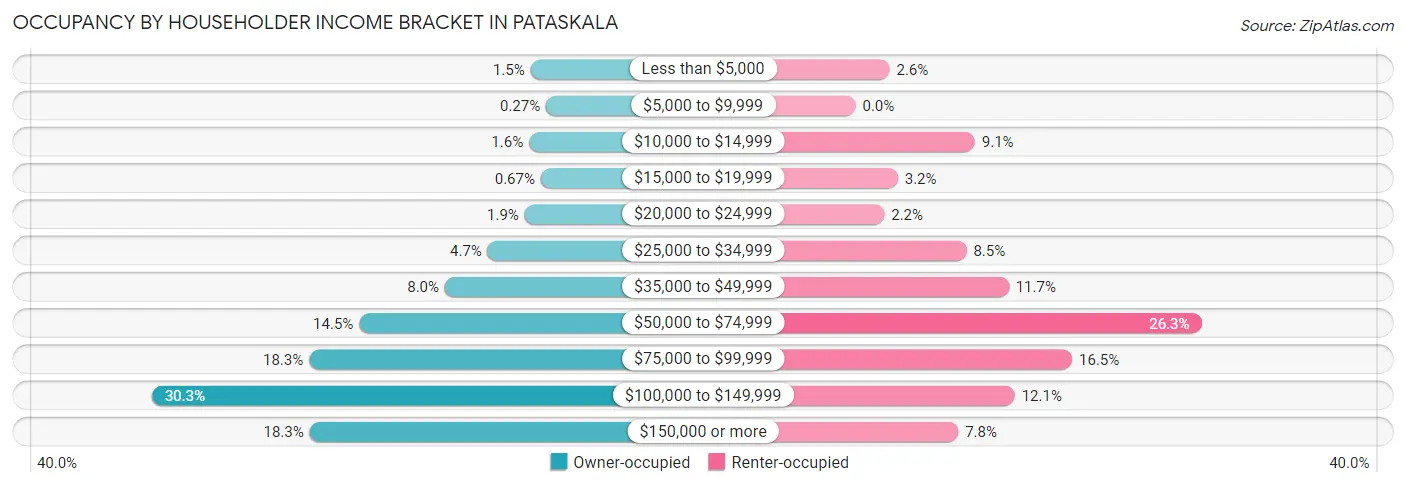
| Income Bracket | Owner-occupied | Renter-occupied |
| Less than $5,000 | 71 (1.5%) | 45 (2.6%) |
| $5,000 to $9,999 | 13 (0.3%) | 0 (0.0%) |
| $10,000 to $14,999 | 77 (1.6%) | 158 (9.1%) |
| $15,000 to $19,999 | 33 (0.7%) | 56 (3.2%) |
| $20,000 to $24,999 | 93 (1.9%) | 38 (2.2%) |
| $25,000 to $34,999 | 231 (4.7%) | 147 (8.5%) |
| $35,000 to $49,999 | 391 (8.0%) | 203 (11.7%) |
| $50,000 to $74,999 | 711 (14.5%) | 458 (26.3%) |
| $75,000 to $99,999 | 898 (18.3%) | 287 (16.5%) |
| $100,000 to $149,999 | 1,485 (30.3%) | 211 (12.1%) |
| $150,000 or more | 896 (18.3%) | 136 (7.8%) |
| Total | 4,899 (100.0%) | 1,739 (100.0%) |
Monthly Housing Cost Tiers in Pataskala
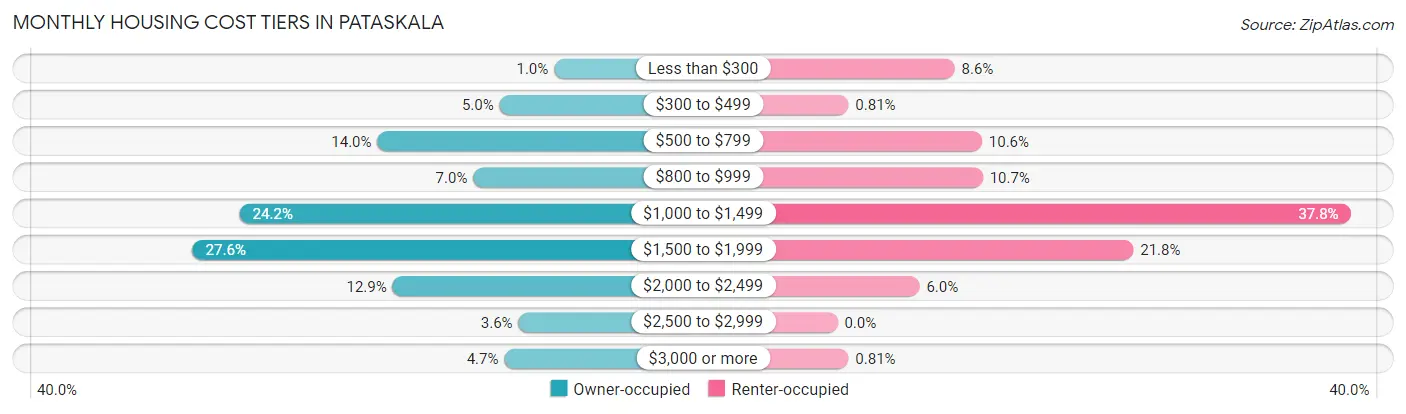
| Monthly Cost | Owner-occupied | Renter-occupied |
| Less than $300 | 49 (1.0%) | 150 (8.6%) |
| $300 to $499 | 246 (5.0%) | 14 (0.8%) |
| $500 to $799 | 687 (14.0%) | 185 (10.6%) |
| $800 to $999 | 341 (7.0%) | 186 (10.7%) |
| $1,000 to $1,499 | 1,184 (24.2%) | 657 (37.8%) |
| $1,500 to $1,999 | 1,353 (27.6%) | 379 (21.8%) |
| $2,000 to $2,499 | 632 (12.9%) | 105 (6.0%) |
| $2,500 to $2,999 | 178 (3.6%) | 0 (0.0%) |
| $3,000 or more | 229 (4.7%) | 14 (0.8%) |
| Total | 4,899 (100.0%) | 1,739 (100.0%) |
Physical Housing Characteristics in Pataskala
Housing Structures in Pataskala
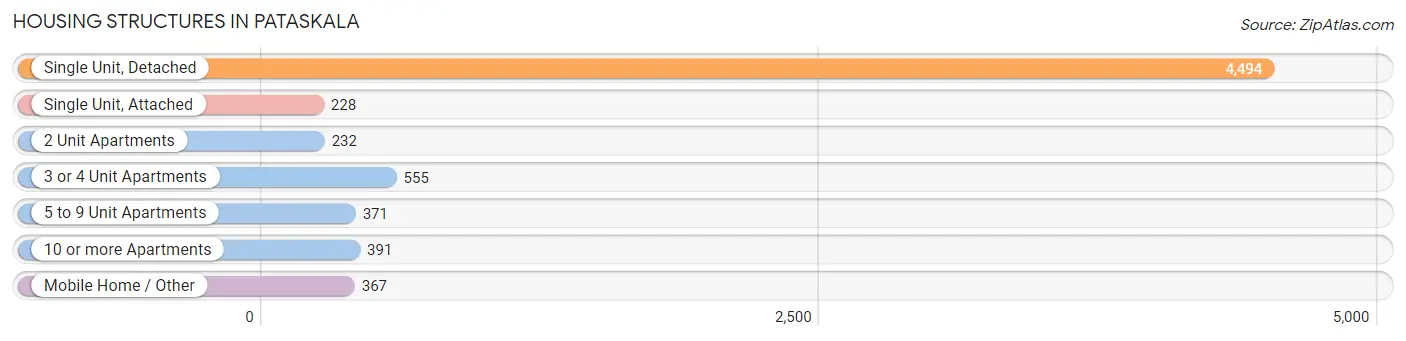
| Structure Type | # Housing Units | % Housing Units |
| Single Unit, Detached | 4,494 | 67.7% |
| Single Unit, Attached | 228 | 3.4% |
| 2 Unit Apartments | 232 | 3.5% |
| 3 or 4 Unit Apartments | 555 | 8.4% |
| 5 to 9 Unit Apartments | 371 | 5.6% |
| 10 or more Apartments | 391 | 5.9% |
| Mobile Home / Other | 367 | 5.5% |
| Total | 6,638 | 100.0% |
Housing Structures by Occupancy in Pataskala
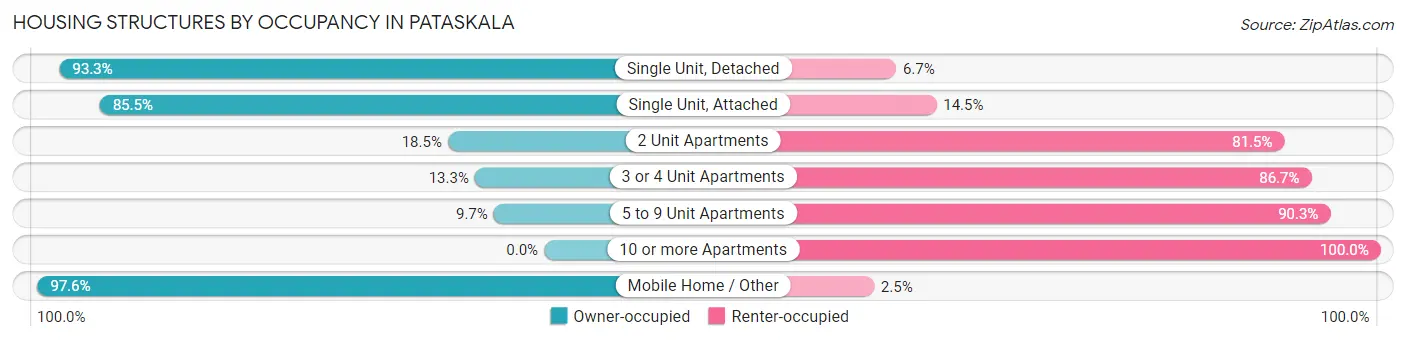
| Structure Type | Owner-occupied | Renter-occupied |
| Single Unit, Detached | 4,193 (93.3%) | 301 (6.7%) |
| Single Unit, Attached | 195 (85.5%) | 33 (14.5%) |
| 2 Unit Apartments | 43 (18.5%) | 189 (81.5%) |
| 3 or 4 Unit Apartments | 74 (13.3%) | 481 (86.7%) |
| 5 to 9 Unit Apartments | 36 (9.7%) | 335 (90.3%) |
| 10 or more Apartments | 0 (0.0%) | 391 (100.0%) |
| Mobile Home / Other | 358 (97.6%) | 9 (2.5%) |
| Total | 4,899 (73.8%) | 1,739 (26.2%) |
Housing Structures by Number of Rooms in Pataskala
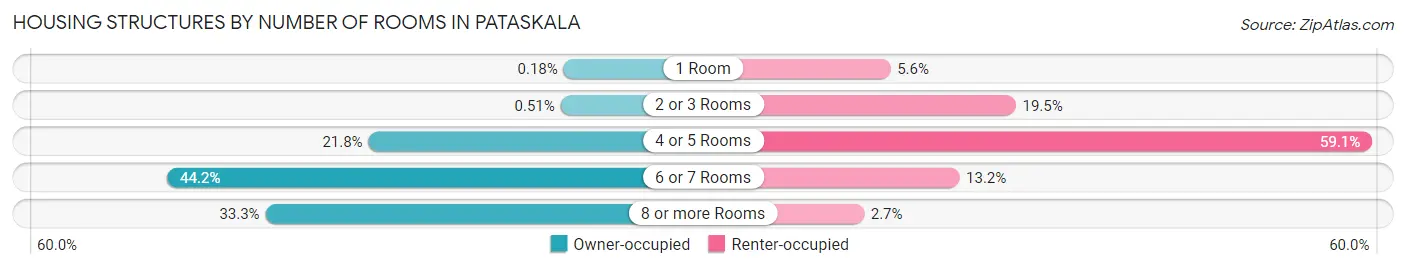
| Number of Rooms | Owner-occupied | Renter-occupied |
| 1 Room | 9 (0.2%) | 97 (5.6%) |
| 2 or 3 Rooms | 25 (0.5%) | 339 (19.5%) |
| 4 or 5 Rooms | 1,070 (21.8%) | 1,027 (59.1%) |
| 6 or 7 Rooms | 2,165 (44.2%) | 230 (13.2%) |
| 8 or more Rooms | 1,630 (33.3%) | 46 (2.6%) |
| Total | 4,899 (100.0%) | 1,739 (100.0%) |
Housing Structure by Heating Type in Pataskala
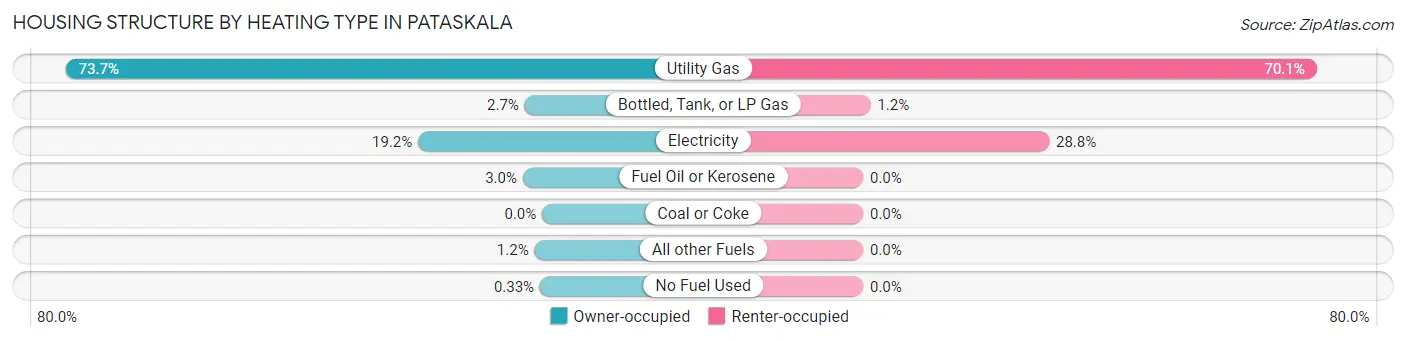
| Heating Type | Owner-occupied | Renter-occupied |
| Utility Gas | 3,608 (73.7%) | 1,219 (70.1%) |
| Bottled, Tank, or LP Gas | 132 (2.7%) | 20 (1.1%) |
| Electricity | 939 (19.2%) | 500 (28.7%) |
| Fuel Oil or Kerosene | 146 (3.0%) | 0 (0.0%) |
| Coal or Coke | 0 (0.0%) | 0 (0.0%) |
| All other Fuels | 58 (1.2%) | 0 (0.0%) |
| No Fuel Used | 16 (0.3%) | 0 (0.0%) |
| Total | 4,899 (100.0%) | 1,739 (100.0%) |
Household Vehicle Usage in Pataskala
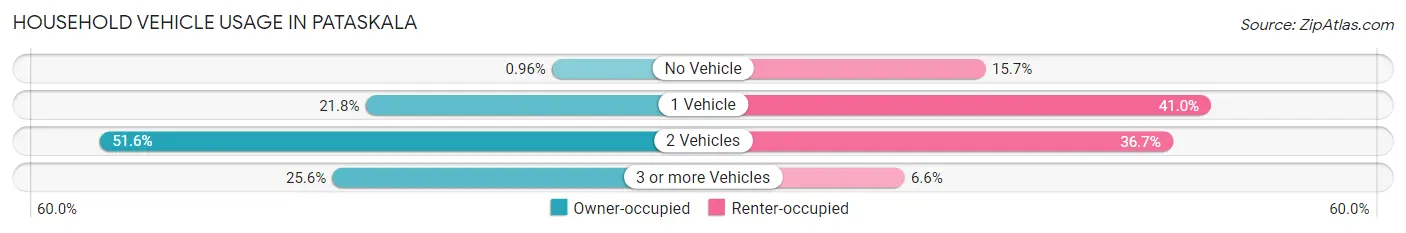
| Vehicles per Household | Owner-occupied | Renter-occupied |
| No Vehicle | 47 (1.0%) | 273 (15.7%) |
| 1 Vehicle | 1,070 (21.8%) | 713 (41.0%) |
| 2 Vehicles | 2,530 (51.6%) | 638 (36.7%) |
| 3 or more Vehicles | 1,252 (25.6%) | 115 (6.6%) |
| Total | 4,899 (100.0%) | 1,739 (100.0%) |
Real Estate & Mortgages in Pataskala
Real Estate and Mortgage Overview in Pataskala
| Characteristic | Without Mortgage | With Mortgage |
| Housing Units | 1,208 | 3,691 |
| Median Property Value | $215,300 | $244,900 |
| Median Household Income | $74,663 | $745 |
| Monthly Housing Costs | $633 | $220 |
| Real Estate Taxes | $2,986 | $14 |
Property Value by Mortgage Status in Pataskala
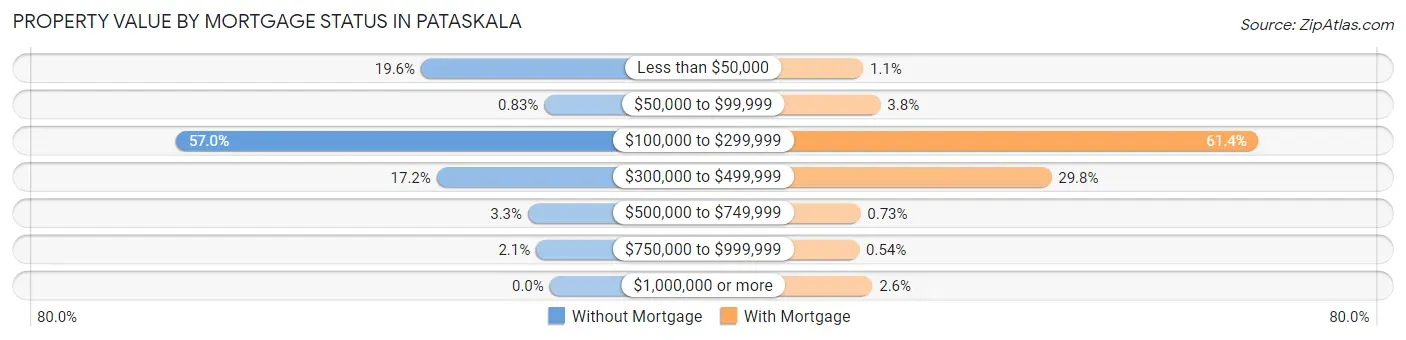
| Property Value | Without Mortgage | With Mortgage |
| Less than $50,000 | 237 (19.6%) | 42 (1.1%) |
| $50,000 to $99,999 | 10 (0.8%) | 140 (3.8%) |
| $100,000 to $299,999 | 688 (57.0%) | 2,267 (61.4%) |
| $300,000 to $499,999 | 208 (17.2%) | 1,101 (29.8%) |
| $500,000 to $749,999 | 40 (3.3%) | 27 (0.7%) |
| $750,000 to $999,999 | 25 (2.1%) | 20 (0.5%) |
| $1,000,000 or more | 0 (0.0%) | 94 (2.5%) |
| Total | 1,208 (100.0%) | 3,691 (100.0%) |
Household Income by Mortgage Status in Pataskala
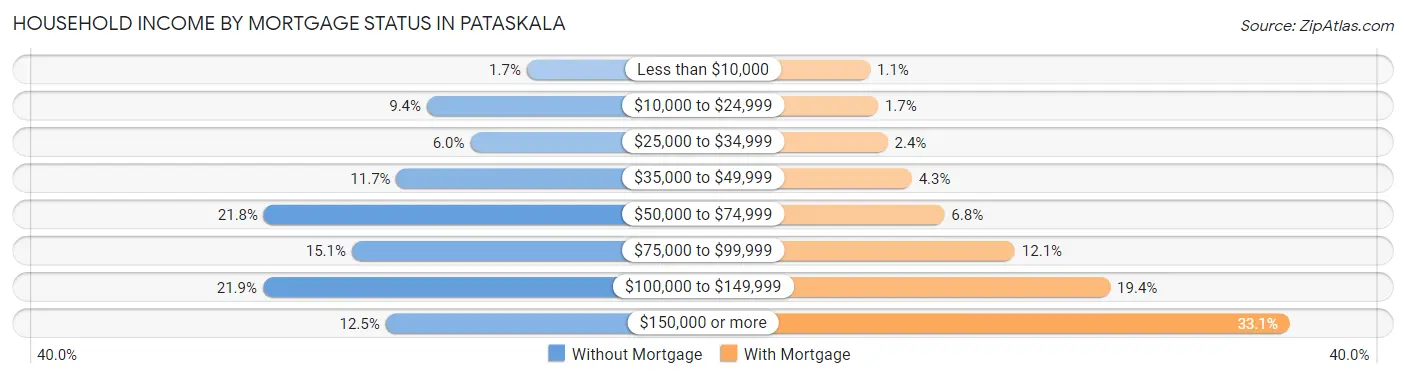
| Household Income | Without Mortgage | With Mortgage |
| Less than $10,000 | 21 (1.7%) | 41 (1.1%) |
| $10,000 to $24,999 | 113 (9.3%) | 63 (1.7%) |
| $25,000 to $34,999 | 73 (6.0%) | 90 (2.4%) |
| $35,000 to $49,999 | 141 (11.7%) | 158 (4.3%) |
| $50,000 to $74,999 | 263 (21.8%) | 250 (6.8%) |
| $75,000 to $99,999 | 182 (15.1%) | 448 (12.1%) |
| $100,000 to $149,999 | 264 (21.8%) | 716 (19.4%) |
| $150,000 or more | 151 (12.5%) | 1,221 (33.1%) |
| Total | 1,208 (100.0%) | 3,691 (100.0%) |
Property Value to Household Income Ratio in Pataskala
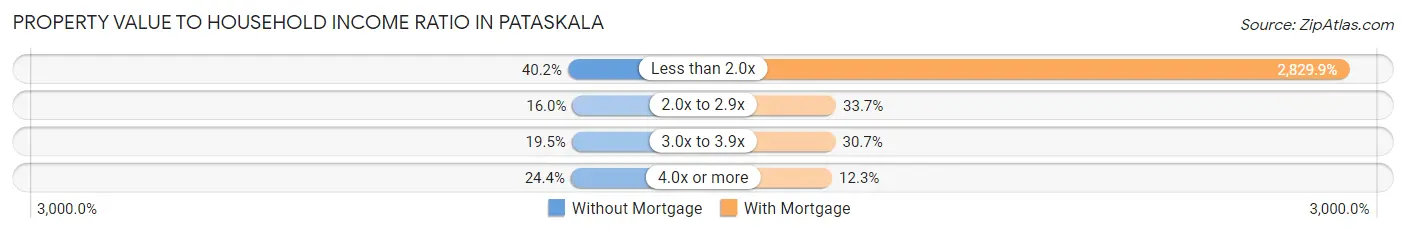
| Value-to-Income Ratio | Without Mortgage | With Mortgage |
| Less than 2.0x | 485 (40.2%) | 104,450 (2,829.9%) |
| 2.0x to 2.9x | 193 (16.0%) | 1,244 (33.7%) |
| 3.0x to 3.9x | 235 (19.5%) | 1,133 (30.7%) |
| 4.0x or more | 295 (24.4%) | 453 (12.3%) |
| Total | 1,208 (100.0%) | 3,691 (100.0%) |
Real Estate Taxes by Mortgage Status in Pataskala
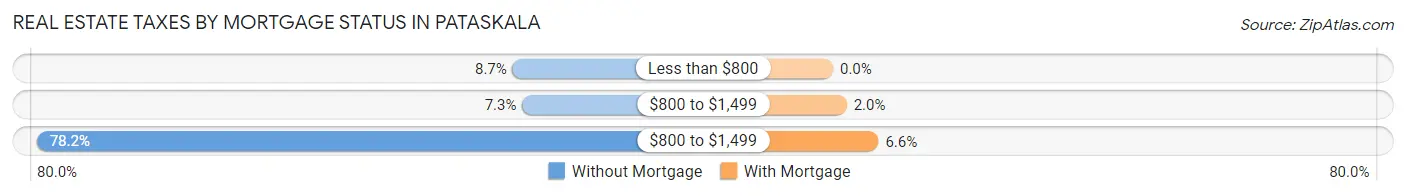
| Property Taxes | Without Mortgage | With Mortgage |
| Less than $800 | 105 (8.7%) | 0 (0.0%) |
| $800 to $1,499 | 88 (7.3%) | 74 (2.0%) |
| $800 to $1,499 | 945 (78.2%) | 245 (6.6%) |
| Total | 1,208 (100.0%) | 3,691 (100.0%) |
Health & Disability in Pataskala
Health Insurance Coverage by Age in Pataskala
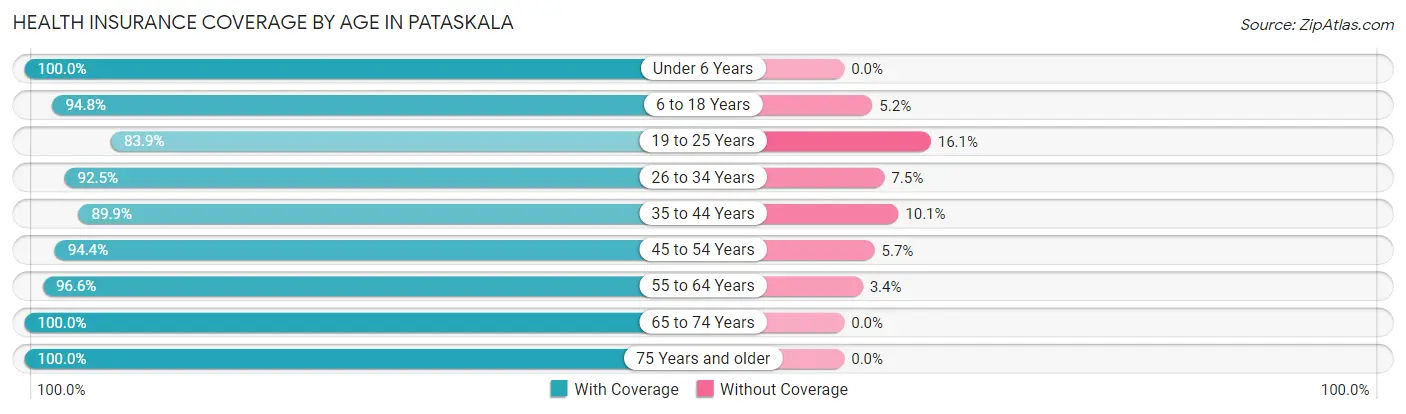
| Age Bracket | With Coverage | Without Coverage |
| Under 6 Years | 1,483 (100.0%) | 0 (0.0%) |
| 6 to 18 Years | 3,073 (94.8%) | 170 (5.2%) |
| 19 to 25 Years | 889 (83.9%) | 171 (16.1%) |
| 26 to 34 Years | 2,709 (92.5%) | 219 (7.5%) |
| 35 to 44 Years | 1,874 (89.9%) | 210 (10.1%) |
| 45 to 54 Years | 2,189 (94.4%) | 131 (5.7%) |
| 55 to 64 Years | 2,028 (96.6%) | 72 (3.4%) |
| 65 to 74 Years | 1,645 (100.0%) | 0 (0.0%) |
| 75 Years and older | 800 (100.0%) | 0 (0.0%) |
| Total | 16,690 (94.5%) | 973 (5.5%) |
Health Insurance Coverage by Citizenship Status in Pataskala
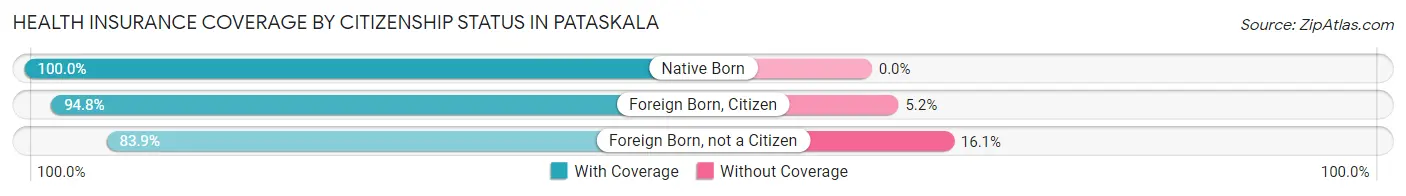
| Citizenship Status | With Coverage | Without Coverage |
| Native Born | 1,483 (100.0%) | 0 (0.0%) |
| Foreign Born, Citizen | 3,073 (94.8%) | 170 (5.2%) |
| Foreign Born, not a Citizen | 889 (83.9%) | 171 (16.1%) |
Health Insurance Coverage by Household Income in Pataskala
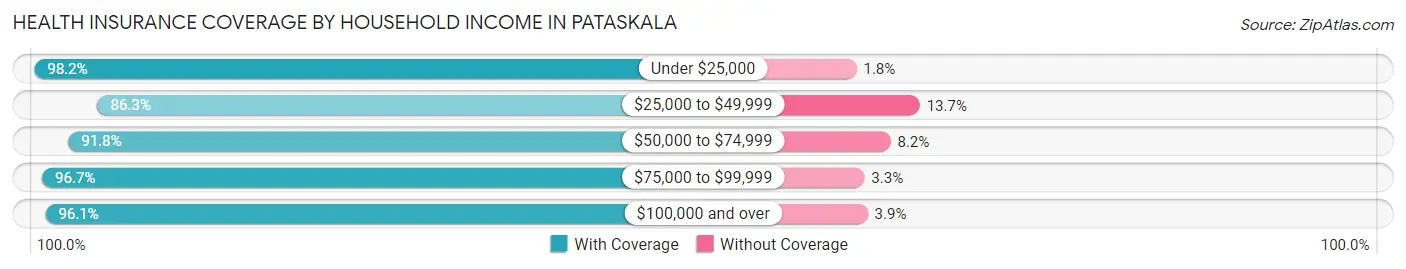
| Household Income | With Coverage | Without Coverage |
| Under $25,000 | 1,078 (98.2%) | 20 (1.8%) |
| $25,000 to $49,999 | 1,833 (86.3%) | 290 (13.7%) |
| $50,000 to $74,999 | 2,534 (91.8%) | 226 (8.2%) |
| $75,000 to $99,999 | 3,138 (96.7%) | 107 (3.3%) |
| $100,000 and over | 8,103 (96.1%) | 330 (3.9%) |
Public vs Private Health Insurance Coverage by Age in Pataskala
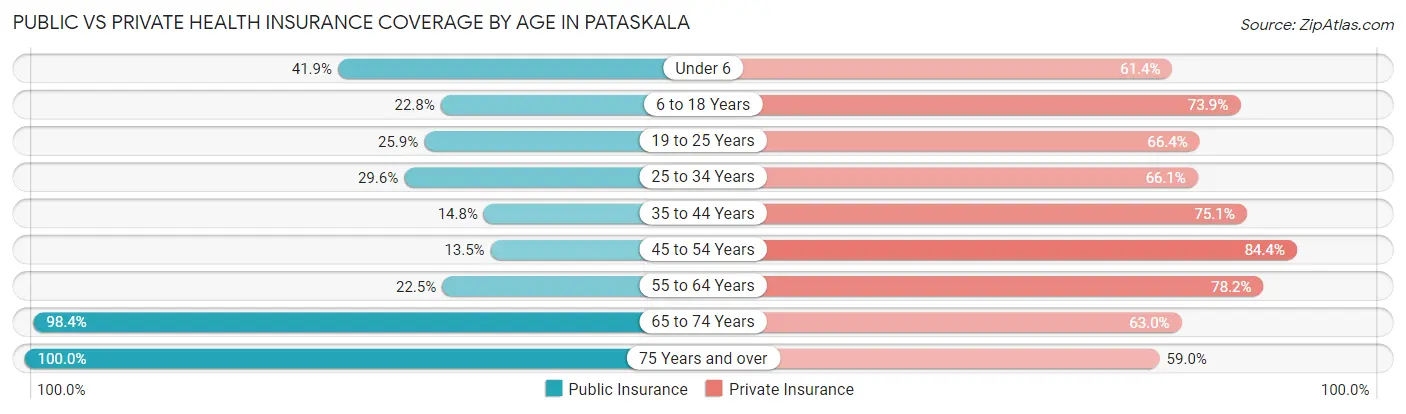
| Age Bracket | Public Insurance | Private Insurance |
| Under 6 | 621 (41.9%) | 910 (61.4%) |
| 6 to 18 Years | 739 (22.8%) | 2,397 (73.9%) |
| 19 to 25 Years | 274 (25.9%) | 704 (66.4%) |
| 25 to 34 Years | 866 (29.6%) | 1,934 (66.0%) |
| 35 to 44 Years | 308 (14.8%) | 1,566 (75.1%) |
| 45 to 54 Years | 314 (13.5%) | 1,959 (84.4%) |
| 55 to 64 Years | 473 (22.5%) | 1,643 (78.2%) |
| 65 to 74 Years | 1,618 (98.4%) | 1,037 (63.0%) |
| 75 Years and over | 800 (100.0%) | 472 (59.0%) |
| Total | 6,013 (34.0%) | 12,622 (71.5%) |
Disability Status by Sex by Age in Pataskala
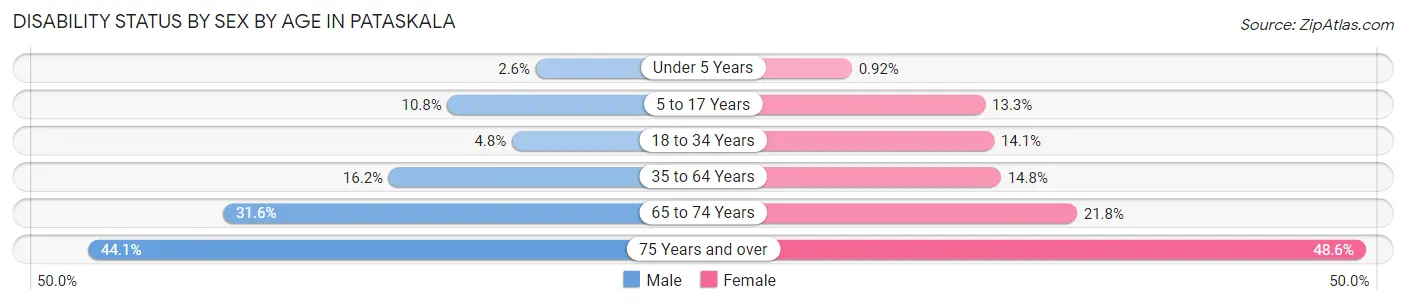
| Age Bracket | Male | Female |
| Under 5 Years | 16 (2.5%) | 7 (0.9%) |
| 5 to 17 Years | 174 (10.7%) | 198 (13.3%) |
| 18 to 34 Years | 105 (4.8%) | 284 (14.1%) |
| 35 to 64 Years | 513 (16.2%) | 492 (14.7%) |
| 65 to 74 Years | 250 (31.6%) | 186 (21.8%) |
| 75 Years and over | 146 (44.1%) | 228 (48.6%) |
Disability Class by Sex by Age in Pataskala
Disability Class: Hearing Difficulty
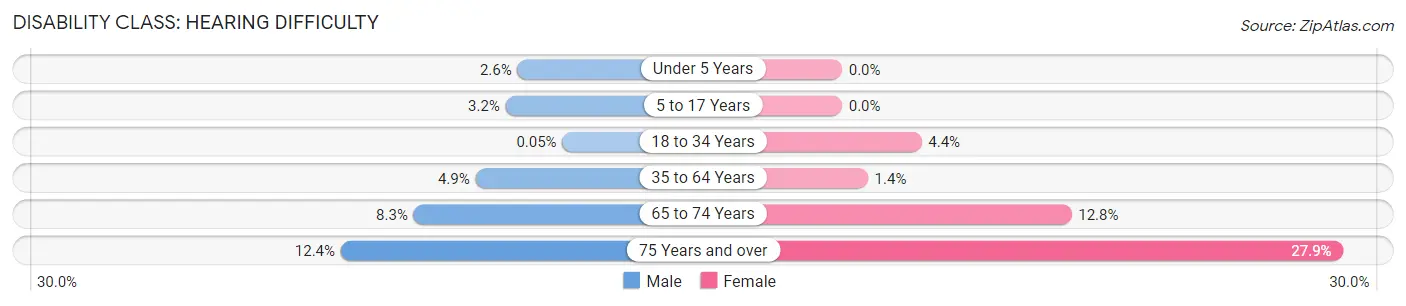
| Age Bracket | Male | Female |
| Under 5 Years | 16 (2.5%) | 0 (0.0%) |
| 5 to 17 Years | 52 (3.2%) | 0 (0.0%) |
| 18 to 34 Years | 1 (0.1%) | 89 (4.4%) |
| 35 to 64 Years | 155 (4.9%) | 48 (1.4%) |
| 65 to 74 Years | 66 (8.3%) | 109 (12.8%) |
| 75 Years and over | 41 (12.4%) | 131 (27.9%) |
Disability Class: Vision Difficulty
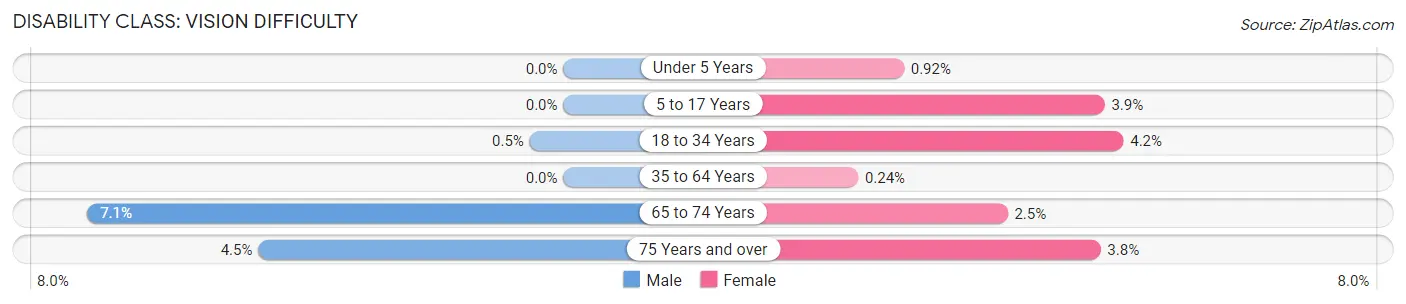
| Age Bracket | Male | Female |
| Under 5 Years | 0 (0.0%) | 7 (0.9%) |
| 5 to 17 Years | 0 (0.0%) | 58 (3.9%) |
| 18 to 34 Years | 11 (0.5%) | 84 (4.2%) |
| 35 to 64 Years | 0 (0.0%) | 8 (0.2%) |
| 65 to 74 Years | 56 (7.1%) | 21 (2.5%) |
| 75 Years and over | 15 (4.5%) | 18 (3.8%) |
Disability Class: Cognitive Difficulty
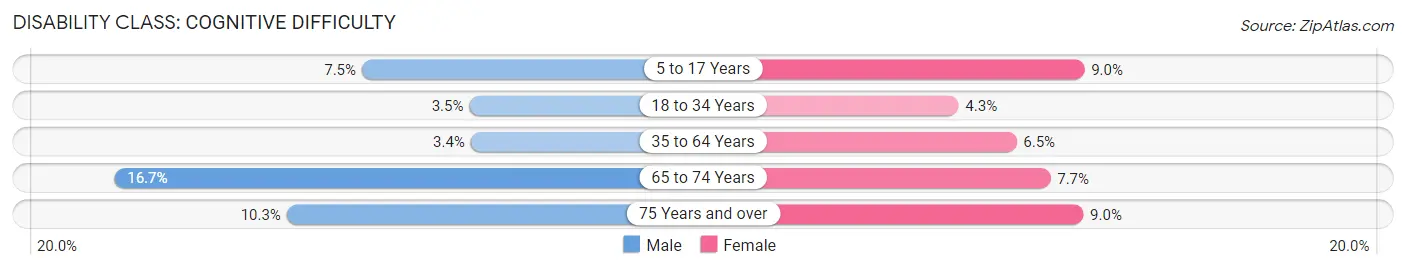
| Age Bracket | Male | Female |
| 5 to 17 Years | 121 (7.5%) | 134 (9.0%) |
| 18 to 34 Years | 77 (3.5%) | 87 (4.3%) |
| 35 to 64 Years | 109 (3.4%) | 216 (6.5%) |
| 65 to 74 Years | 132 (16.7%) | 66 (7.7%) |
| 75 Years and over | 34 (10.3%) | 42 (9.0%) |
Disability Class: Ambulatory Difficulty
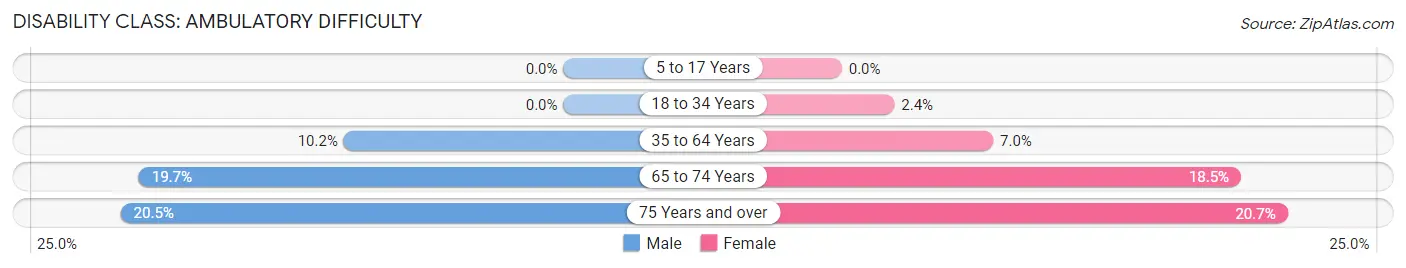
| Age Bracket | Male | Female |
| 5 to 17 Years | 0 (0.0%) | 0 (0.0%) |
| 18 to 34 Years | 0 (0.0%) | 49 (2.4%) |
| 35 to 64 Years | 323 (10.2%) | 234 (7.0%) |
| 65 to 74 Years | 156 (19.7%) | 158 (18.5%) |
| 75 Years and over | 68 (20.5%) | 97 (20.7%) |
Disability Class: Self-Care Difficulty
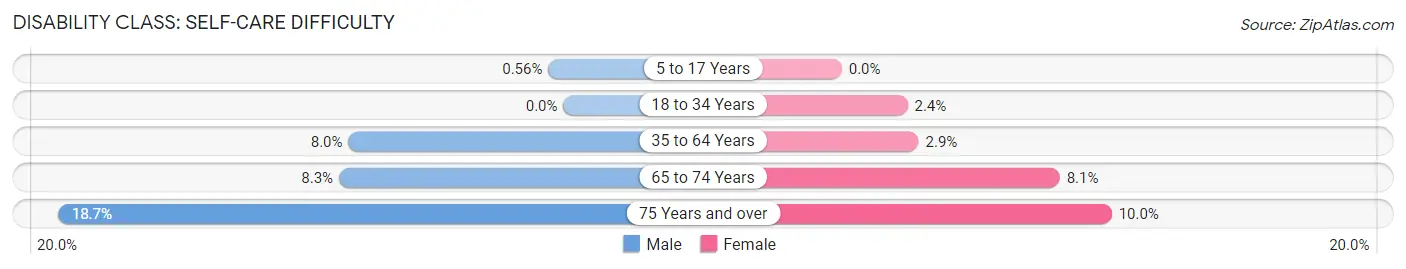
| Age Bracket | Male | Female |
| 5 to 17 Years | 9 (0.6%) | 0 (0.0%) |
| 18 to 34 Years | 0 (0.0%) | 49 (2.4%) |
| 35 to 64 Years | 253 (8.0%) | 95 (2.9%) |
| 65 to 74 Years | 66 (8.3%) | 69 (8.1%) |
| 75 Years and over | 62 (18.7%) | 47 (10.0%) |
Technology Access in Pataskala
Computing Device Access in Pataskala
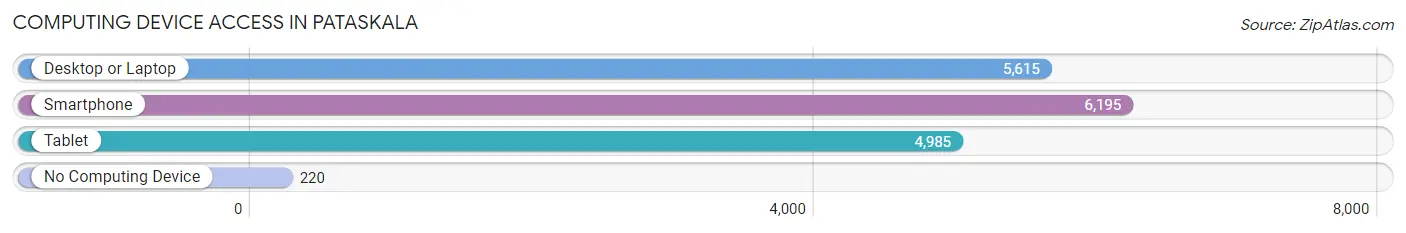
| Device Type | # Households | % Households |
| Desktop or Laptop | 5,615 | 84.6% |
| Smartphone | 6,195 | 93.3% |
| Tablet | 4,985 | 75.1% |
| No Computing Device | 220 | 3.3% |
| Total | 6,638 | 100.0% |
Internet Access in Pataskala
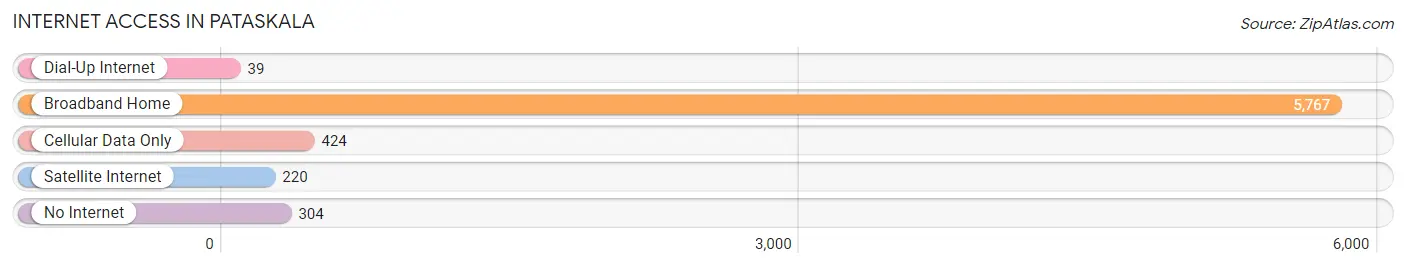
| Internet Type | # Households | % Households |
| Dial-Up Internet | 39 | 0.6% |
| Broadband Home | 5,767 | 86.9% |
| Cellular Data Only | 424 | 6.4% |
| Satellite Internet | 220 | 3.3% |
| No Internet | 304 | 4.6% |
| Total | 6,638 | 100.0% |
Pataskala Summary
Pataskala, Ohio is a small city located in Licking County, Ohio, United States. It is located about 25 miles east of Columbus, the state capital. The city has a population of approximately 14,962 people, according to the 2010 census.
History
Pataskala was founded in 1815 by a group of settlers from Pennsylvania. The town was originally called New California, but was later changed to Pataskala, after a local Native American chief. The town was incorporated in 1851.
In the late 19th century, Pataskala was a thriving agricultural community. The town was known for its production of apples, peaches, and other fruits. The town also had a number of mills, including a grist mill, a saw mill, and a woolen mill.
In the early 20th century, Pataskala began to experience a period of growth and development. The town was connected to the railroad in 1906, and the first paved road was built in 1912. The town also had a number of businesses, including a bank, a hotel, and a movie theater.
Geography
Pataskala is located in Licking County, Ohio, about 25 miles east of Columbus. The city is situated on the banks of the Licking River, and is surrounded by rolling hills and farmland. The city has a total area of 8.3 square miles, of which 8.2 square miles is land and 0.1 square miles is water.
Economy
Pataskala’s economy is largely based on agriculture and manufacturing. The city is home to a number of agricultural businesses, including farms, nurseries, and greenhouses. The city also has a number of manufacturing businesses, including a plastics factory and a metal fabrication plant.
The city also has a number of retail businesses, including grocery stores, restaurants, and clothing stores. The city is also home to a number of professional services, including doctors, lawyers, and accountants.
Demographics
According to the 2010 census, Pataskala has a population of 14,962 people. The population is spread out with 49.3% male and 50.7% female. The median age is 37.7 years.
The racial makeup of the city is 94.2% White, 2.3% African American, 0.4% Native American, 0.9% Asian, 0.1% Pacific Islander, 0.7% from other races, and 1.4% from two or more races. Hispanic or Latino of any race make up 2.2% of the population.
The median household income in Pataskala is $62,917, and the median family income is $71,917. The per capita income is $27,917. About 6.2% of the population is below the poverty line.
Common Questions
What is the Total Population of Pataskala?
Total Population of Pataskala is 17,843.
What is the Total Male Population of Pataskala?
Total Male Population of Pataskala is 8,817.
What is the Total Female Population of Pataskala?
Total Female Population of Pataskala is 9,026.
What is the Ratio of Males per 100 Females in Pataskala?
There are 97.68 Males per 100 Females in Pataskala.
What is the Ratio of Females per 100 Males in Pataskala?
There are 102.37 Females per 100 Males in Pataskala.
What is the Median Population Age in Pataskala?
Median Population Age in Pataskala is 36.2 Years.
What is the Average Family Size in Pataskala
Average Family Size in Pataskala is 3.0 People.
What is the Average Household Size in Pataskala
Average Household Size in Pataskala is 2.7 People.
What is Per Capita Income in Pataskala?
Per Capita income in Pataskala is $39,393.
What is the Median Family Income in Pataskala?
Median Family Income in Pataskala is $93,063.
What is the Median Household income in Pataskala?
Median Household Income in Pataskala is $87,246.
What is Income or Wage Gap in Pataskala?
Income or Wage Gap in Pataskala is 19.4%.
Women in Pataskala earn 80.6 cents for every dollar earned by a man.
What is Inequality or Gini Index in Pataskala?
Inequality or Gini Index in Pataskala is 0.40.
How Large is the Labor Force in Pataskala?
There are 9,303 People in the Labor Forcein in Pataskala.
What is the Percentage of People in the Labor Force in Pataskala?
67.2% of People are in the Labor Force in Pataskala.
What is the Unemployment Rate in Pataskala?
Unemployment Rate in Pataskala is 3.2%.