Cheviot, OH
Cheviot Map
Cheviot Overview
8,682
TOTAL POPULATION
4,427
MALE POPULATION
4,255
FEMALE POPULATION
104.04
MALES / 100 FEMALES
96.11
FEMALES / 100 MALES
32.5
MEDIAN AGE
3.1
AVG FAMILY SIZE
2.4
AVG HOUSEHOLD SIZE
$28,655
PER CAPITA INCOME
$56,125
AVG FAMILY INCOME
$52,461
AVG HOUSEHOLD INCOME
23.9%
WAGE / INCOME GAP [ % ]
76.1¢/ $1
WAGE / INCOME GAP [ $ ]
0.41
INEQUALITY / GINI INDEX
4,622
LABOR FORCE [ PEOPLE ]
73.9%
PERCENT IN LABOR FORCE
6.3%
UNEMPLOYMENT RATE
Cheviot Area Codes
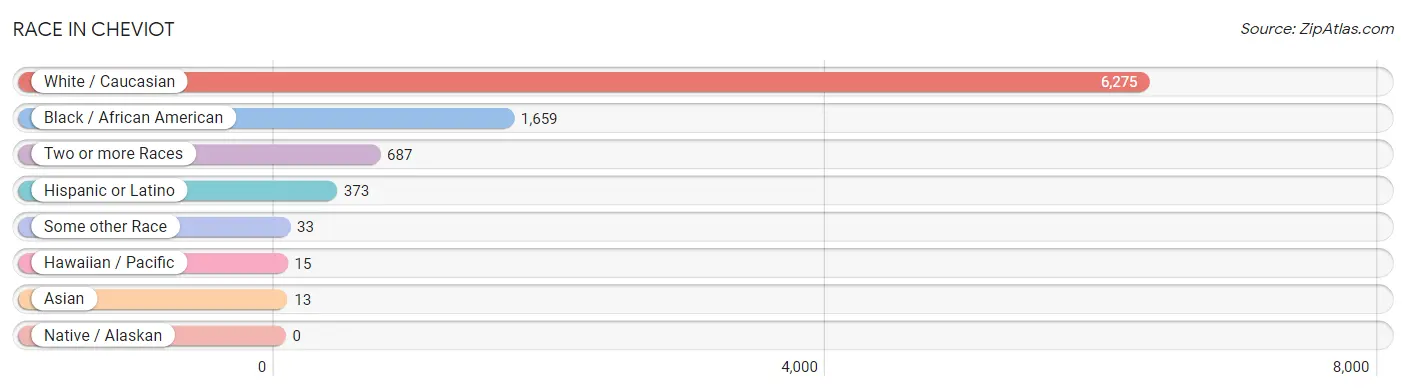
Race in Cheviot
The most populous races in Cheviot are White / Caucasian (6,275 | 72.3%), Black / African American (1,659 | 19.1%), and Two or more Races (687 | 7.9%).
| Race | # Population | % Population |
| Asian | 13 | 0.2% |
| Black / African American | 1,659 | 19.1% |
| Hawaiian / Pacific | 15 | 0.2% |
| Hispanic or Latino | 373 | 4.3% |
| Native / Alaskan | 0 | 0.0% |
| White / Caucasian | 6,275 | 72.3% |
| Two or more Races | 687 | 7.9% |
| Some other Race | 33 | 0.4% |
| Total | 8,682 | 100.0% |
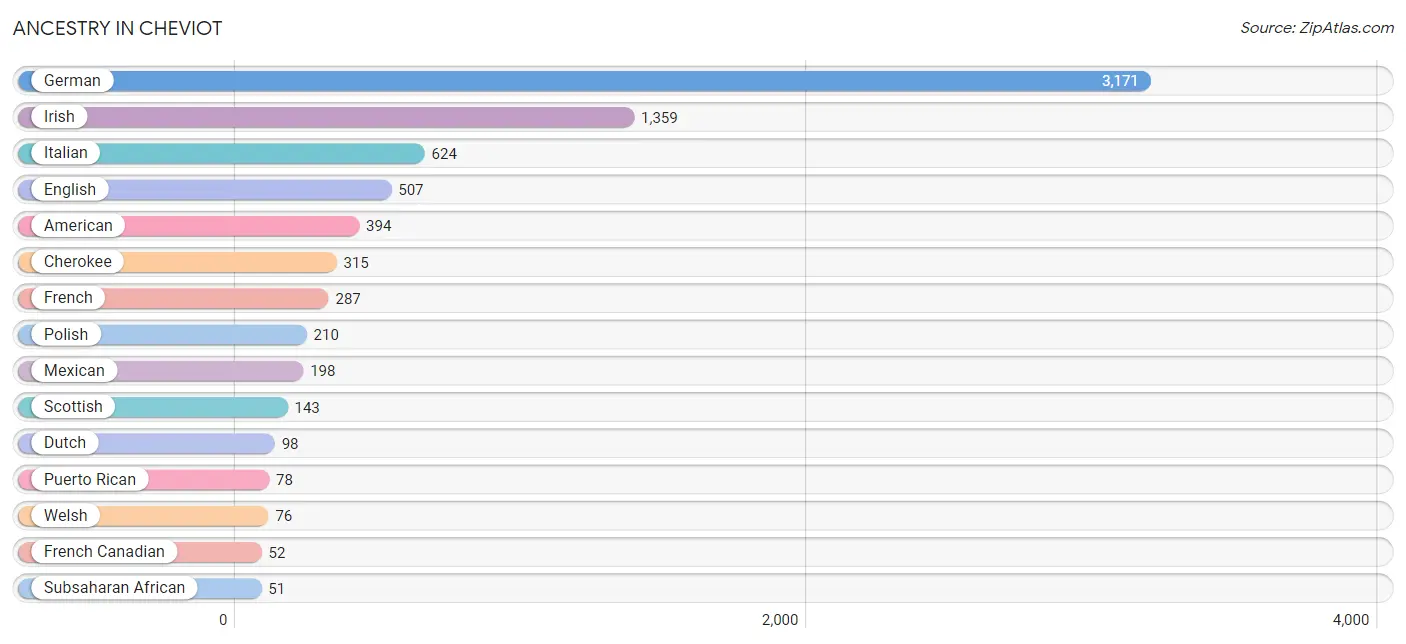
Ancestry in Cheviot
The most populous ancestries reported in Cheviot are German (3,171 | 36.5%), Irish (1,359 | 15.7%), Italian (624 | 7.2%), English (507 | 5.8%), and American (394 | 4.5%), together accounting for 69.7% of all Cheviot residents.
| Ancestry | # Population | % Population |
| African | 40 | 0.5% |
| American | 394 | 4.5% |
| Arab | 15 | 0.2% |
| British | 39 | 0.4% |
| Central American | 50 | 0.6% |
| Cherokee | 315 | 3.6% |
| Czechoslovakian | 13 | 0.2% |
| Dutch | 98 | 1.1% |
| Eastern European | 12 | 0.1% |
| English | 507 | 5.8% |
| Filipino | 13 | 0.2% |
| French | 287 | 3.3% |
| French Canadian | 52 | 0.6% |
| German | 3,171 | 36.5% |
| Greek | 14 | 0.2% |
| Guatemalan | 50 | 0.6% |
| Hungarian | 8 | 0.1% |
| Irish | 1,359 | 15.7% |
| Iroquois | 23 | 0.3% |
| Italian | 624 | 7.2% |
| Lebanese | 15 | 0.2% |
| Mexican | 198 | 2.3% |
| Native Hawaiian | 15 | 0.2% |
| Norwegian | 31 | 0.4% |
| Peruvian | 43 | 0.5% |
| Polish | 210 | 2.4% |
| Portuguese | 7 | 0.1% |
| Puerto Rican | 78 | 0.9% |
| Scotch-Irish | 33 | 0.4% |
| Scottish | 143 | 1.7% |
| Senegalese | 11 | 0.1% |
| Slovene | 29 | 0.3% |
| South American | 43 | 0.5% |
| Subsaharan African | 51 | 0.6% |
| Welsh | 76 | 0.9% | View All 35 Rows |
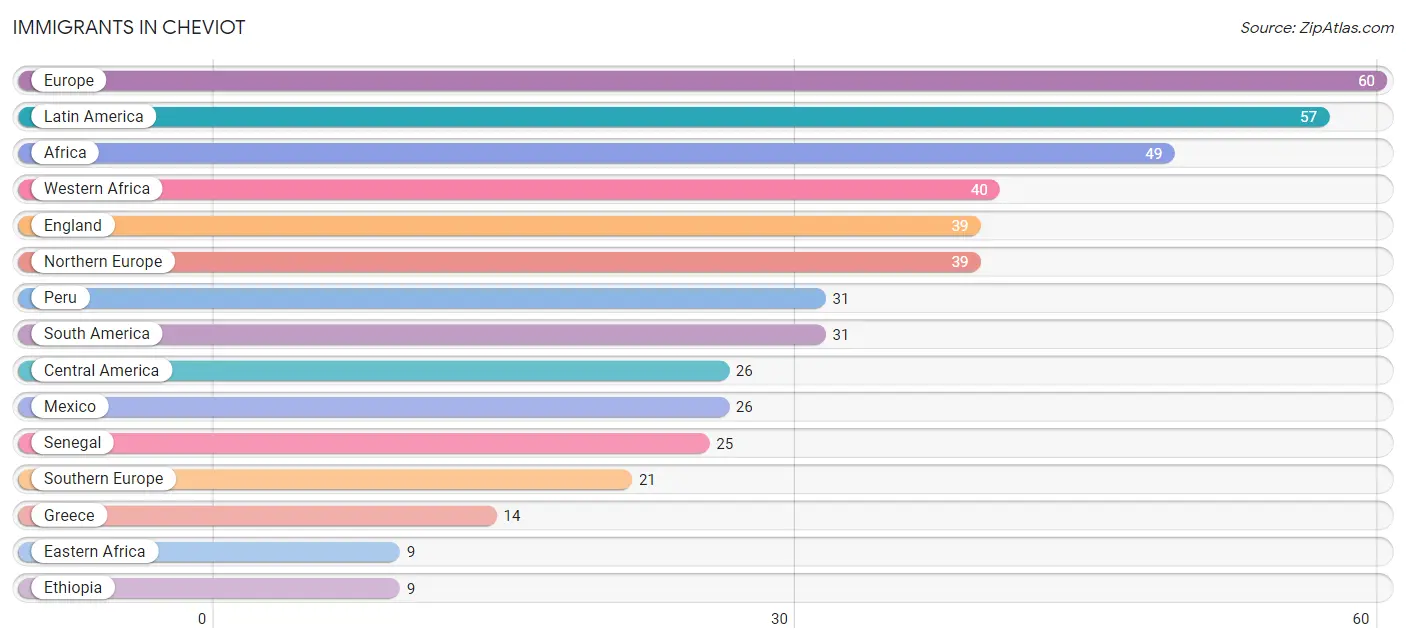
Immigrants in Cheviot
The most numerous immigrant groups reported in Cheviot came from Europe (60 | 0.7%), Latin America (57 | 0.7%), Africa (49 | 0.6%), Western Africa (40 | 0.5%), and England (39 | 0.4%), together accounting for 2.8% of all Cheviot residents.
| Immigration Origin | # Population | % Population |
| Africa | 49 | 0.6% |
| Central America | 26 | 0.3% |
| Eastern Africa | 9 | 0.1% |
| England | 39 | 0.4% |
| Ethiopia | 9 | 0.1% |
| Europe | 60 | 0.7% |
| Greece | 14 | 0.2% |
| Italy | 7 | 0.1% |
| Latin America | 57 | 0.7% |
| Mexico | 26 | 0.3% |
| Nigeria | 6 | 0.1% |
| Northern Europe | 39 | 0.4% |
| Peru | 31 | 0.4% |
| Senegal | 25 | 0.3% |
| South America | 31 | 0.4% |
| Southern Europe | 21 | 0.2% |
| Western Africa | 40 | 0.5% | View All 17 Rows |
Sex and Age in Cheviot
Sex and Age in Cheviot
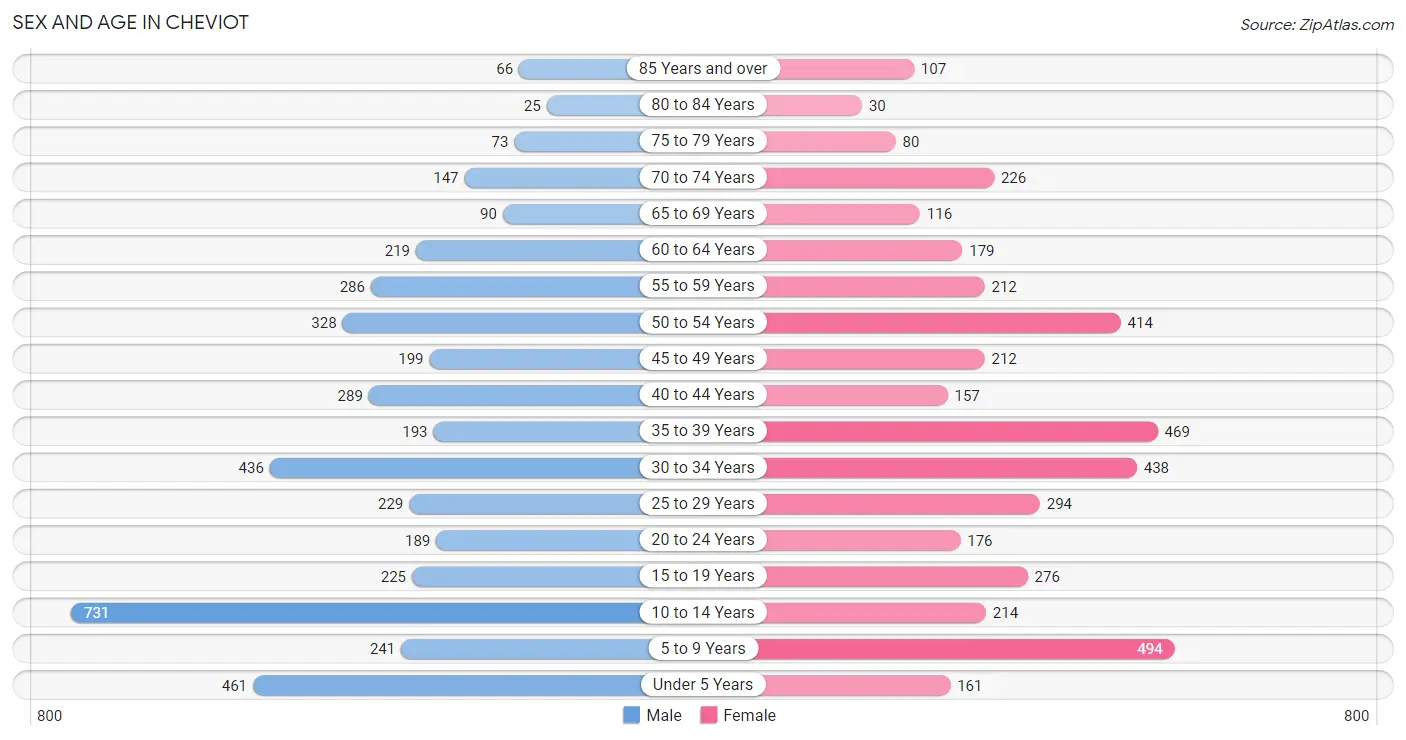
The most populous age groups in Cheviot are 10 to 14 Years (731 | 16.5%) for men and 5 to 9 Years (494 | 11.6%) for women.
| Age Bracket | Male | Female |
| Under 5 Years | 461 (10.4%) | 161 (3.8%) |
| 5 to 9 Years | 241 (5.4%) | 494 (11.6%) |
| 10 to 14 Years | 731 (16.5%) | 214 (5.0%) |
| 15 to 19 Years | 225 (5.1%) | 276 (6.5%) |
| 20 to 24 Years | 189 (4.3%) | 176 (4.1%) |
| 25 to 29 Years | 229 (5.2%) | 294 (6.9%) |
| 30 to 34 Years | 436 (9.9%) | 438 (10.3%) |
| 35 to 39 Years | 193 (4.4%) | 469 (11.0%) |
| 40 to 44 Years | 289 (6.5%) | 157 (3.7%) |
| 45 to 49 Years | 199 (4.5%) | 212 (5.0%) |
| 50 to 54 Years | 328 (7.4%) | 414 (9.7%) |
| 55 to 59 Years | 286 (6.5%) | 212 (5.0%) |
| 60 to 64 Years | 219 (5.0%) | 179 (4.2%) |
| 65 to 69 Years | 90 (2.0%) | 116 (2.7%) |
| 70 to 74 Years | 147 (3.3%) | 226 (5.3%) |
| 75 to 79 Years | 73 (1.7%) | 80 (1.9%) |
| 80 to 84 Years | 25 (0.6%) | 30 (0.7%) |
| 85 Years and over | 66 (1.5%) | 107 (2.5%) |
| Total | 4,427 (100.0%) | 4,255 (100.0%) |
Families and Households in Cheviot
Median Family Size in Cheviot
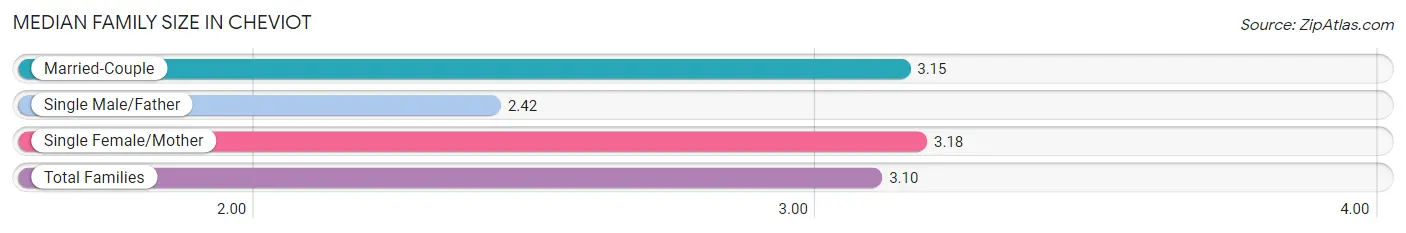
The median family size in Cheviot is 3.10 persons per family, with single female/mother families (862 | 45.1%) accounting for the largest median family size of 3.18 persons per family. On the other hand, single male/father families (168 | 8.8%) represent the smallest median family size with 2.42 persons per family.
| Family Type | # Families | Family Size |
| Married-Couple | 881 (46.1%) | 3.15 |
| Single Male/Father | 168 (8.8%) | 2.42 |
| Single Female/Mother | 862 (45.1%) | 3.18 |
| Total Families | 1,911 (100.0%) | 3.10 |
Median Household Size in Cheviot
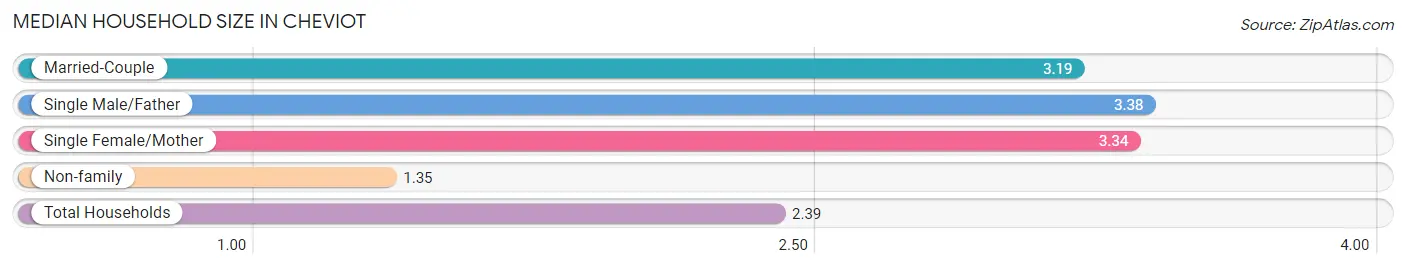
The median household size in Cheviot is 2.39 persons per household, with single male/father households (168 | 4.8%) accounting for the largest median household size of 3.38 persons per household. non-family households (1,606 | 45.7%) represent the smallest median household size with 1.35 persons per household.
| Household Type | # Households | Household Size |
| Married-Couple | 881 (25.1%) | 3.19 |
| Single Male/Father | 168 (4.8%) | 3.38 |
| Single Female/Mother | 862 (24.5%) | 3.34 |
| Non-family | 1,606 (45.7%) | 1.35 |
| Total Households | 3,517 (100.0%) | 2.39 |
Household Size by Marriage Status in Cheviot
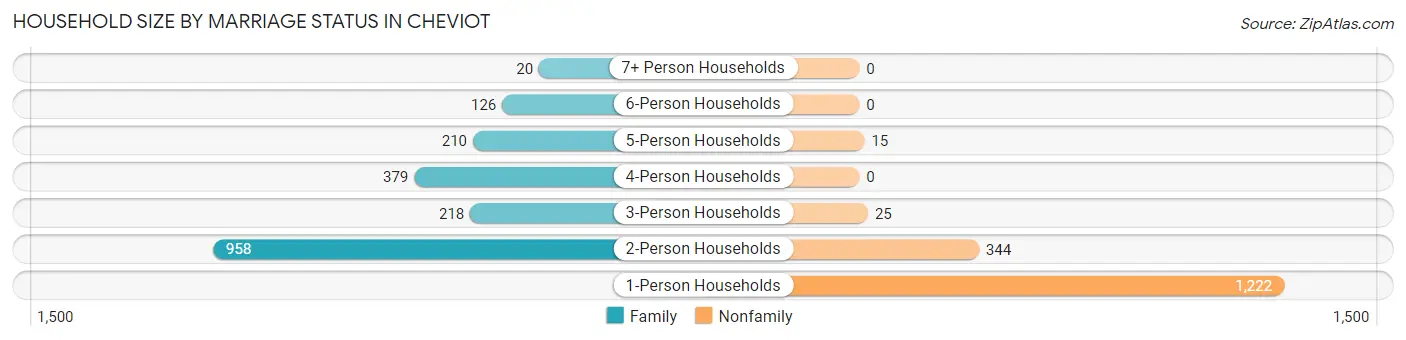
Out of a total of 3,517 households in Cheviot, 1,911 (54.3%) are family households, while 1,606 (45.7%) are nonfamily households. The most numerous type of family households are 2-person households, comprising 958, and the most common type of nonfamily households are 1-person households, comprising 1,222.
| Household Size | Family Households | Nonfamily Households |
| 1-Person Households | - | 1,222 (34.7%) |
| 2-Person Households | 958 (27.2%) | 344 (9.8%) |
| 3-Person Households | 218 (6.2%) | 25 (0.7%) |
| 4-Person Households | 379 (10.8%) | 0 (0.0%) |
| 5-Person Households | 210 (6.0%) | 15 (0.4%) |
| 6-Person Households | 126 (3.6%) | 0 (0.0%) |
| 7+ Person Households | 20 (0.6%) | 0 (0.0%) |
| Total | 1,911 (54.3%) | 1,606 (45.7%) |
Female Fertility in Cheviot
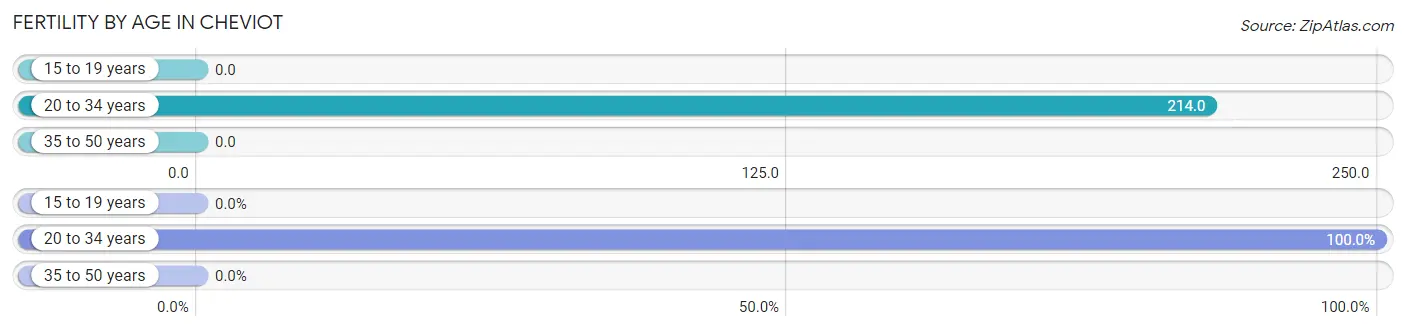
Fertility by Age in Cheviot
Average fertility rate in Cheviot is 89.0 births per 1,000 women. Women in the age bracket of 20 to 34 years have the highest fertility rate with 214.0 births per 1,000 women. Women in the age bracket of 20 to 34 years acount for 100.0% of all women with births.
| Age Bracket | Women with Births | Births / 1,000 Women |
| 15 to 19 years | 0 (0.0%) | 0.0 |
| 20 to 34 years | 194 (100.0%) | 214.0 |
| 35 to 50 years | 0 (0.0%) | 0.0 |
| Total | 194 (100.0%) | 89.0 |
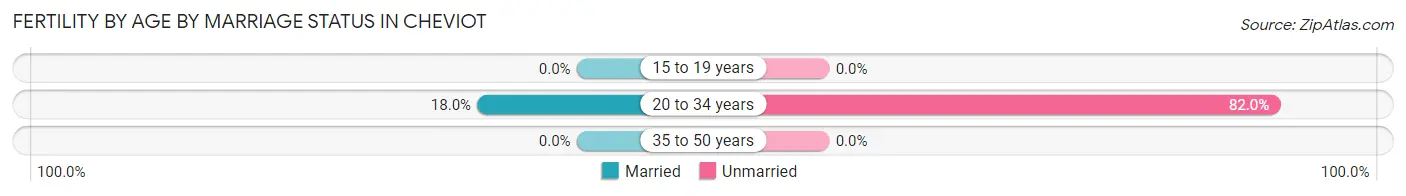
Fertility by Age by Marriage Status in Cheviot
18.0% of women with births (194) in Cheviot are married. The highest percentage of unmarried women with births falls into 20 to 34 years age bracket with 82.0% of them unmarried at the time of birth, while the lowest percentage of unmarried women with births belong to 20 to 34 years age bracket with 82.0% of them unmarried.
| Age Bracket | Married | Unmarried |
| 15 to 19 years | 0 (0.0%) | 0 (0.0%) |
| 20 to 34 years | 35 (18.0%) | 159 (82.0%) |
| 35 to 50 years | 0 (0.0%) | 0 (0.0%) |
| Total | 35 (18.0%) | 159 (82.0%) |
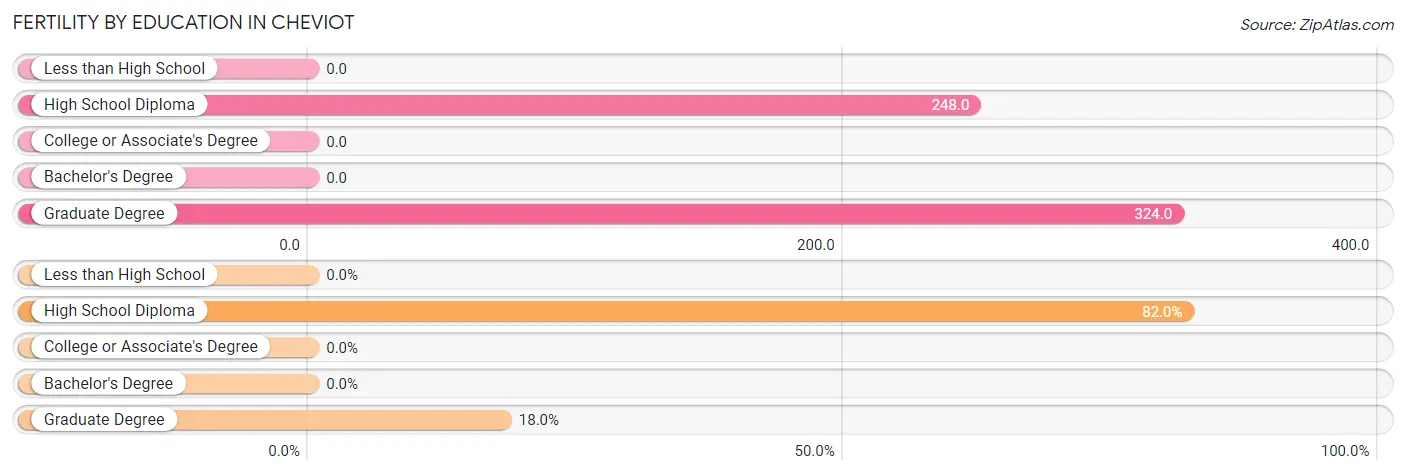
Fertility by Education in Cheviot
| Educational Attainment | Women with Births | Births / 1,000 Women |
| Less than High School | 0 (0.0%) | 0.0 |
| High School Diploma | 159 (82.0%) | 248.0 |
| College or Associate's Degree | 0 (0.0%) | 0.0 |
| Bachelor's Degree | 0 (0.0%) | 0.0 |
| Graduate Degree | 35 (18.0%) | 324.0 |
| Total | 194 (100.0%) | 89.0 |
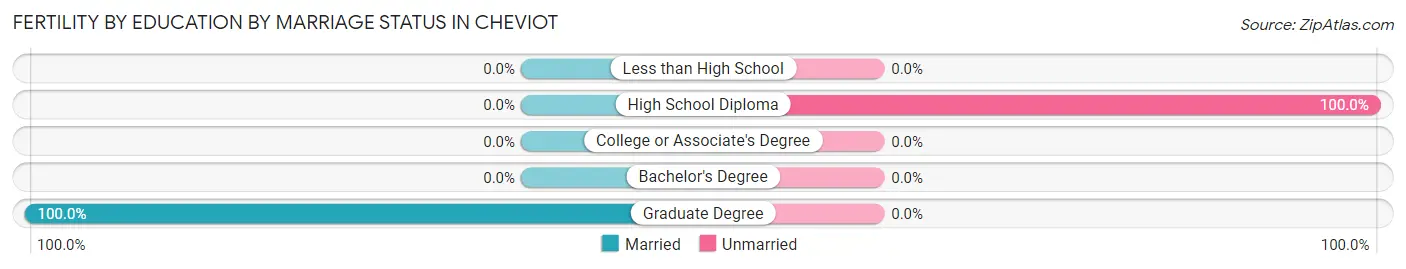
Fertility by Education by Marriage Status in Cheviot
82.0% of women with births in Cheviot are unmarried. Women with the educational attainment of graduate degree are most likely to be married with 100.0% of them married at childbirth, while women with the educational attainment of high school diploma are least likely to be married with 100.0% of them unmarried at childbirth.
| Educational Attainment | Married | Unmarried |
| Less than High School | 0 (0.0%) | 0 (0.0%) |
| High School Diploma | 0 (0.0%) | 159 (100.0%) |
| College or Associate's Degree | 0 (0.0%) | 0 (0.0%) |
| Bachelor's Degree | 0 (0.0%) | 0 (0.0%) |
| Graduate Degree | 35 (100.0%) | 0 (0.0%) |
| Total | 35 (18.0%) | 159 (82.0%) |
Income in Cheviot
Income Overview in Cheviot
Per Capita Income in Cheviot is $28,655, while median incomes of families and households are $56,125 and $52,461 respectively.
| Characteristic | Number | Measure |
| Per Capita Income | 8,682 | $28,655 |
| Median Family Income | 1,911 | $56,125 |
| Mean Family Income | 1,911 | $72,765 |
| Median Household Income | 3,517 | $52,461 |
| Mean Household Income | 3,517 | $67,243 |
| Income Deficit | 1,911 | $0 |
| Wage / Income Gap (%) | 8,682 | 23.90% |
| Wage / Income Gap ($) | 8,682 | 76.10¢ per $1 |
| Gini / Inequality Index | 8,682 | 0.41 |
Earnings by Sex in Cheviot
Average Earnings in Cheviot are $37,392, $43,633 for men and $33,206 for women, a difference of 23.9%.
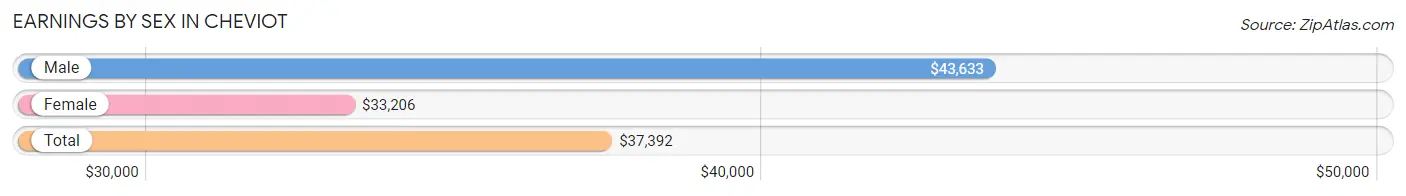
| Sex | Number | Average Earnings |
| Male | 2,206 (47.1%) | $43,633 |
| Female | 2,478 (52.9%) | $33,206 |
| Total | 4,684 (100.0%) | $37,392 |
Earnings by Sex by Income Bracket in Cheviot
The most common earnings brackets in Cheviot are $100,000+ for men (286 | 13.0%) and $30,000 to $34,999 for women (262 | 10.6%).
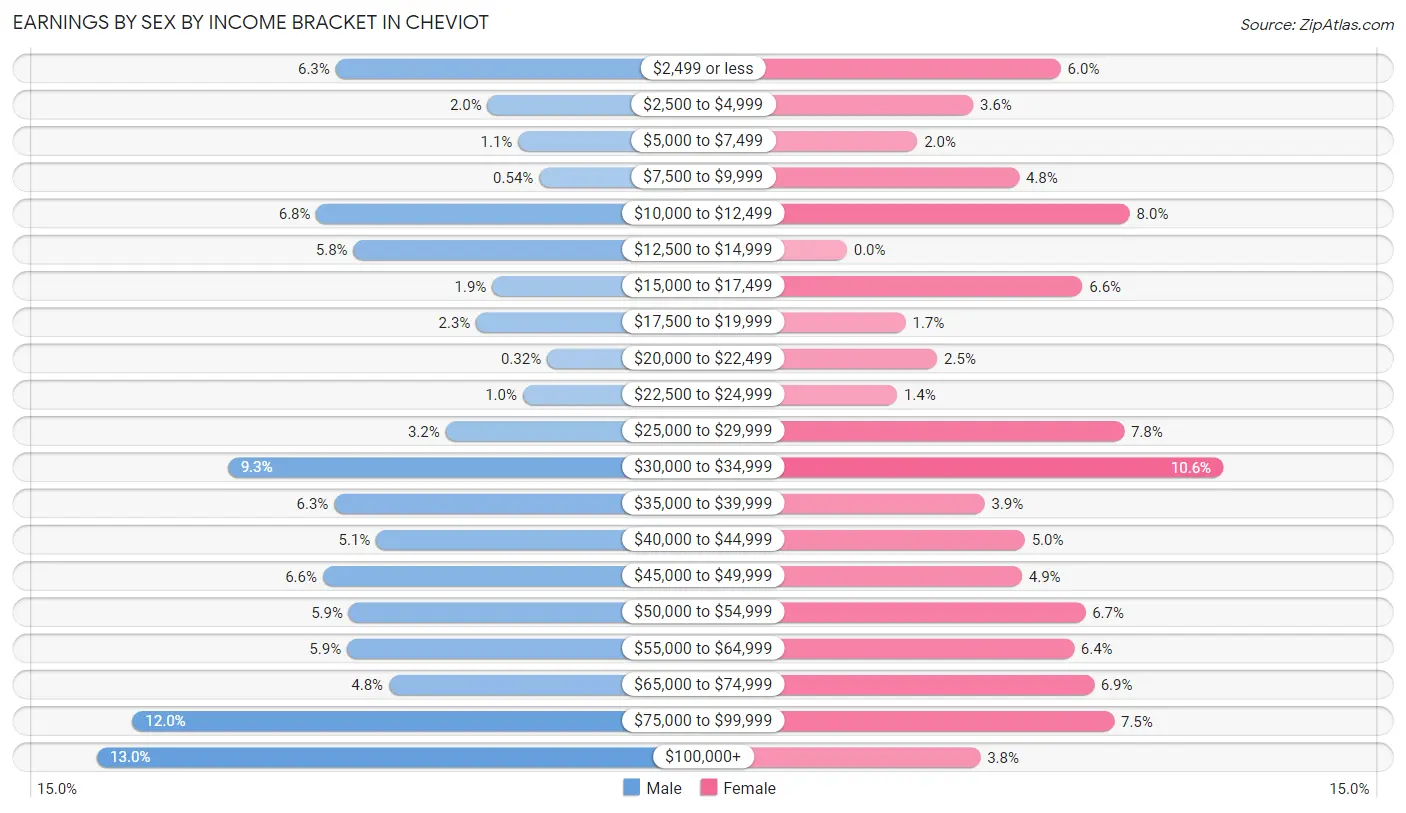
| Income | Male | Female |
| $2,499 or less | 138 (6.3%) | 149 (6.0%) |
| $2,500 to $4,999 | 44 (2.0%) | 88 (3.5%) |
| $5,000 to $7,499 | 25 (1.1%) | 49 (2.0%) |
| $7,500 to $9,999 | 12 (0.5%) | 120 (4.8%) |
| $10,000 to $12,499 | 150 (6.8%) | 197 (8.0%) |
| $12,500 to $14,999 | 127 (5.8%) | 0 (0.0%) |
| $15,000 to $17,499 | 41 (1.9%) | 164 (6.6%) |
| $17,500 to $19,999 | 51 (2.3%) | 41 (1.7%) |
| $20,000 to $22,499 | 7 (0.3%) | 63 (2.5%) |
| $22,500 to $24,999 | 22 (1.0%) | 35 (1.4%) |
| $25,000 to $29,999 | 70 (3.2%) | 193 (7.8%) |
| $30,000 to $34,999 | 205 (9.3%) | 262 (10.6%) |
| $35,000 to $39,999 | 139 (6.3%) | 96 (3.9%) |
| $40,000 to $44,999 | 113 (5.1%) | 124 (5.0%) |
| $45,000 to $49,999 | 146 (6.6%) | 122 (4.9%) |
| $50,000 to $54,999 | 130 (5.9%) | 166 (6.7%) |
| $55,000 to $64,999 | 131 (5.9%) | 158 (6.4%) |
| $65,000 to $74,999 | 105 (4.8%) | 172 (6.9%) |
| $75,000 to $99,999 | 264 (12.0%) | 186 (7.5%) |
| $100,000+ | 286 (13.0%) | 93 (3.7%) |
| Total | 2,206 (100.0%) | 2,478 (100.0%) |
Earnings by Sex by Educational Attainment in Cheviot
Average earnings in Cheviot are $47,721 for men and $34,831 for women, a difference of 27.0%. Men with an educational attainment of bachelor's degree enjoy the highest average annual earnings of $76,989, while those with graduate degree education earn the least with $18,693. Women with an educational attainment of graduate degree earn the most with the average annual earnings of $73,429, while those with high school diploma education have the smallest earnings of $26,760.
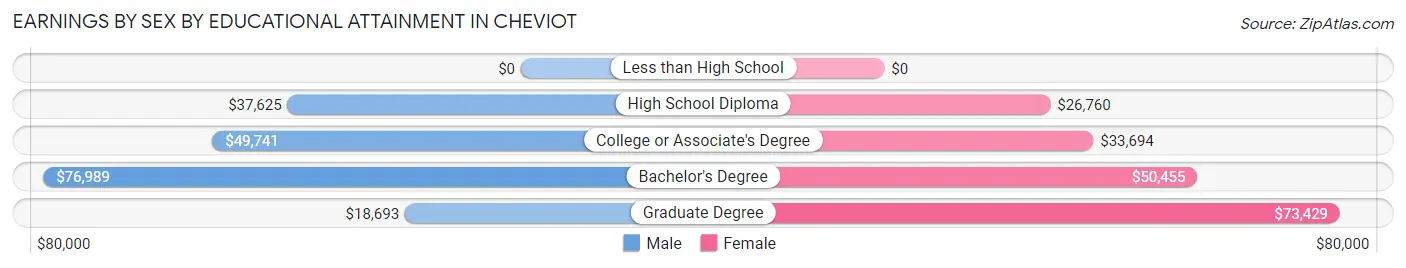
| Educational Attainment | Male Income | Female Income |
| Less than High School | - | - |
| High School Diploma | $37,625 | $26,760 |
| College or Associate's Degree | $49,741 | $33,694 |
| Bachelor's Degree | $76,989 | $50,455 |
| Graduate Degree | $18,693 | $73,429 |
| Total | $47,721 | $34,831 |
Family Income in Cheviot
Family Income Brackets in Cheviot
According to the Cheviot family income data, there are 459 families falling into the $50,000 to $74,999 income range, which is the most common income bracket and makes up 24.0% of all families. Conversely, the less than $10,000 income bracket is the least frequent group with only 8 families (0.4%) belonging to this category.
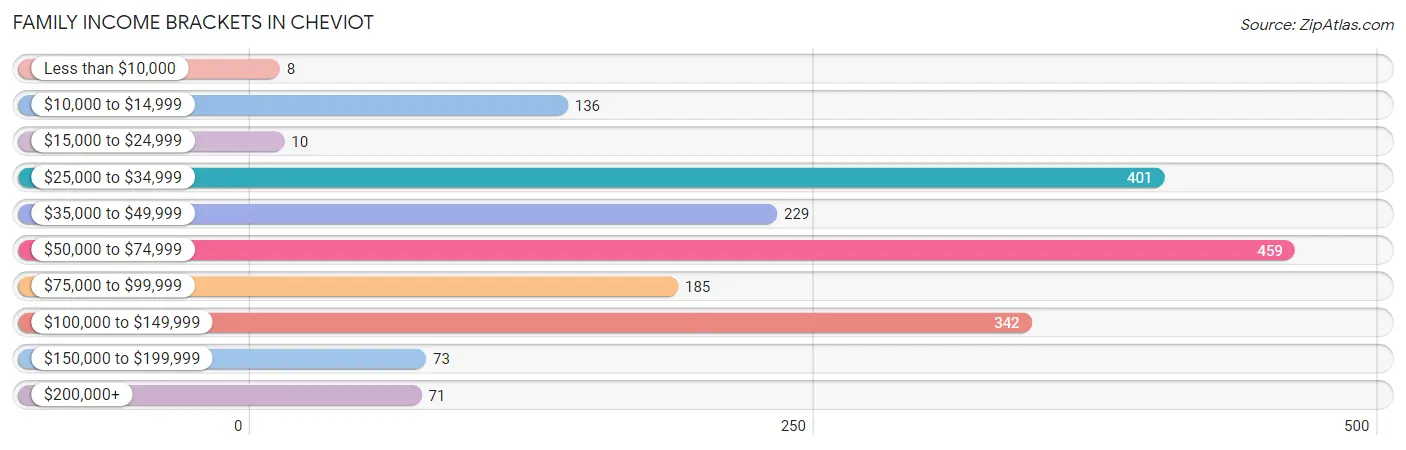
| Income Bracket | # Families | % Families |
| Less than $10,000 | 8 | 0.4% |
| $10,000 to $14,999 | 136 | 7.1% |
| $15,000 to $24,999 | 10 | 0.5% |
| $25,000 to $34,999 | 401 | 21.0% |
| $35,000 to $49,999 | 229 | 12.0% |
| $50,000 to $74,999 | 459 | 24.0% |
| $75,000 to $99,999 | 185 | 9.7% |
| $100,000 to $149,999 | 342 | 17.9% |
| $150,000 to $199,999 | 73 | 3.8% |
| $200,000+ | 71 | 3.7% |
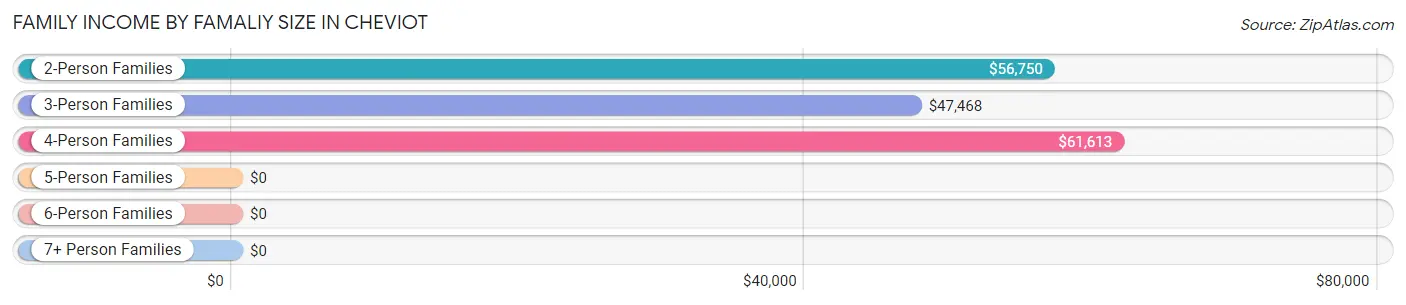
Family Income by Famaliy Size in Cheviot
4-person families (396 | 20.7%) account for the highest median family income in Cheviot with $61,613 per family, while 2-person families (1,028 | 53.8%) have the highest median income of $28,375 per family member.
| Income Bracket | # Families | Median Income |
| 2-Person Families | 1,028 (53.8%) | $56,750 |
| 3-Person Families | 209 (10.9%) | $47,468 |
| 4-Person Families | 396 (20.7%) | $61,613 |
| 5-Person Families | 230 (12.0%) | $0 |
| 6-Person Families | 28 (1.5%) | $0 |
| 7+ Person Families | 20 (1.1%) | $0 |
| Total | 1,911 (100.0%) | $56,125 |
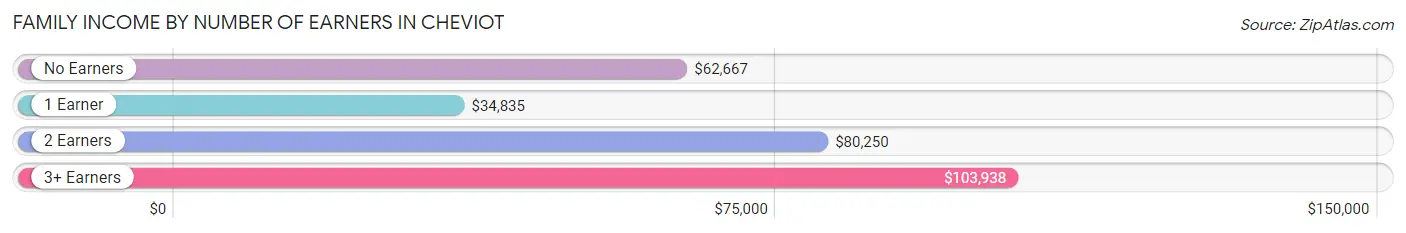
Family Income by Number of Earners in Cheviot
The median family income in Cheviot is $56,125, with families comprising 3+ earners (161) having the highest median family income of $103,938, while families with 1 earner (977) have the lowest median family income of $34,835, accounting for 8.4% and 51.1% of families, respectively.
| Number of Earners | # Families | Median Income |
| No Earners | 92 (4.8%) | $62,667 |
| 1 Earner | 977 (51.1%) | $34,835 |
| 2 Earners | 681 (35.6%) | $80,250 |
| 3+ Earners | 161 (8.4%) | $103,938 |
| Total | 1,911 (100.0%) | $56,125 |
Household Income in Cheviot
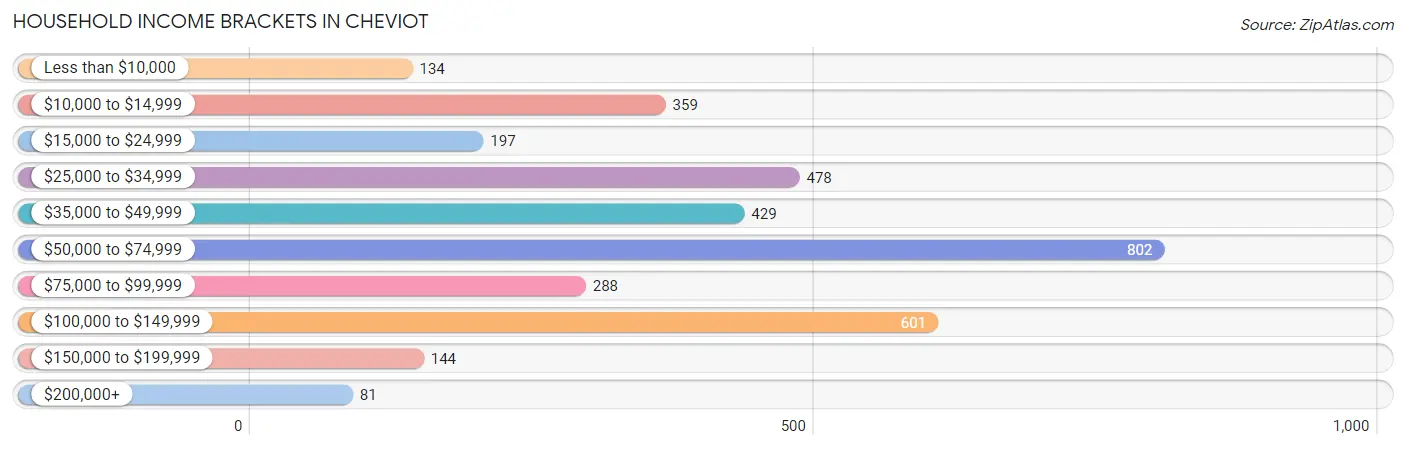
Household Income Brackets in Cheviot
With 802 households falling in the category, the $50,000 to $74,999 income range is the most frequent in Cheviot, accounting for 22.8% of all households. In contrast, only 81 households (2.3%) fall into the $200,000+ income bracket, making it the least populous group.
| Income Bracket | # Households | % Households |
| Less than $10,000 | 134 | 3.8% |
| $10,000 to $14,999 | 359 | 10.2% |
| $15,000 to $24,999 | 197 | 5.6% |
| $25,000 to $34,999 | 478 | 13.6% |
| $35,000 to $49,999 | 429 | 12.2% |
| $50,000 to $74,999 | 802 | 22.8% |
| $75,000 to $99,999 | 288 | 8.2% |
| $100,000 to $149,999 | 601 | 17.1% |
| $150,000 to $199,999 | 144 | 4.1% |
| $200,000+ | 81 | 2.3% |
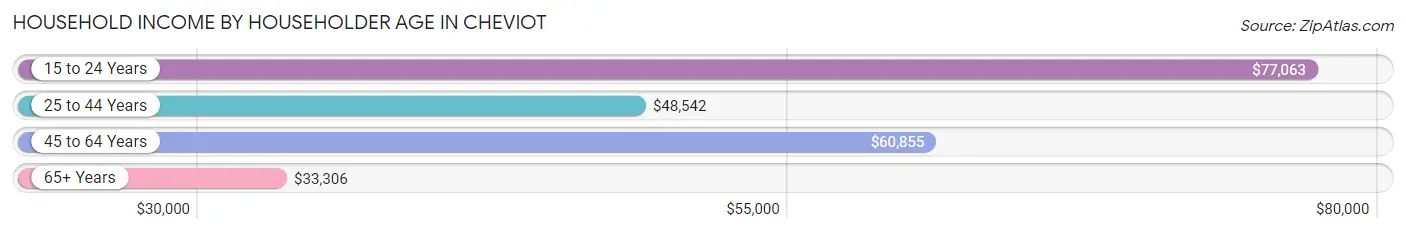
Household Income by Householder Age in Cheviot
The median household income in Cheviot is $52,461, with the highest median household income of $77,063 found in the 15 to 24 years age bracket for the primary householder. A total of 81 households (2.3%) fall into this category. Meanwhile, the 65+ years age bracket for the primary householder has the lowest median household income of $33,306, with 608 households (17.3%) in this group.
| Income Bracket | # Households | Median Income |
| 15 to 24 Years | 81 (2.3%) | $77,063 |
| 25 to 44 Years | 1,518 (43.2%) | $48,542 |
| 45 to 64 Years | 1,310 (37.2%) | $60,855 |
| 65+ Years | 608 (17.3%) | $33,306 |
| Total | 3,517 (100.0%) | $52,461 |
Poverty in Cheviot
Income Below Poverty by Sex and Age in Cheviot
With 19.4% poverty level for males and 15.5% for females among the residents of Cheviot, 6 to 11 year old males and 65 to 74 year old females are the most vulnerable to poverty, with 227 males (48.1%) and 177 females (60.2%) in their respective age groups living below the poverty level.
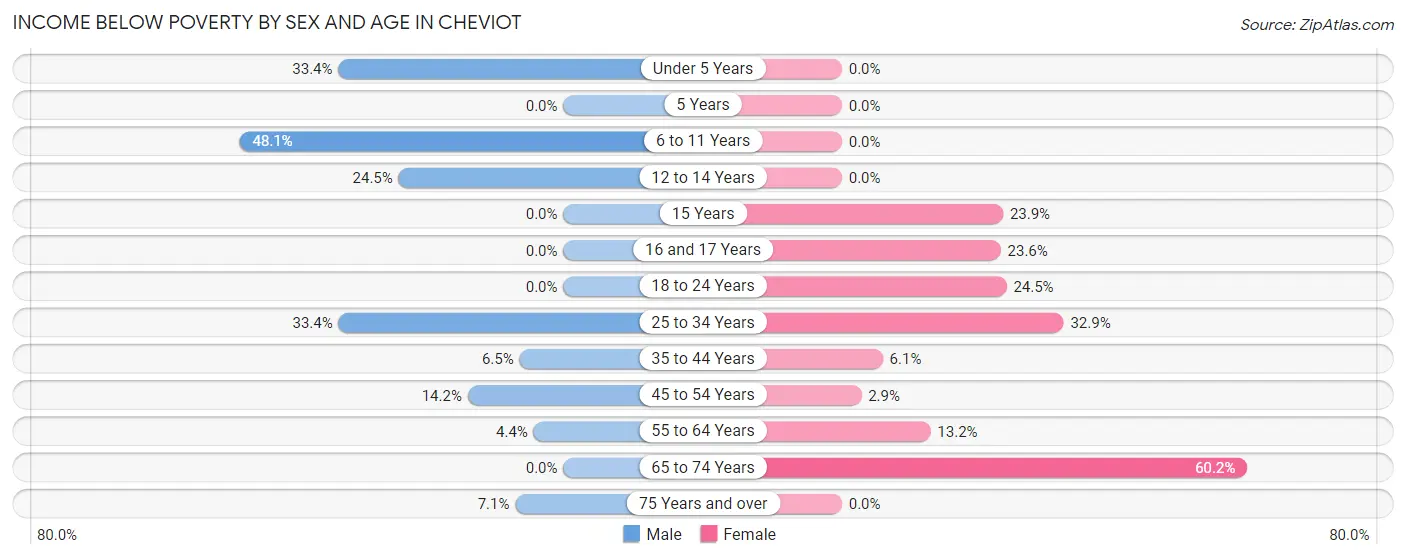
| Age Bracket | Male | Female |
| Under 5 Years | 154 (33.4%) | 0 (0.0%) |
| 5 Years | 0 (0.0%) | 0 (0.0%) |
| 6 to 11 Years | 227 (48.1%) | 0 (0.0%) |
| 12 to 14 Years | 80 (24.5%) | 0 (0.0%) |
| 15 Years | 0 (0.0%) | 28 (23.9%) |
| 16 and 17 Years | 0 (0.0%) | 25 (23.6%) |
| 18 to 24 Years | 0 (0.0%) | 56 (24.4%) |
| 25 to 34 Years | 222 (33.4%) | 241 (32.9%) |
| 35 to 44 Years | 31 (6.5%) | 38 (6.1%) |
| 45 to 54 Years | 71 (14.2%) | 18 (2.9%) |
| 55 to 64 Years | 22 (4.4%) | 50 (13.2%) |
| 65 to 74 Years | 0 (0.0%) | 177 (60.2%) |
| 75 Years and over | 7 (7.1%) | 0 (0.0%) |
| Total | 814 (19.4%) | 633 (15.5%) |
Income Above Poverty by Sex and Age in Cheviot
According to the poverty statistics in Cheviot, males aged 5 years and females aged under 5 years are the age groups that are most secure financially, with 100.0% of males and 100.0% of females in these age groups living above the poverty line.
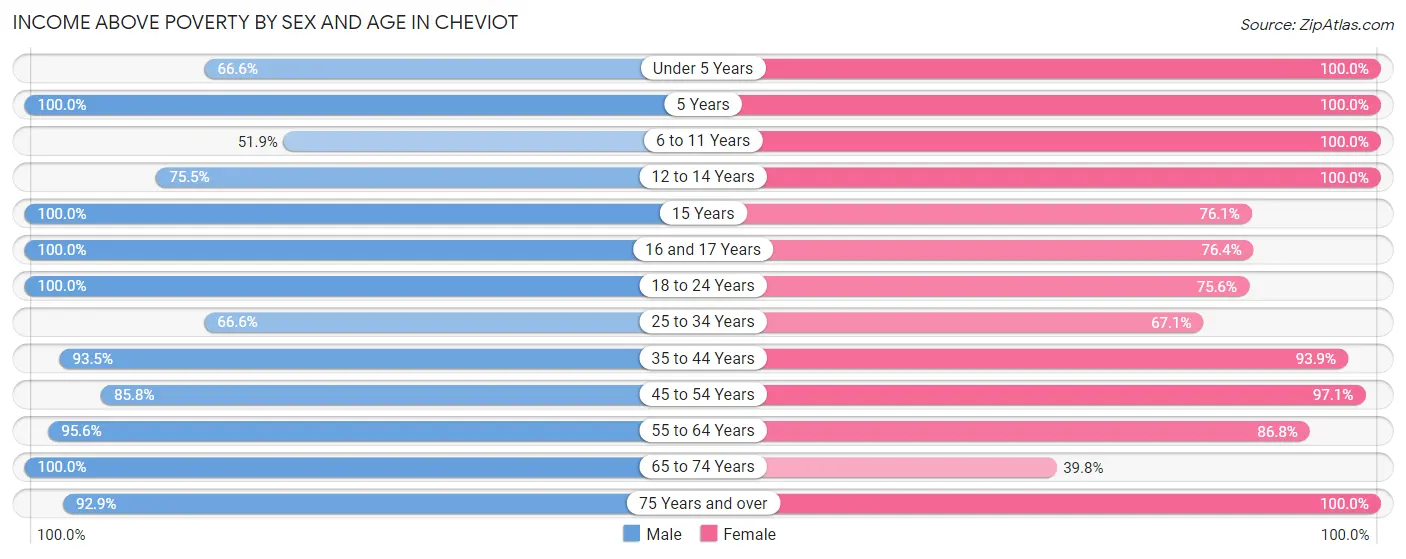
| Age Bracket | Male | Female |
| Under 5 Years | 307 (66.6%) | 161 (100.0%) |
| 5 Years | 58 (100.0%) | 41 (100.0%) |
| 6 to 11 Years | 245 (51.9%) | 493 (100.0%) |
| 12 to 14 Years | 247 (75.5%) | 157 (100.0%) |
| 15 Years | 9 (100.0%) | 89 (76.1%) |
| 16 and 17 Years | 132 (100.0%) | 81 (76.4%) |
| 18 to 24 Years | 273 (100.0%) | 173 (75.5%) |
| 25 to 34 Years | 443 (66.6%) | 491 (67.1%) |
| 35 to 44 Years | 445 (93.5%) | 588 (93.9%) |
| 45 to 54 Years | 429 (85.8%) | 608 (97.1%) |
| 55 to 64 Years | 478 (95.6%) | 330 (86.8%) |
| 65 to 74 Years | 232 (100.0%) | 117 (39.8%) |
| 75 Years and over | 91 (92.9%) | 130 (100.0%) |
| Total | 3,389 (80.6%) | 3,459 (84.5%) |
Income Below Poverty Among Married-Couple Families in Cheviot
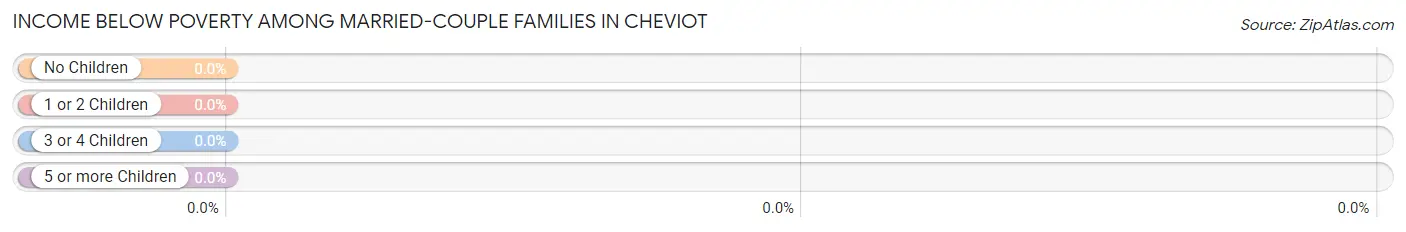
| Children | Above Poverty | Below Poverty |
| No Children | 534 (100.0%) | 0 (0.0%) |
| 1 or 2 Children | 235 (100.0%) | 0 (0.0%) |
| 3 or 4 Children | 112 (100.0%) | 0 (0.0%) |
| 5 or more Children | 0 (0.0%) | 0 (0.0%) |
| Total | 881 (100.0%) | 0 (0.0%) |
Income Below Poverty Among Single-Parent Households in Cheviot
According to the poverty data in Cheviot, 4.2% or 7 single-father households and 27.2% or 234 single-mother households are living below the poverty line. Among single-father households, those with 1 or 2 children have the highest poverty rate, with 7 households (6.1%) experiencing poverty. Likewise, among single-mother households, those with 3 or 4 children have the highest poverty rate, with 98 households (46.7%) falling below the poverty line.
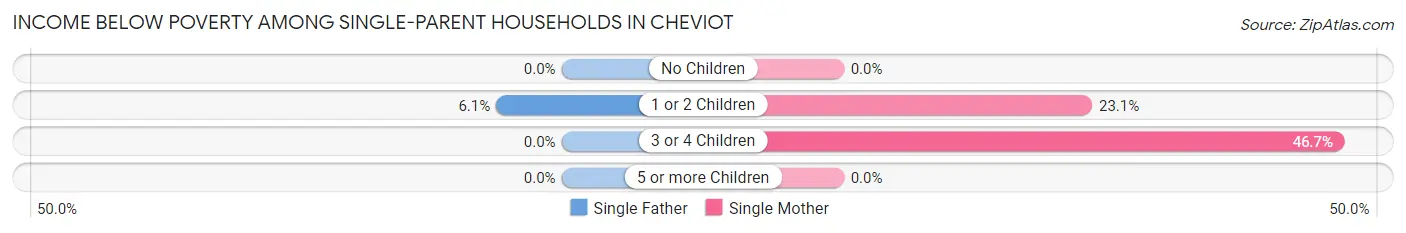
| Children | Single Father | Single Mother |
| No Children | 0 (0.0%) | 0 (0.0%) |
| 1 or 2 Children | 7 (6.1%) | 136 (23.1%) |
| 3 or 4 Children | 0 (0.0%) | 98 (46.7%) |
| 5 or more Children | 0 (0.0%) | 0 (0.0%) |
| Total | 7 (4.2%) | 234 (27.2%) |
Income Below Poverty Among Married-Couple vs Single-Parent Households in Cheviot
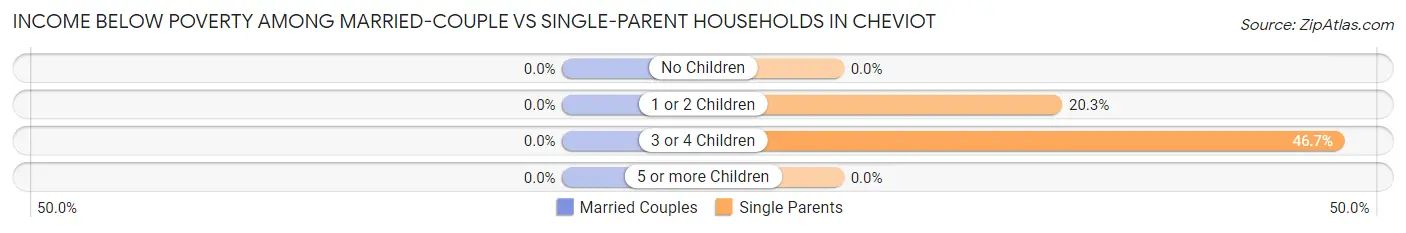
| Children | Married-Couple Families | Single-Parent Households |
| No Children | 0 (0.0%) | 0 (0.0%) |
| 1 or 2 Children | 0 (0.0%) | 143 (20.3%) |
| 3 or 4 Children | 0 (0.0%) | 98 (46.7%) |
| 5 or more Children | 0 (0.0%) | 0 (0.0%) |
| Total | 0 (0.0%) | 241 (23.4%) |
Employment Characteristics in Cheviot
Employment by Class of Employer in Cheviot
Among the 4,236 employed individuals in Cheviot, private company employees (3,367 | 79.5%), not-for-profit organizations (351 | 8.3%), and local government employees (187 | 4.4%) make up the most common classes of employment.
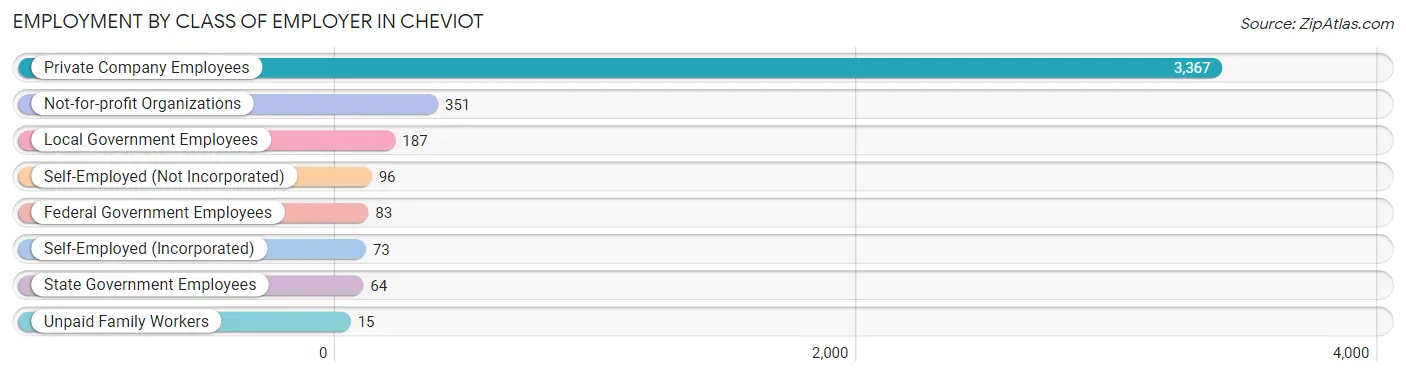
| Employer Class | # Employees | % Employees |
| Private Company Employees | 3,367 | 79.5% |
| Self-Employed (Incorporated) | 73 | 1.7% |
| Self-Employed (Not Incorporated) | 96 | 2.3% |
| Not-for-profit Organizations | 351 | 8.3% |
| Local Government Employees | 187 | 4.4% |
| State Government Employees | 64 | 1.5% |
| Federal Government Employees | 83 | 2.0% |
| Unpaid Family Workers | 15 | 0.4% |
| Total | 4,236 | 100.0% |
Employment Status by Age in Cheviot
According to the labor force statistics for Cheviot, out of the total population over 16 years of age (6,254), 73.9% or 4,622 individuals are in the labor force, with 6.3% or 291 of them unemployed. The age group with the highest labor force participation rate is 25 to 29 years, with 99.8% or 522 individuals in the labor force. Within the labor force, the 20 to 24 years age range has the highest percentage of unemployed individuals, with 22.8% or 79 of them being unemployed.
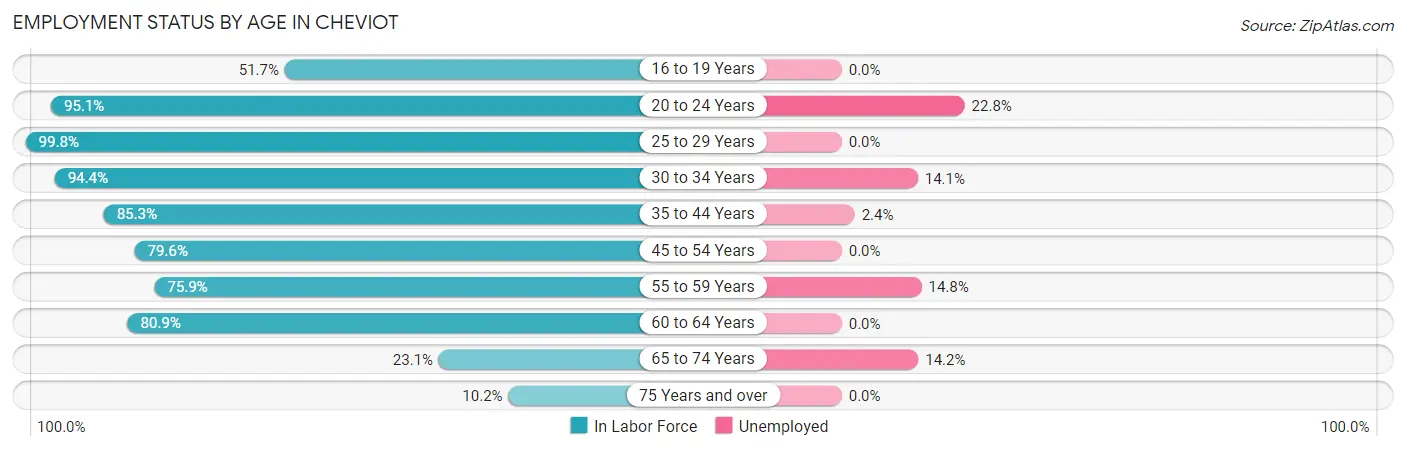
| Age Bracket | In Labor Force | Unemployed |
| 16 to 19 Years | 194 (51.7%) | 0 (0.0%) |
| 20 to 24 Years | 347 (95.1%) | 79 (22.8%) |
| 25 to 29 Years | 522 (99.8%) | 0 (0.0%) |
| 30 to 34 Years | 825 (94.4%) | 116 (14.1%) |
| 35 to 44 Years | 945 (85.3%) | 23 (2.4%) |
| 45 to 54 Years | 918 (79.6%) | 0 (0.0%) |
| 55 to 59 Years | 378 (75.9%) | 56 (14.8%) |
| 60 to 64 Years | 322 (80.9%) | 0 (0.0%) |
| 65 to 74 Years | 134 (23.1%) | 19 (14.2%) |
| 75 Years and over | 39 (10.2%) | 0 (0.0%) |
| Total | 4,622 (73.9%) | 291 (6.3%) |
Employment Status by Educational Attainment in Cheviot
According to labor force statistics for Cheviot, 85.9% of individuals (3,912) out of the total population between 25 and 64 years of age (4,554) are in the labor force, with 5.0% or 196 of them being unemployed. The group with the highest labor force participation rate are those with the educational attainment of bachelor's degree or higher, with 93.4% or 984 individuals in the labor force. Within the labor force, individuals with high school diploma education have the highest percentage of unemployment, with 9.6% or 116 of them being unemployed.
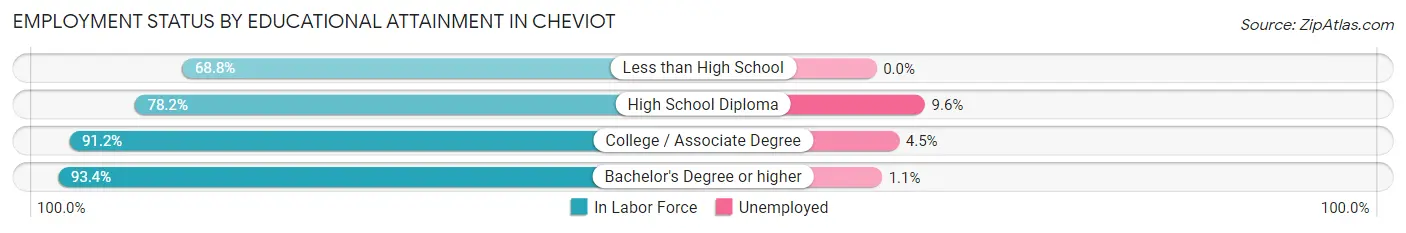
| Educational Attainment | In Labor Force | Unemployed |
| Less than High School | 196 (68.8%) | 0 (0.0%) |
| High School Diploma | 1,212 (78.2%) | 149 (9.6%) |
| College / Associate Degree | 1,519 (91.2%) | 75 (4.5%) |
| Bachelor's Degree or higher | 984 (93.4%) | 12 (1.1%) |
| Total | 3,912 (85.9%) | 228 (5.0%) |
Employment Occupations by Sex in Cheviot
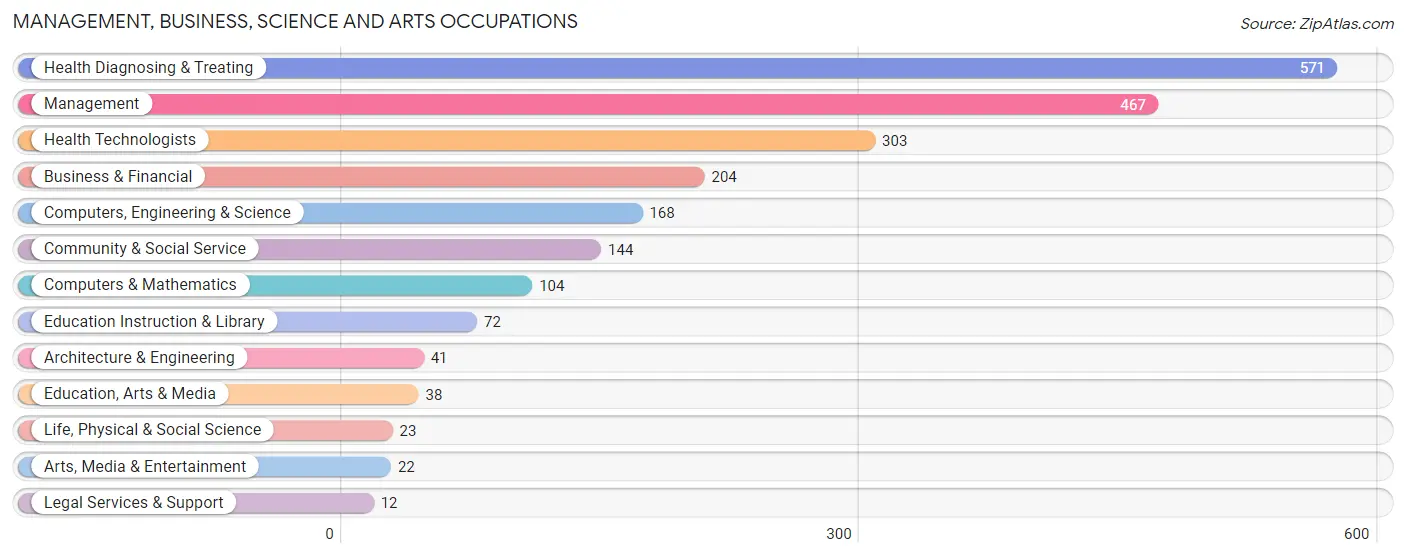
Management, Business, Science and Arts Occupations
The most common Management, Business, Science and Arts occupations in Cheviot are Health Diagnosing & Treating (571 | 13.2%), Management (467 | 10.8%), Health Technologists (303 | 7.0%), Business & Financial (204 | 4.7%), and Computers, Engineering & Science (168 | 3.9%).
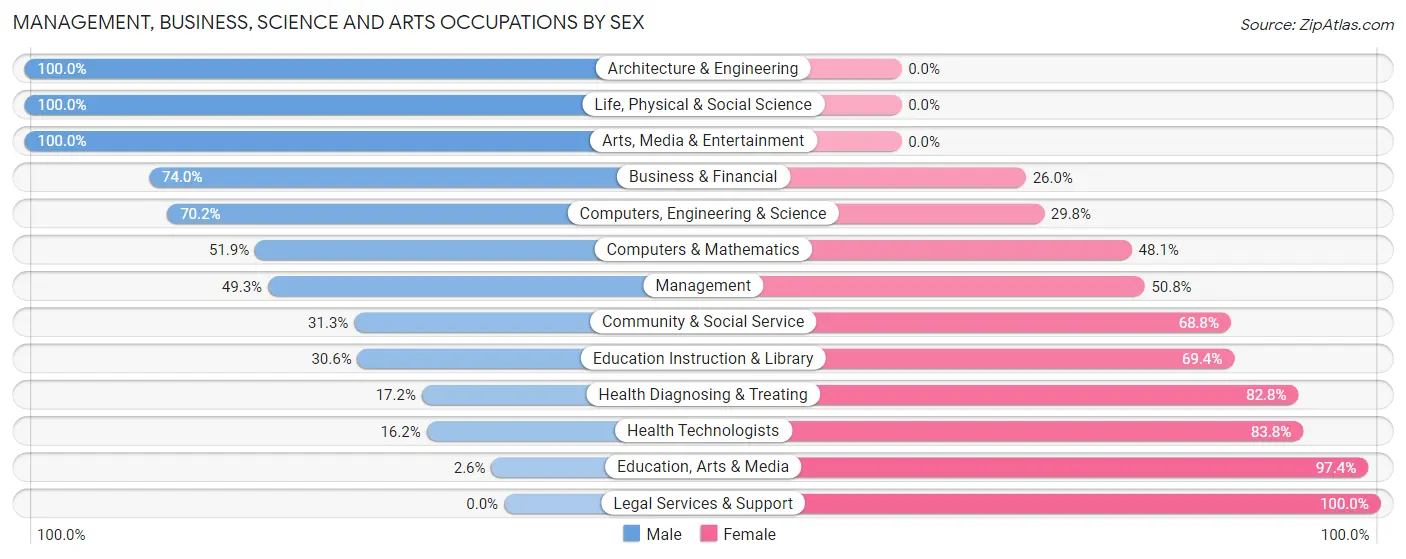
Management, Business, Science and Arts Occupations by Sex
Within the Management, Business, Science and Arts occupations in Cheviot, the most male-oriented occupations are Architecture & Engineering (100.0%), Life, Physical & Social Science (100.0%), and Arts, Media & Entertainment (100.0%), while the most female-oriented occupations are Legal Services & Support (100.0%), Education, Arts & Media (97.4%), and Health Technologists (83.8%).
| Occupation | Male | Female |
| Management | 230 (49.2%) | 237 (50.7%) |
| Business & Financial | 151 (74.0%) | 53 (26.0%) |
| Computers, Engineering & Science | 118 (70.2%) | 50 (29.8%) |
| Computers & Mathematics | 54 (51.9%) | 50 (48.1%) |
| Architecture & Engineering | 41 (100.0%) | 0 (0.0%) |
| Life, Physical & Social Science | 23 (100.0%) | 0 (0.0%) |
| Community & Social Service | 45 (31.2%) | 99 (68.8%) |
| Education, Arts & Media | 1 (2.6%) | 37 (97.4%) |
| Legal Services & Support | 0 (0.0%) | 12 (100.0%) |
| Education Instruction & Library | 22 (30.6%) | 50 (69.4%) |
| Arts, Media & Entertainment | 22 (100.0%) | 0 (0.0%) |
| Health Diagnosing & Treating | 98 (17.2%) | 473 (82.8%) |
| Health Technologists | 49 (16.2%) | 254 (83.8%) |
| Total (Category) | 642 (41.3%) | 912 (58.7%) |
| Total (Overall) | 2,128 (49.1%) | 2,203 (50.9%) |
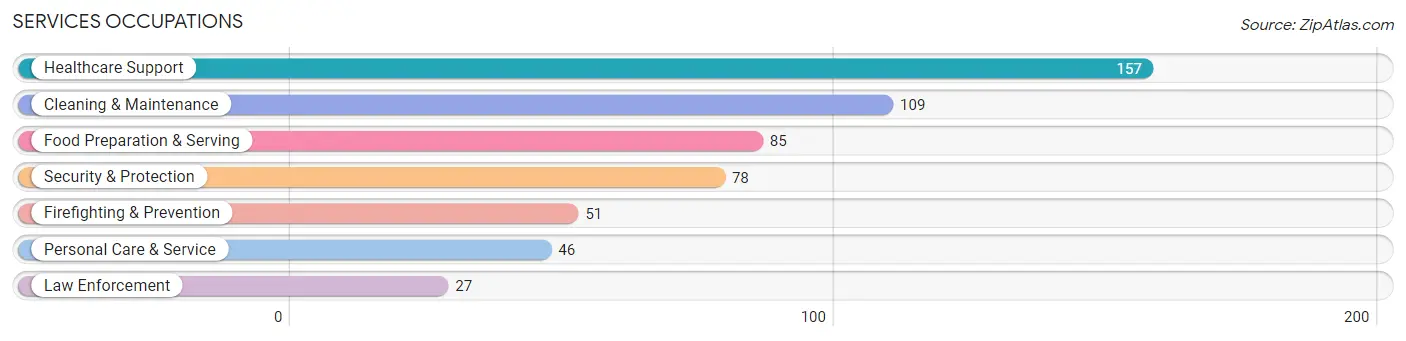
Services Occupations
The most common Services occupations in Cheviot are Healthcare Support (157 | 3.6%), Cleaning & Maintenance (109 | 2.5%), Food Preparation & Serving (85 | 2.0%), Security & Protection (78 | 1.8%), and Firefighting & Prevention (51 | 1.2%).
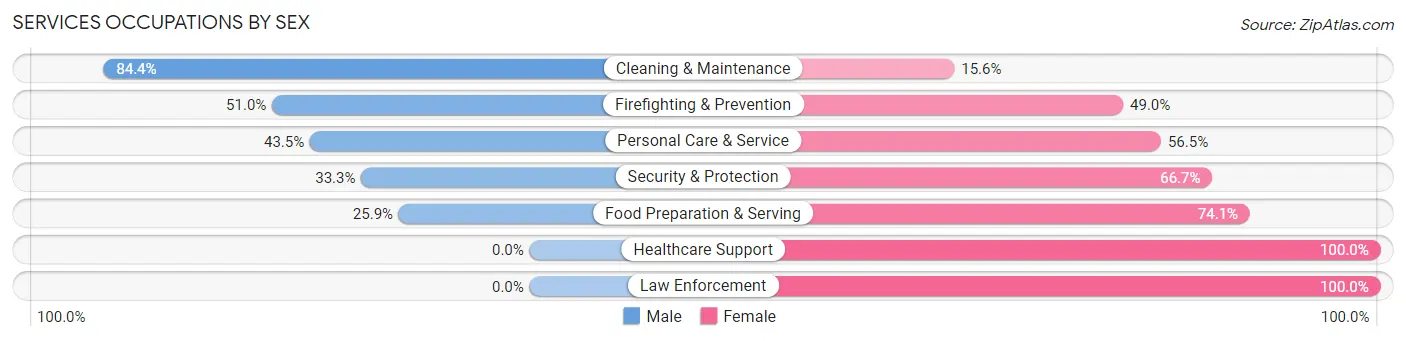
Services Occupations by Sex
Within the Services occupations in Cheviot, the most male-oriented occupations are Cleaning & Maintenance (84.4%), Firefighting & Prevention (51.0%), and Personal Care & Service (43.5%), while the most female-oriented occupations are Healthcare Support (100.0%), Law Enforcement (100.0%), and Food Preparation & Serving (74.1%).
| Occupation | Male | Female |
| Healthcare Support | 0 (0.0%) | 157 (100.0%) |
| Security & Protection | 26 (33.3%) | 52 (66.7%) |
| Firefighting & Prevention | 26 (51.0%) | 25 (49.0%) |
| Law Enforcement | 0 (0.0%) | 27 (100.0%) |
| Food Preparation & Serving | 22 (25.9%) | 63 (74.1%) |
| Cleaning & Maintenance | 92 (84.4%) | 17 (15.6%) |
| Personal Care & Service | 20 (43.5%) | 26 (56.5%) |
| Total (Category) | 160 (33.7%) | 315 (66.3%) |
| Total (Overall) | 2,128 (49.1%) | 2,203 (50.9%) |
Sales and Office Occupations
The most common Sales and Office occupations in Cheviot are Sales & Related (694 | 16.0%), and Office & Administration (663 | 15.3%).
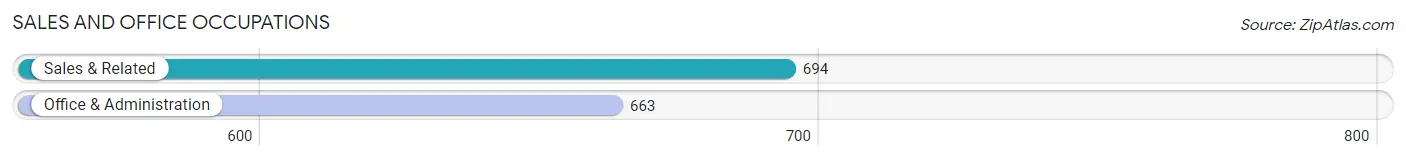
Sales and Office Occupations by Sex
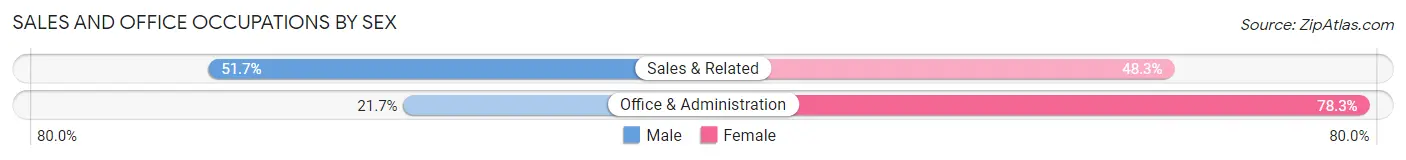
| Occupation | Male | Female |
| Sales & Related | 359 (51.7%) | 335 (48.3%) |
| Office & Administration | 144 (21.7%) | 519 (78.3%) |
| Total (Category) | 503 (37.1%) | 854 (62.9%) |
| Total (Overall) | 2,128 (49.1%) | 2,203 (50.9%) |
Natural Resources, Construction and Maintenance Occupations
The most common Natural Resources, Construction and Maintenance occupations in Cheviot are Construction & Extraction (246 | 5.7%), and Installation, Maintenance & Repair (191 | 4.4%).
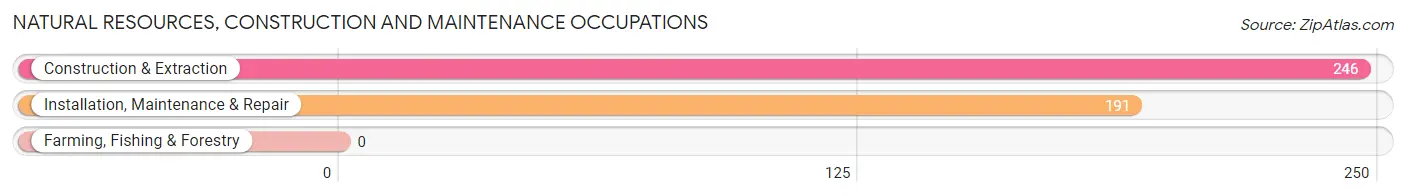
Natural Resources, Construction and Maintenance Occupations by Sex
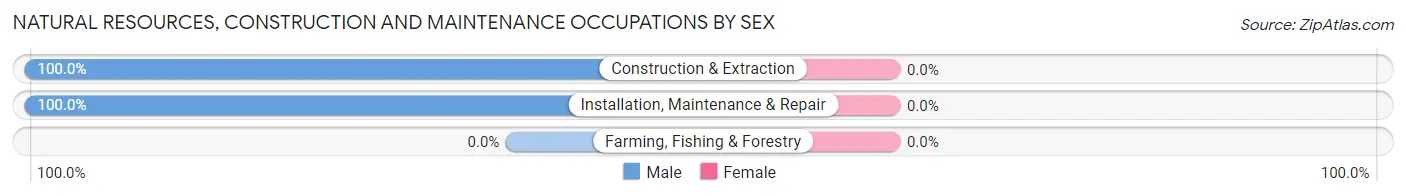
| Occupation | Male | Female |
| Farming, Fishing & Forestry | 0 (0.0%) | 0 (0.0%) |
| Construction & Extraction | 246 (100.0%) | 0 (0.0%) |
| Installation, Maintenance & Repair | 191 (100.0%) | 0 (0.0%) |
| Total (Category) | 437 (100.0%) | 0 (0.0%) |
| Total (Overall) | 2,128 (49.1%) | 2,203 (50.9%) |
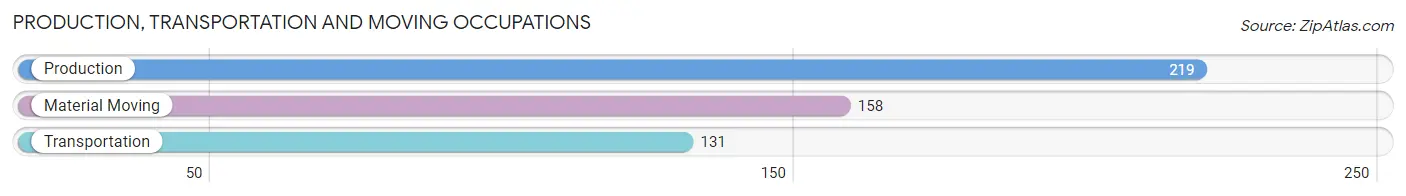
Production, Transportation and Moving Occupations
The most common Production, Transportation and Moving occupations in Cheviot are Production (219 | 5.1%), Material Moving (158 | 3.6%), and Transportation (131 | 3.0%).
Production, Transportation and Moving Occupations by Sex
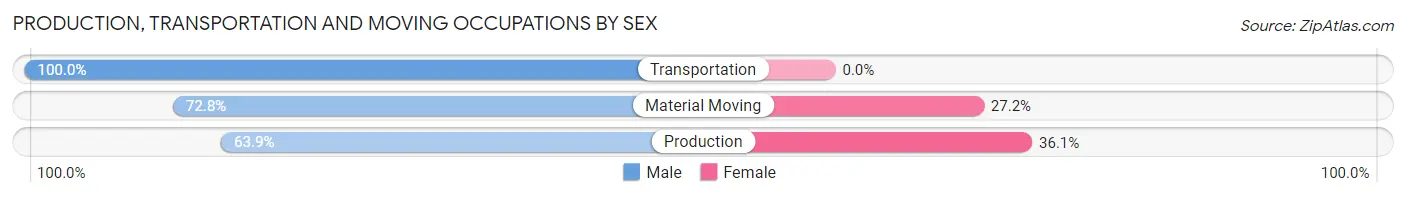
| Occupation | Male | Female |
| Production | 140 (63.9%) | 79 (36.1%) |
| Transportation | 131 (100.0%) | 0 (0.0%) |
| Material Moving | 115 (72.8%) | 43 (27.2%) |
| Total (Category) | 386 (76.0%) | 122 (24.0%) |
| Total (Overall) | 2,128 (49.1%) | 2,203 (50.9%) |
Employment Industries by Sex in Cheviot
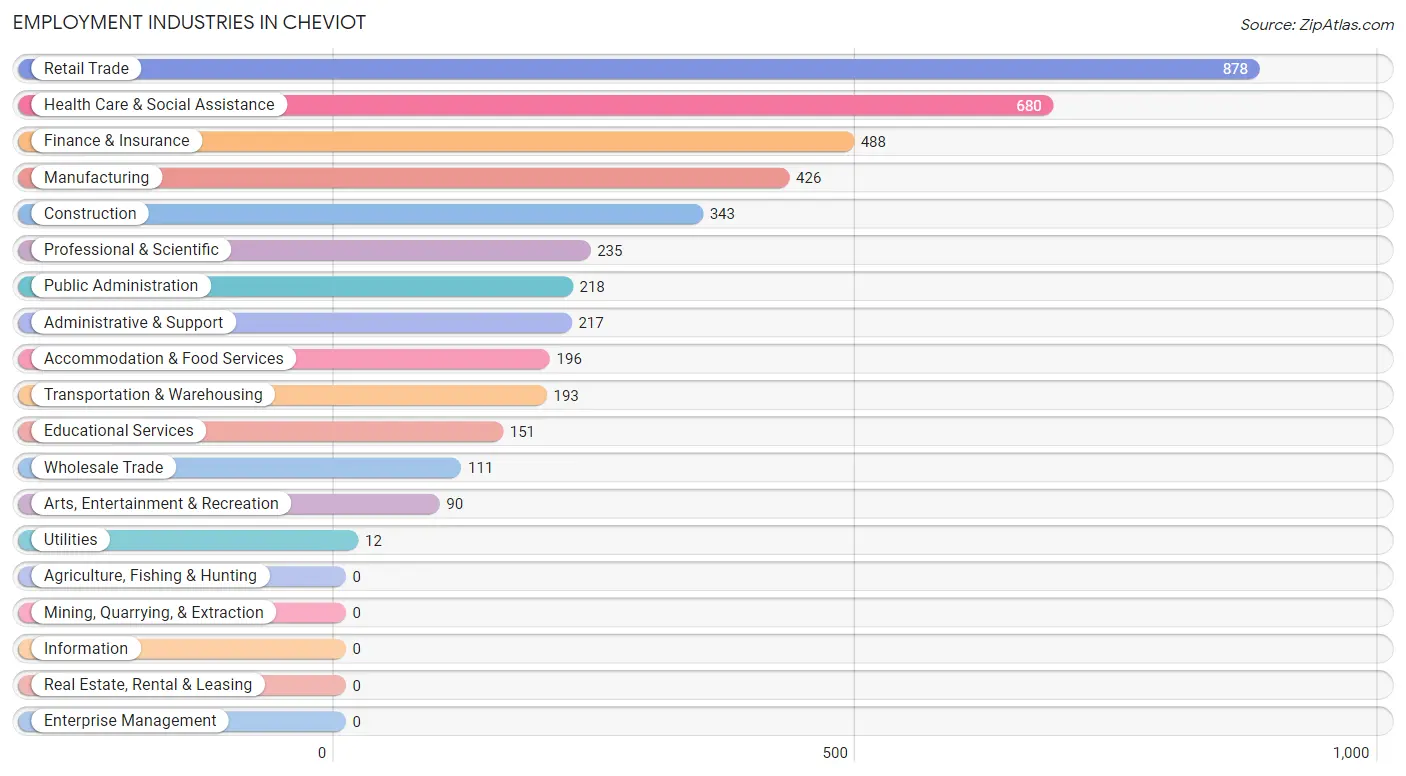
Employment Industries in Cheviot
The major employment industries in Cheviot include Retail Trade (878 | 20.3%), Health Care & Social Assistance (680 | 15.7%), Finance & Insurance (488 | 11.3%), Manufacturing (426 | 9.8%), and Construction (343 | 7.9%).
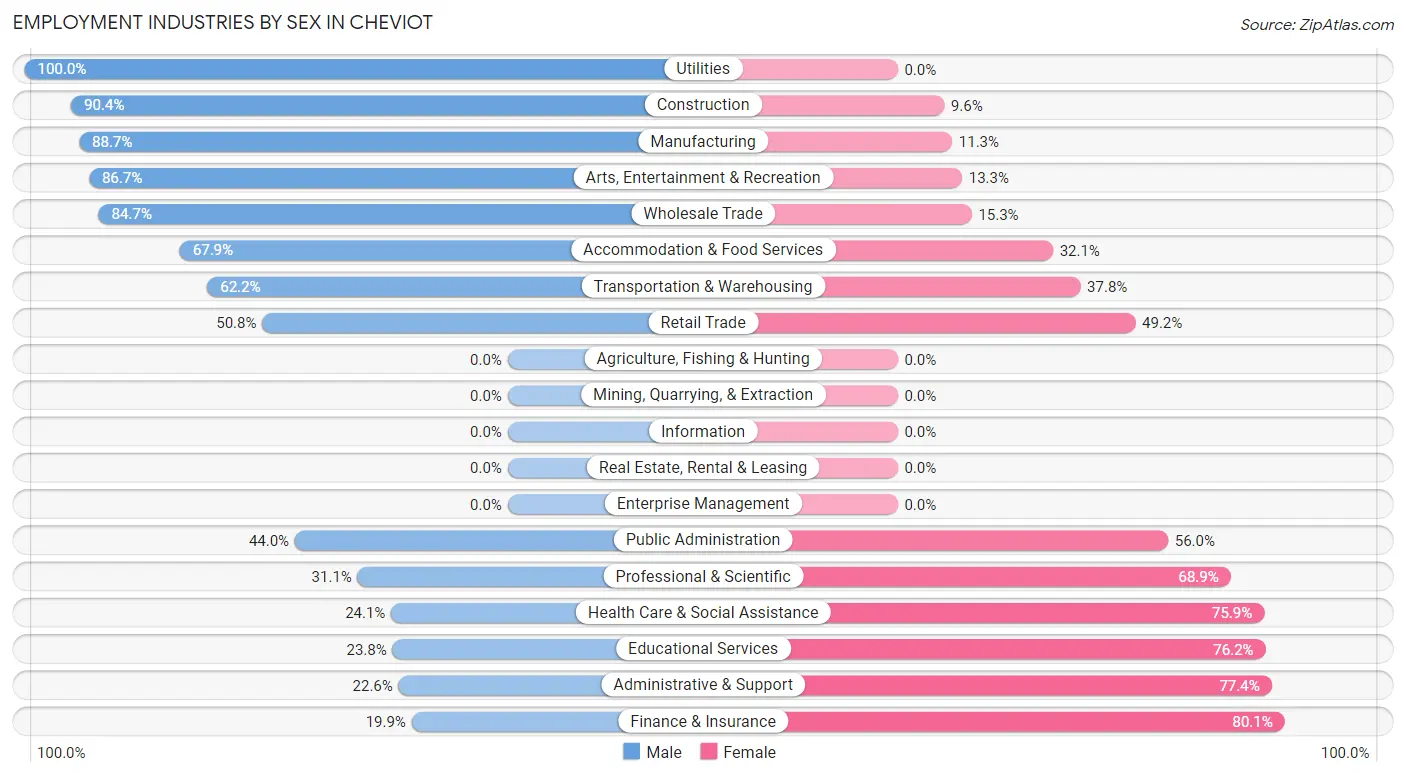
Employment Industries by Sex in Cheviot
The Cheviot industries that see more men than women are Utilities (100.0%), Construction (90.4%), and Manufacturing (88.7%), whereas the industries that tend to have a higher number of women are Finance & Insurance (80.1%), Administrative & Support (77.4%), and Educational Services (76.2%).
| Industry | Male | Female |
| Agriculture, Fishing & Hunting | 0 (0.0%) | 0 (0.0%) |
| Mining, Quarrying, & Extraction | 0 (0.0%) | 0 (0.0%) |
| Construction | 310 (90.4%) | 33 (9.6%) |
| Manufacturing | 378 (88.7%) | 48 (11.3%) |
| Wholesale Trade | 94 (84.7%) | 17 (15.3%) |
| Retail Trade | 446 (50.8%) | 432 (49.2%) |
| Transportation & Warehousing | 120 (62.2%) | 73 (37.8%) |
| Utilities | 12 (100.0%) | 0 (0.0%) |
| Information | 0 (0.0%) | 0 (0.0%) |
| Finance & Insurance | 97 (19.9%) | 391 (80.1%) |
| Real Estate, Rental & Leasing | 0 (0.0%) | 0 (0.0%) |
| Professional & Scientific | 73 (31.1%) | 162 (68.9%) |
| Enterprise Management | 0 (0.0%) | 0 (0.0%) |
| Administrative & Support | 49 (22.6%) | 168 (77.4%) |
| Educational Services | 36 (23.8%) | 115 (76.2%) |
| Health Care & Social Assistance | 164 (24.1%) | 516 (75.9%) |
| Arts, Entertainment & Recreation | 78 (86.7%) | 12 (13.3%) |
| Accommodation & Food Services | 133 (67.9%) | 63 (32.1%) |
| Public Administration | 96 (44.0%) | 122 (56.0%) |
| Total | 2,128 (49.1%) | 2,203 (50.9%) |
Education in Cheviot
School Enrollment in Cheviot
The most common levels of schooling among the 2,266 students in Cheviot are middle school (857 | 37.8%), high school (500 | 22.1%), and elementary school (349 | 15.4%).
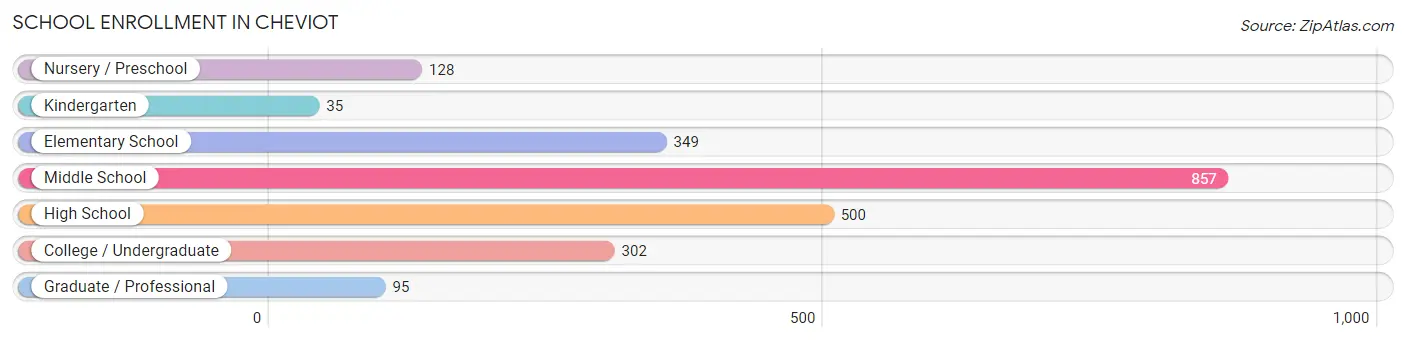
| School Level | # Students | % Students |
| Nursery / Preschool | 128 | 5.7% |
| Kindergarten | 35 | 1.5% |
| Elementary School | 349 | 15.4% |
| Middle School | 857 | 37.8% |
| High School | 500 | 22.1% |
| College / Undergraduate | 302 | 13.3% |
| Graduate / Professional | 95 | 4.2% |
| Total | 2,266 | 100.0% |
School Enrollment by Age by Funding Source in Cheviot
Out of a total of 2,266 students who are enrolled in schools in Cheviot, 616 (27.2%) attend a private institution, while the remaining 1,650 (72.8%) are enrolled in public schools. The age group of 5 to 9 year old has the highest likelihood of being enrolled in private schools, with 217 (49.5% in the age bracket) enrolled. Conversely, the age group of 25 to 34 year olds has the lowest likelihood of being enrolled in a private school, with 84 (100.0% in the age bracket) attending a public institution.
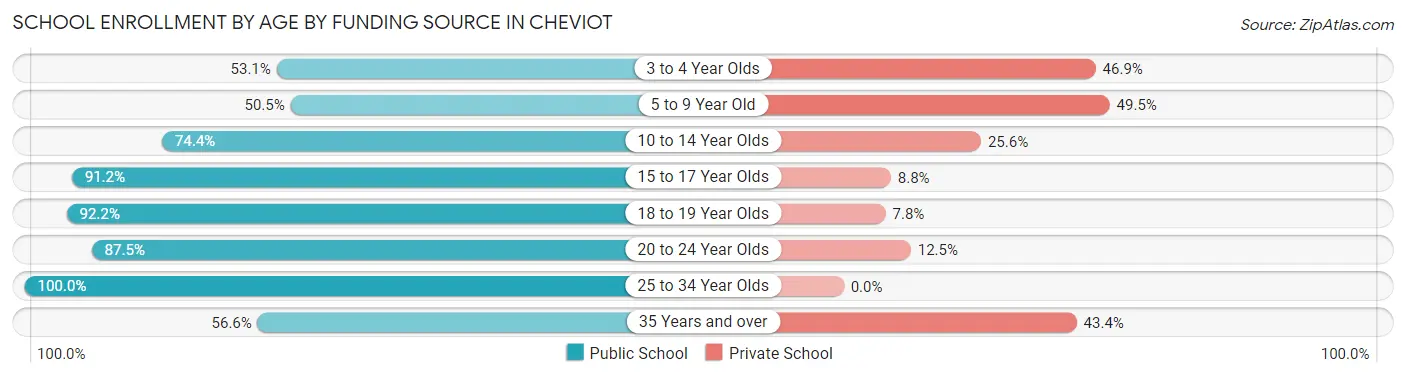
| Age Bracket | Public School | Private School |
| 3 to 4 Year Olds | 26 (53.1%) | 23 (46.9%) |
| 5 to 9 Year Old | 221 (50.5%) | 217 (49.5%) |
| 10 to 14 Year Olds | 672 (74.4%) | 231 (25.6%) |
| 15 to 17 Year Olds | 332 (91.2%) | 32 (8.8%) |
| 18 to 19 Year Olds | 118 (92.2%) | 10 (7.8%) |
| 20 to 24 Year Olds | 77 (87.5%) | 11 (12.5%) |
| 25 to 34 Year Olds | 84 (100.0%) | 0 (0.0%) |
| 35 Years and over | 120 (56.6%) | 92 (43.4%) |
| Total | 1,650 (72.8%) | 616 (27.2%) |
Educational Attainment by Field of Study in Cheviot
Business (269 | 21.3%), science & technology (217 | 17.2%), education (141 | 11.2%), arts & humanities (120 | 9.5%), and computers & mathematics (93 | 7.4%) are the most common fields of study among 1,263 individuals in Cheviot who have obtained a bachelor's degree or higher.
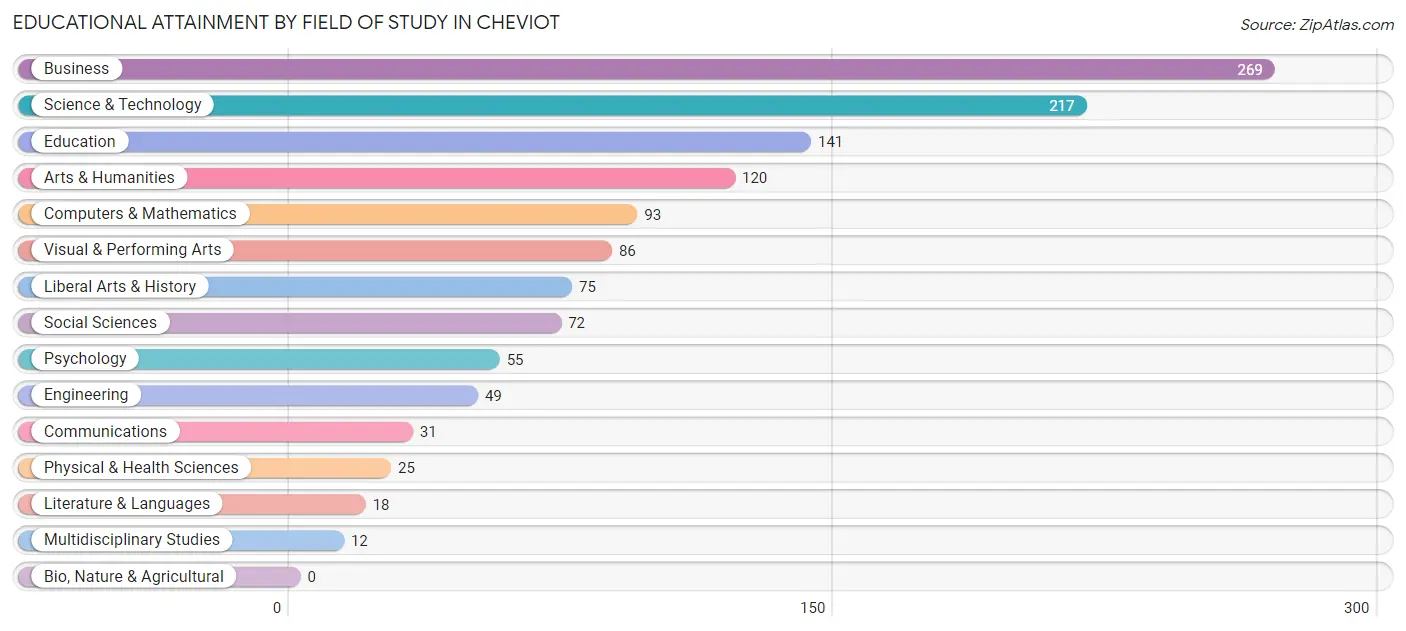
| Field of Study | # Graduates | % Graduates |
| Computers & Mathematics | 93 | 7.4% |
| Bio, Nature & Agricultural | 0 | 0.0% |
| Physical & Health Sciences | 25 | 2.0% |
| Psychology | 55 | 4.3% |
| Social Sciences | 72 | 5.7% |
| Engineering | 49 | 3.9% |
| Multidisciplinary Studies | 12 | 0.9% |
| Science & Technology | 217 | 17.2% |
| Business | 269 | 21.3% |
| Education | 141 | 11.2% |
| Literature & Languages | 18 | 1.4% |
| Liberal Arts & History | 75 | 5.9% |
| Visual & Performing Arts | 86 | 6.8% |
| Communications | 31 | 2.5% |
| Arts & Humanities | 120 | 9.5% |
| Total | 1,263 | 100.0% |
Transportation & Commute in Cheviot
Vehicle Availability by Sex in Cheviot
The most prevalent vehicle ownership categories in Cheviot are males with 2 vehicles (905, accounting for 43.9%) and females with 2 vehicles (958, making up 41.7%).
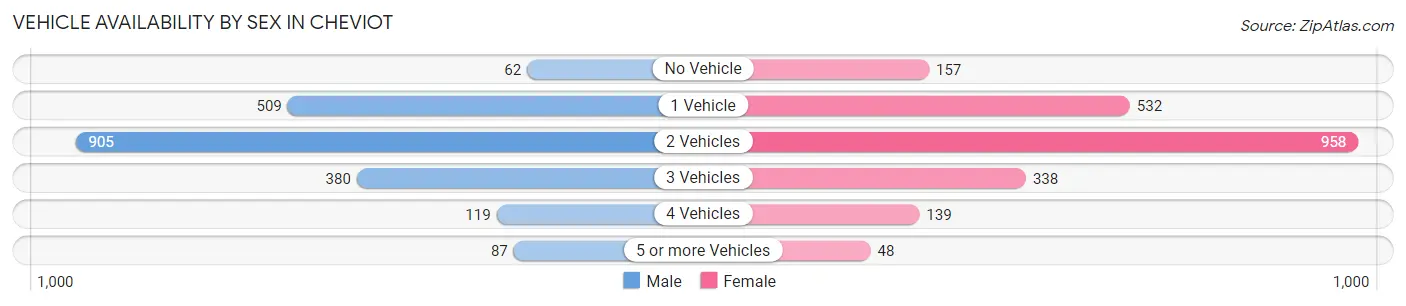
| Vehicles Available | Male | Female |
| No Vehicle | 62 (3.0%) | 157 (7.2%) |
| 1 Vehicle | 509 (24.7%) | 532 (24.5%) |
| 2 Vehicles | 905 (43.9%) | 958 (44.1%) |
| 3 Vehicles | 380 (18.4%) | 338 (15.6%) |
| 4 Vehicles | 119 (5.8%) | 139 (6.4%) |
| 5 or more Vehicles | 87 (4.2%) | 48 (2.2%) |
| Total | 2,062 (100.0%) | 2,172 (100.0%) |
Commute Time in Cheviot
The most frequently occuring commute durations in Cheviot are 30 to 34 minutes (749 commuters, 20.1%), 20 to 24 minutes (656 commuters, 17.6%), and 15 to 19 minutes (531 commuters, 14.3%).
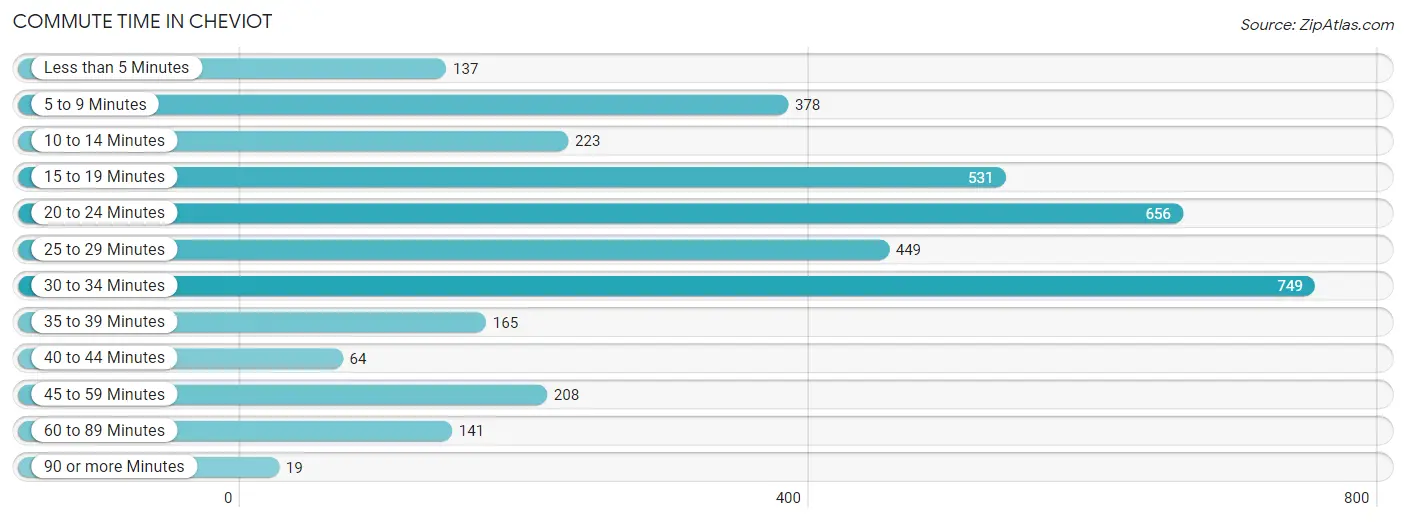
| Commute Time | # Commuters | % Commuters |
| Less than 5 Minutes | 137 | 3.7% |
| 5 to 9 Minutes | 378 | 10.2% |
| 10 to 14 Minutes | 223 | 6.0% |
| 15 to 19 Minutes | 531 | 14.3% |
| 20 to 24 Minutes | 656 | 17.6% |
| 25 to 29 Minutes | 449 | 12.1% |
| 30 to 34 Minutes | 749 | 20.1% |
| 35 to 39 Minutes | 165 | 4.4% |
| 40 to 44 Minutes | 64 | 1.7% |
| 45 to 59 Minutes | 208 | 5.6% |
| 60 to 89 Minutes | 141 | 3.8% |
| 90 or more Minutes | 19 | 0.5% |
Commute Time by Sex in Cheviot
The most common commute times in Cheviot are 30 to 34 minutes (498 commuters, 25.7%) for males and 20 to 24 minutes (392 commuters, 22.0%) for females.
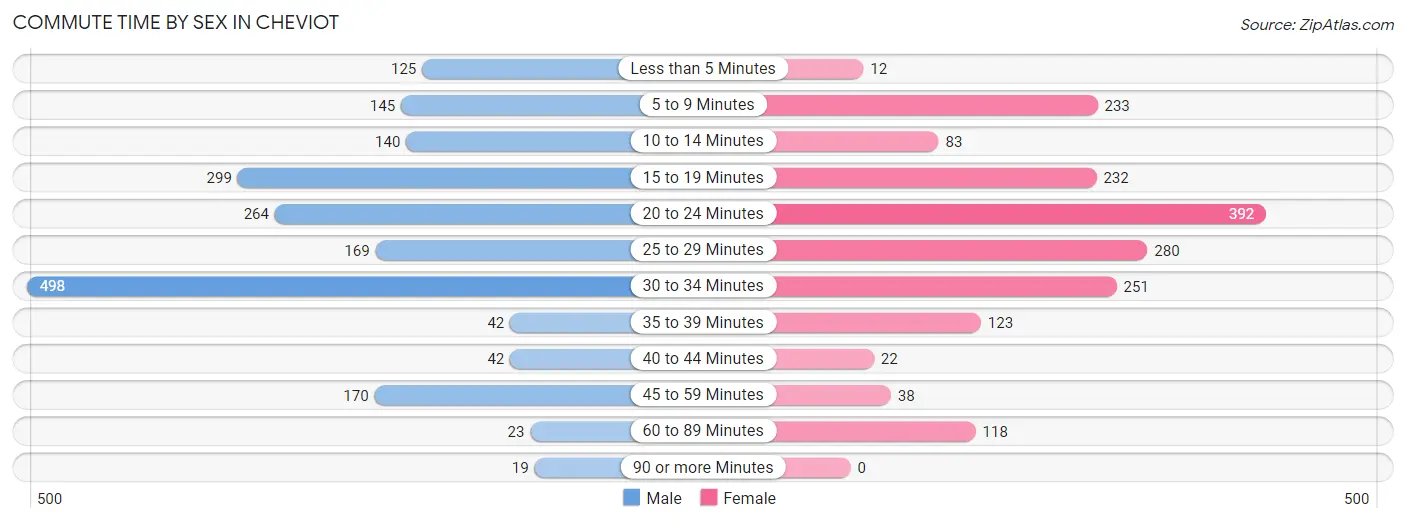
| Commute Time | Male | Female |
| Less than 5 Minutes | 125 (6.5%) | 12 (0.7%) |
| 5 to 9 Minutes | 145 (7.5%) | 233 (13.1%) |
| 10 to 14 Minutes | 140 (7.2%) | 83 (4.6%) |
| 15 to 19 Minutes | 299 (15.4%) | 232 (13.0%) |
| 20 to 24 Minutes | 264 (13.6%) | 392 (22.0%) |
| 25 to 29 Minutes | 169 (8.7%) | 280 (15.7%) |
| 30 to 34 Minutes | 498 (25.7%) | 251 (14.1%) |
| 35 to 39 Minutes | 42 (2.2%) | 123 (6.9%) |
| 40 to 44 Minutes | 42 (2.2%) | 22 (1.2%) |
| 45 to 59 Minutes | 170 (8.8%) | 38 (2.1%) |
| 60 to 89 Minutes | 23 (1.2%) | 118 (6.6%) |
| 90 or more Minutes | 19 (1.0%) | 0 (0.0%) |
Time of Departure to Work by Sex in Cheviot
The most frequent times of departure to work in Cheviot are 6:30 AM to 6:59 AM (264, 13.6%) for males and 7:00 AM to 7:29 AM (428, 24.0%) for females.
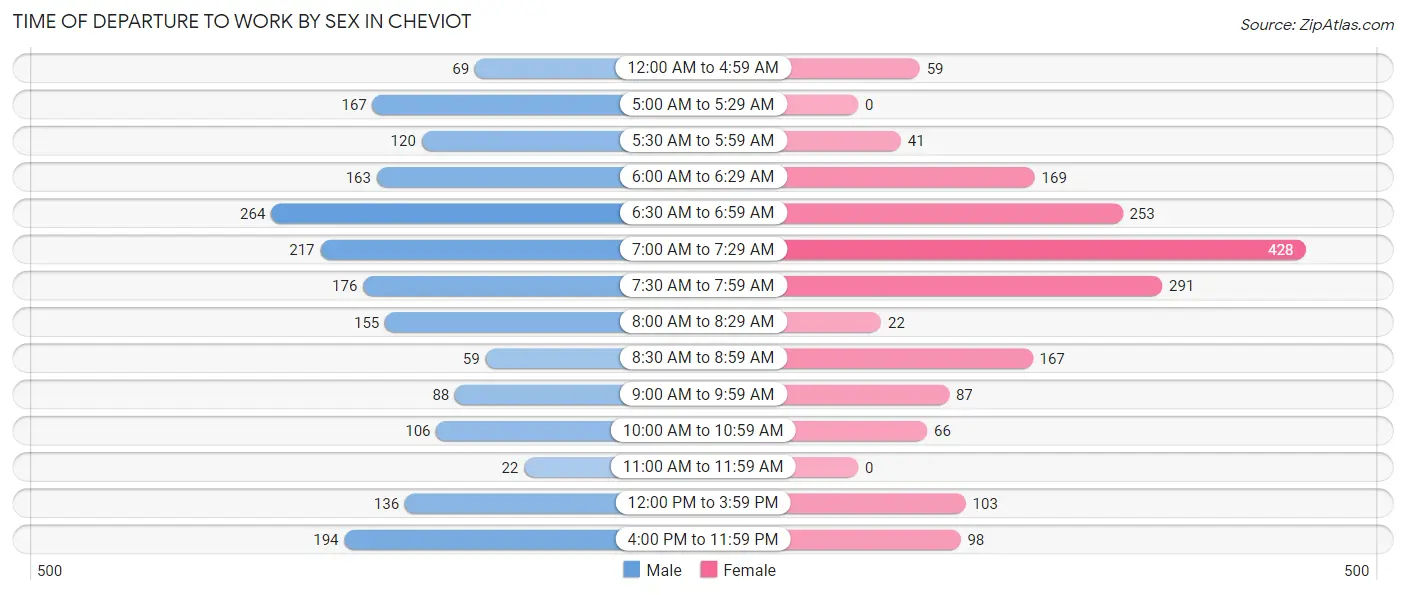
| Time of Departure | Male | Female |
| 12:00 AM to 4:59 AM | 69 (3.6%) | 59 (3.3%) |
| 5:00 AM to 5:29 AM | 167 (8.6%) | 0 (0.0%) |
| 5:30 AM to 5:59 AM | 120 (6.2%) | 41 (2.3%) |
| 6:00 AM to 6:29 AM | 163 (8.4%) | 169 (9.5%) |
| 6:30 AM to 6:59 AM | 264 (13.6%) | 253 (14.2%) |
| 7:00 AM to 7:29 AM | 217 (11.2%) | 428 (24.0%) |
| 7:30 AM to 7:59 AM | 176 (9.1%) | 291 (16.3%) |
| 8:00 AM to 8:29 AM | 155 (8.0%) | 22 (1.2%) |
| 8:30 AM to 8:59 AM | 59 (3.0%) | 167 (9.4%) |
| 9:00 AM to 9:59 AM | 88 (4.5%) | 87 (4.9%) |
| 10:00 AM to 10:59 AM | 106 (5.5%) | 66 (3.7%) |
| 11:00 AM to 11:59 AM | 22 (1.1%) | 0 (0.0%) |
| 12:00 PM to 3:59 PM | 136 (7.0%) | 103 (5.8%) |
| 4:00 PM to 11:59 PM | 194 (10.0%) | 98 (5.5%) |
| Total | 1,936 (100.0%) | 1,784 (100.0%) |
Housing Occupancy in Cheviot
Occupancy by Ownership in Cheviot
Of the total 3,517 dwellings in Cheviot, owner-occupied units account for 1,869 (53.1%), while renter-occupied units make up 1,648 (46.9%).
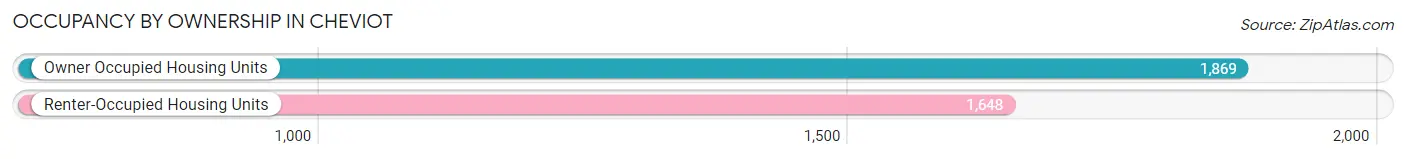
| Occupancy | # Housing Units | % Housing Units |
| Owner Occupied Housing Units | 1,869 | 53.1% |
| Renter-Occupied Housing Units | 1,648 | 46.9% |
| Total Occupied Housing Units | 3,517 | 100.0% |
Occupancy by Household Size in Cheviot
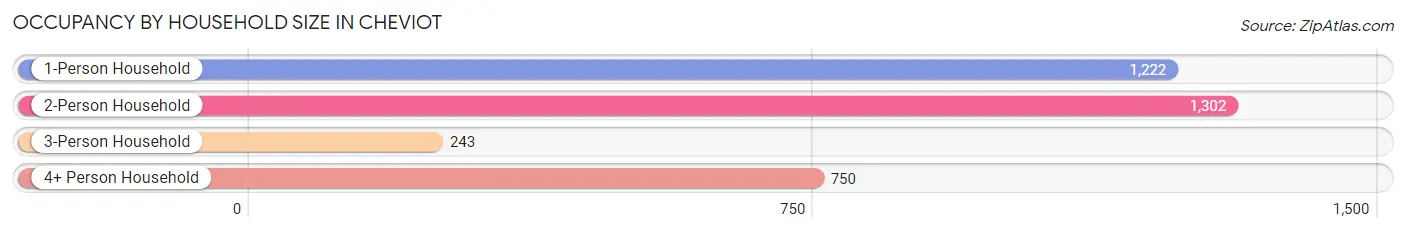
| Household Size | # Housing Units | % Housing Units |
| 1-Person Household | 1,222 | 34.7% |
| 2-Person Household | 1,302 | 37.0% |
| 3-Person Household | 243 | 6.9% |
| 4+ Person Household | 750 | 21.3% |
| Total Housing Units | 3,517 | 100.0% |
Occupancy by Ownership by Household Size in Cheviot
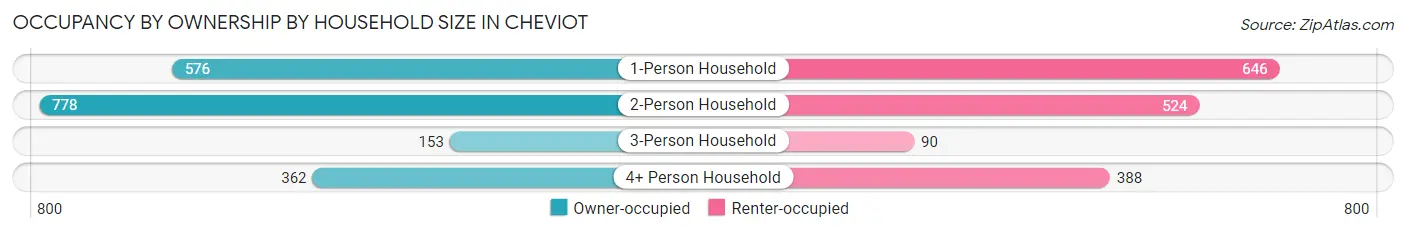
| Household Size | Owner-occupied | Renter-occupied |
| 1-Person Household | 576 (47.1%) | 646 (52.9%) |
| 2-Person Household | 778 (59.8%) | 524 (40.3%) |
| 3-Person Household | 153 (63.0%) | 90 (37.0%) |
| 4+ Person Household | 362 (48.3%) | 388 (51.7%) |
| Total Housing Units | 1,869 (53.1%) | 1,648 (46.9%) |
Occupancy by Educational Attainment in Cheviot
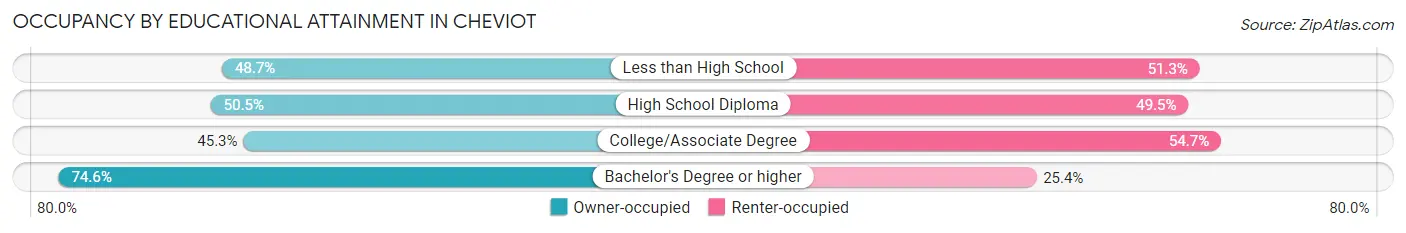
| Household Size | Owner-occupied | Renter-occupied |
| Less than High School | 93 (48.7%) | 98 (51.3%) |
| High School Diploma | 564 (50.5%) | 553 (49.5%) |
| College/Associate Degree | 674 (45.3%) | 814 (54.7%) |
| Bachelor's Degree or higher | 538 (74.6%) | 183 (25.4%) |
Occupancy by Age of Householder in Cheviot
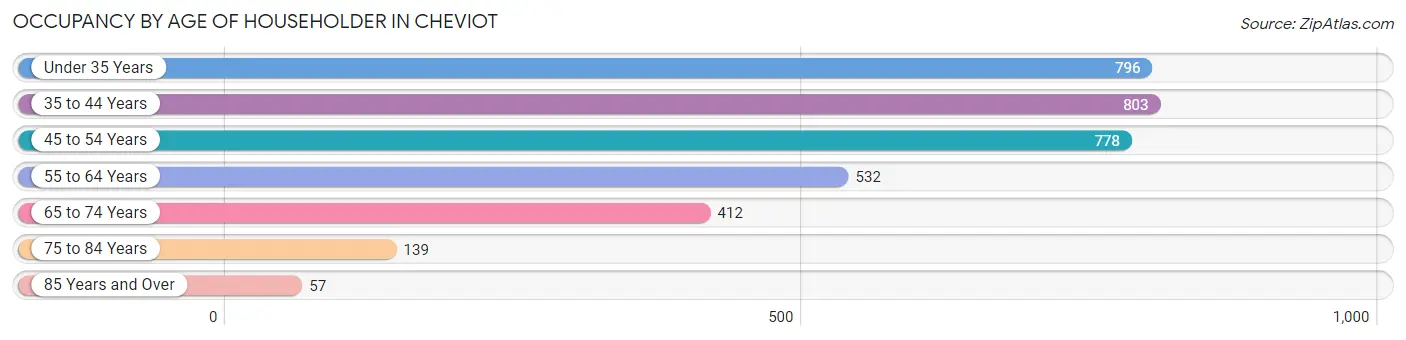
| Age Bracket | # Households | % Households |
| Under 35 Years | 796 | 22.6% |
| 35 to 44 Years | 803 | 22.8% |
| 45 to 54 Years | 778 | 22.1% |
| 55 to 64 Years | 532 | 15.1% |
| 65 to 74 Years | 412 | 11.7% |
| 75 to 84 Years | 139 | 4.0% |
| 85 Years and Over | 57 | 1.6% |
| Total | 3,517 | 100.0% |
Housing Finances in Cheviot
Median Income by Occupancy in Cheviot
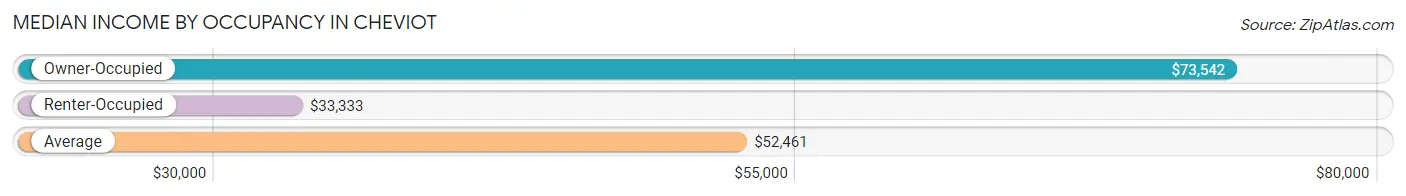
| Occupancy Type | # Households | Median Income |
| Owner-Occupied | 1,869 (53.1%) | $73,542 |
| Renter-Occupied | 1,648 (46.9%) | $33,333 |
| Average | 3,517 (100.0%) | $52,461 |
Occupancy by Householder Income Bracket in Cheviot
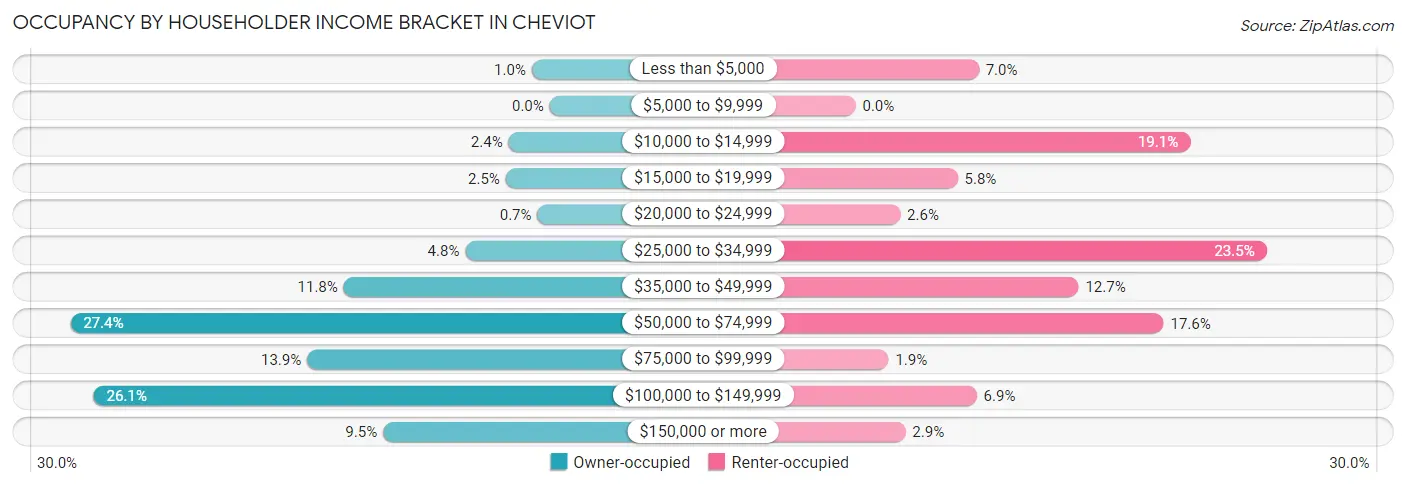
| Income Bracket | Owner-occupied | Renter-occupied |
| Less than $5,000 | 19 (1.0%) | 116 (7.0%) |
| $5,000 to $9,999 | 0 (0.0%) | 0 (0.0%) |
| $10,000 to $14,999 | 44 (2.4%) | 315 (19.1%) |
| $15,000 to $19,999 | 47 (2.5%) | 96 (5.8%) |
| $20,000 to $24,999 | 13 (0.7%) | 42 (2.5%) |
| $25,000 to $34,999 | 90 (4.8%) | 387 (23.5%) |
| $35,000 to $49,999 | 220 (11.8%) | 210 (12.7%) |
| $50,000 to $74,999 | 512 (27.4%) | 290 (17.6%) |
| $75,000 to $99,999 | 259 (13.9%) | 31 (1.9%) |
| $100,000 to $149,999 | 487 (26.1%) | 114 (6.9%) |
| $150,000 or more | 178 (9.5%) | 47 (2.9%) |
| Total | 1,869 (100.0%) | 1,648 (100.0%) |
Monthly Housing Cost Tiers in Cheviot
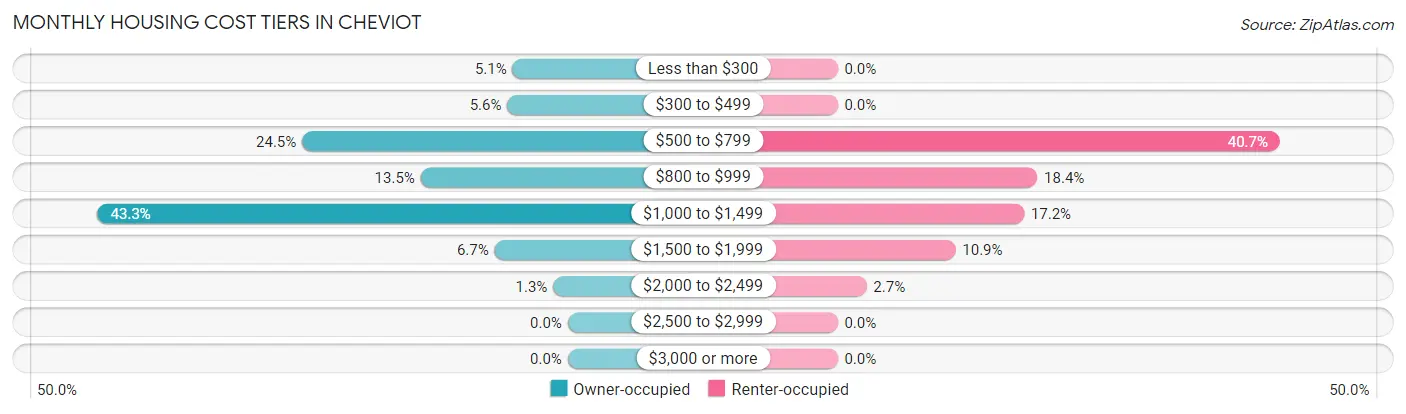
| Monthly Cost | Owner-occupied | Renter-occupied |
| Less than $300 | 95 (5.1%) | 0 (0.0%) |
| $300 to $499 | 104 (5.6%) | 0 (0.0%) |
| $500 to $799 | 457 (24.4%) | 671 (40.7%) |
| $800 to $999 | 253 (13.5%) | 303 (18.4%) |
| $1,000 to $1,499 | 809 (43.3%) | 283 (17.2%) |
| $1,500 to $1,999 | 126 (6.7%) | 179 (10.9%) |
| $2,000 to $2,499 | 25 (1.3%) | 44 (2.7%) |
| $2,500 to $2,999 | 0 (0.0%) | 0 (0.0%) |
| $3,000 or more | 0 (0.0%) | 0 (0.0%) |
| Total | 1,869 (100.0%) | 1,648 (100.0%) |
Physical Housing Characteristics in Cheviot
Housing Structures in Cheviot
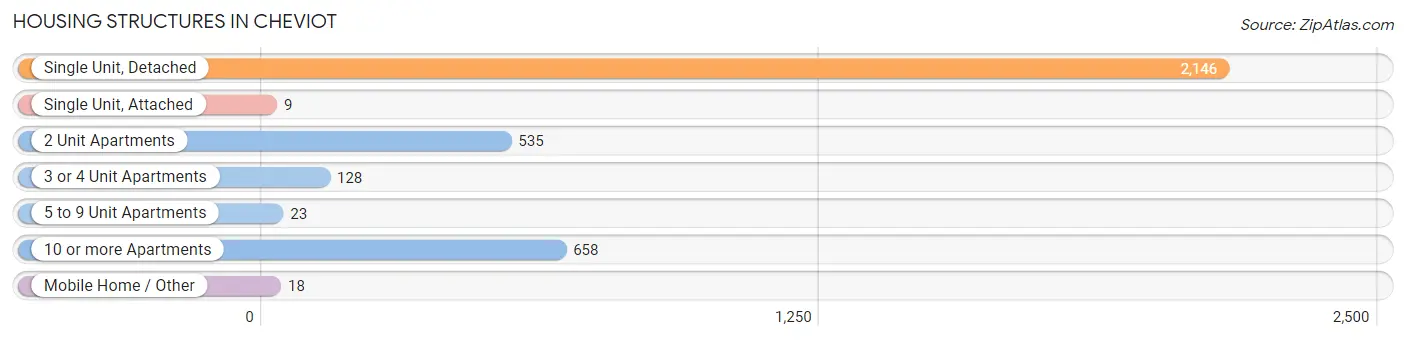
| Structure Type | # Housing Units | % Housing Units |
| Single Unit, Detached | 2,146 | 61.0% |
| Single Unit, Attached | 9 | 0.3% |
| 2 Unit Apartments | 535 | 15.2% |
| 3 or 4 Unit Apartments | 128 | 3.6% |
| 5 to 9 Unit Apartments | 23 | 0.6% |
| 10 or more Apartments | 658 | 18.7% |
| Mobile Home / Other | 18 | 0.5% |
| Total | 3,517 | 100.0% |
Housing Structures by Occupancy in Cheviot
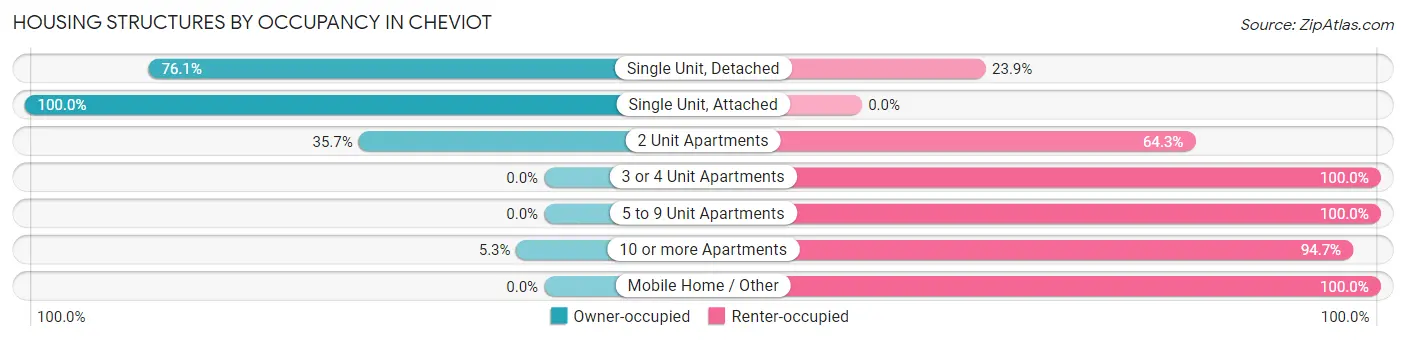
| Structure Type | Owner-occupied | Renter-occupied |
| Single Unit, Detached | 1,634 (76.1%) | 512 (23.9%) |
| Single Unit, Attached | 9 (100.0%) | 0 (0.0%) |
| 2 Unit Apartments | 191 (35.7%) | 344 (64.3%) |
| 3 or 4 Unit Apartments | 0 (0.0%) | 128 (100.0%) |
| 5 to 9 Unit Apartments | 0 (0.0%) | 23 (100.0%) |
| 10 or more Apartments | 35 (5.3%) | 623 (94.7%) |
| Mobile Home / Other | 0 (0.0%) | 18 (100.0%) |
| Total | 1,869 (53.1%) | 1,648 (46.9%) |
Housing Structures by Number of Rooms in Cheviot
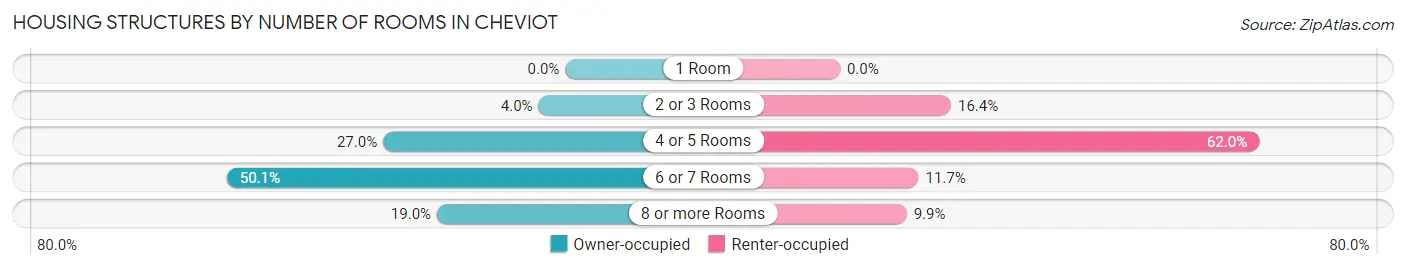
| Number of Rooms | Owner-occupied | Renter-occupied |
| 1 Room | 0 (0.0%) | 0 (0.0%) |
| 2 or 3 Rooms | 74 (4.0%) | 271 (16.4%) |
| 4 or 5 Rooms | 504 (27.0%) | 1,022 (62.0%) |
| 6 or 7 Rooms | 936 (50.1%) | 192 (11.7%) |
| 8 or more Rooms | 355 (19.0%) | 163 (9.9%) |
| Total | 1,869 (100.0%) | 1,648 (100.0%) |
Housing Structure by Heating Type in Cheviot
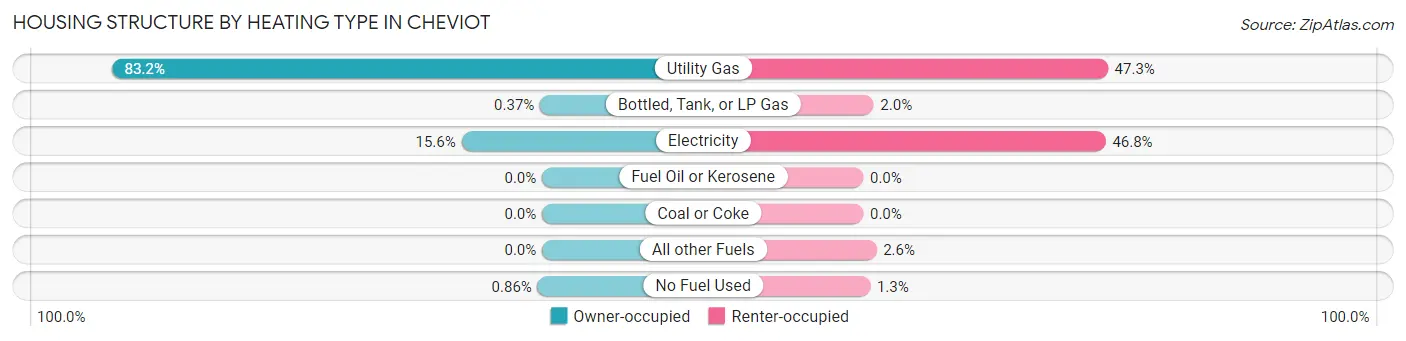
| Heating Type | Owner-occupied | Renter-occupied |
| Utility Gas | 1,555 (83.2%) | 779 (47.3%) |
| Bottled, Tank, or LP Gas | 7 (0.4%) | 33 (2.0%) |
| Electricity | 291 (15.6%) | 772 (46.8%) |
| Fuel Oil or Kerosene | 0 (0.0%) | 0 (0.0%) |
| Coal or Coke | 0 (0.0%) | 0 (0.0%) |
| All other Fuels | 0 (0.0%) | 42 (2.5%) |
| No Fuel Used | 16 (0.9%) | 22 (1.3%) |
| Total | 1,869 (100.0%) | 1,648 (100.0%) |
Household Vehicle Usage in Cheviot
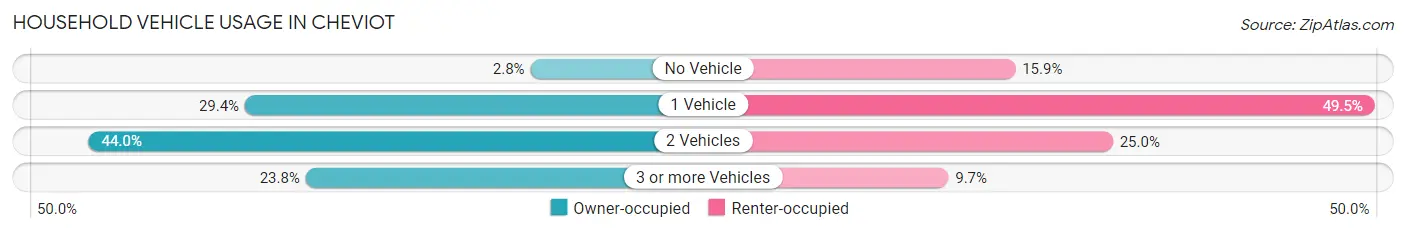
| Vehicles per Household | Owner-occupied | Renter-occupied |
| No Vehicle | 52 (2.8%) | 262 (15.9%) |
| 1 Vehicle | 550 (29.4%) | 815 (49.4%) |
| 2 Vehicles | 823 (44.0%) | 412 (25.0%) |
| 3 or more Vehicles | 444 (23.8%) | 159 (9.7%) |
| Total | 1,869 (100.0%) | 1,648 (100.0%) |
Real Estate & Mortgages in Cheviot
Real Estate and Mortgage Overview in Cheviot
| Characteristic | Without Mortgage | With Mortgage |
| Housing Units | 587 | 1,282 |
| Median Property Value | $103,300 | $129,500 |
| Median Household Income | $60,313 | $150 |
| Monthly Housing Costs | $560 | $0 |
| Real Estate Taxes | $2,196 | $0 |
Property Value by Mortgage Status in Cheviot
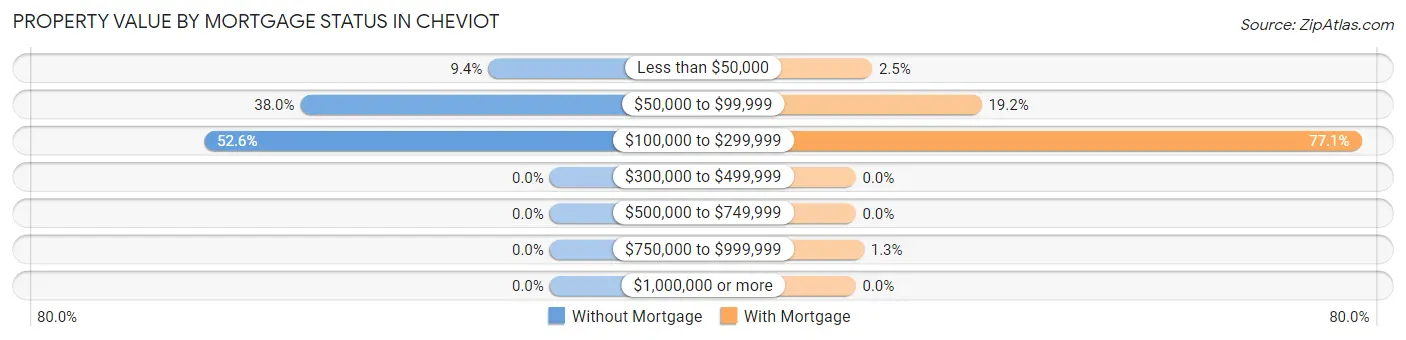
| Property Value | Without Mortgage | With Mortgage |
| Less than $50,000 | 55 (9.4%) | 32 (2.5%) |
| $50,000 to $99,999 | 223 (38.0%) | 246 (19.2%) |
| $100,000 to $299,999 | 309 (52.6%) | 988 (77.1%) |
| $300,000 to $499,999 | 0 (0.0%) | 0 (0.0%) |
| $500,000 to $749,999 | 0 (0.0%) | 0 (0.0%) |
| $750,000 to $999,999 | 0 (0.0%) | 16 (1.3%) |
| $1,000,000 or more | 0 (0.0%) | 0 (0.0%) |
| Total | 587 (100.0%) | 1,282 (100.0%) |
Household Income by Mortgage Status in Cheviot
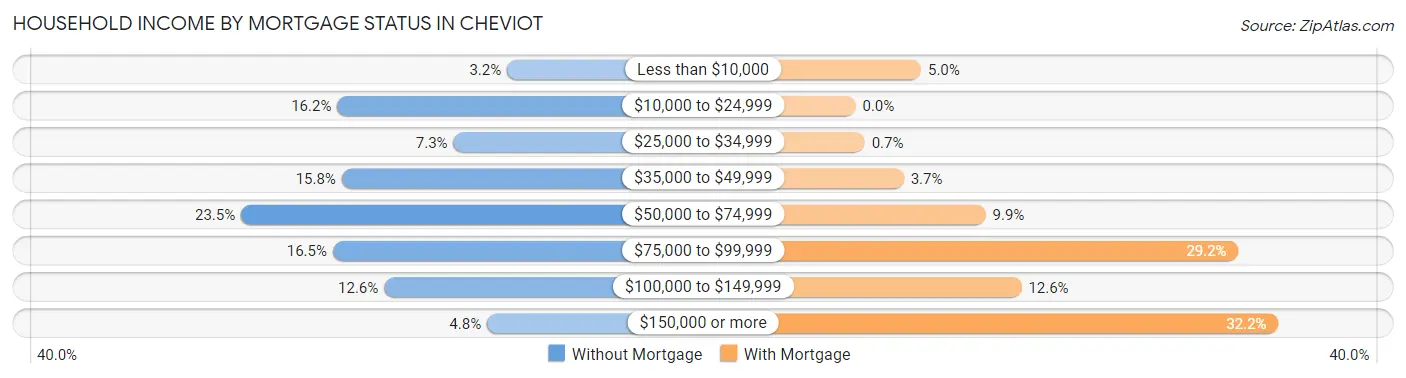
| Household Income | Without Mortgage | With Mortgage |
| Less than $10,000 | 19 (3.2%) | 64 (5.0%) |
| $10,000 to $24,999 | 95 (16.2%) | 0 (0.0%) |
| $25,000 to $34,999 | 43 (7.3%) | 9 (0.7%) |
| $35,000 to $49,999 | 93 (15.8%) | 47 (3.7%) |
| $50,000 to $74,999 | 138 (23.5%) | 127 (9.9%) |
| $75,000 to $99,999 | 97 (16.5%) | 374 (29.2%) |
| $100,000 to $149,999 | 74 (12.6%) | 162 (12.6%) |
| $150,000 or more | 28 (4.8%) | 413 (32.2%) |
| Total | 587 (100.0%) | 1,282 (100.0%) |
Property Value to Household Income Ratio in Cheviot
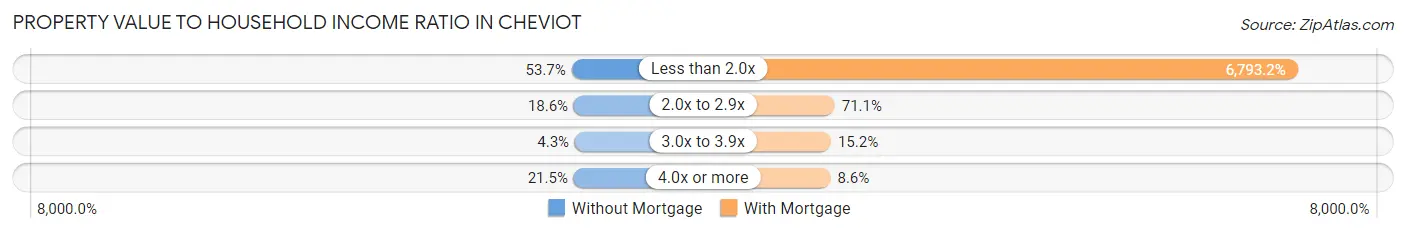
| Value-to-Income Ratio | Without Mortgage | With Mortgage |
| Less than 2.0x | 315 (53.7%) | 87,089 (6,793.2%) |
| 2.0x to 2.9x | 109 (18.6%) | 912 (71.1%) |
| 3.0x to 3.9x | 25 (4.3%) | 195 (15.2%) |
| 4.0x or more | 126 (21.5%) | 110 (8.6%) |
| Total | 587 (100.0%) | 1,282 (100.0%) |
Real Estate Taxes by Mortgage Status in Cheviot
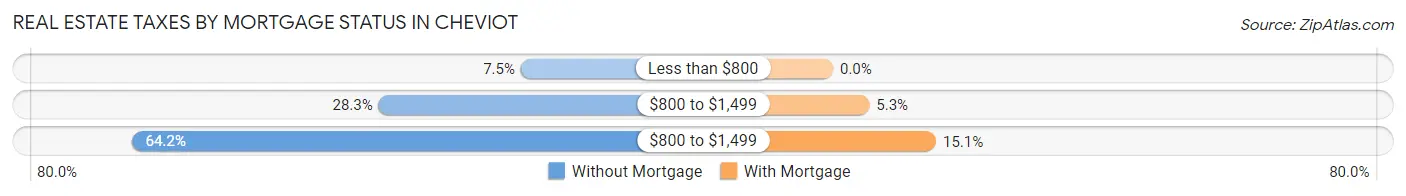
| Property Taxes | Without Mortgage | With Mortgage |
| Less than $800 | 44 (7.5%) | 0 (0.0%) |
| $800 to $1,499 | 166 (28.3%) | 68 (5.3%) |
| $800 to $1,499 | 377 (64.2%) | 193 (15.0%) |
| Total | 587 (100.0%) | 1,282 (100.0%) |
Health & Disability in Cheviot
Health Insurance Coverage by Age in Cheviot
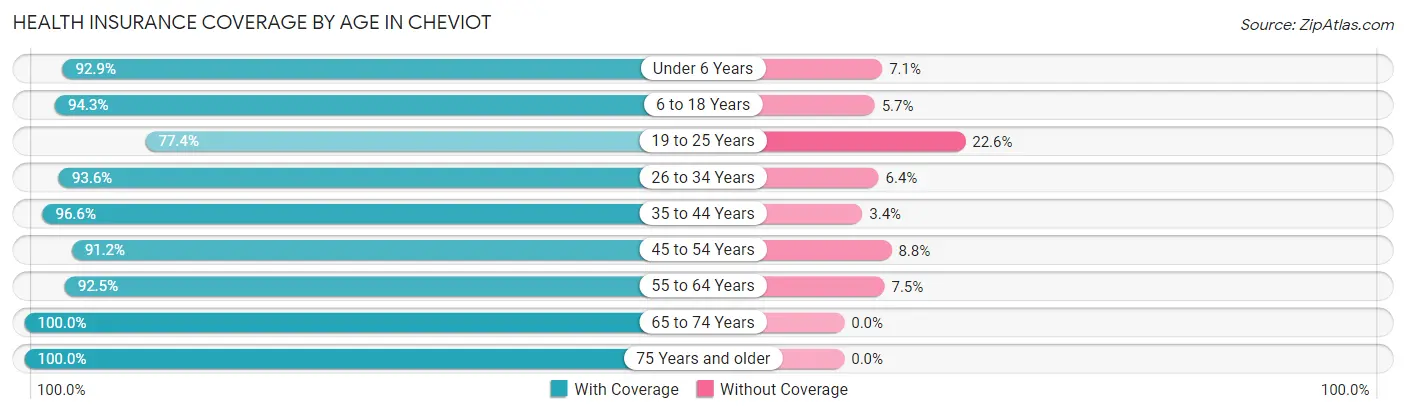
| Age Bracket | With Coverage | Without Coverage |
| Under 6 Years | 670 (92.9%) | 51 (7.1%) |
| 6 to 18 Years | 1,908 (94.3%) | 115 (5.7%) |
| 19 to 25 Years | 381 (77.4%) | 111 (22.6%) |
| 26 to 34 Years | 1,244 (93.6%) | 85 (6.4%) |
| 35 to 44 Years | 1,065 (96.6%) | 37 (3.4%) |
| 45 to 54 Years | 1,027 (91.2%) | 99 (8.8%) |
| 55 to 64 Years | 814 (92.5%) | 66 (7.5%) |
| 65 to 74 Years | 526 (100.0%) | 0 (0.0%) |
| 75 Years and older | 228 (100.0%) | 0 (0.0%) |
| Total | 7,863 (93.3%) | 564 (6.7%) |
Health Insurance Coverage by Citizenship Status in Cheviot
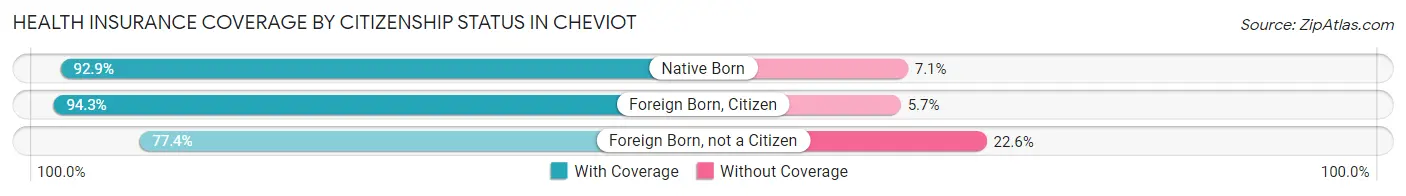
| Citizenship Status | With Coverage | Without Coverage |
| Native Born | 670 (92.9%) | 51 (7.1%) |
| Foreign Born, Citizen | 1,908 (94.3%) | 115 (5.7%) |
| Foreign Born, not a Citizen | 381 (77.4%) | 111 (22.6%) |
Health Insurance Coverage by Household Income in Cheviot
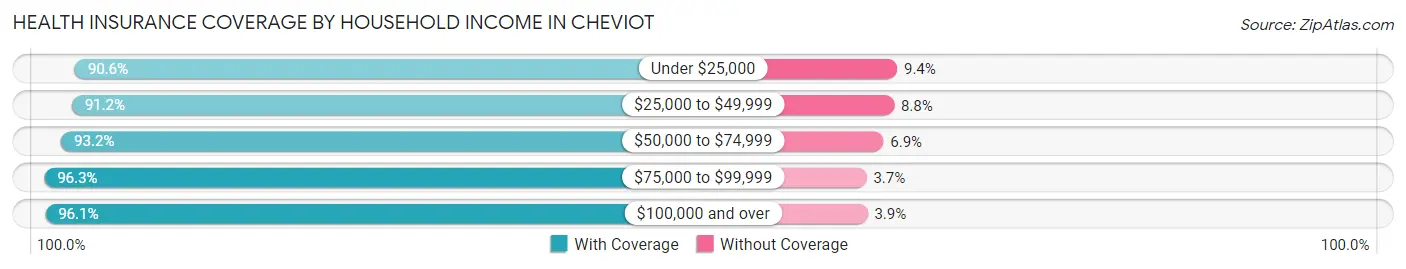
| Household Income | With Coverage | Without Coverage |
| Under $25,000 | 809 (90.6%) | 84 (9.4%) |
| $25,000 to $49,999 | 2,351 (91.2%) | 228 (8.8%) |
| $50,000 to $74,999 | 1,930 (93.1%) | 142 (6.9%) |
| $75,000 to $99,999 | 732 (96.3%) | 28 (3.7%) |
| $100,000 and over | 2,036 (96.1%) | 82 (3.9%) |
Public vs Private Health Insurance Coverage by Age in Cheviot
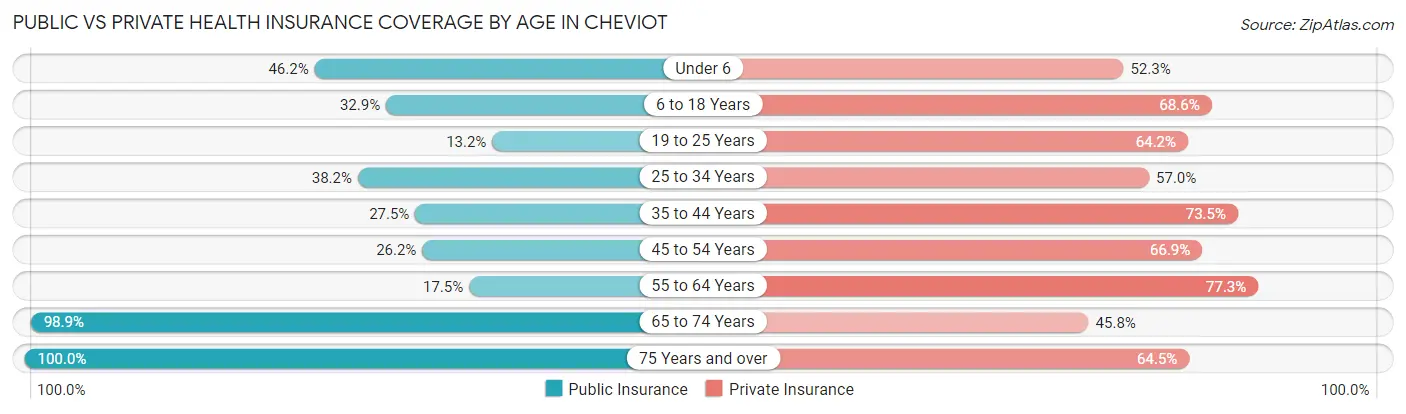
| Age Bracket | Public Insurance | Private Insurance |
| Under 6 | 333 (46.2%) | 377 (52.3%) |
| 6 to 18 Years | 666 (32.9%) | 1,388 (68.6%) |
| 19 to 25 Years | 65 (13.2%) | 316 (64.2%) |
| 25 to 34 Years | 507 (38.2%) | 758 (57.0%) |
| 35 to 44 Years | 303 (27.5%) | 810 (73.5%) |
| 45 to 54 Years | 295 (26.2%) | 753 (66.9%) |
| 55 to 64 Years | 154 (17.5%) | 680 (77.3%) |
| 65 to 74 Years | 520 (98.9%) | 241 (45.8%) |
| 75 Years and over | 228 (100.0%) | 147 (64.5%) |
| Total | 3,071 (36.4%) | 5,470 (64.9%) |
Disability Status by Sex by Age in Cheviot
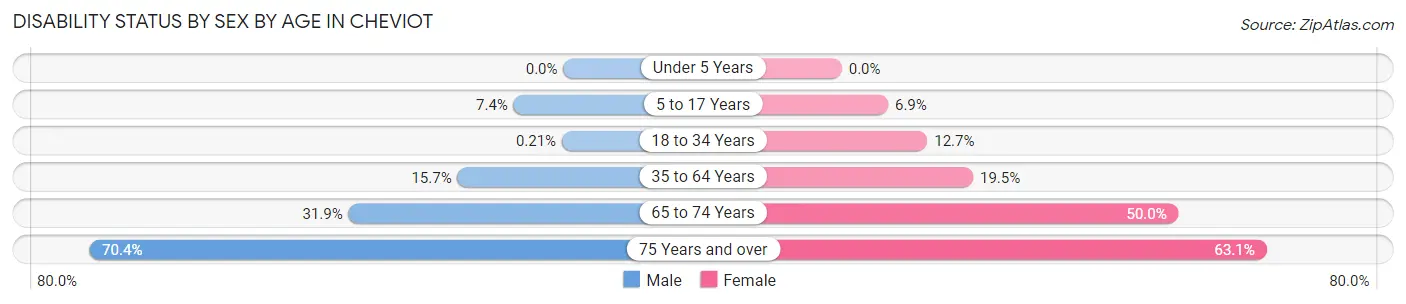
| Age Bracket | Male | Female |
| Under 5 Years | 0 (0.0%) | 0 (0.0%) |
| 5 to 17 Years | 82 (7.4%) | 64 (6.9%) |
| 18 to 34 Years | 2 (0.2%) | 122 (12.7%) |
| 35 to 64 Years | 232 (15.7%) | 318 (19.5%) |
| 65 to 74 Years | 74 (31.9%) | 147 (50.0%) |
| 75 Years and over | 69 (70.4%) | 82 (63.1%) |
Disability Class by Sex by Age in Cheviot
Disability Class: Hearing Difficulty
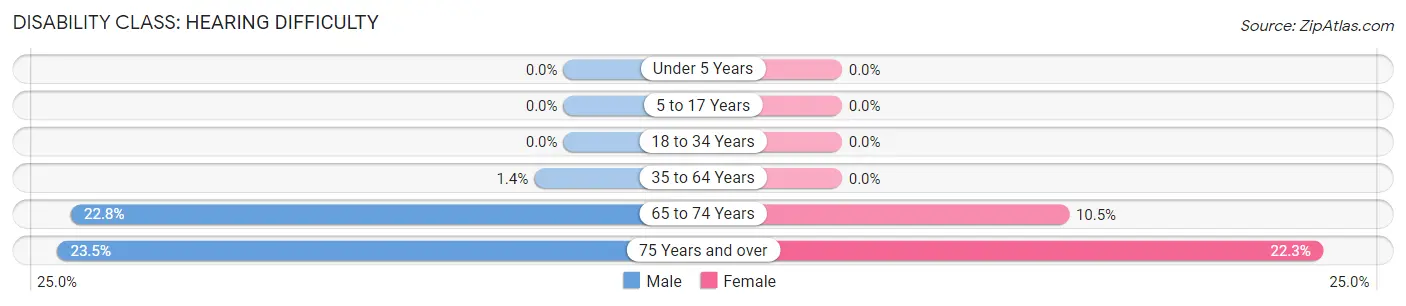
| Age Bracket | Male | Female |
| Under 5 Years | 0 (0.0%) | 0 (0.0%) |
| 5 to 17 Years | 0 (0.0%) | 0 (0.0%) |
| 18 to 34 Years | 0 (0.0%) | 0 (0.0%) |
| 35 to 64 Years | 20 (1.4%) | 0 (0.0%) |
| 65 to 74 Years | 53 (22.8%) | 31 (10.5%) |
| 75 Years and over | 23 (23.5%) | 29 (22.3%) |
Disability Class: Vision Difficulty
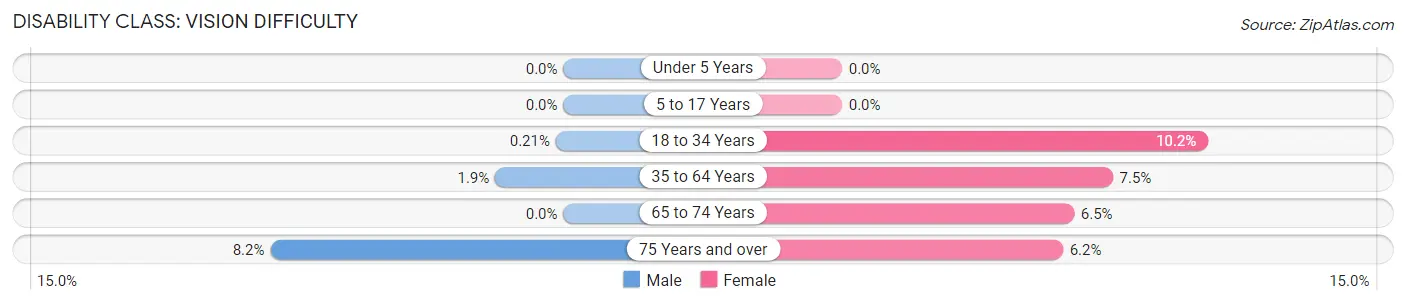
| Age Bracket | Male | Female |
| Under 5 Years | 0 (0.0%) | 0 (0.0%) |
| 5 to 17 Years | 0 (0.0%) | 0 (0.0%) |
| 18 to 34 Years | 2 (0.2%) | 98 (10.2%) |
| 35 to 64 Years | 28 (1.9%) | 123 (7.5%) |
| 65 to 74 Years | 0 (0.0%) | 19 (6.5%) |
| 75 Years and over | 8 (8.2%) | 8 (6.1%) |
Disability Class: Cognitive Difficulty
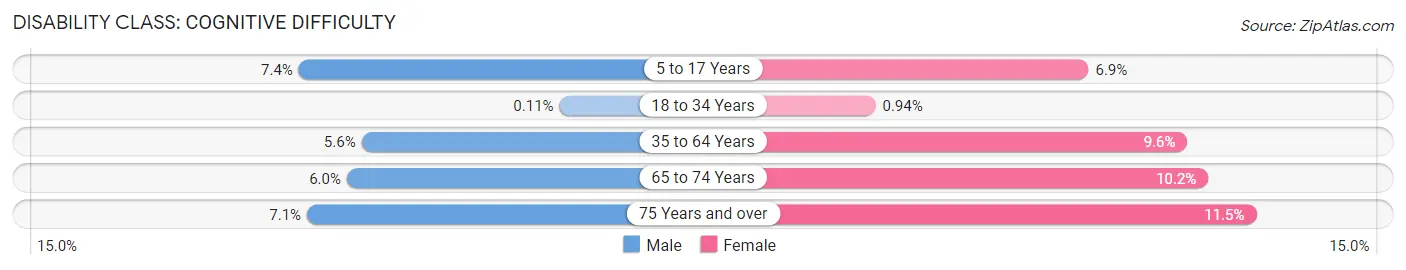
| Age Bracket | Male | Female |
| 5 to 17 Years | 82 (7.4%) | 64 (6.9%) |
| 18 to 34 Years | 1 (0.1%) | 9 (0.9%) |
| 35 to 64 Years | 83 (5.6%) | 157 (9.6%) |
| 65 to 74 Years | 14 (6.0%) | 30 (10.2%) |
| 75 Years and over | 7 (7.1%) | 15 (11.5%) |
Disability Class: Ambulatory Difficulty
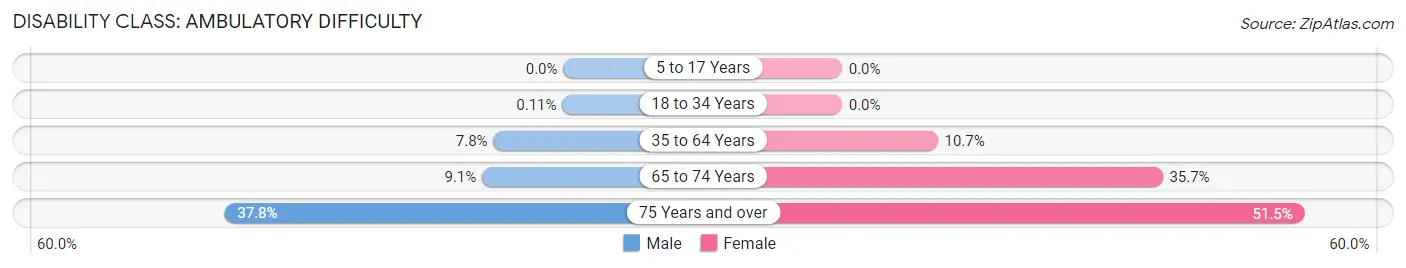
| Age Bracket | Male | Female |
| 5 to 17 Years | 0 (0.0%) | 0 (0.0%) |
| 18 to 34 Years | 1 (0.1%) | 0 (0.0%) |
| 35 to 64 Years | 115 (7.8%) | 174 (10.7%) |
| 65 to 74 Years | 21 (9.0%) | 105 (35.7%) |
| 75 Years and over | 37 (37.8%) | 67 (51.5%) |
Disability Class: Self-Care Difficulty
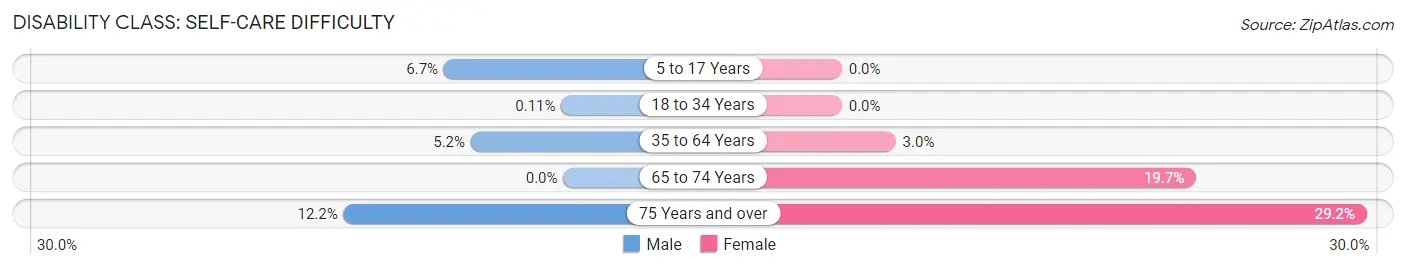
| Age Bracket | Male | Female |
| 5 to 17 Years | 74 (6.7%) | 0 (0.0%) |
| 18 to 34 Years | 1 (0.1%) | 0 (0.0%) |
| 35 to 64 Years | 76 (5.1%) | 49 (3.0%) |
| 65 to 74 Years | 0 (0.0%) | 58 (19.7%) |
| 75 Years and over | 12 (12.2%) | 38 (29.2%) |
Technology Access in Cheviot
Computing Device Access in Cheviot
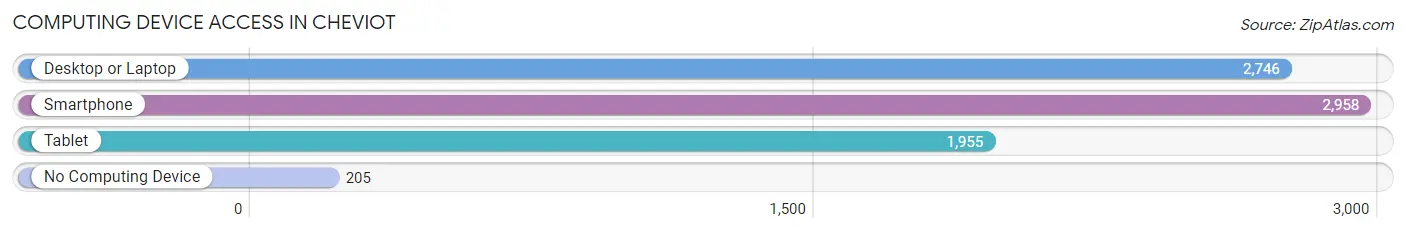
| Device Type | # Households | % Households |
| Desktop or Laptop | 2,746 | 78.1% |
| Smartphone | 2,958 | 84.1% |
| Tablet | 1,955 | 55.6% |
| No Computing Device | 205 | 5.8% |
| Total | 3,517 | 100.0% |
Internet Access in Cheviot
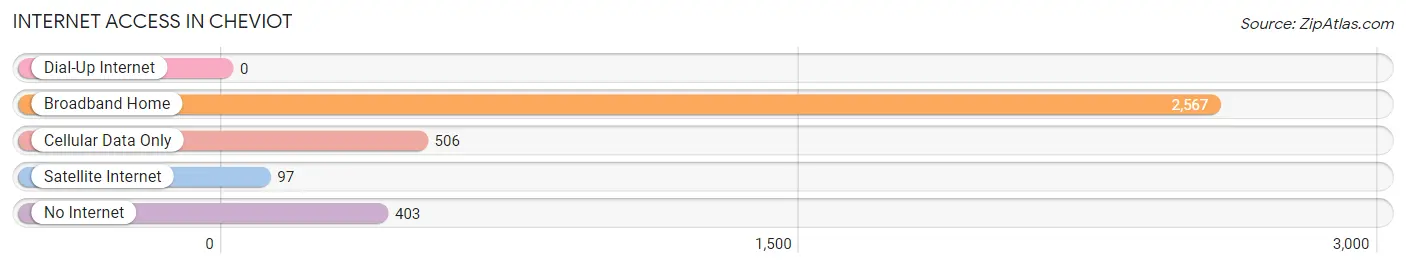
| Internet Type | # Households | % Households |
| Dial-Up Internet | 0 | 0.0% |
| Broadband Home | 2,567 | 73.0% |
| Cellular Data Only | 506 | 14.4% |
| Satellite Internet | 97 | 2.8% |
| No Internet | 403 | 11.5% |
| Total | 3,517 | 100.0% |
Cheviot Summary
Cheviot, Ohio is a city located in Hamilton County, Ohio, United States. It is a suburb of Cincinnati, located just west of the city. The population was 11,945 at the 2010 census.
History
Cheviot was founded in 1869 by a group of German immigrants. The city was named after the Cheviot Hills in Scotland. The first settlers were mostly farmers, and the city was incorporated in 1872.
In the early 1900s, Cheviot began to grow rapidly as a result of the streetcar line that connected it to Cincinnati. This allowed people to commute to work in the city, and it also attracted businesses to the area. By the 1920s, Cheviot had become a thriving community with a variety of businesses, including a bank, a movie theater, and several churches.
In the 1950s, Cheviot experienced a period of decline as the city's population began to move to the suburbs. However, in the late 1970s, the city began to experience a resurgence as people began to move back to the area. This trend has continued, and today Cheviot is a vibrant community with a variety of businesses and amenities.
Geography
Cheviot is located at 39°10'25" North, 84°33'17" West (39.173611, -84.554722). According to the United States Census Bureau, the city has a total area of 4.2 square miles (10.9 km2), all land.
Economy
Cheviot's economy is largely based on retail and services. The city is home to a variety of businesses, including restaurants, banks, and other retail stores. The city also has a number of industrial and manufacturing businesses.
Demographics
As of the 2010 census, there were 11,945 people, 4,845 households, and 3,092 families residing in the city. The population density was 2,845.3 people per square mile (1,101.2/km2). There were 5,093 housing units at an average density of 1,213.3 per square mile (468.7/km2). The racial makeup of the city was 92.2% White, 3.2% African American, 0.2% Native American, 1.3% Asian, 0.1% Pacific Islander, 1.2% from other races, and 1.9% from two or more races. Hispanic or Latino of any race were 3.3% of the population.
There were 4,845 households, out of which 28.2% had children under the age of 18 living with them, 46.2% were married couples living together, 13.3% had a female householder with no husband present, and 35.7% were non-families. 30.2% of all households were made up of individuals, and 11.2% had someone living alone who was 65 years of age or older. The average household size was 2.44 and the average family size was 3.05.
In the city, the population was spread out, with 23.7% under the age of 18, 8.2% from 18 to 24, 28.7% from 25 to 44, 24.3% from 45 to 64, and 15.1% who were 65 years of age or older. The median age was 38 years. For every 100 females, there were 91.2 males. For every 100 females age 18 and over, there were 87.3 males.
The median income for a household in the city was $41,945, and the median income for a family was $50,945. Males had a median income of $37,945 versus $30,945 for females. The per capita income for the city was $20,945. About 5.2% of families and 7.2% of the population were below the poverty line, including 9.2% of those under age 18 and 6.2% of those age 65 or over.
Common Questions
What is the Total Population of Cheviot?
Total Population of Cheviot is 8,682.
What is the Total Male Population of Cheviot?
Total Male Population of Cheviot is 4,427.
What is the Total Female Population of Cheviot?
Total Female Population of Cheviot is 4,255.
What is the Ratio of Males per 100 Females in Cheviot?
There are 104.04 Males per 100 Females in Cheviot.
What is the Ratio of Females per 100 Males in Cheviot?
There are 96.11 Females per 100 Males in Cheviot.
What is the Median Population Age in Cheviot?
Median Population Age in Cheviot is 32.5 Years.
What is the Average Family Size in Cheviot
Average Family Size in Cheviot is 3.1 People.
What is the Average Household Size in Cheviot
Average Household Size in Cheviot is 2.4 People.
What is Per Capita Income in Cheviot?
Per Capita income in Cheviot is $28,655.
What is the Median Family Income in Cheviot?
Median Family Income in Cheviot is $56,125.
What is the Median Household income in Cheviot?
Median Household Income in Cheviot is $52,461.
What is Income or Wage Gap in Cheviot?
Income or Wage Gap in Cheviot is 23.9%.
Women in Cheviot earn 76.1 cents for every dollar earned by a man.
What is Inequality or Gini Index in Cheviot?
Inequality or Gini Index in Cheviot is 0.41.
How Large is the Labor Force in Cheviot?
There are 4,622 People in the Labor Forcein in Cheviot.
What is the Percentage of People in the Labor Force in Cheviot?
73.9% of People are in the Labor Force in Cheviot.
What is the Unemployment Rate in Cheviot?
Unemployment Rate in Cheviot is 6.3%.