Westlake, OH
Westlake Map
Westlake Overview
34,027
TOTAL POPULATION
16,204
MALE POPULATION
17,823
FEMALE POPULATION
90.92
MALES / 100 FEMALES
109.99
FEMALES / 100 MALES
47.0
MEDIAN AGE
3.0
AVG FAMILY SIZE
2.3
AVG HOUSEHOLD SIZE
$64,001
PER CAPITA INCOME
$138,186
AVG FAMILY INCOME
$103,658
AVG HOUSEHOLD INCOME
32.6%
WAGE / INCOME GAP [ % ]
67.4¢/ $1
WAGE / INCOME GAP [ $ ]
$12,165
FAMILY INCOME DEFICIT
0.48
INEQUALITY / GINI INDEX
17,529
LABOR FORCE [ PEOPLE ]
61.7%
PERCENT IN LABOR FORCE
3.6%
UNEMPLOYMENT RATE
Westlake Zip Codes
Westlake Area Codes
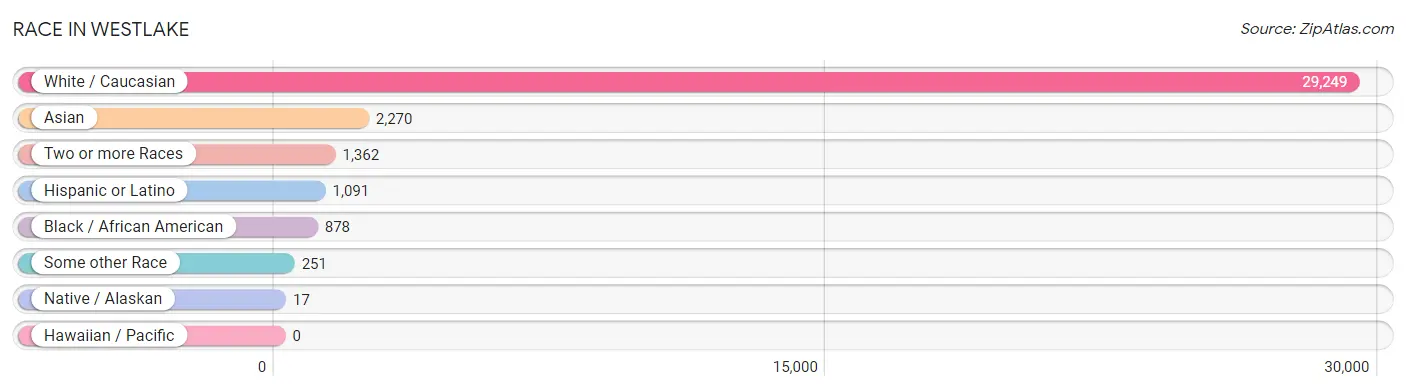
Race in Westlake
The most populous races in Westlake are White / Caucasian (29,249 | 86.0%), Asian (2,270 | 6.7%), and Two or more Races (1,362 | 4.0%).
| Race | # Population | % Population |
| Asian | 2,270 | 6.7% |
| Black / African American | 878 | 2.6% |
| Hawaiian / Pacific | 0 | 0.0% |
| Hispanic or Latino | 1,091 | 3.2% |
| Native / Alaskan | 17 | 0.1% |
| White / Caucasian | 29,249 | 86.0% |
| Two or more Races | 1,362 | 4.0% |
| Some other Race | 251 | 0.7% |
| Total | 34,027 | 100.0% |
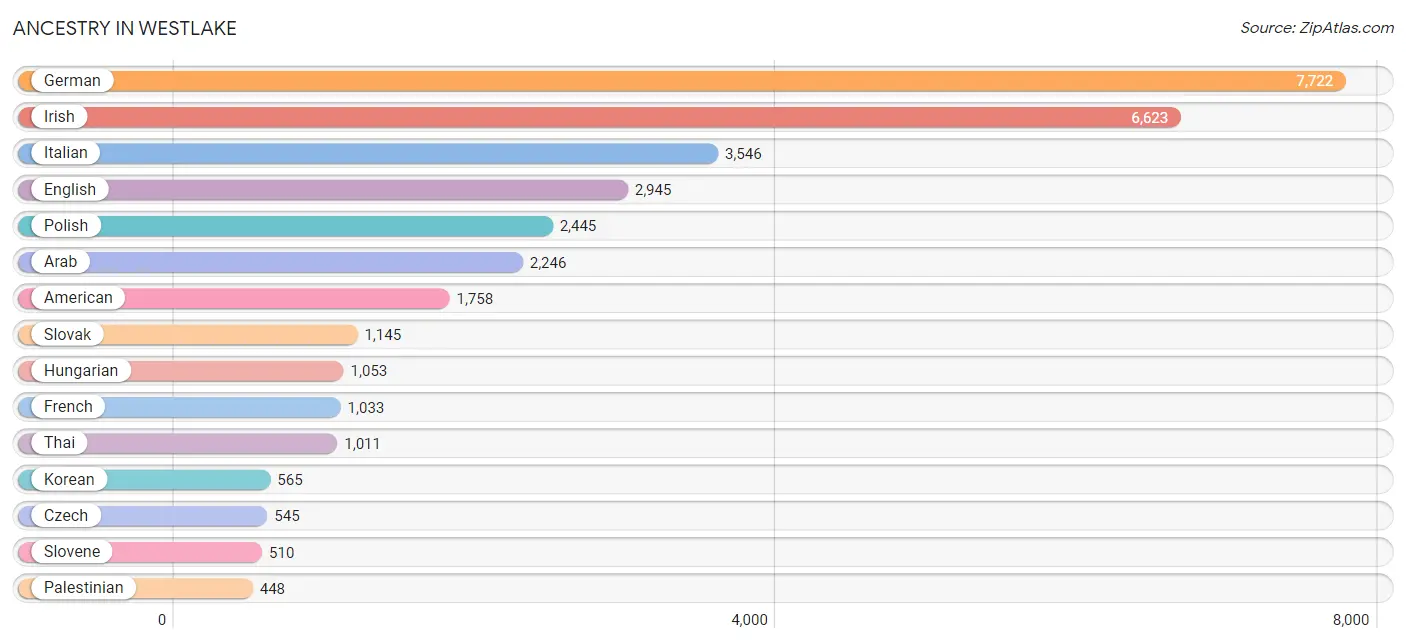
Ancestry in Westlake
The most populous ancestries reported in Westlake are German (7,722 | 22.7%), Irish (6,623 | 19.5%), Italian (3,546 | 10.4%), English (2,945 | 8.6%), and Polish (2,445 | 7.2%), together accounting for 68.4% of all Westlake residents.
| Ancestry | # Population | % Population |
| African | 72 | 0.2% |
| Albanian | 88 | 0.3% |
| American | 1,758 | 5.2% |
| Arab | 2,246 | 6.6% |
| Armenian | 174 | 0.5% |
| Austrian | 205 | 0.6% |
| Belgian | 21 | 0.1% |
| Bhutanese | 253 | 0.7% |
| Blackfeet | 32 | 0.1% |
| British | 42 | 0.1% |
| Bulgarian | 42 | 0.1% |
| Burmese | 430 | 1.3% |
| Canadian | 89 | 0.3% |
| Central American | 87 | 0.3% |
| Cherokee | 27 | 0.1% |
| Chippewa | 7 | 0.0% |
| Colombian | 11 | 0.0% |
| Croatian | 135 | 0.4% |
| Czech | 545 | 1.6% |
| Czechoslovakian | 114 | 0.3% |
| Danish | 19 | 0.1% |
| Dutch | 145 | 0.4% |
| Eastern European | 326 | 1.0% |
| Egyptian | 52 | 0.2% |
| English | 2,945 | 8.6% |
| Ethiopian | 27 | 0.1% |
| European | 343 | 1.0% |
| Filipino | 81 | 0.2% |
| Finnish | 40 | 0.1% |
| French | 1,033 | 3.0% |
| French Canadian | 90 | 0.3% |
| German | 7,722 | 22.7% |
| Greek | 435 | 1.3% |
| Guyanese | 13 | 0.0% |
| Hungarian | 1,053 | 3.1% |
| Icelander | 28 | 0.1% |
| Indian (Asian) | 434 | 1.3% |
| Iranian | 35 | 0.1% |
| Irish | 6,623 | 19.5% |
| Iroquois | 8 | 0.0% |
| Italian | 3,546 | 10.4% |
| Jamaican | 7 | 0.0% |
| Korean | 565 | 1.7% |
| Latvian | 64 | 0.2% |
| Lebanese | 250 | 0.7% |
| Lithuanian | 98 | 0.3% |
| Macedonian | 14 | 0.0% |
| Mexican | 173 | 0.5% |
| New Zealander | 39 | 0.1% |
| Nicaraguan | 44 | 0.1% |
| Nigerian | 67 | 0.2% |
| Northern European | 66 | 0.2% |
| Norwegian | 246 | 0.7% |
| Palestinian | 448 | 1.3% |
| Panamanian | 43 | 0.1% |
| Paraguayan | 1 | 0.0% |
| Peruvian | 70 | 0.2% |
| Polish | 2,445 | 7.2% |
| Portuguese | 1 | 0.0% |
| Puerto Rican | 419 | 1.2% |
| Romanian | 442 | 1.3% |
| Russian | 170 | 0.5% |
| Scandinavian | 75 | 0.2% |
| Scotch-Irish | 314 | 0.9% |
| Scottish | 433 | 1.3% |
| Serbian | 110 | 0.3% |
| Slovak | 1,145 | 3.4% |
| Slovene | 510 | 1.5% |
| South African | 8 | 0.0% |
| South American | 106 | 0.3% |
| Spaniard | 64 | 0.2% |
| Spanish | 201 | 0.6% |
| Sri Lankan | 31 | 0.1% |
| Subsaharan African | 175 | 0.5% |
| Swedish | 147 | 0.4% |
| Swiss | 134 | 0.4% |
| Syrian | 263 | 0.8% |
| Thai | 1,011 | 3.0% |
| Turkish | 70 | 0.2% |
| Ukrainian | 255 | 0.7% |
| Venezuelan | 24 | 0.1% |
| Welsh | 269 | 0.8% |
| Yugoslavian | 8 | 0.0% | View All 83 Rows |
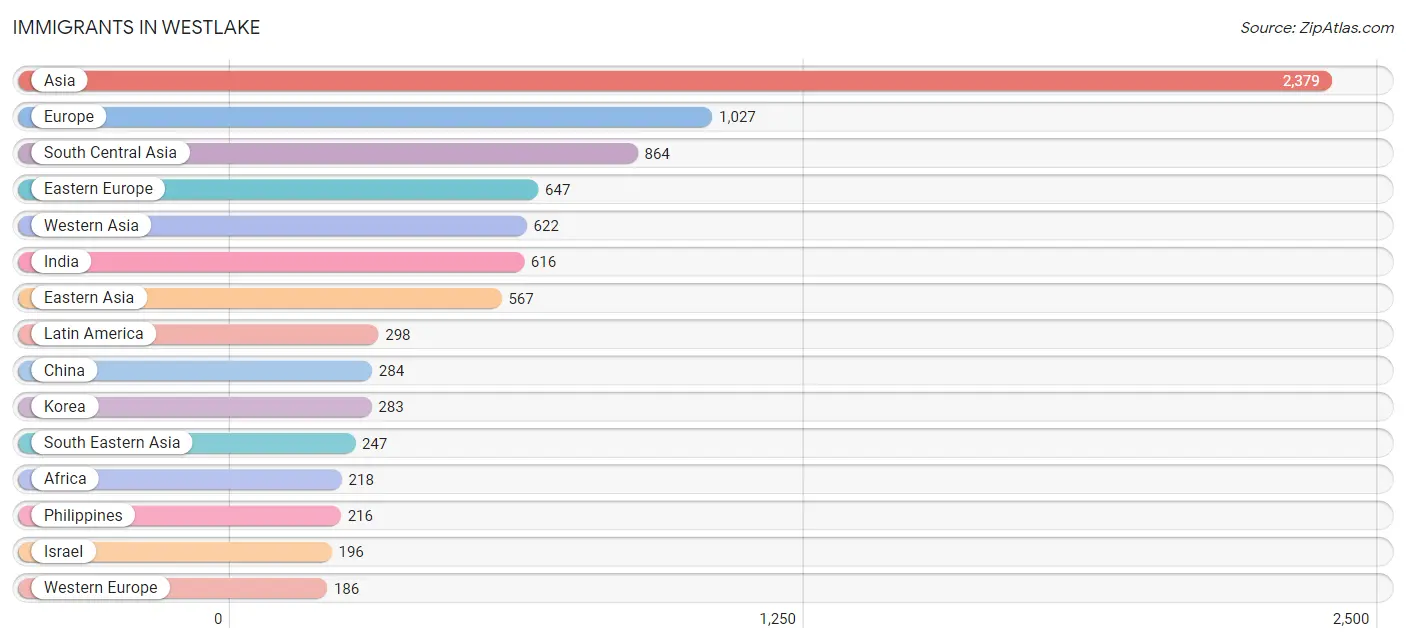
Immigrants in Westlake
The most numerous immigrant groups reported in Westlake came from Asia (2,379 | 7.0%), Europe (1,027 | 3.0%), South Central Asia (864 | 2.5%), Eastern Europe (647 | 1.9%), and Western Asia (622 | 1.8%), together accounting for 16.3% of all Westlake residents.
| Immigration Origin | # Population | % Population |
| Africa | 218 | 0.6% |
| Albania | 80 | 0.2% |
| Asia | 2,379 | 7.0% |
| Australia | 9 | 0.0% |
| Austria | 8 | 0.0% |
| Belgium | 6 | 0.0% |
| Bulgaria | 22 | 0.1% |
| Canada | 89 | 0.3% |
| Caribbean | 8 | 0.0% |
| Central America | 140 | 0.4% |
| China | 284 | 0.8% |
| Colombia | 11 | 0.0% |
| Croatia | 21 | 0.1% |
| Czechoslovakia | 67 | 0.2% |
| Eastern Africa | 79 | 0.2% |
| Eastern Asia | 567 | 1.7% |
| Eastern Europe | 647 | 1.9% |
| Egypt | 10 | 0.0% |
| England | 25 | 0.1% |
| Ethiopia | 27 | 0.1% |
| Europe | 1,027 | 3.0% |
| France | 59 | 0.2% |
| Germany | 113 | 0.3% |
| Greece | 80 | 0.2% |
| Grenada | 8 | 0.0% |
| Guatemala | 16 | 0.1% |
| Guyana | 13 | 0.0% |
| Hungary | 43 | 0.1% |
| India | 616 | 1.8% |
| Iran | 91 | 0.3% |
| Iraq | 35 | 0.1% |
| Israel | 196 | 0.6% |
| Italy | 39 | 0.1% |
| Jordan | 109 | 0.3% |
| Korea | 283 | 0.8% |
| Latin America | 298 | 0.9% |
| Lebanon | 42 | 0.1% |
| Mexico | 108 | 0.3% |
| Nicaragua | 16 | 0.1% |
| Nigeria | 20 | 0.1% |
| Northern Africa | 111 | 0.3% |
| Northern Europe | 74 | 0.2% |
| Oceania | 64 | 0.2% |
| Pakistan | 120 | 0.4% |
| Peru | 70 | 0.2% |
| Philippines | 216 | 0.6% |
| Poland | 131 | 0.4% |
| Romania | 184 | 0.5% |
| Russia | 12 | 0.0% |
| Scotland | 25 | 0.1% |
| Serbia | 23 | 0.1% |
| South Africa | 8 | 0.0% |
| South America | 150 | 0.4% |
| South Central Asia | 864 | 2.5% |
| South Eastern Asia | 247 | 0.7% |
| Southern Europe | 120 | 0.4% |
| Spain | 1 | 0.0% |
| Sri Lanka | 37 | 0.1% |
| Syria | 161 | 0.5% |
| Taiwan | 73 | 0.2% |
| Turkey | 53 | 0.2% |
| Ukraine | 33 | 0.1% |
| Uruguay | 3 | 0.0% |
| Venezuela | 15 | 0.0% |
| Vietnam | 31 | 0.1% |
| Western Africa | 20 | 0.1% |
| Western Asia | 622 | 1.8% |
| Western Europe | 186 | 0.5% | View All 68 Rows |
Sex and Age in Westlake
Sex and Age in Westlake
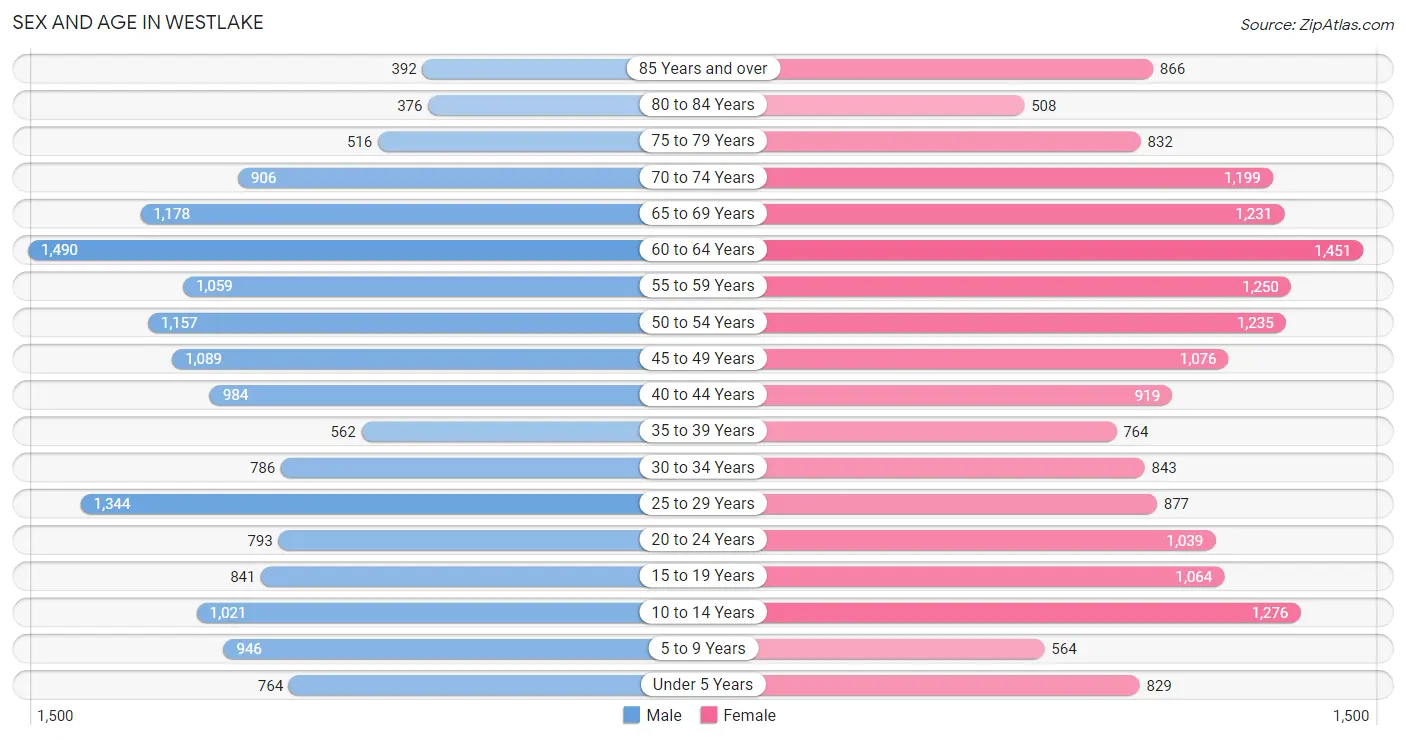
The most populous age groups in Westlake are 60 to 64 Years (1,490 | 9.2%) for men and 60 to 64 Years (1,451 | 8.1%) for women.
| Age Bracket | Male | Female |
| Under 5 Years | 764 (4.7%) | 829 (4.6%) |
| 5 to 9 Years | 946 (5.8%) | 564 (3.2%) |
| 10 to 14 Years | 1,021 (6.3%) | 1,276 (7.2%) |
| 15 to 19 Years | 841 (5.2%) | 1,064 (6.0%) |
| 20 to 24 Years | 793 (4.9%) | 1,039 (5.8%) |
| 25 to 29 Years | 1,344 (8.3%) | 877 (4.9%) |
| 30 to 34 Years | 786 (4.9%) | 843 (4.7%) |
| 35 to 39 Years | 562 (3.5%) | 764 (4.3%) |
| 40 to 44 Years | 984 (6.1%) | 919 (5.2%) |
| 45 to 49 Years | 1,089 (6.7%) | 1,076 (6.0%) |
| 50 to 54 Years | 1,157 (7.1%) | 1,235 (6.9%) |
| 55 to 59 Years | 1,059 (6.5%) | 1,250 (7.0%) |
| 60 to 64 Years | 1,490 (9.2%) | 1,451 (8.1%) |
| 65 to 69 Years | 1,178 (7.3%) | 1,231 (6.9%) |
| 70 to 74 Years | 906 (5.6%) | 1,199 (6.7%) |
| 75 to 79 Years | 516 (3.2%) | 832 (4.7%) |
| 80 to 84 Years | 376 (2.3%) | 508 (2.9%) |
| 85 Years and over | 392 (2.4%) | 866 (4.9%) |
| Total | 16,204 (100.0%) | 17,823 (100.0%) |
Families and Households in Westlake
Median Family Size in Westlake
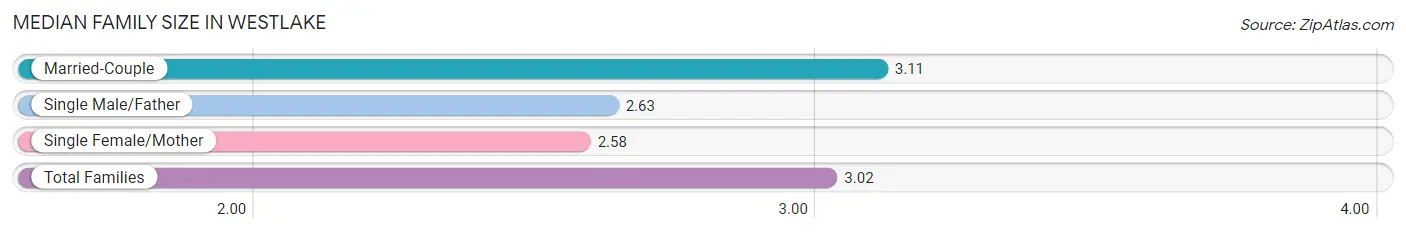
The median family size in Westlake is 3.02 persons per family, with married-couple families (7,224 | 83.8%) accounting for the largest median family size of 3.11 persons per family. On the other hand, single female/mother families (934 | 10.8%) represent the smallest median family size with 2.58 persons per family.
| Family Type | # Families | Family Size |
| Married-Couple | 7,224 (83.8%) | 3.11 |
| Single Male/Father | 463 (5.4%) | 2.63 |
| Single Female/Mother | 934 (10.8%) | 2.58 |
| Total Families | 8,621 (100.0%) | 3.02 |
Median Household Size in Westlake
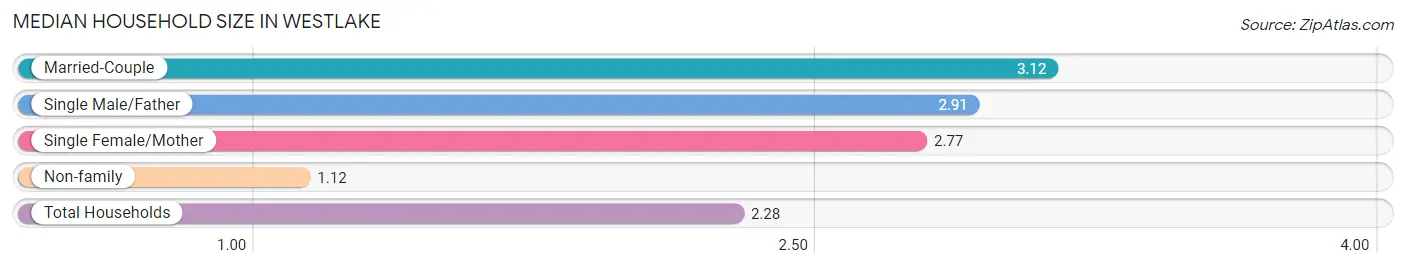
The median household size in Westlake is 2.28 persons per household, with married-couple households (7,224 | 49.7%) accounting for the largest median household size of 3.12 persons per household. non-family households (5,916 | 40.7%) represent the smallest median household size with 1.12 persons per household.
| Household Type | # Households | Household Size |
| Married-Couple | 7,224 (49.7%) | 3.12 |
| Single Male/Father | 463 (3.2%) | 2.91 |
| Single Female/Mother | 934 (6.4%) | 2.77 |
| Non-family | 5,916 (40.7%) | 1.12 |
| Total Households | 14,537 (100.0%) | 2.28 |
Household Size by Marriage Status in Westlake
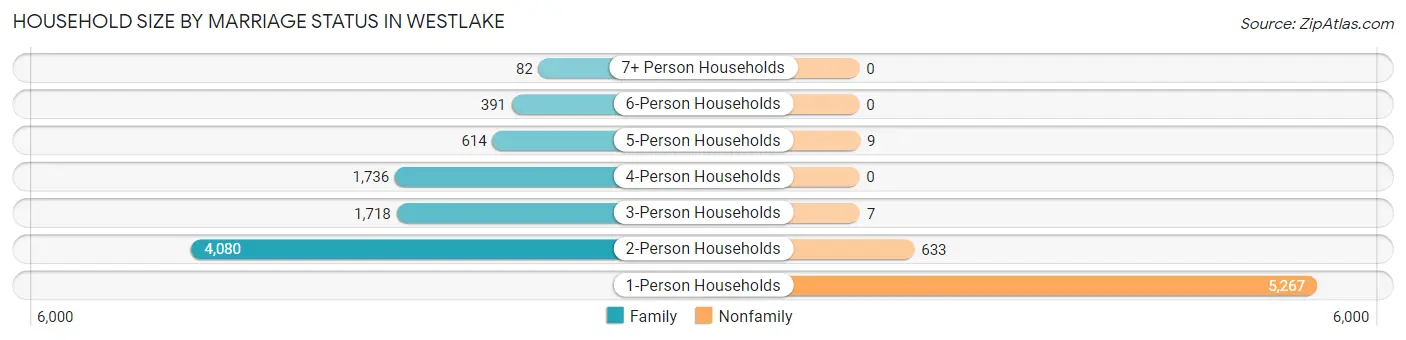
Out of a total of 14,537 households in Westlake, 8,621 (59.3%) are family households, while 5,916 (40.7%) are nonfamily households. The most numerous type of family households are 2-person households, comprising 4,080, and the most common type of nonfamily households are 1-person households, comprising 5,267.
| Household Size | Family Households | Nonfamily Households |
| 1-Person Households | - | 5,267 (36.2%) |
| 2-Person Households | 4,080 (28.1%) | 633 (4.3%) |
| 3-Person Households | 1,718 (11.8%) | 7 (0.1%) |
| 4-Person Households | 1,736 (11.9%) | 0 (0.0%) |
| 5-Person Households | 614 (4.2%) | 9 (0.1%) |
| 6-Person Households | 391 (2.7%) | 0 (0.0%) |
| 7+ Person Households | 82 (0.6%) | 0 (0.0%) |
| Total | 8,621 (59.3%) | 5,916 (40.7%) |
Female Fertility in Westlake
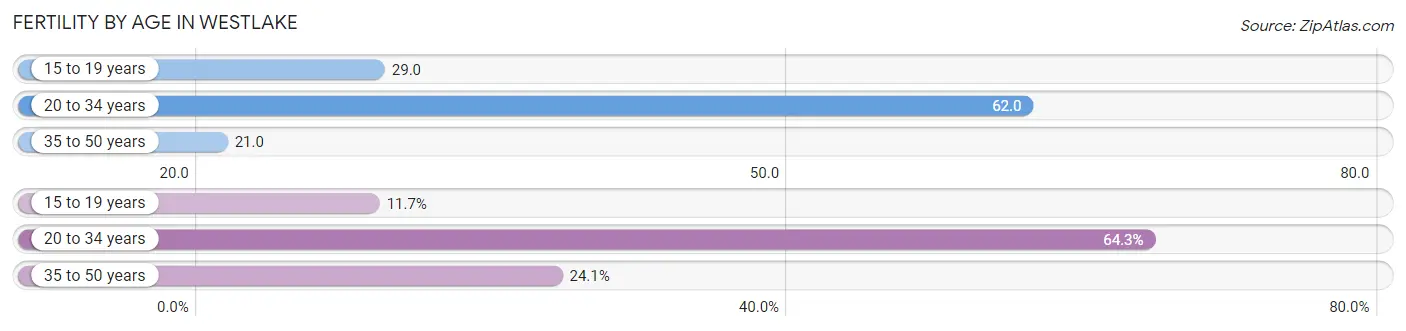
Fertility by Age in Westlake
Average fertility rate in Westlake is 39.0 births per 1,000 women. Women in the age bracket of 20 to 34 years have the highest fertility rate with 62.0 births per 1,000 women. Women in the age bracket of 20 to 34 years acount for 64.3% of all women with births.
| Age Bracket | Women with Births | Births / 1,000 Women |
| 15 to 19 years | 31 (11.7%) | 29.0 |
| 20 to 34 years | 171 (64.3%) | 62.0 |
| 35 to 50 years | 64 (24.1%) | 21.0 |
| Total | 266 (100.0%) | 39.0 |
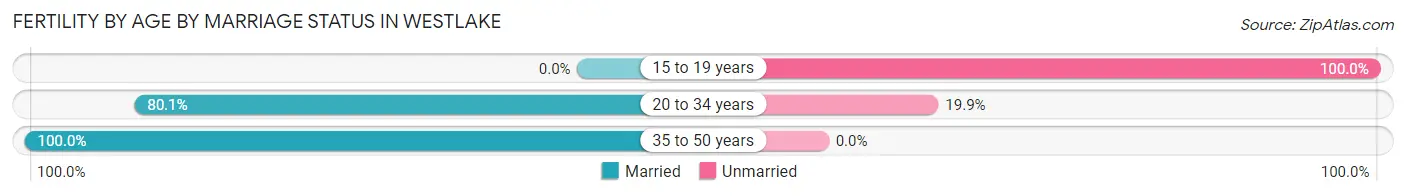
Fertility by Age by Marriage Status in Westlake
75.6% of women with births (266) in Westlake are married. The highest percentage of unmarried women with births falls into 15 to 19 years age bracket with 100.0% of them unmarried at the time of birth, while the lowest percentage of unmarried women with births belong to 35 to 50 years age bracket with 0.0% of them unmarried.
| Age Bracket | Married | Unmarried |
| 15 to 19 years | 0 (0.0%) | 31 (100.0%) |
| 20 to 34 years | 137 (80.1%) | 34 (19.9%) |
| 35 to 50 years | 64 (100.0%) | 0 (0.0%) |
| Total | 201 (75.6%) | 65 (24.4%) |
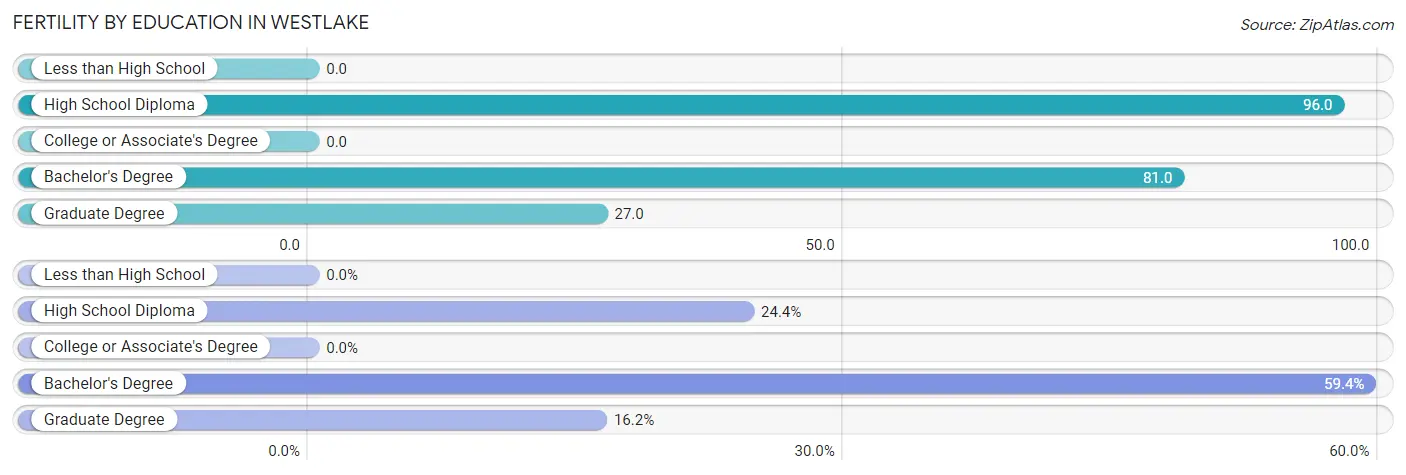
Fertility by Education in Westlake
| Educational Attainment | Women with Births | Births / 1,000 Women |
| Less than High School | 0 (0.0%) | 0.0 |
| High School Diploma | 65 (24.4%) | 96.0 |
| College or Associate's Degree | 0 (0.0%) | 0.0 |
| Bachelor's Degree | 158 (59.4%) | 81.0 |
| Graduate Degree | 43 (16.2%) | 27.0 |
| Total | 266 (100.0%) | 39.0 |
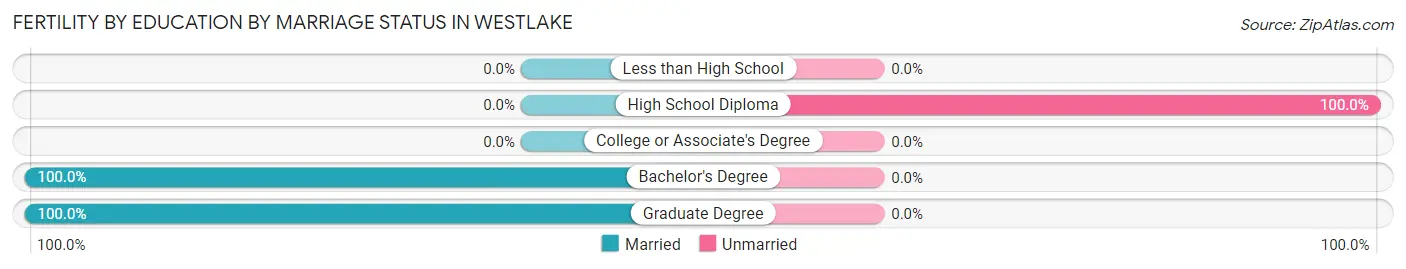
Fertility by Education by Marriage Status in Westlake
24.4% of women with births in Westlake are unmarried. Women with the educational attainment of bachelor's degree are most likely to be married with 100.0% of them married at childbirth, while women with the educational attainment of high school diploma are least likely to be married with 100.0% of them unmarried at childbirth.
| Educational Attainment | Married | Unmarried |
| Less than High School | 0 (0.0%) | 0 (0.0%) |
| High School Diploma | 0 (0.0%) | 65 (100.0%) |
| College or Associate's Degree | 0 (0.0%) | 0 (0.0%) |
| Bachelor's Degree | 158 (100.0%) | 0 (0.0%) |
| Graduate Degree | 43 (100.0%) | 0 (0.0%) |
| Total | 201 (75.6%) | 65 (24.4%) |
Income in Westlake
Income Overview in Westlake
Per Capita Income in Westlake is $64,001, while median incomes of families and households are $138,186 and $103,658 respectively.
| Characteristic | Number | Measure |
| Per Capita Income | 34,027 | $64,001 |
| Median Family Income | 8,621 | $138,186 |
| Mean Family Income | 8,621 | $194,803 |
| Median Household Income | 14,537 | $103,658 |
| Mean Household Income | 14,537 | $148,336 |
| Income Deficit | 8,621 | $12,165 |
| Wage / Income Gap (%) | 34,027 | 32.58% |
| Wage / Income Gap ($) | 34,027 | 67.42¢ per $1 |
| Gini / Inequality Index | 34,027 | 0.48 |
Earnings by Sex in Westlake
Average Earnings in Westlake are $59,348, $74,059 for men and $49,932 for women, a difference of 32.6%.
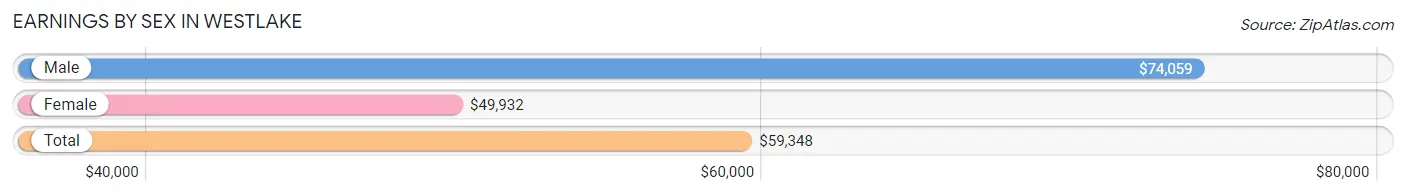
| Sex | Number | Average Earnings |
| Male | 9,830 (53.2%) | $74,059 |
| Female | 8,638 (46.8%) | $49,932 |
| Total | 18,468 (100.0%) | $59,348 |
Earnings by Sex by Income Bracket in Westlake
The most common earnings brackets in Westlake are $100,000+ for men (3,665 | 37.3%) and $100,000+ for women (1,377 | 15.9%).
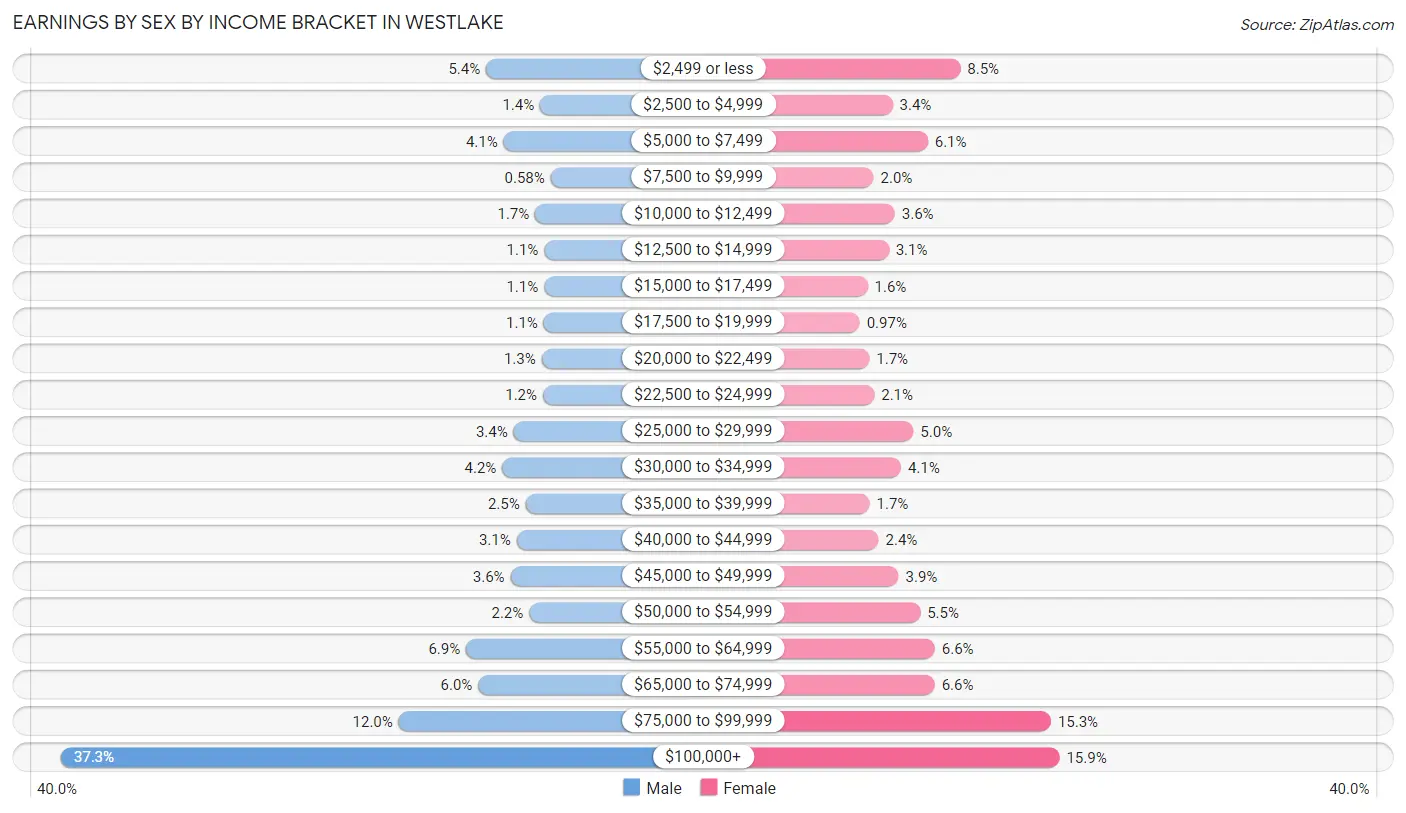
| Income | Male | Female |
| $2,499 or less | 533 (5.4%) | 735 (8.5%) |
| $2,500 to $4,999 | 135 (1.4%) | 296 (3.4%) |
| $5,000 to $7,499 | 404 (4.1%) | 524 (6.1%) |
| $7,500 to $9,999 | 57 (0.6%) | 174 (2.0%) |
| $10,000 to $12,499 | 171 (1.7%) | 311 (3.6%) |
| $12,500 to $14,999 | 104 (1.1%) | 271 (3.1%) |
| $15,000 to $17,499 | 105 (1.1%) | 135 (1.6%) |
| $17,500 to $19,999 | 108 (1.1%) | 84 (1.0%) |
| $20,000 to $22,499 | 124 (1.3%) | 146 (1.7%) |
| $22,500 to $24,999 | 114 (1.2%) | 178 (2.1%) |
| $25,000 to $29,999 | 330 (3.4%) | 431 (5.0%) |
| $30,000 to $34,999 | 414 (4.2%) | 351 (4.1%) |
| $35,000 to $39,999 | 242 (2.5%) | 148 (1.7%) |
| $40,000 to $44,999 | 308 (3.1%) | 206 (2.4%) |
| $45,000 to $49,999 | 353 (3.6%) | 335 (3.9%) |
| $50,000 to $54,999 | 215 (2.2%) | 475 (5.5%) |
| $55,000 to $64,999 | 680 (6.9%) | 570 (6.6%) |
| $65,000 to $74,999 | 591 (6.0%) | 569 (6.6%) |
| $75,000 to $99,999 | 1,177 (12.0%) | 1,322 (15.3%) |
| $100,000+ | 3,665 (37.3%) | 1,377 (15.9%) |
| Total | 9,830 (100.0%) | 8,638 (100.0%) |
Earnings by Sex by Educational Attainment in Westlake
Average earnings in Westlake are $85,779 for men and $58,177 for women, a difference of 32.2%. Men with an educational attainment of graduate degree enjoy the highest average annual earnings of $126,222, while those with high school diploma education earn the least with $34,931. Women with an educational attainment of graduate degree earn the most with the average annual earnings of $86,358, while those with college or associate's degree education have the smallest earnings of $33,018.
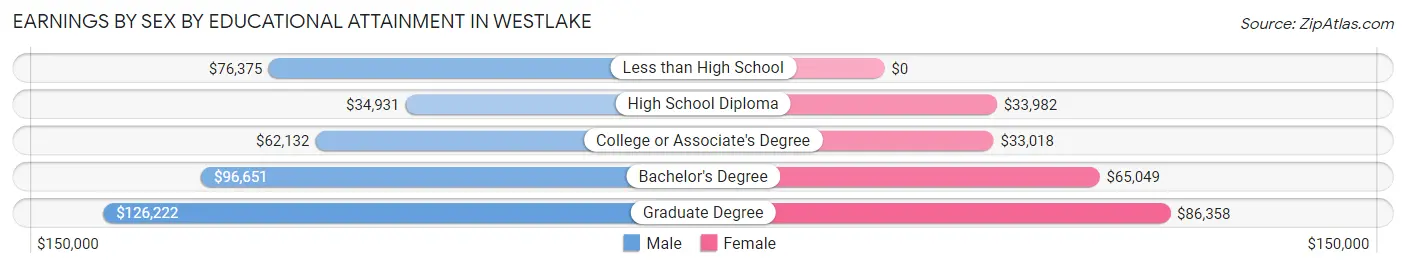
| Educational Attainment | Male Income | Female Income |
| Less than High School | $76,375 | $0 |
| High School Diploma | $34,931 | $33,982 |
| College or Associate's Degree | $62,132 | $33,018 |
| Bachelor's Degree | $96,651 | $65,049 |
| Graduate Degree | $126,222 | $86,358 |
| Total | $85,779 | $58,177 |
Family Income in Westlake
Family Income Brackets in Westlake
According to the Westlake family income data, there are 2,750 families falling into the $200,000+ income range, which is the most common income bracket and makes up 31.9% of all families. Conversely, the $10,000 to $14,999 income bracket is the least frequent group with only 52 families (0.6%) belonging to this category.
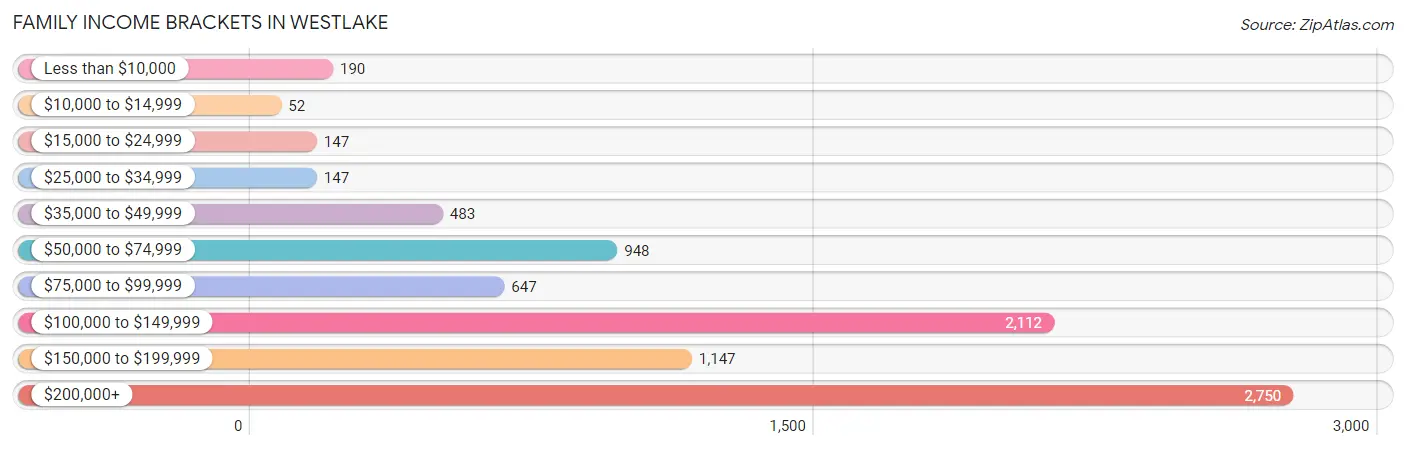
| Income Bracket | # Families | % Families |
| Less than $10,000 | 190 | 2.2% |
| $10,000 to $14,999 | 52 | 0.6% |
| $15,000 to $24,999 | 147 | 1.7% |
| $25,000 to $34,999 | 147 | 1.7% |
| $35,000 to $49,999 | 483 | 5.6% |
| $50,000 to $74,999 | 948 | 11.0% |
| $75,000 to $99,999 | 647 | 7.5% |
| $100,000 to $149,999 | 2,112 | 24.5% |
| $150,000 to $199,999 | 1,147 | 13.3% |
| $200,000+ | 2,750 | 31.9% |
Family Income by Famaliy Size in Westlake
6-person families (351 | 4.1%) account for the highest median family income in Westlake with $250,001 per family, while 2-person families (4,151 | 48.1%) have the highest median income of $54,989 per family member.
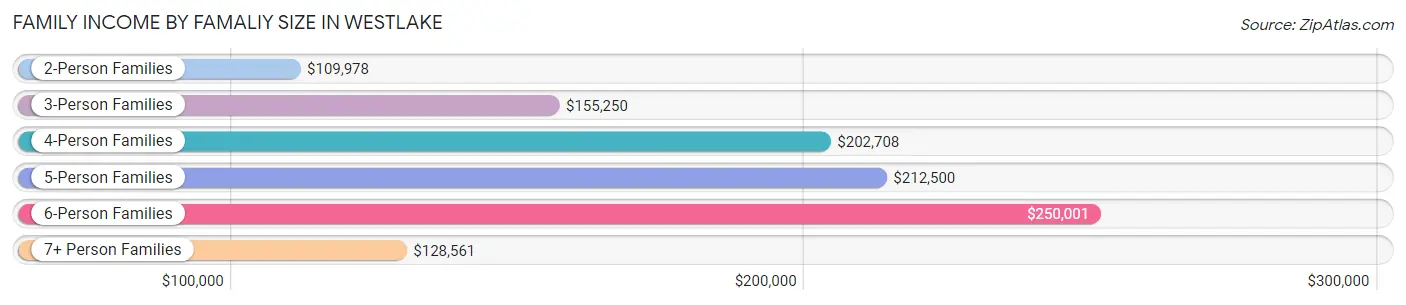
| Income Bracket | # Families | Median Income |
| 2-Person Families | 4,151 (48.1%) | $109,978 |
| 3-Person Families | 1,787 (20.7%) | $155,250 |
| 4-Person Families | 1,642 (19.1%) | $202,708 |
| 5-Person Families | 614 (7.1%) | $212,500 |
| 6-Person Families | 351 (4.1%) | $250,001 |
| 7+ Person Families | 76 (0.9%) | $128,561 |
| Total | 8,621 (100.0%) | $138,186 |
Family Income by Number of Earners in Westlake
The median family income in Westlake is $138,186, with families comprising 3+ earners (1,297) having the highest median family income of $204,926, while families with no earners (1,444) have the lowest median family income of $78,750, accounting for 15.0% and 16.8% of families, respectively.
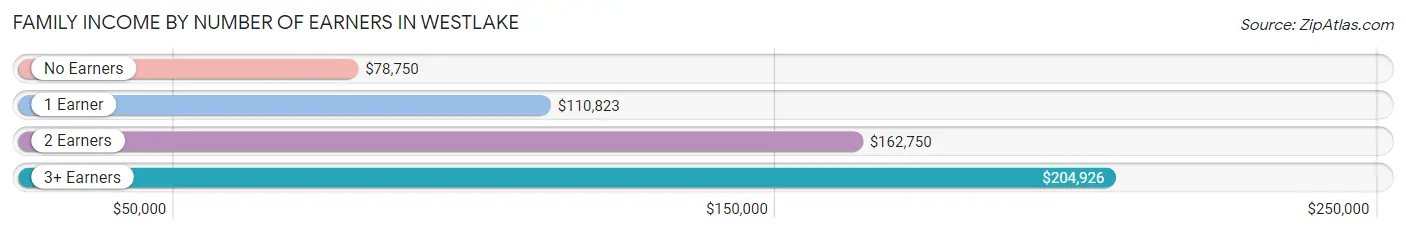
| Number of Earners | # Families | Median Income |
| No Earners | 1,444 (16.8%) | $78,750 |
| 1 Earner | 2,409 (27.9%) | $110,823 |
| 2 Earners | 3,471 (40.3%) | $162,750 |
| 3+ Earners | 1,297 (15.0%) | $204,926 |
| Total | 8,621 (100.0%) | $138,186 |
Household Income in Westlake
Household Income Brackets in Westlake
With 3,096 households falling in the category, the $200,000+ income range is the most frequent in Westlake, accounting for 21.3% of all households. In contrast, only 233 households (1.6%) fall into the $10,000 to $14,999 income bracket, making it the least populous group.
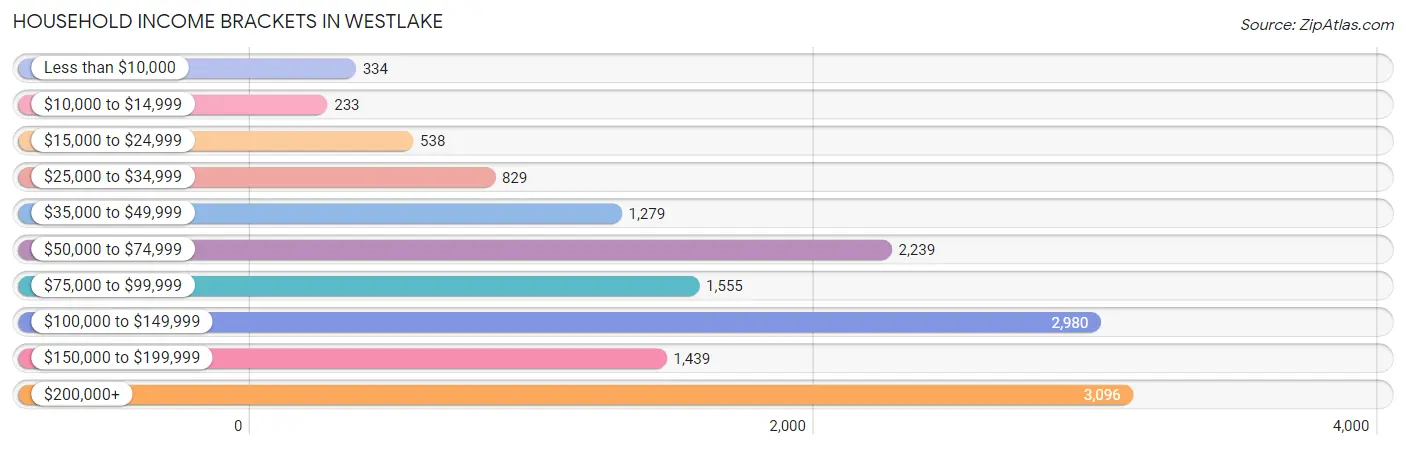
| Income Bracket | # Households | % Households |
| Less than $10,000 | 334 | 2.3% |
| $10,000 to $14,999 | 233 | 1.6% |
| $15,000 to $24,999 | 538 | 3.7% |
| $25,000 to $34,999 | 829 | 5.7% |
| $35,000 to $49,999 | 1,279 | 8.8% |
| $50,000 to $74,999 | 2,239 | 15.4% |
| $75,000 to $99,999 | 1,555 | 10.7% |
| $100,000 to $149,999 | 2,980 | 20.5% |
| $150,000 to $199,999 | 1,439 | 9.9% |
| $200,000+ | 3,096 | 21.3% |
Household Income by Householder Age in Westlake
The median household income in Westlake is $103,658, with the highest median household income of $134,757 found in the 45 to 64 years age bracket for the primary householder. A total of 5,583 households (38.4%) fall into this category. Meanwhile, the 15 to 24 years age bracket for the primary householder has the lowest median household income of $63,594, with 384 households (2.6%) in this group.
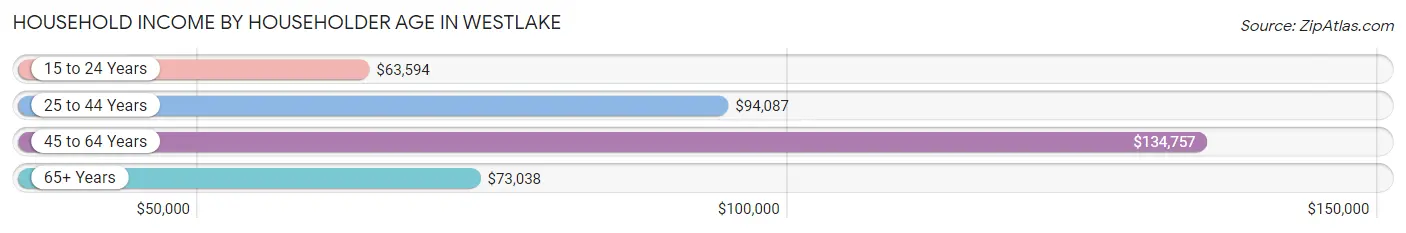
| Income Bracket | # Households | Median Income |
| 15 to 24 Years | 384 (2.6%) | $63,594 |
| 25 to 44 Years | 3,769 (25.9%) | $94,087 |
| 45 to 64 Years | 5,583 (38.4%) | $134,757 |
| 65+ Years | 4,801 (33.0%) | $73,038 |
| Total | 14,537 (100.0%) | $103,658 |
Poverty in Westlake
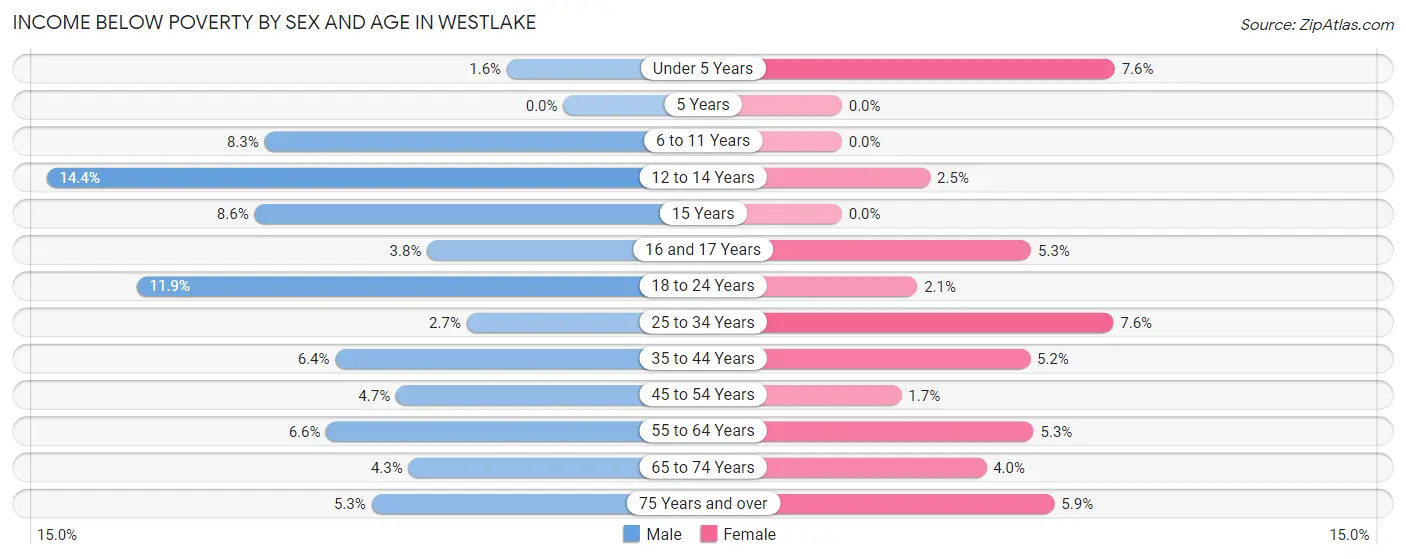
Income Below Poverty by Sex and Age in Westlake
With 5.7% poverty level for males and 4.3% for females among the residents of Westlake, 12 to 14 year old males and under 5 year old females are the most vulnerable to poverty, with 82 males (14.4%) and 63 females (7.6%) in their respective age groups living below the poverty level.
| Age Bracket | Male | Female |
| Under 5 Years | 12 (1.6%) | 63 (7.6%) |
| 5 Years | 0 (0.0%) | 0 (0.0%) |
| 6 to 11 Years | 104 (8.3%) | 0 (0.0%) |
| 12 to 14 Years | 82 (14.4%) | 21 (2.5%) |
| 15 Years | 8 (8.6%) | 0 (0.0%) |
| 16 and 17 Years | 22 (3.8%) | 34 (5.3%) |
| 18 to 24 Years | 114 (11.9%) | 28 (2.1%) |
| 25 to 34 Years | 57 (2.7%) | 130 (7.6%) |
| 35 to 44 Years | 98 (6.4%) | 88 (5.2%) |
| 45 to 54 Years | 104 (4.7%) | 38 (1.7%) |
| 55 to 64 Years | 163 (6.6%) | 142 (5.3%) |
| 65 to 74 Years | 85 (4.3%) | 92 (4.0%) |
| 75 Years and over | 63 (5.3%) | 113 (5.9%) |
| Total | 912 (5.7%) | 749 (4.3%) |
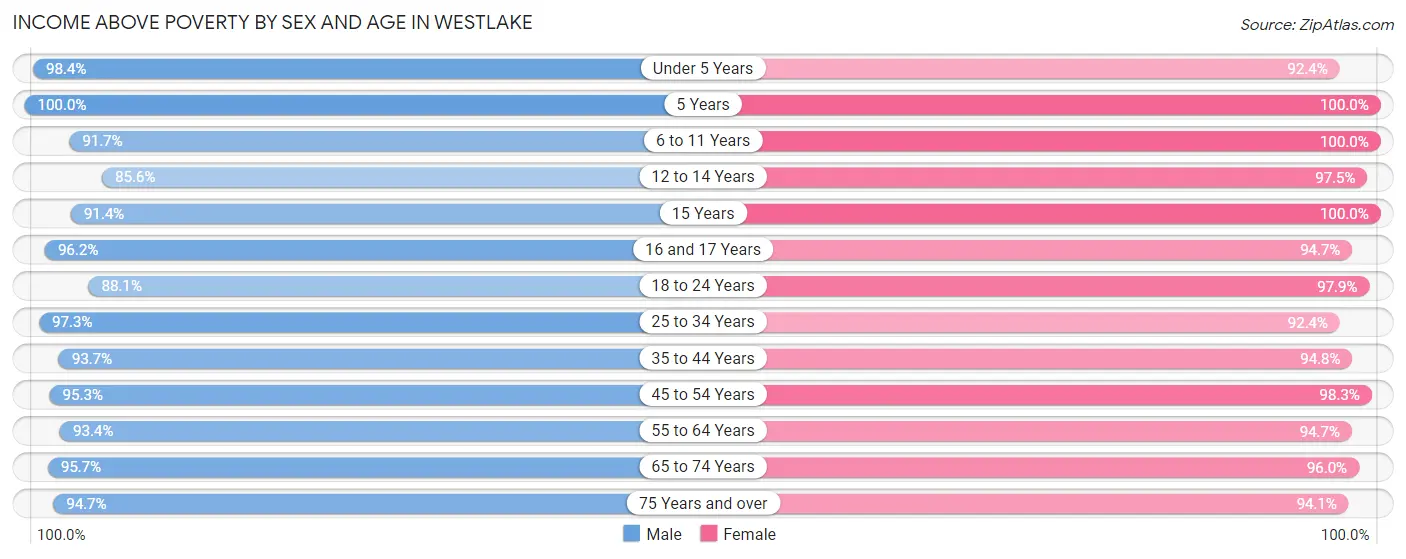
Income Above Poverty by Sex and Age in Westlake
According to the poverty statistics in Westlake, males aged 5 years and females aged 5 years are the age groups that are most secure financially, with 100.0% of males and 100.0% of females in these age groups living above the poverty line.
| Age Bracket | Male | Female |
| Under 5 Years | 752 (98.4%) | 766 (92.4%) |
| 5 Years | 147 (100.0%) | 17 (100.0%) |
| 6 to 11 Years | 1,146 (91.7%) | 960 (100.0%) |
| 12 to 14 Years | 488 (85.6%) | 832 (97.5%) |
| 15 Years | 85 (91.4%) | 124 (100.0%) |
| 16 and 17 Years | 559 (96.2%) | 611 (94.7%) |
| 18 to 24 Years | 846 (88.1%) | 1,306 (97.9%) |
| 25 to 34 Years | 2,062 (97.3%) | 1,590 (92.4%) |
| 35 to 44 Years | 1,445 (93.6%) | 1,591 (94.8%) |
| 45 to 54 Years | 2,128 (95.3%) | 2,253 (98.3%) |
| 55 to 64 Years | 2,305 (93.4%) | 2,516 (94.7%) |
| 65 to 74 Years | 1,888 (95.7%) | 2,198 (96.0%) |
| 75 Years and over | 1,117 (94.7%) | 1,796 (94.1%) |
| Total | 14,968 (94.3%) | 16,560 (95.7%) |
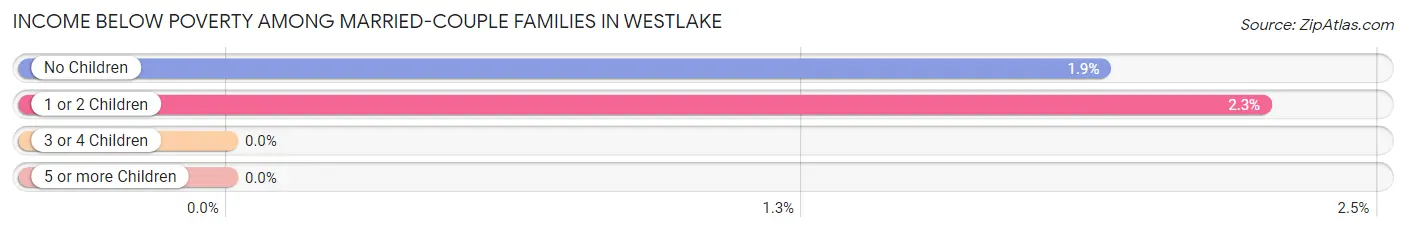
Income Below Poverty Among Married-Couple Families in Westlake
The poverty statistics for married-couple families in Westlake show that 1.8% or 131 of the total 7,224 families live below the poverty line. Families with 1 or 2 children have the highest poverty rate of 2.2%, comprising of 50 families. On the other hand, families with 3 or 4 children have the lowest poverty rate of 0.0%, which includes 0 families.
| Children | Above Poverty | Below Poverty |
| No Children | 4,190 (98.1%) | 81 (1.9%) |
| 1 or 2 Children | 2,171 (97.8%) | 50 (2.2%) |
| 3 or 4 Children | 667 (100.0%) | 0 (0.0%) |
| 5 or more Children | 65 (100.0%) | 0 (0.0%) |
| Total | 7,093 (98.2%) | 131 (1.8%) |
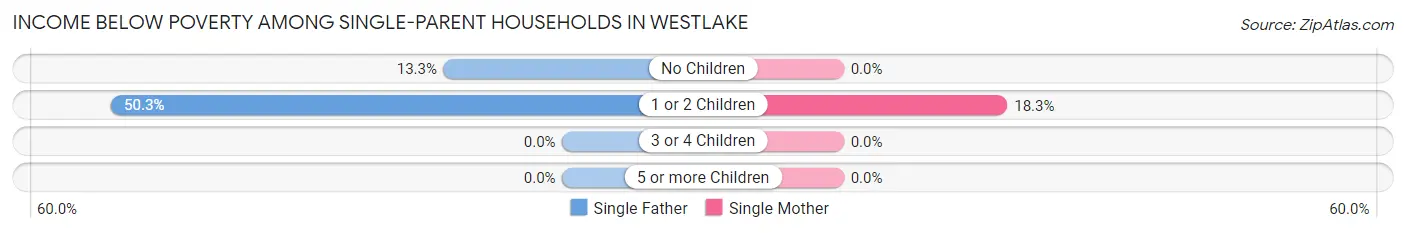
Income Below Poverty Among Single-Parent Households in Westlake
According to the poverty data in Westlake, 24.4% or 113 single-father households and 9.6% or 90 single-mother households are living below the poverty line. Among single-father households, those with 1 or 2 children have the highest poverty rate, with 78 households (50.3%) experiencing poverty. Likewise, among single-mother households, those with 1 or 2 children have the highest poverty rate, with 90 households (18.3%) falling below the poverty line.
| Children | Single Father | Single Mother |
| No Children | 35 (13.3%) | 0 (0.0%) |
| 1 or 2 Children | 78 (50.3%) | 90 (18.3%) |
| 3 or 4 Children | 0 (0.0%) | 0 (0.0%) |
| 5 or more Children | 0 (0.0%) | 0 (0.0%) |
| Total | 113 (24.4%) | 90 (9.6%) |
Income Below Poverty Among Married-Couple vs Single-Parent Households in Westlake
The poverty data for Westlake shows that 131 of the married-couple family households (1.8%) and 203 of the single-parent households (14.5%) are living below the poverty level. Within the married-couple family households, those with 1 or 2 children have the highest poverty rate, with 50 households (2.2%) falling below the poverty line. Among the single-parent households, those with 1 or 2 children have the highest poverty rate, with 168 household (26.0%) living below poverty.
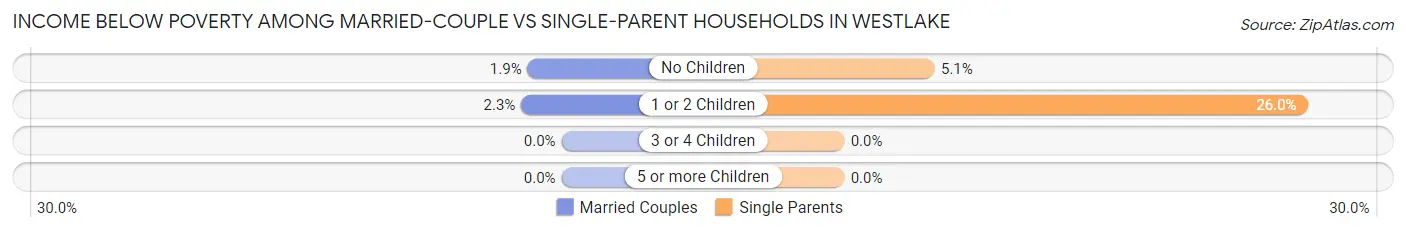
| Children | Married-Couple Families | Single-Parent Households |
| No Children | 81 (1.9%) | 35 (5.1%) |
| 1 or 2 Children | 50 (2.2%) | 168 (26.0%) |
| 3 or 4 Children | 0 (0.0%) | 0 (0.0%) |
| 5 or more Children | 0 (0.0%) | 0 (0.0%) |
| Total | 131 (1.8%) | 203 (14.5%) |
Employment Characteristics in Westlake
Employment by Class of Employer in Westlake
Among the 16,561 employed individuals in Westlake, private company employees (10,851 | 65.5%), not-for-profit organizations (2,019 | 12.2%), and local government employees (1,246 | 7.5%) make up the most common classes of employment.
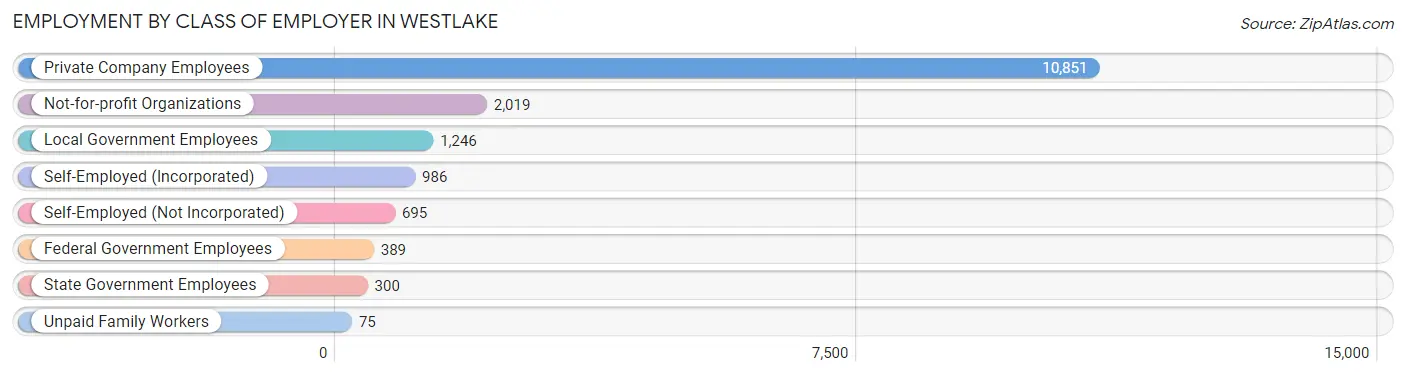
| Employer Class | # Employees | % Employees |
| Private Company Employees | 10,851 | 65.5% |
| Self-Employed (Incorporated) | 986 | 5.9% |
| Self-Employed (Not Incorporated) | 695 | 4.2% |
| Not-for-profit Organizations | 2,019 | 12.2% |
| Local Government Employees | 1,246 | 7.5% |
| State Government Employees | 300 | 1.8% |
| Federal Government Employees | 389 | 2.4% |
| Unpaid Family Workers | 75 | 0.4% |
| Total | 16,561 | 100.0% |
Employment Status by Age in Westlake
According to the labor force statistics for Westlake, out of the total population over 16 years of age (28,410), 61.7% or 17,529 individuals are in the labor force, with 3.6% or 631 of them unemployed. The age group with the highest labor force participation rate is 25 to 29 years, with 91.3% or 2,028 individuals in the labor force. Within the labor force, the 20 to 24 years age range has the highest percentage of unemployed individuals, with 11.1% or 171 of them being unemployed.
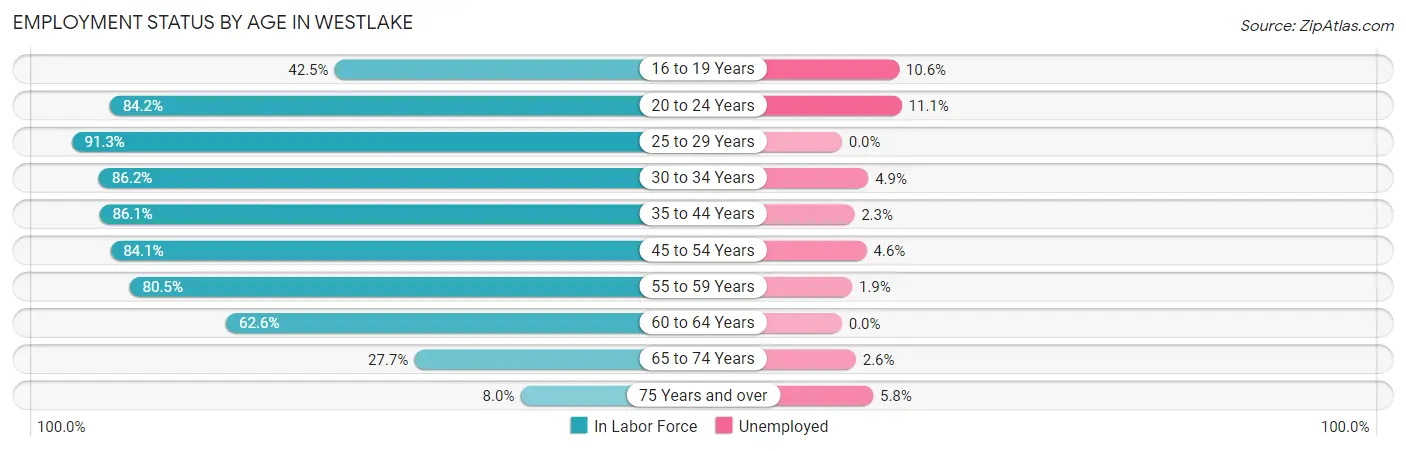
| Age Bracket | In Labor Force | Unemployed |
| 16 to 19 Years | 717 (42.5%) | 76 (10.6%) |
| 20 to 24 Years | 1,543 (84.2%) | 171 (11.1%) |
| 25 to 29 Years | 2,028 (91.3%) | 0 (0.0%) |
| 30 to 34 Years | 1,404 (86.2%) | 69 (4.9%) |
| 35 to 44 Years | 2,780 (86.1%) | 64 (2.3%) |
| 45 to 54 Years | 3,832 (84.1%) | 176 (4.6%) |
| 55 to 59 Years | 1,859 (80.5%) | 35 (1.9%) |
| 60 to 64 Years | 1,841 (62.6%) | 0 (0.0%) |
| 65 to 74 Years | 1,250 (27.7%) | 32 (2.6%) |
| 75 Years and over | 279 (8.0%) | 16 (5.8%) |
| Total | 17,529 (61.7%) | 631 (3.6%) |
Employment Status by Educational Attainment in Westlake
According to labor force statistics for Westlake, 81.4% of individuals (13,745) out of the total population between 25 and 64 years of age (16,886) are in the labor force, with 2.5% or 344 of them being unemployed. The group with the highest labor force participation rate are those with the educational attainment of bachelor's degree or higher, with 84.1% or 9,003 individuals in the labor force. Within the labor force, individuals with less than high school education have the highest percentage of unemployment, with 6.1% or 18 of them being unemployed.
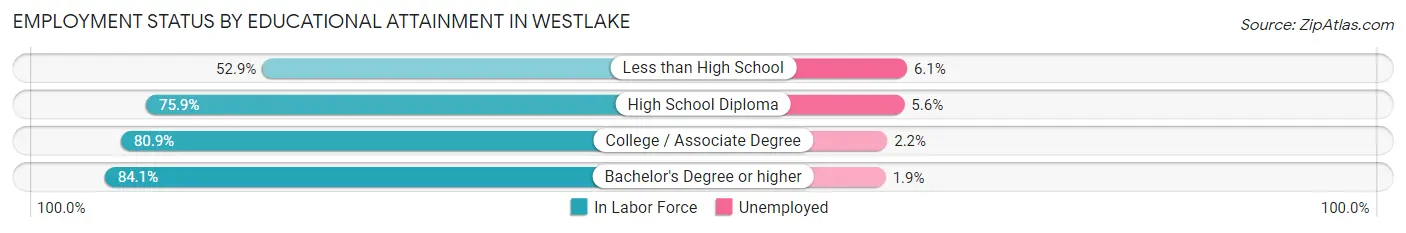
| Educational Attainment | In Labor Force | Unemployed |
| Less than High School | 296 (52.9%) | 34 (6.1%) |
| High School Diploma | 1,601 (75.9%) | 118 (5.6%) |
| College / Associate Degree | 2,841 (80.9%) | 77 (2.2%) |
| Bachelor's Degree or higher | 9,003 (84.1%) | 203 (1.9%) |
| Total | 13,745 (81.4%) | 422 (2.5%) |
Employment Occupations by Sex in Westlake
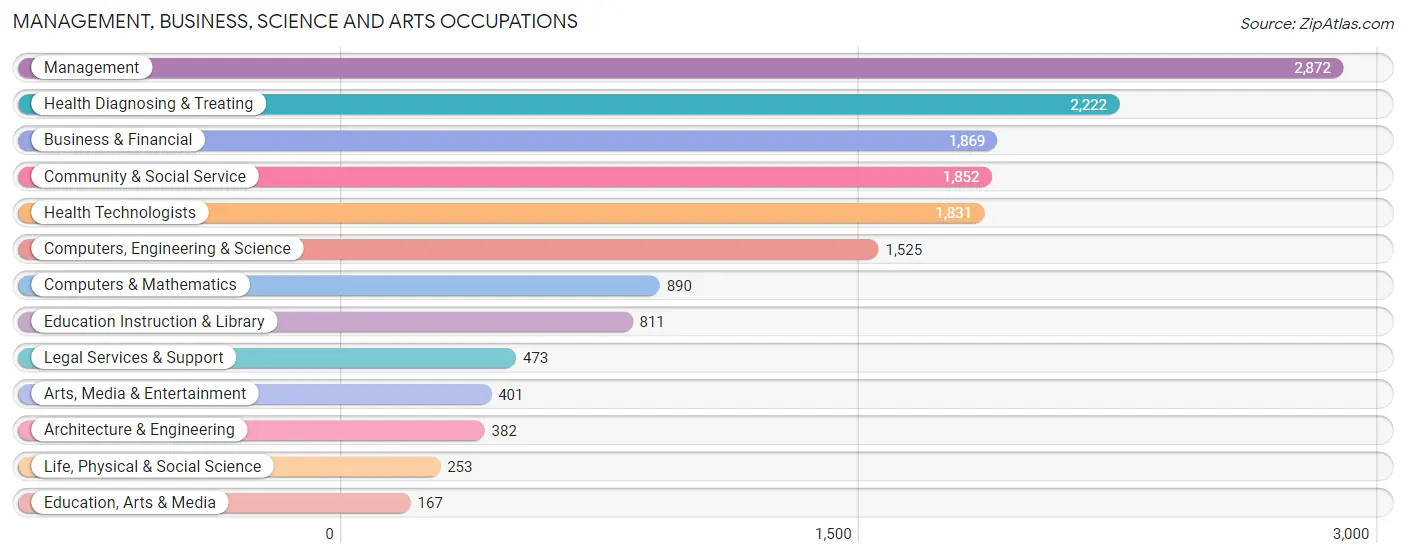
Management, Business, Science and Arts Occupations
The most common Management, Business, Science and Arts occupations in Westlake are Management (2,872 | 17.0%), Health Diagnosing & Treating (2,222 | 13.2%), Business & Financial (1,869 | 11.1%), Community & Social Service (1,852 | 11.0%), and Health Technologists (1,831 | 10.8%).
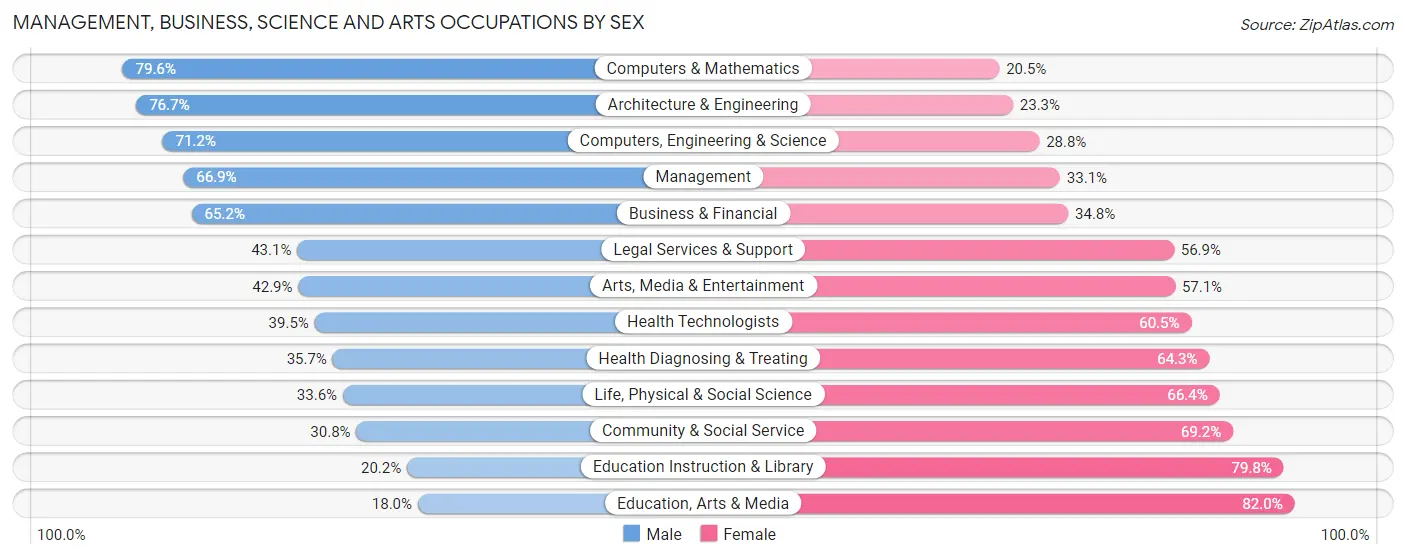
Management, Business, Science and Arts Occupations by Sex
Within the Management, Business, Science and Arts occupations in Westlake, the most male-oriented occupations are Computers & Mathematics (79.5%), Architecture & Engineering (76.7%), and Computers, Engineering & Science (71.2%), while the most female-oriented occupations are Education, Arts & Media (82.0%), Education Instruction & Library (79.8%), and Community & Social Service (69.2%).
| Occupation | Male | Female |
| Management | 1,921 (66.9%) | 951 (33.1%) |
| Business & Financial | 1,218 (65.2%) | 651 (34.8%) |
| Computers, Engineering & Science | 1,086 (71.2%) | 439 (28.8%) |
| Computers & Mathematics | 708 (79.5%) | 182 (20.4%) |
| Architecture & Engineering | 293 (76.7%) | 89 (23.3%) |
| Life, Physical & Social Science | 85 (33.6%) | 168 (66.4%) |
| Community & Social Service | 570 (30.8%) | 1,282 (69.2%) |
| Education, Arts & Media | 30 (18.0%) | 137 (82.0%) |
| Legal Services & Support | 204 (43.1%) | 269 (56.9%) |
| Education Instruction & Library | 164 (20.2%) | 647 (79.8%) |
| Arts, Media & Entertainment | 172 (42.9%) | 229 (57.1%) |
| Health Diagnosing & Treating | 794 (35.7%) | 1,428 (64.3%) |
| Health Technologists | 723 (39.5%) | 1,108 (60.5%) |
| Total (Category) | 5,589 (54.0%) | 4,751 (46.0%) |
| Total (Overall) | 8,979 (53.1%) | 7,916 (46.9%) |
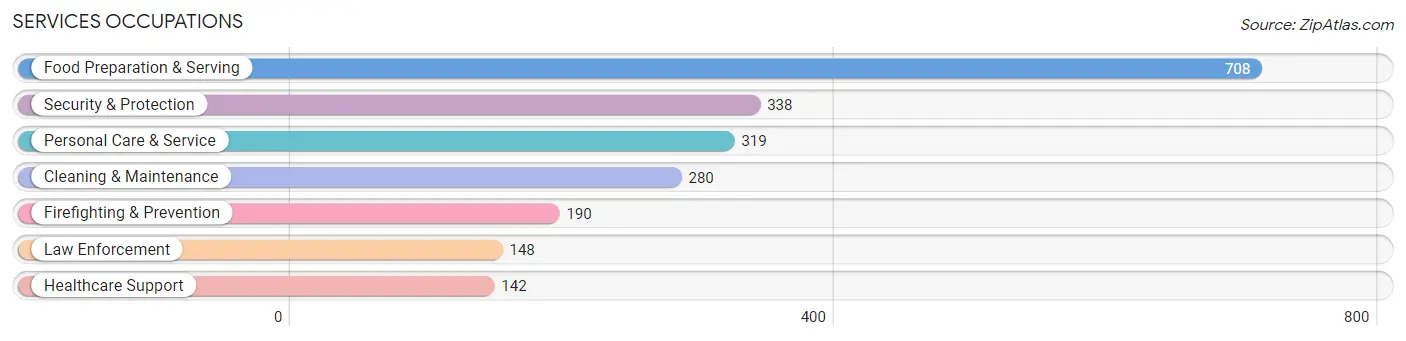
Services Occupations
The most common Services occupations in Westlake are Food Preparation & Serving (708 | 4.2%), Security & Protection (338 | 2.0%), Personal Care & Service (319 | 1.9%), Cleaning & Maintenance (280 | 1.7%), and Firefighting & Prevention (190 | 1.1%).
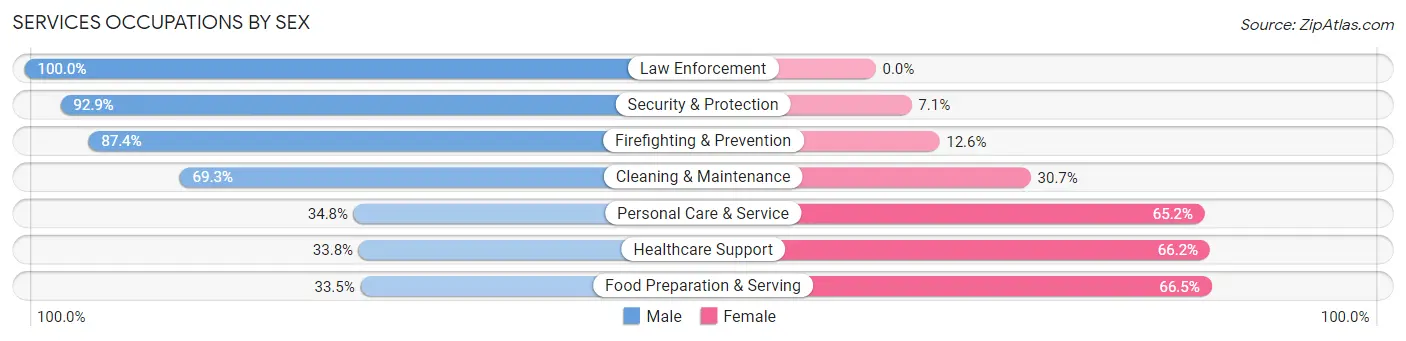
Services Occupations by Sex
Within the Services occupations in Westlake, the most male-oriented occupations are Law Enforcement (100.0%), Security & Protection (92.9%), and Firefighting & Prevention (87.4%), while the most female-oriented occupations are Food Preparation & Serving (66.5%), Healthcare Support (66.2%), and Personal Care & Service (65.2%).
| Occupation | Male | Female |
| Healthcare Support | 48 (33.8%) | 94 (66.2%) |
| Security & Protection | 314 (92.9%) | 24 (7.1%) |
| Firefighting & Prevention | 166 (87.4%) | 24 (12.6%) |
| Law Enforcement | 148 (100.0%) | 0 (0.0%) |
| Food Preparation & Serving | 237 (33.5%) | 471 (66.5%) |
| Cleaning & Maintenance | 194 (69.3%) | 86 (30.7%) |
| Personal Care & Service | 111 (34.8%) | 208 (65.2%) |
| Total (Category) | 904 (50.6%) | 883 (49.4%) |
| Total (Overall) | 8,979 (53.1%) | 7,916 (46.9%) |
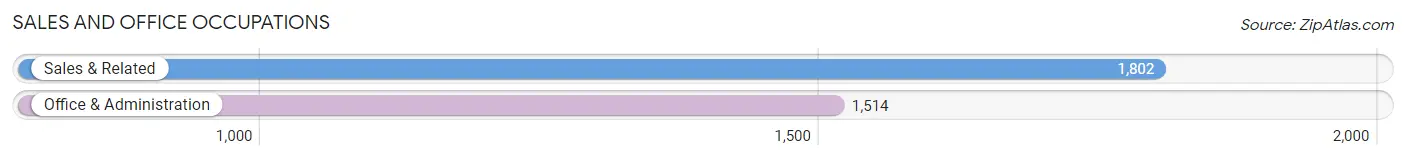
Sales and Office Occupations
The most common Sales and Office occupations in Westlake are Sales & Related (1,802 | 10.7%), and Office & Administration (1,514 | 9.0%).
Sales and Office Occupations by Sex
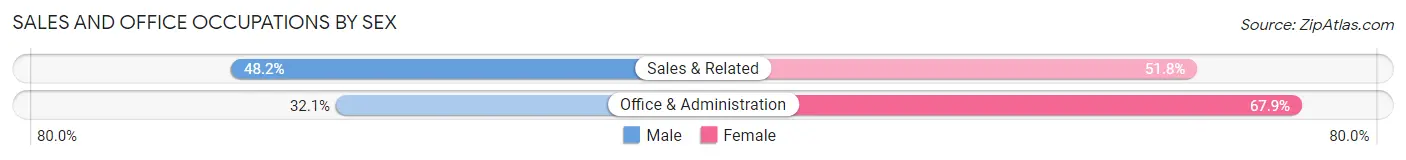
| Occupation | Male | Female |
| Sales & Related | 869 (48.2%) | 933 (51.8%) |
| Office & Administration | 486 (32.1%) | 1,028 (67.9%) |
| Total (Category) | 1,355 (40.9%) | 1,961 (59.1%) |
| Total (Overall) | 8,979 (53.1%) | 7,916 (46.9%) |
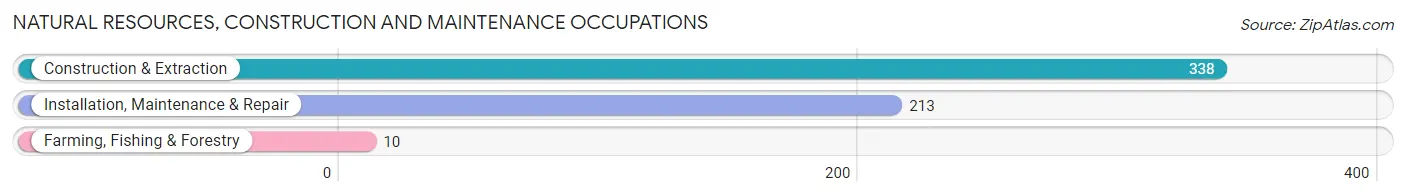
Natural Resources, Construction and Maintenance Occupations
The most common Natural Resources, Construction and Maintenance occupations in Westlake are Construction & Extraction (338 | 2.0%), Installation, Maintenance & Repair (213 | 1.3%), and Farming, Fishing & Forestry (10 | 0.1%).
Natural Resources, Construction and Maintenance Occupations by Sex
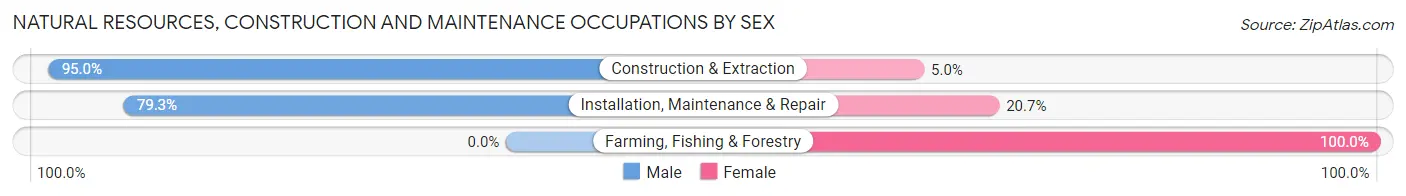
| Occupation | Male | Female |
| Farming, Fishing & Forestry | 0 (0.0%) | 10 (100.0%) |
| Construction & Extraction | 321 (95.0%) | 17 (5.0%) |
| Installation, Maintenance & Repair | 169 (79.3%) | 44 (20.7%) |
| Total (Category) | 490 (87.3%) | 71 (12.7%) |
| Total (Overall) | 8,979 (53.1%) | 7,916 (46.9%) |
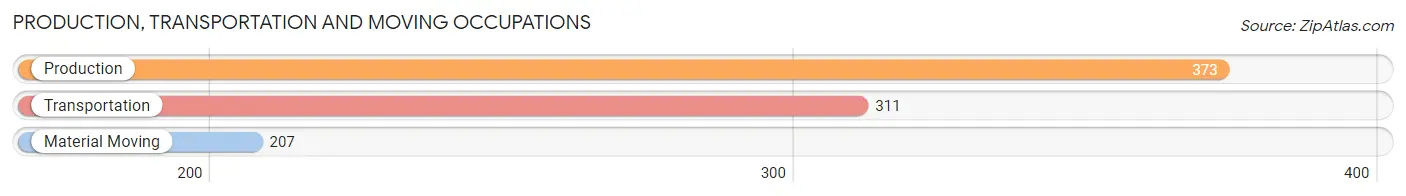
Production, Transportation and Moving Occupations
The most common Production, Transportation and Moving occupations in Westlake are Production (373 | 2.2%), Transportation (311 | 1.8%), and Material Moving (207 | 1.2%).
Production, Transportation and Moving Occupations by Sex
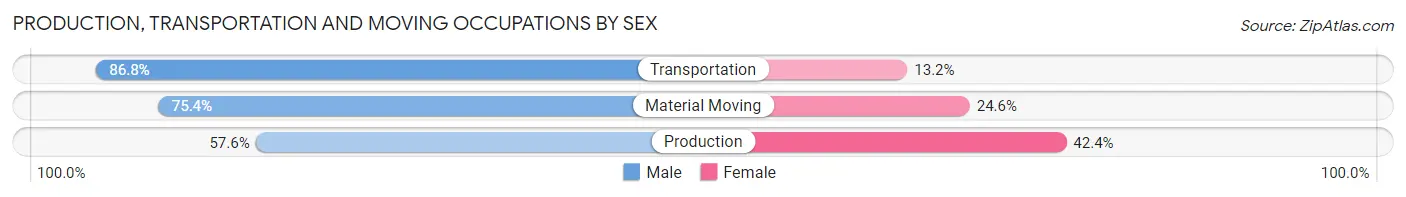
| Occupation | Male | Female |
| Production | 215 (57.6%) | 158 (42.4%) |
| Transportation | 270 (86.8%) | 41 (13.2%) |
| Material Moving | 156 (75.4%) | 51 (24.6%) |
| Total (Category) | 641 (71.9%) | 250 (28.1%) |
| Total (Overall) | 8,979 (53.1%) | 7,916 (46.9%) |
Employment Industries by Sex in Westlake
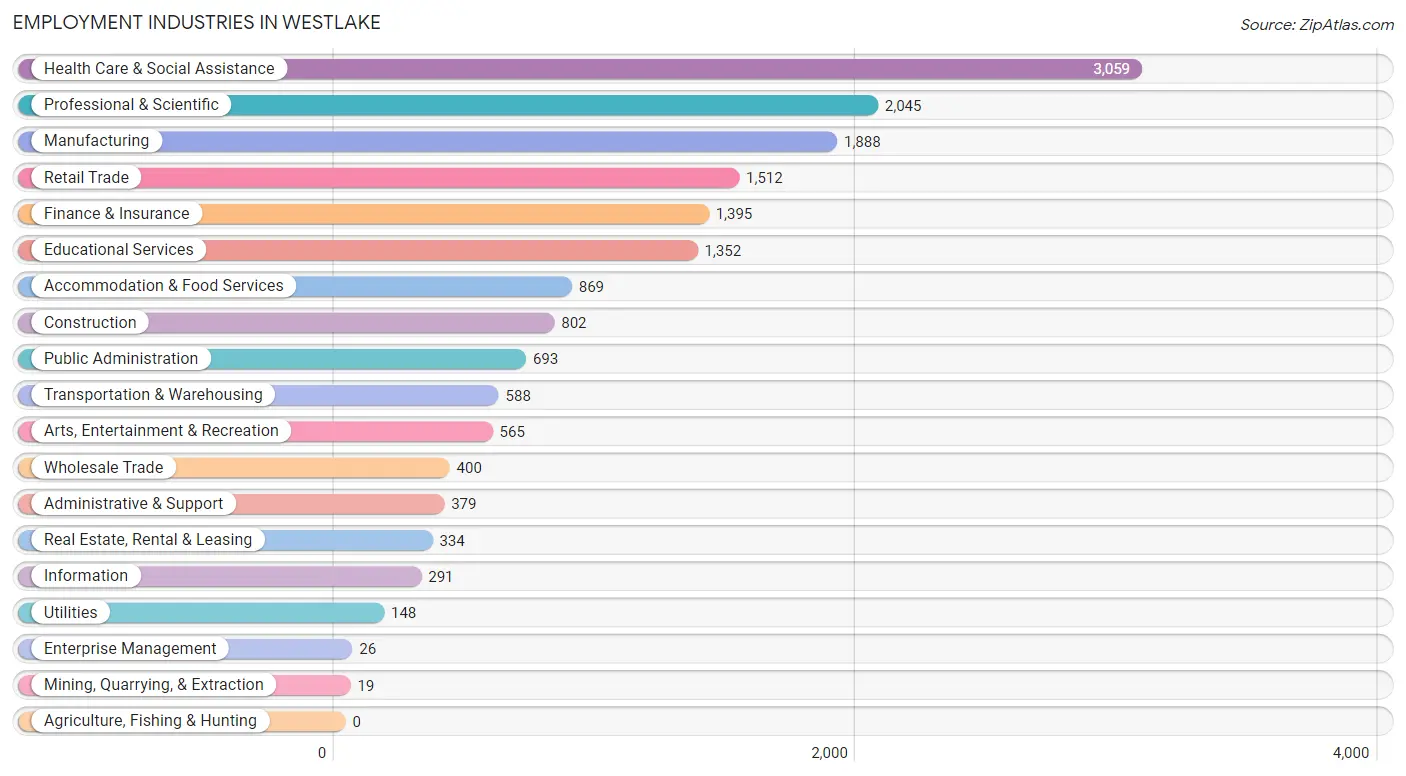
Employment Industries in Westlake
The major employment industries in Westlake include Health Care & Social Assistance (3,059 | 18.1%), Professional & Scientific (2,045 | 12.1%), Manufacturing (1,888 | 11.2%), Retail Trade (1,512 | 8.9%), and Finance & Insurance (1,395 | 8.3%).
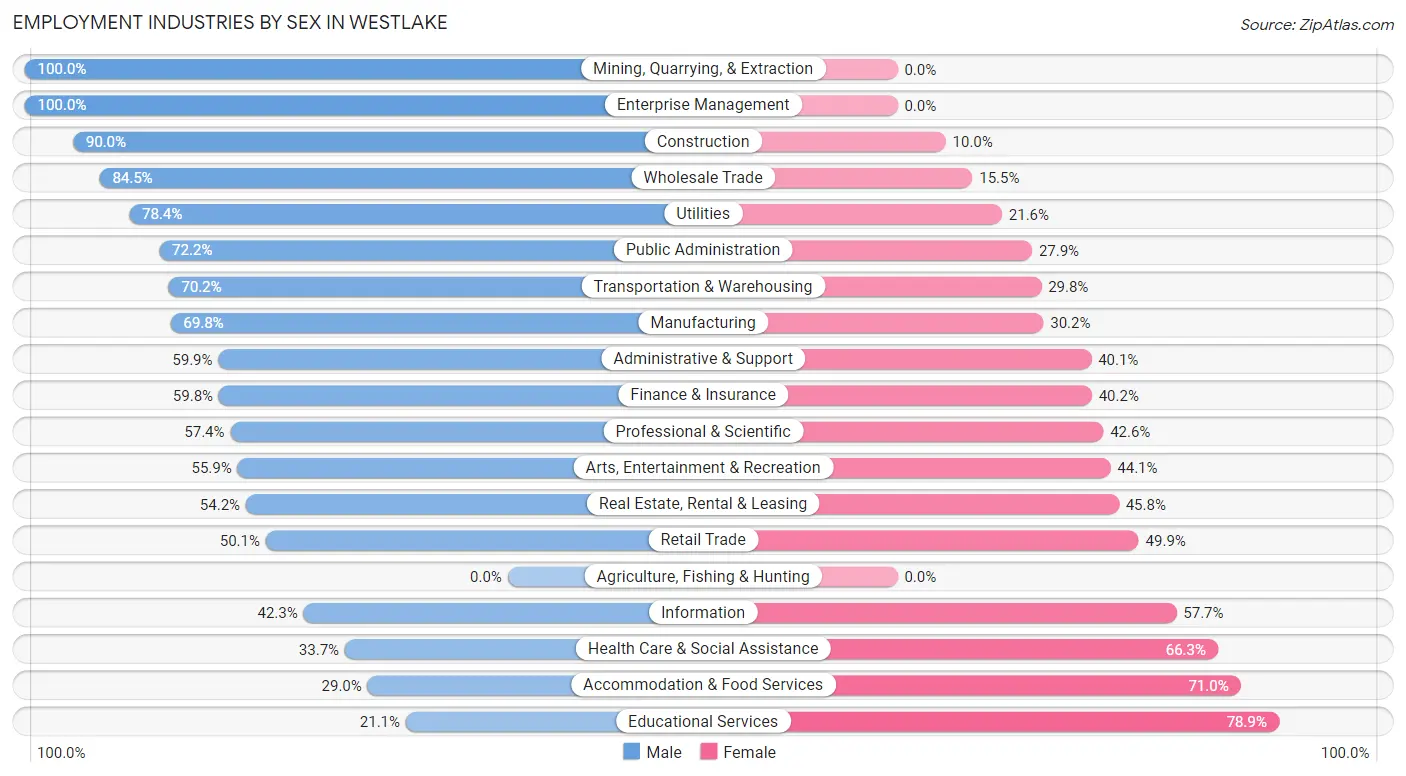
Employment Industries by Sex in Westlake
The Westlake industries that see more men than women are Mining, Quarrying, & Extraction (100.0%), Enterprise Management (100.0%), and Construction (90.0%), whereas the industries that tend to have a higher number of women are Educational Services (78.9%), Accommodation & Food Services (71.0%), and Health Care & Social Assistance (66.3%).
| Industry | Male | Female |
| Agriculture, Fishing & Hunting | 0 (0.0%) | 0 (0.0%) |
| Mining, Quarrying, & Extraction | 19 (100.0%) | 0 (0.0%) |
| Construction | 722 (90.0%) | 80 (10.0%) |
| Manufacturing | 1,318 (69.8%) | 570 (30.2%) |
| Wholesale Trade | 338 (84.5%) | 62 (15.5%) |
| Retail Trade | 757 (50.1%) | 755 (49.9%) |
| Transportation & Warehousing | 413 (70.2%) | 175 (29.8%) |
| Utilities | 116 (78.4%) | 32 (21.6%) |
| Information | 123 (42.3%) | 168 (57.7%) |
| Finance & Insurance | 834 (59.8%) | 561 (40.2%) |
| Real Estate, Rental & Leasing | 181 (54.2%) | 153 (45.8%) |
| Professional & Scientific | 1,174 (57.4%) | 871 (42.6%) |
| Enterprise Management | 26 (100.0%) | 0 (0.0%) |
| Administrative & Support | 227 (59.9%) | 152 (40.1%) |
| Educational Services | 285 (21.1%) | 1,067 (78.9%) |
| Health Care & Social Assistance | 1,031 (33.7%) | 2,028 (66.3%) |
| Arts, Entertainment & Recreation | 316 (55.9%) | 249 (44.1%) |
| Accommodation & Food Services | 252 (29.0%) | 617 (71.0%) |
| Public Administration | 500 (72.2%) | 193 (27.9%) |
| Total | 8,979 (53.1%) | 7,916 (46.9%) |
Education in Westlake
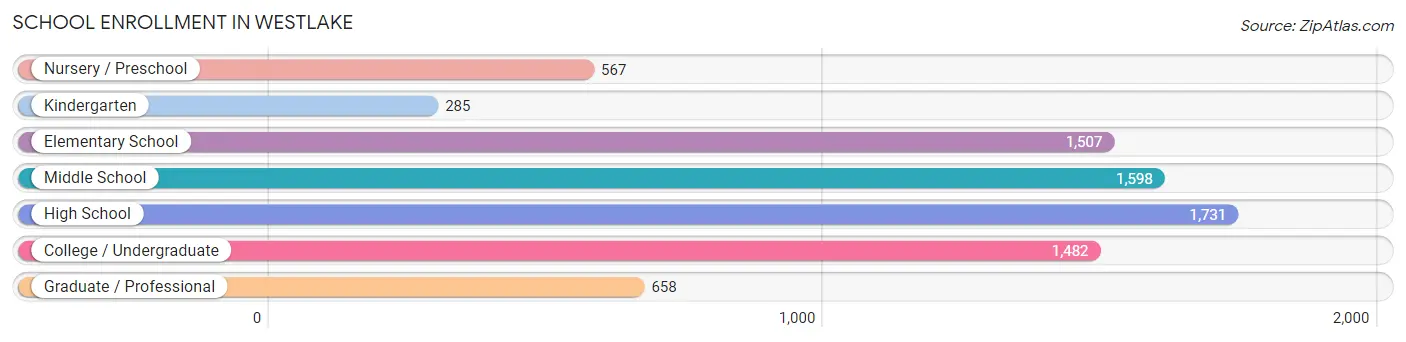
School Enrollment in Westlake
The most common levels of schooling among the 7,828 students in Westlake are high school (1,731 | 22.1%), middle school (1,598 | 20.4%), and elementary school (1,507 | 19.3%).
| School Level | # Students | % Students |
| Nursery / Preschool | 567 | 7.2% |
| Kindergarten | 285 | 3.6% |
| Elementary School | 1,507 | 19.3% |
| Middle School | 1,598 | 20.4% |
| High School | 1,731 | 22.1% |
| College / Undergraduate | 1,482 | 18.9% |
| Graduate / Professional | 658 | 8.4% |
| Total | 7,828 | 100.0% |
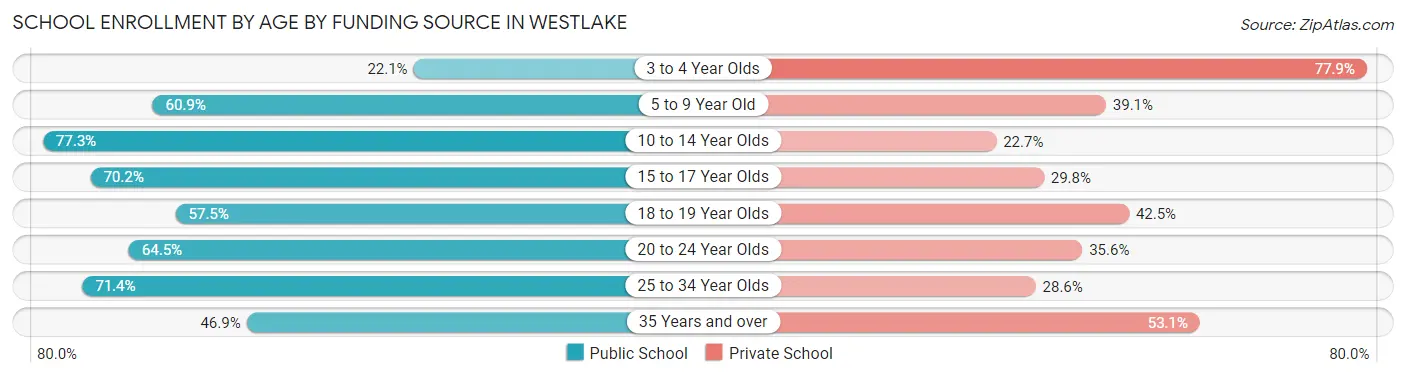
School Enrollment by Age by Funding Source in Westlake
Out of a total of 7,828 students who are enrolled in schools in Westlake, 2,763 (35.3%) attend a private institution, while the remaining 5,065 (64.7%) are enrolled in public schools. The age group of 3 to 4 year olds has the highest likelihood of being enrolled in private schools, with 417 (77.9% in the age bracket) enrolled. Conversely, the age group of 10 to 14 year olds has the lowest likelihood of being enrolled in a private school, with 1,720 (77.3% in the age bracket) attending a public institution.
| Age Bracket | Public School | Private School |
| 3 to 4 Year Olds | 118 (22.1%) | 417 (77.9%) |
| 5 to 9 Year Old | 903 (60.9%) | 579 (39.1%) |
| 10 to 14 Year Olds | 1,720 (77.3%) | 506 (22.7%) |
| 15 to 17 Year Olds | 951 (70.2%) | 404 (29.8%) |
| 18 to 19 Year Olds | 188 (57.5%) | 139 (42.5%) |
| 20 to 24 Year Olds | 620 (64.4%) | 342 (35.5%) |
| 25 to 34 Year Olds | 357 (71.4%) | 143 (28.6%) |
| 35 Years and over | 207 (46.9%) | 234 (53.1%) |
| Total | 5,065 (64.7%) | 2,763 (35.3%) |
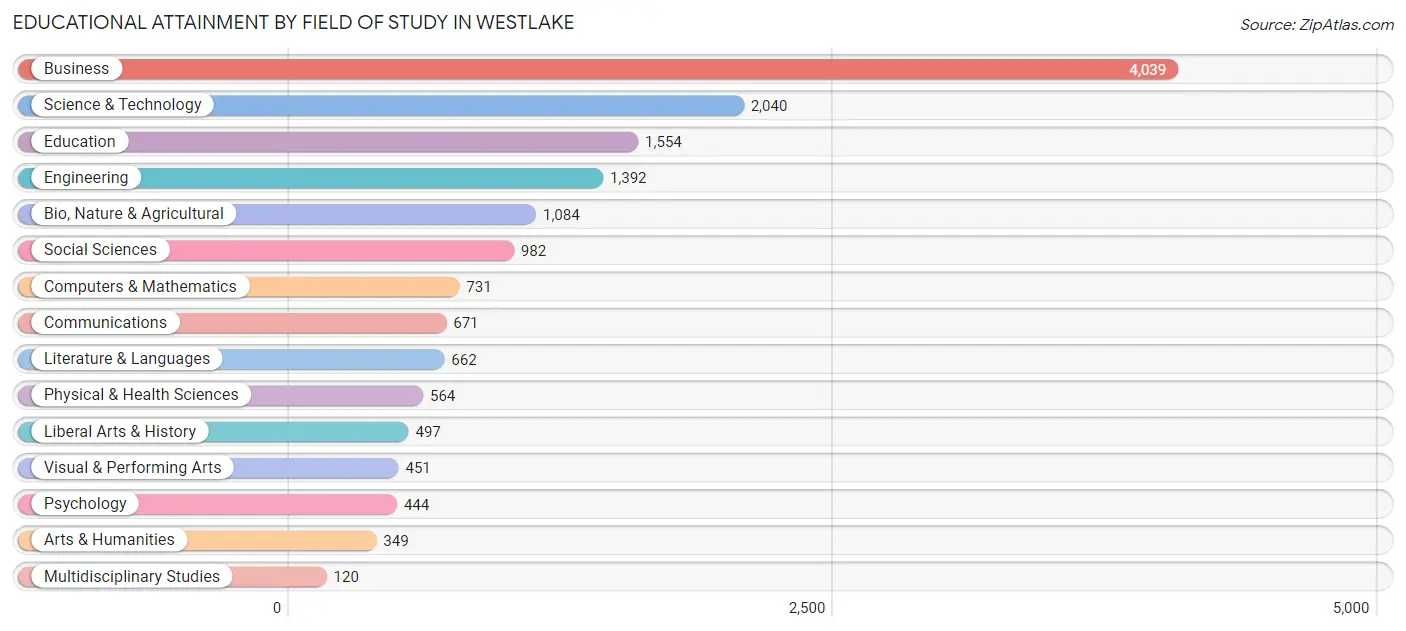
Educational Attainment by Field of Study in Westlake
Business (4,039 | 25.9%), science & technology (2,040 | 13.1%), education (1,554 | 10.0%), engineering (1,392 | 8.9%), and bio, nature & agricultural (1,084 | 7.0%) are the most common fields of study among 15,580 individuals in Westlake who have obtained a bachelor's degree or higher.
| Field of Study | # Graduates | % Graduates |
| Computers & Mathematics | 731 | 4.7% |
| Bio, Nature & Agricultural | 1,084 | 7.0% |
| Physical & Health Sciences | 564 | 3.6% |
| Psychology | 444 | 2.9% |
| Social Sciences | 982 | 6.3% |
| Engineering | 1,392 | 8.9% |
| Multidisciplinary Studies | 120 | 0.8% |
| Science & Technology | 2,040 | 13.1% |
| Business | 4,039 | 25.9% |
| Education | 1,554 | 10.0% |
| Literature & Languages | 662 | 4.3% |
| Liberal Arts & History | 497 | 3.2% |
| Visual & Performing Arts | 451 | 2.9% |
| Communications | 671 | 4.3% |
| Arts & Humanities | 349 | 2.2% |
| Total | 15,580 | 100.0% |
Transportation & Commute in Westlake
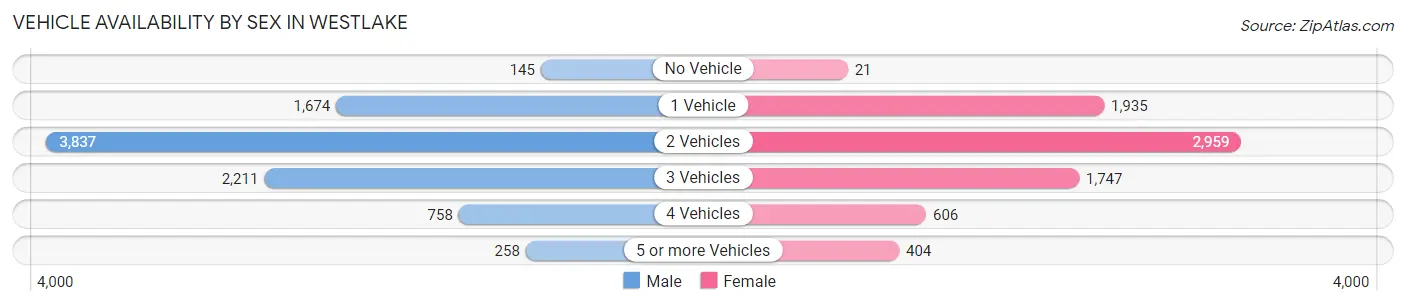
Vehicle Availability by Sex in Westlake
The most prevalent vehicle ownership categories in Westlake are males with 2 vehicles (3,837, accounting for 43.2%) and females with 2 vehicles (2,959, making up 50.0%).
| Vehicles Available | Male | Female |
| No Vehicle | 145 (1.6%) | 21 (0.3%) |
| 1 Vehicle | 1,674 (18.8%) | 1,935 (25.2%) |
| 2 Vehicles | 3,837 (43.2%) | 2,959 (38.6%) |
| 3 Vehicles | 2,211 (24.9%) | 1,747 (22.8%) |
| 4 Vehicles | 758 (8.5%) | 606 (7.9%) |
| 5 or more Vehicles | 258 (2.9%) | 404 (5.3%) |
| Total | 8,883 (100.0%) | 7,672 (100.0%) |
Commute Time in Westlake
The most frequently occuring commute durations in Westlake are 20 to 24 minutes (2,260 commuters, 16.6%), 15 to 19 minutes (1,879 commuters, 13.8%), and 30 to 34 minutes (1,808 commuters, 13.3%).
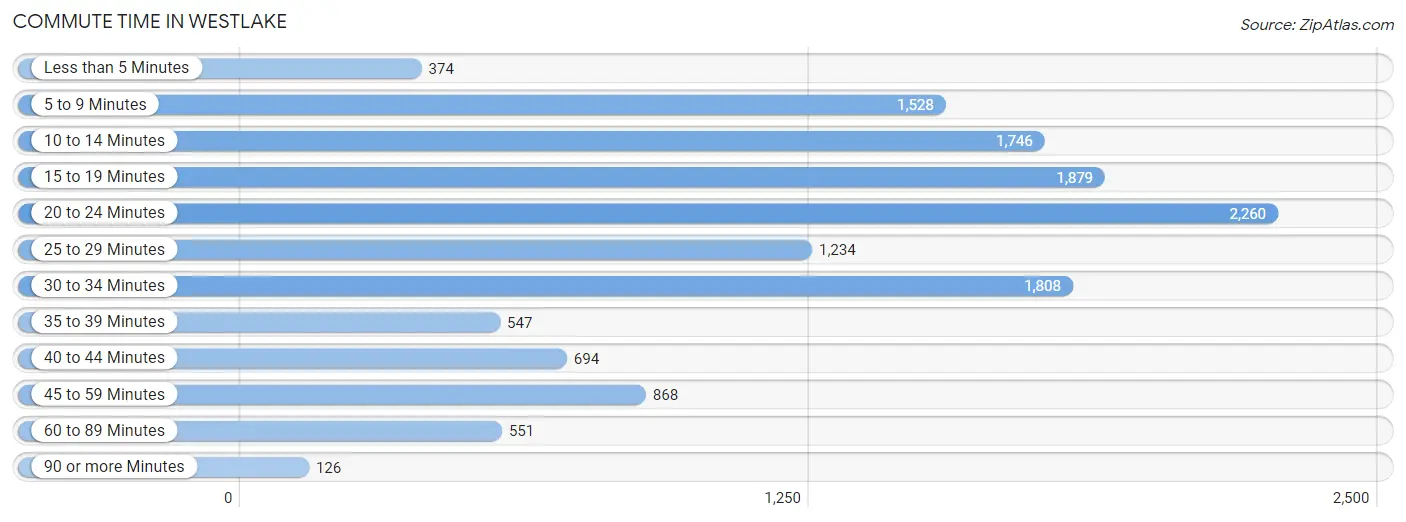
| Commute Time | # Commuters | % Commuters |
| Less than 5 Minutes | 374 | 2.8% |
| 5 to 9 Minutes | 1,528 | 11.2% |
| 10 to 14 Minutes | 1,746 | 12.8% |
| 15 to 19 Minutes | 1,879 | 13.8% |
| 20 to 24 Minutes | 2,260 | 16.6% |
| 25 to 29 Minutes | 1,234 | 9.1% |
| 30 to 34 Minutes | 1,808 | 13.3% |
| 35 to 39 Minutes | 547 | 4.0% |
| 40 to 44 Minutes | 694 | 5.1% |
| 45 to 59 Minutes | 868 | 6.4% |
| 60 to 89 Minutes | 551 | 4.1% |
| 90 or more Minutes | 126 | 0.9% |
Commute Time by Sex in Westlake
The most common commute times in Westlake are 20 to 24 minutes (1,190 commuters, 16.3%) for males and 20 to 24 minutes (1,070 commuters, 16.9%) for females.
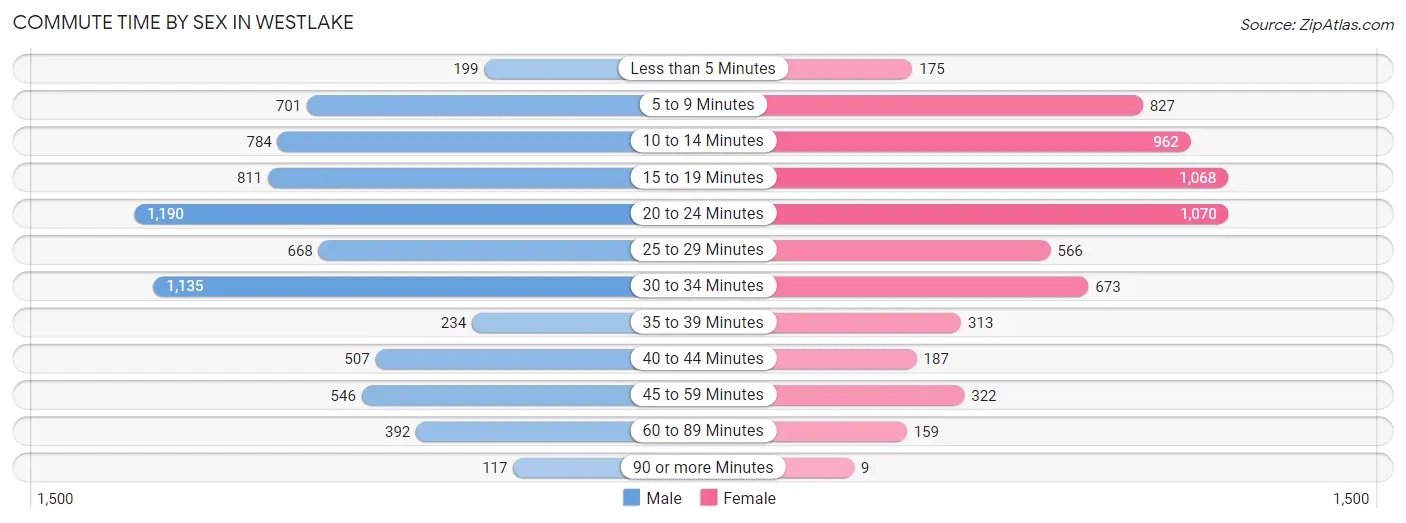
| Commute Time | Male | Female |
| Less than 5 Minutes | 199 (2.7%) | 175 (2.8%) |
| 5 to 9 Minutes | 701 (9.6%) | 827 (13.1%) |
| 10 to 14 Minutes | 784 (10.8%) | 962 (15.2%) |
| 15 to 19 Minutes | 811 (11.1%) | 1,068 (16.9%) |
| 20 to 24 Minutes | 1,190 (16.3%) | 1,070 (16.9%) |
| 25 to 29 Minutes | 668 (9.2%) | 566 (8.9%) |
| 30 to 34 Minutes | 1,135 (15.6%) | 673 (10.6%) |
| 35 to 39 Minutes | 234 (3.2%) | 313 (4.9%) |
| 40 to 44 Minutes | 507 (7.0%) | 187 (2.9%) |
| 45 to 59 Minutes | 546 (7.5%) | 322 (5.1%) |
| 60 to 89 Minutes | 392 (5.4%) | 159 (2.5%) |
| 90 or more Minutes | 117 (1.6%) | 9 (0.1%) |
Time of Departure to Work by Sex in Westlake
The most frequent times of departure to work in Westlake are 7:00 AM to 7:29 AM (1,112, 15.3%) for males and 8:00 AM to 8:29 AM (1,031, 16.3%) for females.
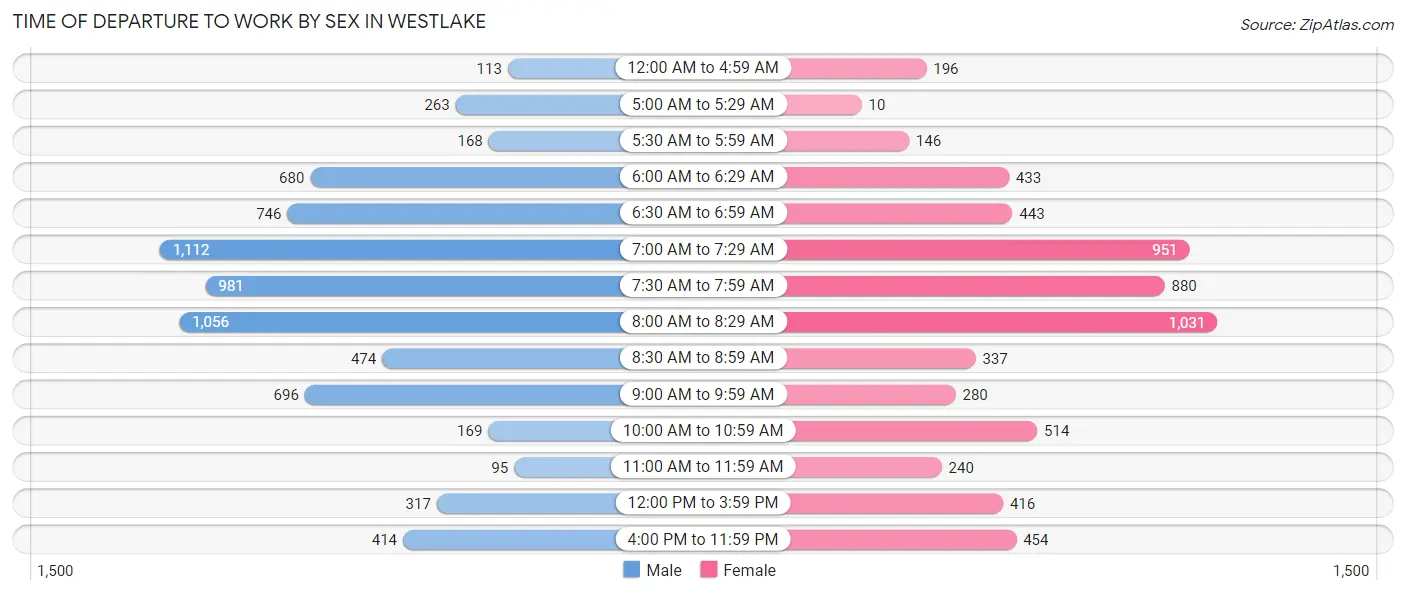
| Time of Departure | Male | Female |
| 12:00 AM to 4:59 AM | 113 (1.5%) | 196 (3.1%) |
| 5:00 AM to 5:29 AM | 263 (3.6%) | 10 (0.2%) |
| 5:30 AM to 5:59 AM | 168 (2.3%) | 146 (2.3%) |
| 6:00 AM to 6:29 AM | 680 (9.3%) | 433 (6.8%) |
| 6:30 AM to 6:59 AM | 746 (10.2%) | 443 (7.0%) |
| 7:00 AM to 7:29 AM | 1,112 (15.3%) | 951 (15.0%) |
| 7:30 AM to 7:59 AM | 981 (13.5%) | 880 (13.9%) |
| 8:00 AM to 8:29 AM | 1,056 (14.5%) | 1,031 (16.3%) |
| 8:30 AM to 8:59 AM | 474 (6.5%) | 337 (5.3%) |
| 9:00 AM to 9:59 AM | 696 (9.6%) | 280 (4.4%) |
| 10:00 AM to 10:59 AM | 169 (2.3%) | 514 (8.1%) |
| 11:00 AM to 11:59 AM | 95 (1.3%) | 240 (3.8%) |
| 12:00 PM to 3:59 PM | 317 (4.3%) | 416 (6.6%) |
| 4:00 PM to 11:59 PM | 414 (5.7%) | 454 (7.2%) |
| Total | 7,284 (100.0%) | 6,331 (100.0%) |
Housing Occupancy in Westlake
Occupancy by Ownership in Westlake
Of the total 14,537 dwellings in Westlake, owner-occupied units account for 10,482 (72.1%), while renter-occupied units make up 4,055 (27.9%).
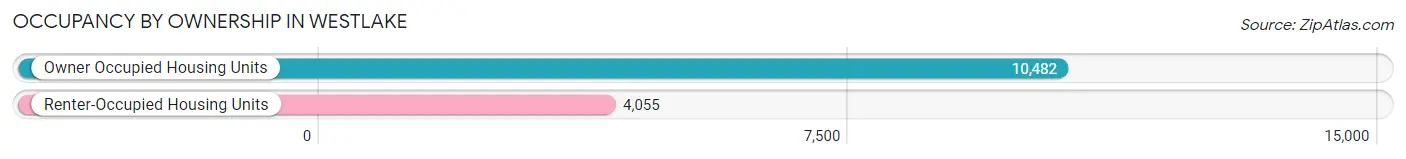
| Occupancy | # Housing Units | % Housing Units |
| Owner Occupied Housing Units | 10,482 | 72.1% |
| Renter-Occupied Housing Units | 4,055 | 27.9% |
| Total Occupied Housing Units | 14,537 | 100.0% |
Occupancy by Household Size in Westlake
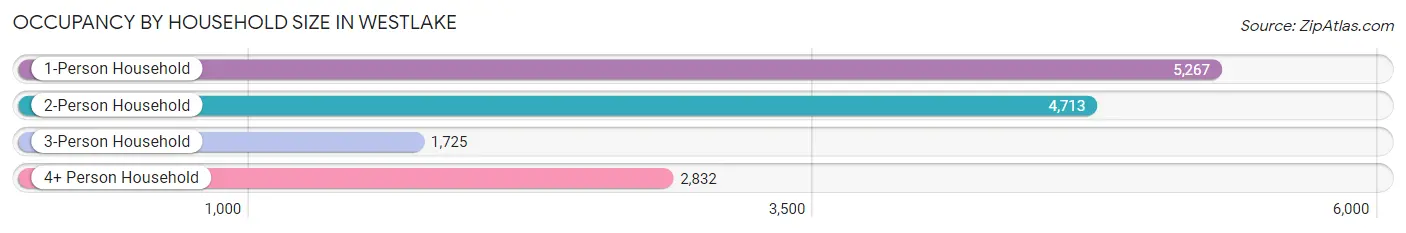
| Household Size | # Housing Units | % Housing Units |
| 1-Person Household | 5,267 | 36.2% |
| 2-Person Household | 4,713 | 32.4% |
| 3-Person Household | 1,725 | 11.9% |
| 4+ Person Household | 2,832 | 19.5% |
| Total Housing Units | 14,537 | 100.0% |
Occupancy by Ownership by Household Size in Westlake
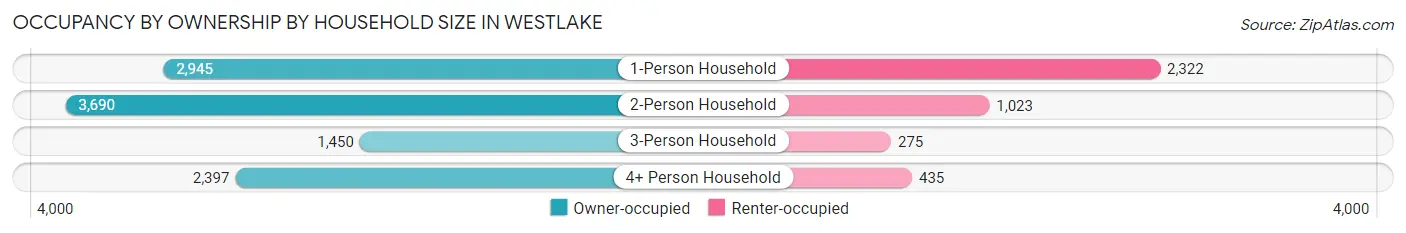
| Household Size | Owner-occupied | Renter-occupied |
| 1-Person Household | 2,945 (55.9%) | 2,322 (44.1%) |
| 2-Person Household | 3,690 (78.3%) | 1,023 (21.7%) |
| 3-Person Household | 1,450 (84.1%) | 275 (15.9%) |
| 4+ Person Household | 2,397 (84.6%) | 435 (15.4%) |
| Total Housing Units | 10,482 (72.1%) | 4,055 (27.9%) |
Occupancy by Educational Attainment in Westlake
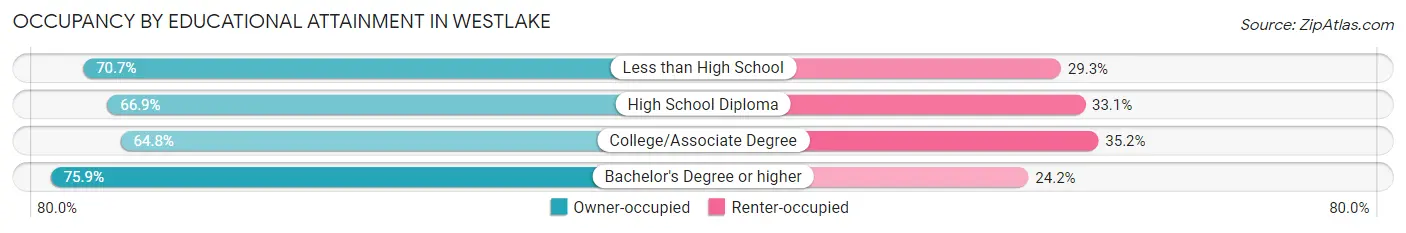
| Household Size | Owner-occupied | Renter-occupied |
| Less than High School | 263 (70.7%) | 109 (29.3%) |
| High School Diploma | 1,322 (66.9%) | 655 (33.1%) |
| College/Associate Degree | 2,029 (64.8%) | 1,104 (35.2%) |
| Bachelor's Degree or higher | 6,868 (75.8%) | 2,187 (24.1%) |
Occupancy by Age of Householder in Westlake
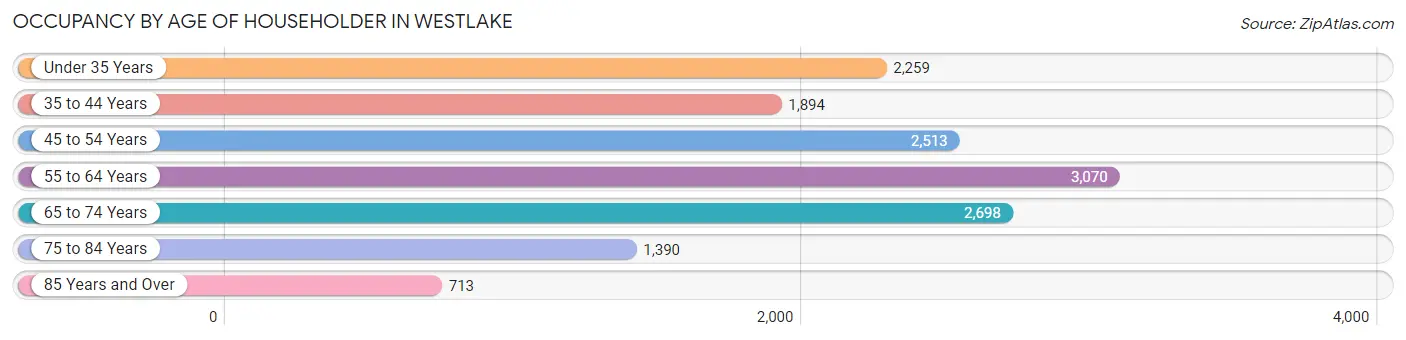
| Age Bracket | # Households | % Households |
| Under 35 Years | 2,259 | 15.5% |
| 35 to 44 Years | 1,894 | 13.0% |
| 45 to 54 Years | 2,513 | 17.3% |
| 55 to 64 Years | 3,070 | 21.1% |
| 65 to 74 Years | 2,698 | 18.6% |
| 75 to 84 Years | 1,390 | 9.6% |
| 85 Years and Over | 713 | 4.9% |
| Total | 14,537 | 100.0% |
Housing Finances in Westlake
Median Income by Occupancy in Westlake
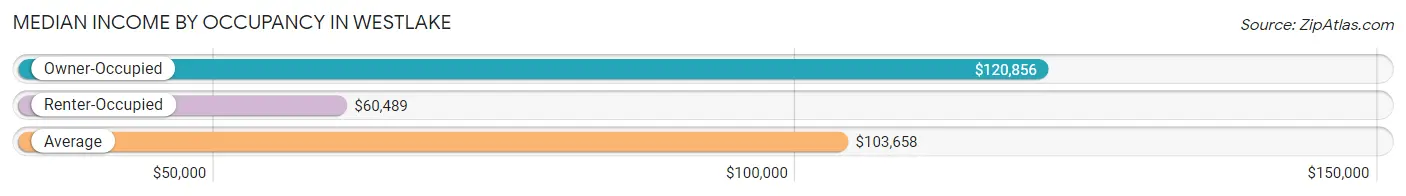
| Occupancy Type | # Households | Median Income |
| Owner-Occupied | 10,482 (72.1%) | $120,856 |
| Renter-Occupied | 4,055 (27.9%) | $60,489 |
| Average | 14,537 (100.0%) | $103,658 |
Occupancy by Householder Income Bracket in Westlake
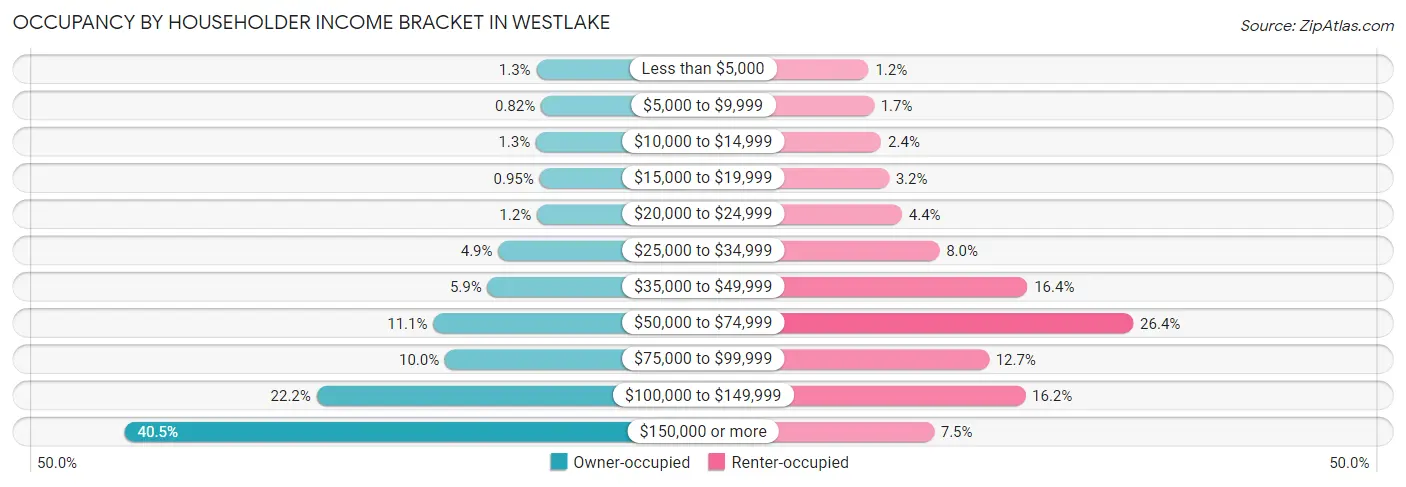
| Income Bracket | Owner-occupied | Renter-occupied |
| Less than $5,000 | 131 (1.3%) | 50 (1.2%) |
| $5,000 to $9,999 | 86 (0.8%) | 70 (1.7%) |
| $10,000 to $14,999 | 135 (1.3%) | 99 (2.4%) |
| $15,000 to $19,999 | 100 (0.9%) | 128 (3.2%) |
| $20,000 to $24,999 | 126 (1.2%) | 179 (4.4%) |
| $25,000 to $34,999 | 512 (4.9%) | 323 (8.0%) |
| $35,000 to $49,999 | 619 (5.9%) | 663 (16.4%) |
| $50,000 to $74,999 | 1,161 (11.1%) | 1,072 (26.4%) |
| $75,000 to $99,999 | 1,044 (10.0%) | 514 (12.7%) |
| $100,000 to $149,999 | 2,326 (22.2%) | 655 (16.2%) |
| $150,000 or more | 4,242 (40.5%) | 302 (7.4%) |
| Total | 10,482 (100.0%) | 4,055 (100.0%) |
Monthly Housing Cost Tiers in Westlake
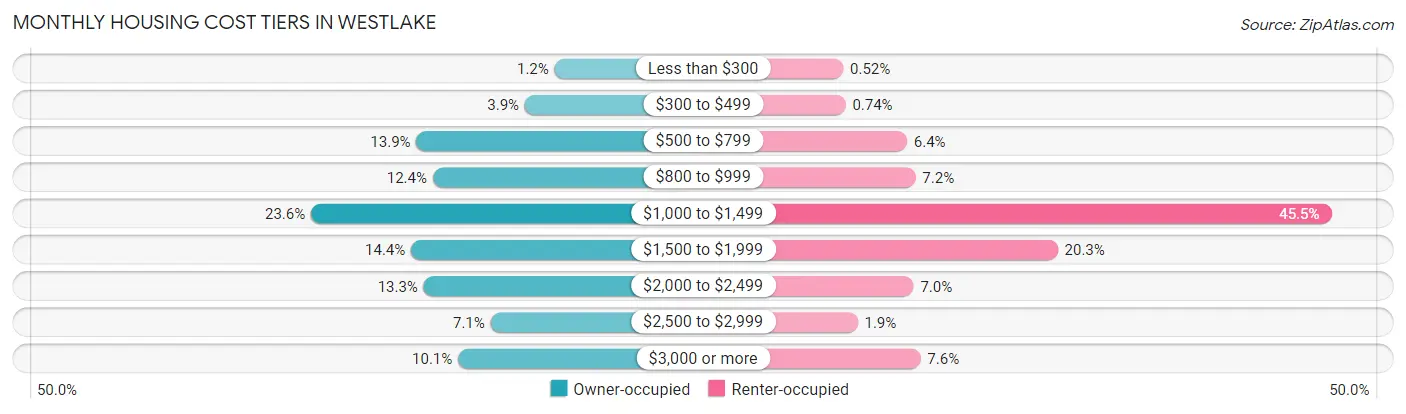
| Monthly Cost | Owner-occupied | Renter-occupied |
| Less than $300 | 127 (1.2%) | 21 (0.5%) |
| $300 to $499 | 413 (3.9%) | 30 (0.7%) |
| $500 to $799 | 1,460 (13.9%) | 259 (6.4%) |
| $800 to $999 | 1,302 (12.4%) | 291 (7.2%) |
| $1,000 to $1,499 | 2,477 (23.6%) | 1,844 (45.5%) |
| $1,500 to $1,999 | 1,511 (14.4%) | 822 (20.3%) |
| $2,000 to $2,499 | 1,390 (13.3%) | 284 (7.0%) |
| $2,500 to $2,999 | 744 (7.1%) | 75 (1.8%) |
| $3,000 or more | 1,058 (10.1%) | 310 (7.6%) |
| Total | 10,482 (100.0%) | 4,055 (100.0%) |
Physical Housing Characteristics in Westlake
Housing Structures in Westlake
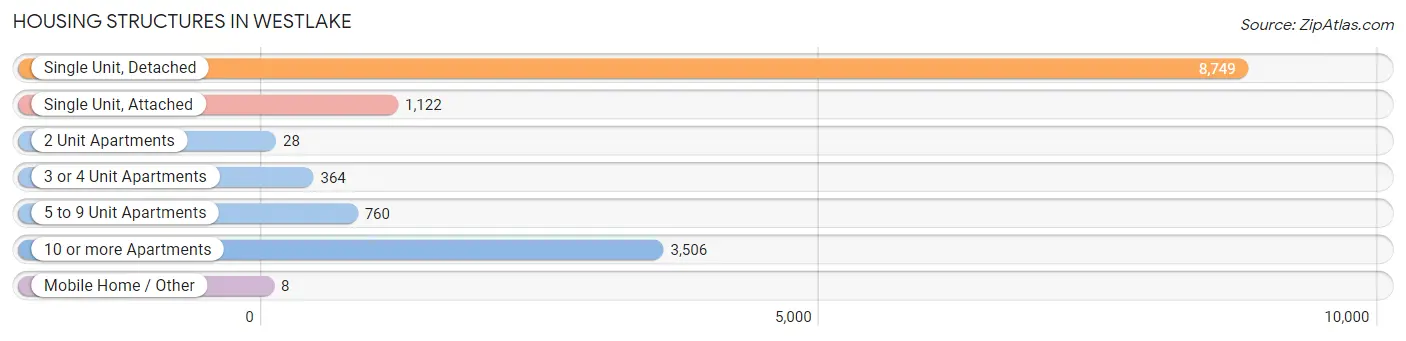
| Structure Type | # Housing Units | % Housing Units |
| Single Unit, Detached | 8,749 | 60.2% |
| Single Unit, Attached | 1,122 | 7.7% |
| 2 Unit Apartments | 28 | 0.2% |
| 3 or 4 Unit Apartments | 364 | 2.5% |
| 5 to 9 Unit Apartments | 760 | 5.2% |
| 10 or more Apartments | 3,506 | 24.1% |
| Mobile Home / Other | 8 | 0.1% |
| Total | 14,537 | 100.0% |
Housing Structures by Occupancy in Westlake
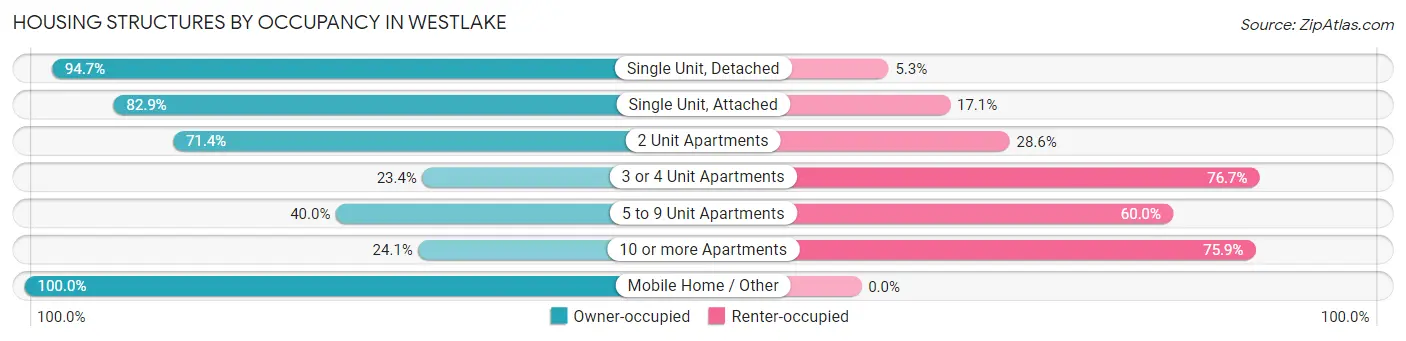
| Structure Type | Owner-occupied | Renter-occupied |
| Single Unit, Detached | 8,289 (94.7%) | 460 (5.3%) |
| Single Unit, Attached | 930 (82.9%) | 192 (17.1%) |
| 2 Unit Apartments | 20 (71.4%) | 8 (28.6%) |
| 3 or 4 Unit Apartments | 85 (23.4%) | 279 (76.6%) |
| 5 to 9 Unit Apartments | 304 (40.0%) | 456 (60.0%) |
| 10 or more Apartments | 846 (24.1%) | 2,660 (75.9%) |
| Mobile Home / Other | 8 (100.0%) | 0 (0.0%) |
| Total | 10,482 (72.1%) | 4,055 (27.9%) |
Housing Structures by Number of Rooms in Westlake
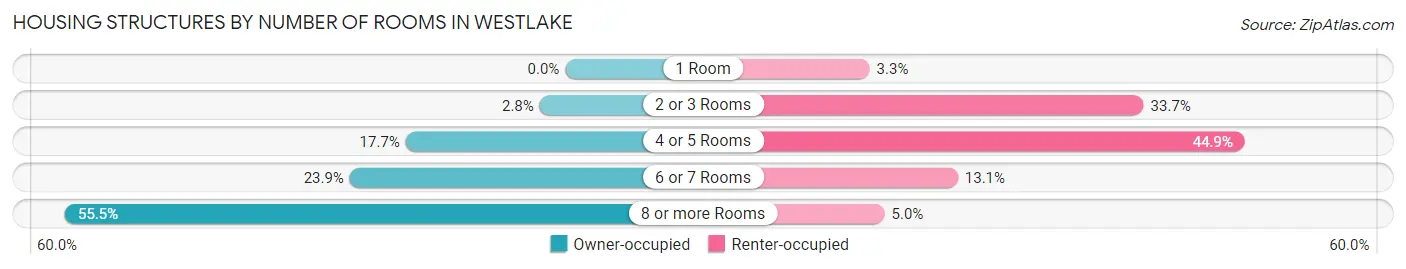
| Number of Rooms | Owner-occupied | Renter-occupied |
| 1 Room | 0 (0.0%) | 134 (3.3%) |
| 2 or 3 Rooms | 298 (2.8%) | 1,367 (33.7%) |
| 4 or 5 Rooms | 1,856 (17.7%) | 1,822 (44.9%) |
| 6 or 7 Rooms | 2,507 (23.9%) | 531 (13.1%) |
| 8 or more Rooms | 5,821 (55.5%) | 201 (5.0%) |
| Total | 10,482 (100.0%) | 4,055 (100.0%) |
Housing Structure by Heating Type in Westlake
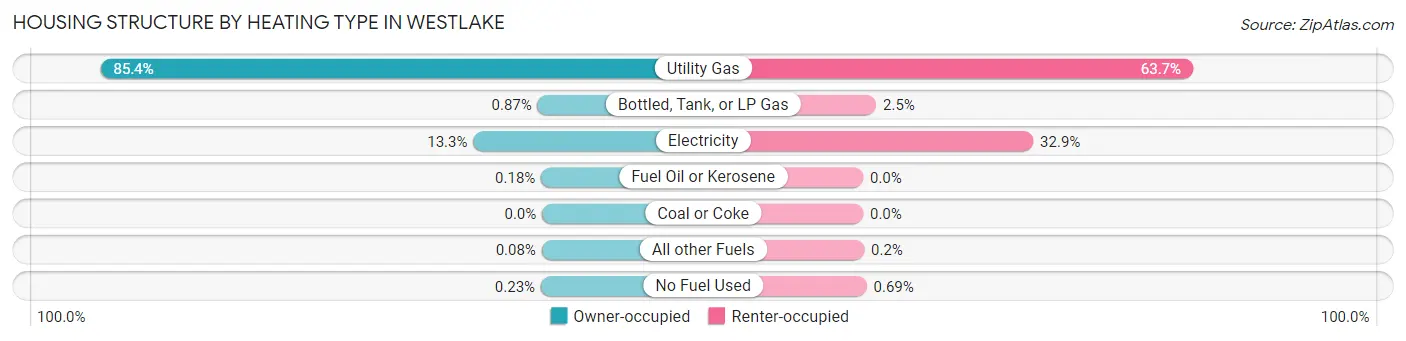
| Heating Type | Owner-occupied | Renter-occupied |
| Utility Gas | 8,946 (85.4%) | 2,584 (63.7%) |
| Bottled, Tank, or LP Gas | 91 (0.9%) | 102 (2.5%) |
| Electricity | 1,394 (13.3%) | 1,333 (32.9%) |
| Fuel Oil or Kerosene | 19 (0.2%) | 0 (0.0%) |
| Coal or Coke | 0 (0.0%) | 0 (0.0%) |
| All other Fuels | 8 (0.1%) | 8 (0.2%) |
| No Fuel Used | 24 (0.2%) | 28 (0.7%) |
| Total | 10,482 (100.0%) | 4,055 (100.0%) |
Household Vehicle Usage in Westlake
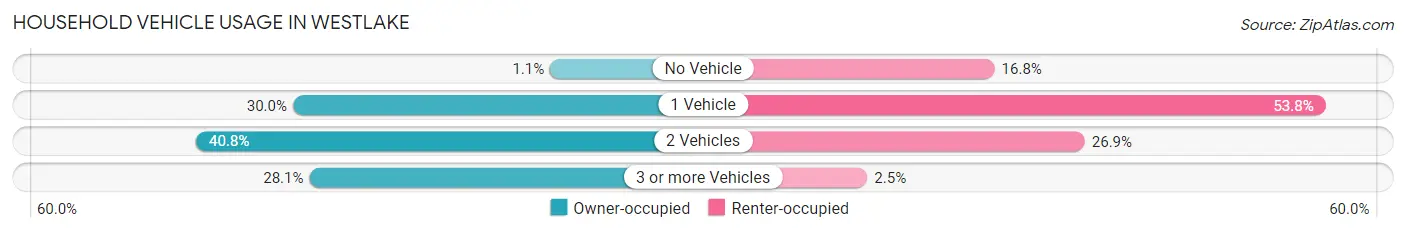
| Vehicles per Household | Owner-occupied | Renter-occupied |
| No Vehicle | 119 (1.1%) | 680 (16.8%) |
| 1 Vehicle | 3,140 (30.0%) | 2,183 (53.8%) |
| 2 Vehicles | 4,276 (40.8%) | 1,090 (26.9%) |
| 3 or more Vehicles | 2,947 (28.1%) | 102 (2.5%) |
| Total | 10,482 (100.0%) | 4,055 (100.0%) |
Real Estate & Mortgages in Westlake
Real Estate and Mortgage Overview in Westlake
| Characteristic | Without Mortgage | With Mortgage |
| Housing Units | 4,545 | 5,937 |
| Median Property Value | $307,300 | $313,000 |
| Median Household Income | $110,072 | $2,611 |
| Monthly Housing Costs | $880 | $999 |
| Real Estate Taxes | $5,335 | $36 |
Property Value by Mortgage Status in Westlake
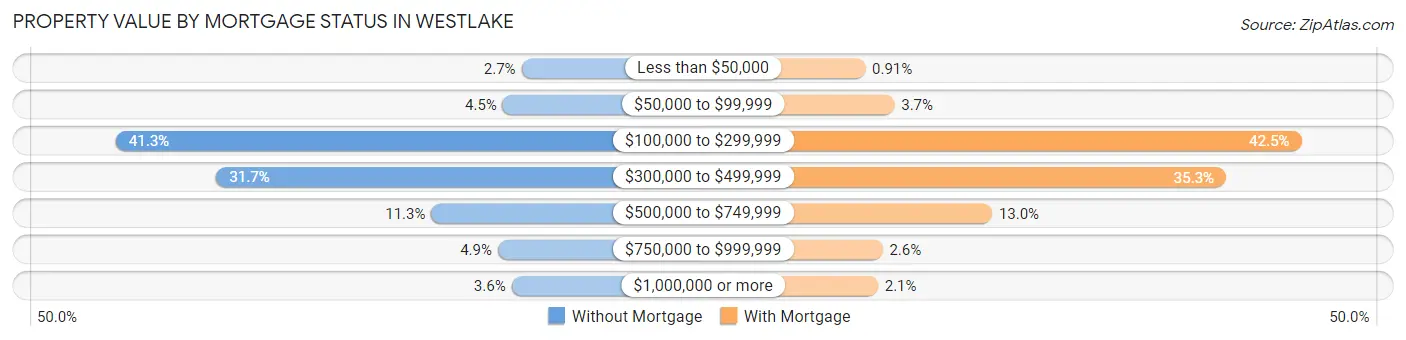
| Property Value | Without Mortgage | With Mortgage |
| Less than $50,000 | 122 (2.7%) | 54 (0.9%) |
| $50,000 to $99,999 | 203 (4.5%) | 219 (3.7%) |
| $100,000 to $299,999 | 1,877 (41.3%) | 2,521 (42.5%) |
| $300,000 to $499,999 | 1,442 (31.7%) | 2,094 (35.3%) |
| $500,000 to $749,999 | 512 (11.3%) | 771 (13.0%) |
| $750,000 to $999,999 | 224 (4.9%) | 152 (2.6%) |
| $1,000,000 or more | 165 (3.6%) | 126 (2.1%) |
| Total | 4,545 (100.0%) | 5,937 (100.0%) |
Household Income by Mortgage Status in Westlake
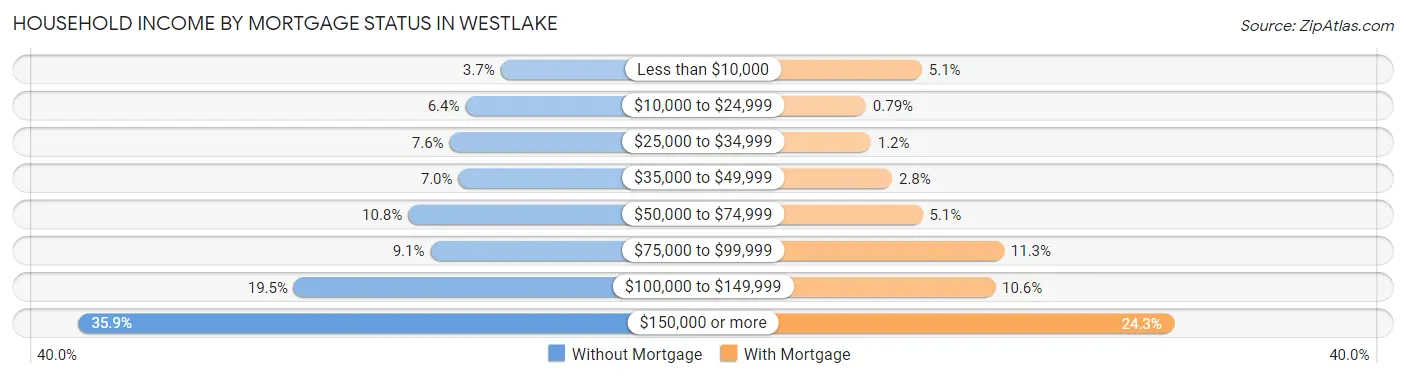
| Household Income | Without Mortgage | With Mortgage |
| Less than $10,000 | 170 (3.7%) | 300 (5.1%) |
| $10,000 to $24,999 | 292 (6.4%) | 47 (0.8%) |
| $25,000 to $34,999 | 347 (7.6%) | 69 (1.2%) |
| $35,000 to $49,999 | 316 (7.0%) | 165 (2.8%) |
| $50,000 to $74,999 | 490 (10.8%) | 303 (5.1%) |
| $75,000 to $99,999 | 413 (9.1%) | 671 (11.3%) |
| $100,000 to $149,999 | 886 (19.5%) | 631 (10.6%) |
| $150,000 or more | 1,631 (35.9%) | 1,440 (24.2%) |
| Total | 4,545 (100.0%) | 5,937 (100.0%) |
Property Value to Household Income Ratio in Westlake
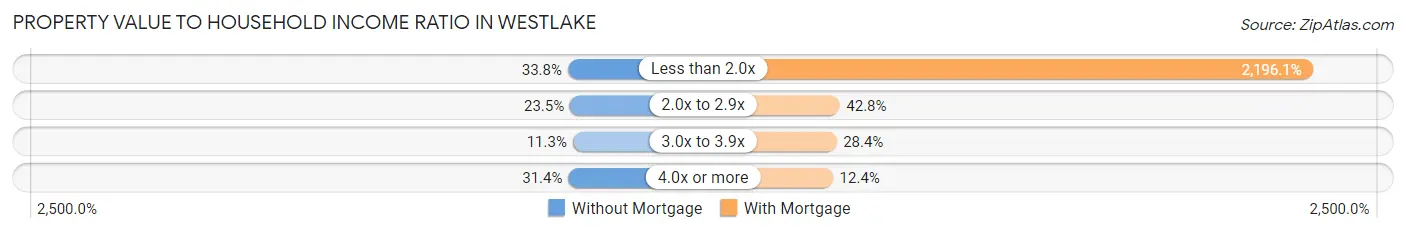
| Value-to-Income Ratio | Without Mortgage | With Mortgage |
| Less than 2.0x | 1,534 (33.8%) | 130,383 (2,196.1%) |
| 2.0x to 2.9x | 1,068 (23.5%) | 2,541 (42.8%) |
| 3.0x to 3.9x | 514 (11.3%) | 1,685 (28.4%) |
| 4.0x or more | 1,429 (31.4%) | 734 (12.4%) |
| Total | 4,545 (100.0%) | 5,937 (100.0%) |
Real Estate Taxes by Mortgage Status in Westlake
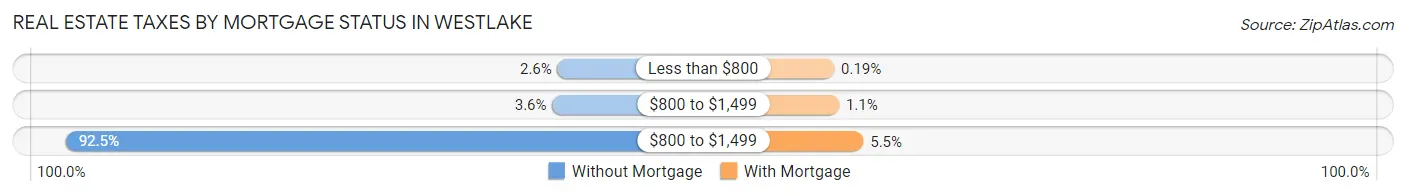
| Property Taxes | Without Mortgage | With Mortgage |
| Less than $800 | 120 (2.6%) | 11 (0.2%) |
| $800 to $1,499 | 164 (3.6%) | 64 (1.1%) |
| $800 to $1,499 | 4,203 (92.5%) | 328 (5.5%) |
| Total | 4,545 (100.0%) | 5,937 (100.0%) |
Health & Disability in Westlake
Health Insurance Coverage by Age in Westlake
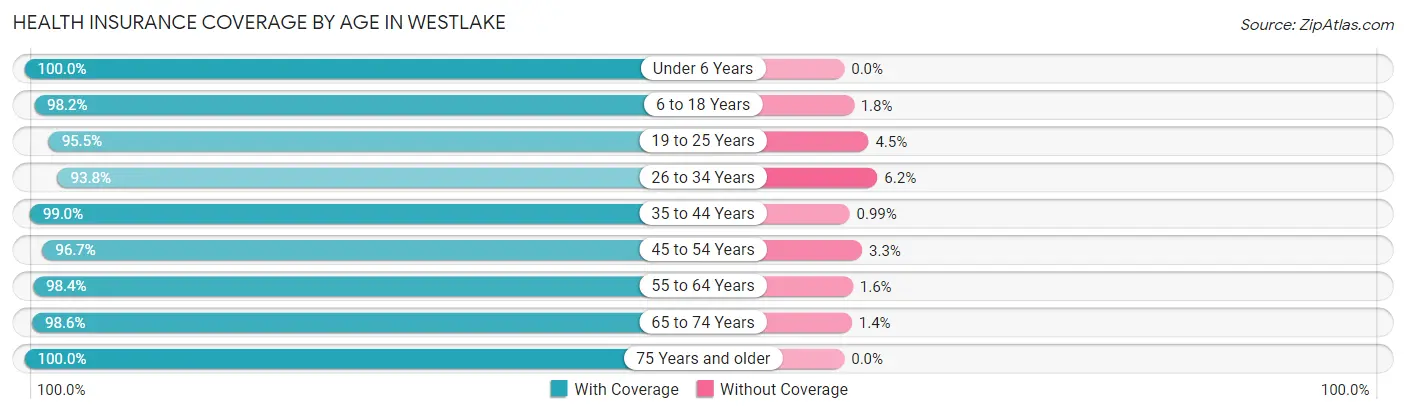
| Age Bracket | With Coverage | Without Coverage |
| Under 6 Years | 1,757 (100.0%) | 0 (0.0%) |
| 6 to 18 Years | 5,238 (98.2%) | 94 (1.8%) |
| 19 to 25 Years | 2,434 (95.5%) | 115 (4.5%) |
| 26 to 34 Years | 3,132 (93.8%) | 206 (6.2%) |
| 35 to 44 Years | 3,190 (99.0%) | 32 (1.0%) |
| 45 to 54 Years | 4,373 (96.7%) | 150 (3.3%) |
| 55 to 64 Years | 5,044 (98.4%) | 82 (1.6%) |
| 65 to 74 Years | 4,203 (98.6%) | 60 (1.4%) |
| 75 Years and older | 3,089 (100.0%) | 0 (0.0%) |
| Total | 32,460 (97.8%) | 739 (2.2%) |
Health Insurance Coverage by Citizenship Status in Westlake
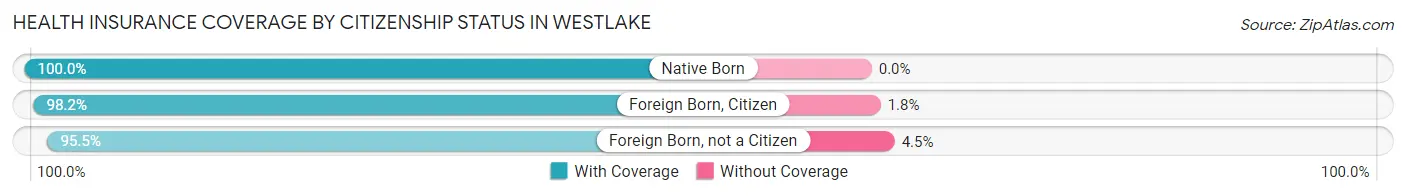
| Citizenship Status | With Coverage | Without Coverage |
| Native Born | 1,757 (100.0%) | 0 (0.0%) |
| Foreign Born, Citizen | 5,238 (98.2%) | 94 (1.8%) |
| Foreign Born, not a Citizen | 2,434 (95.5%) | 115 (4.5%) |
Health Insurance Coverage by Household Income in Westlake
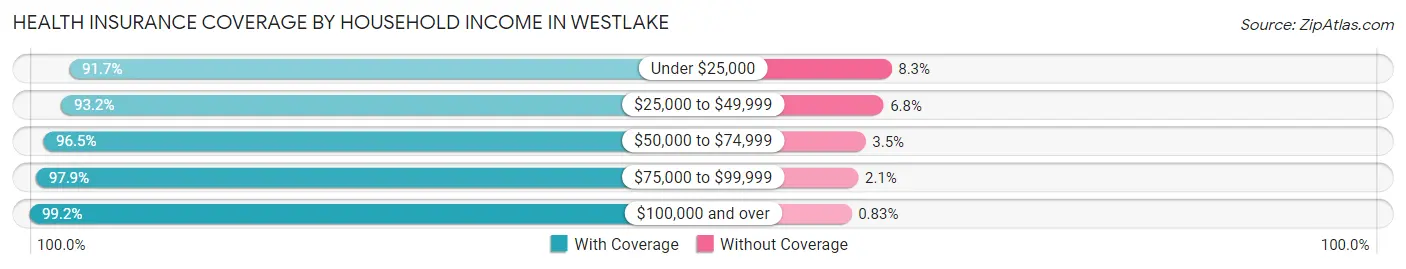
| Household Income | With Coverage | Without Coverage |
| Under $25,000 | 1,485 (91.7%) | 135 (8.3%) |
| $25,000 to $49,999 | 3,028 (93.2%) | 222 (6.8%) |
| $50,000 to $74,999 | 4,085 (96.5%) | 147 (3.5%) |
| $75,000 to $99,999 | 2,638 (97.9%) | 57 (2.1%) |
| $100,000 and over | 21,118 (99.2%) | 177 (0.8%) |
Public vs Private Health Insurance Coverage by Age in Westlake
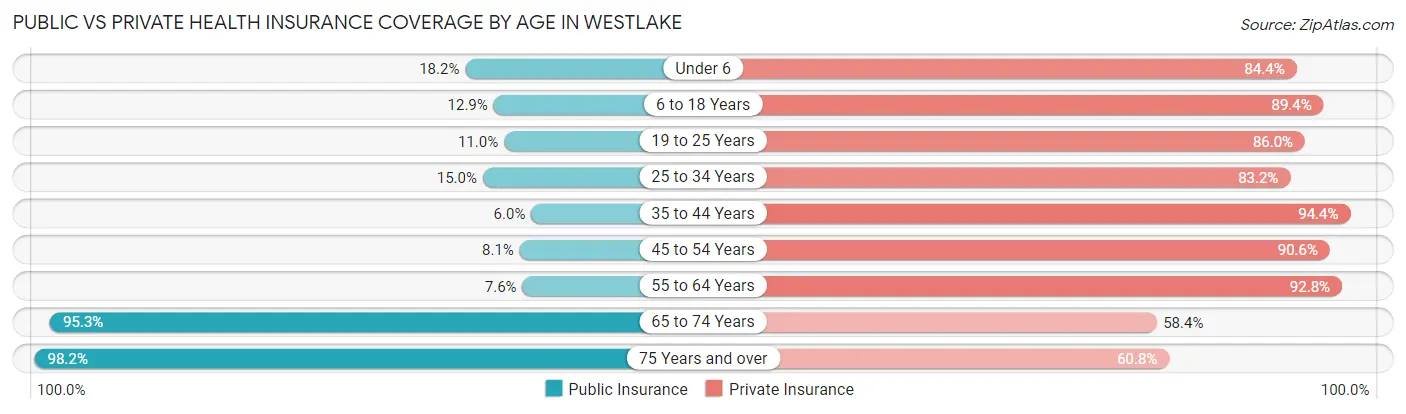
| Age Bracket | Public Insurance | Private Insurance |
| Under 6 | 320 (18.2%) | 1,483 (84.4%) |
| 6 to 18 Years | 690 (12.9%) | 4,768 (89.4%) |
| 19 to 25 Years | 281 (11.0%) | 2,191 (86.0%) |
| 25 to 34 Years | 499 (14.9%) | 2,778 (83.2%) |
| 35 to 44 Years | 192 (6.0%) | 3,041 (94.4%) |
| 45 to 54 Years | 367 (8.1%) | 4,097 (90.6%) |
| 55 to 64 Years | 389 (7.6%) | 4,758 (92.8%) |
| 65 to 74 Years | 4,062 (95.3%) | 2,488 (58.4%) |
| 75 Years and over | 3,032 (98.2%) | 1,877 (60.8%) |
| Total | 9,832 (29.6%) | 27,481 (82.8%) |
Disability Status by Sex by Age in Westlake
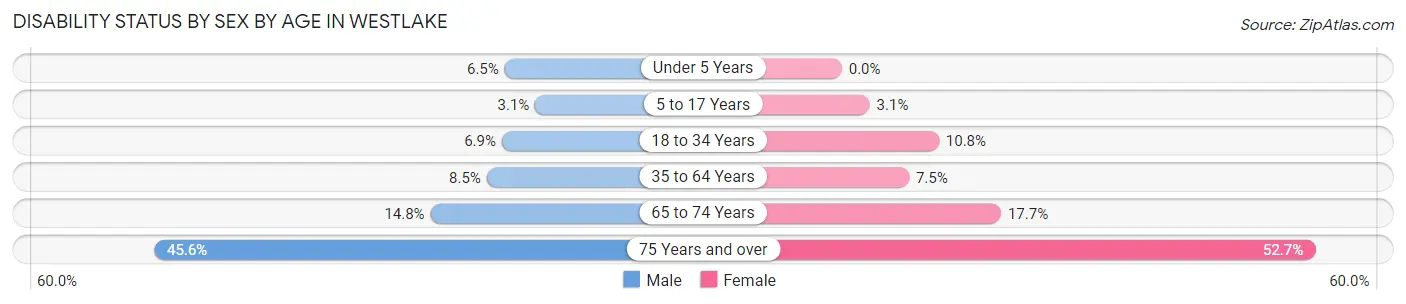
| Age Bracket | Male | Female |
| Under 5 Years | 50 (6.5%) | 0 (0.0%) |
| 5 to 17 Years | 83 (3.1%) | 81 (3.1%) |
| 18 to 34 Years | 211 (6.9%) | 330 (10.8%) |
| 35 to 64 Years | 533 (8.5%) | 496 (7.5%) |
| 65 to 74 Years | 292 (14.8%) | 406 (17.7%) |
| 75 Years and over | 538 (45.6%) | 1,006 (52.7%) |
Disability Class by Sex by Age in Westlake
Disability Class: Hearing Difficulty
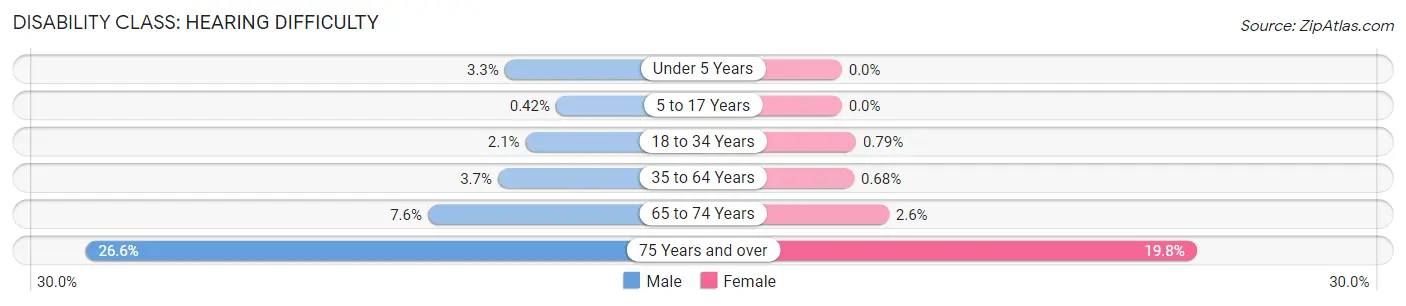
| Age Bracket | Male | Female |
| Under 5 Years | 25 (3.3%) | 0 (0.0%) |
| 5 to 17 Years | 11 (0.4%) | 0 (0.0%) |
| 18 to 34 Years | 65 (2.1%) | 24 (0.8%) |
| 35 to 64 Years | 228 (3.6%) | 45 (0.7%) |
| 65 to 74 Years | 149 (7.5%) | 60 (2.6%) |
| 75 Years and over | 314 (26.6%) | 377 (19.8%) |
Disability Class: Vision Difficulty
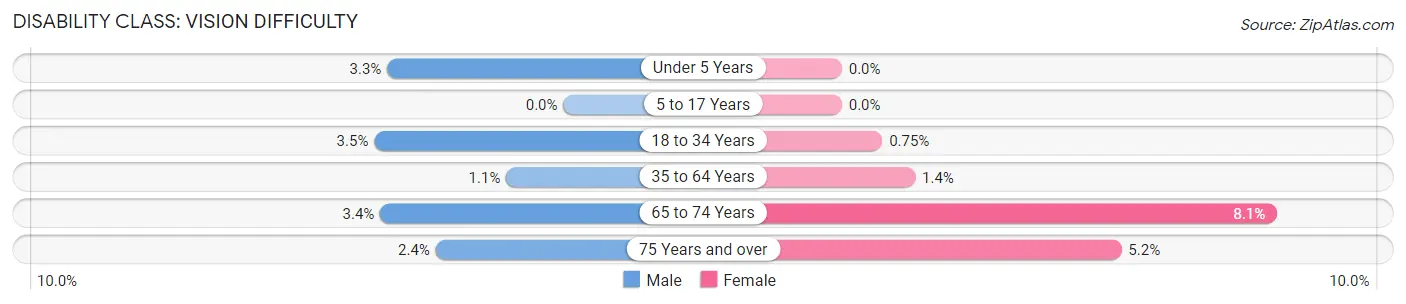
| Age Bracket | Male | Female |
| Under 5 Years | 25 (3.3%) | 0 (0.0%) |
| 5 to 17 Years | 0 (0.0%) | 0 (0.0%) |
| 18 to 34 Years | 108 (3.5%) | 23 (0.7%) |
| 35 to 64 Years | 66 (1.1%) | 90 (1.4%) |
| 65 to 74 Years | 67 (3.4%) | 185 (8.1%) |
| 75 Years and over | 28 (2.4%) | 99 (5.2%) |
Disability Class: Cognitive Difficulty
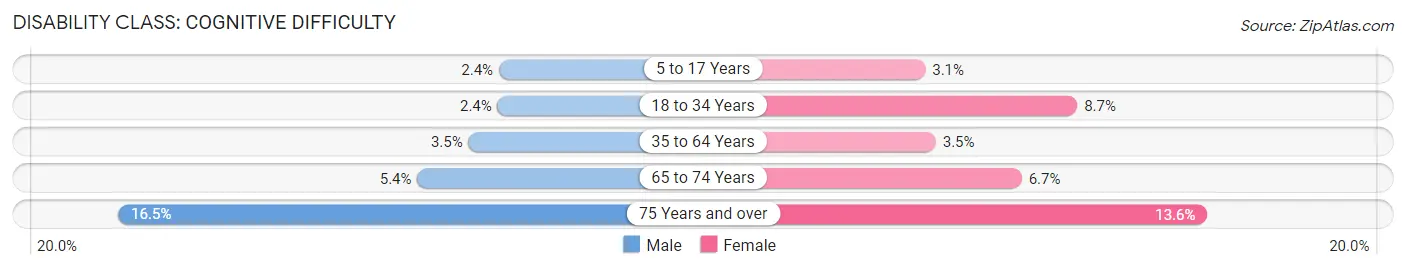
| Age Bracket | Male | Female |
| 5 to 17 Years | 63 (2.4%) | 81 (3.1%) |
| 18 to 34 Years | 75 (2.4%) | 267 (8.7%) |
| 35 to 64 Years | 220 (3.5%) | 231 (3.5%) |
| 65 to 74 Years | 107 (5.4%) | 153 (6.7%) |
| 75 Years and over | 195 (16.5%) | 259 (13.6%) |
Disability Class: Ambulatory Difficulty
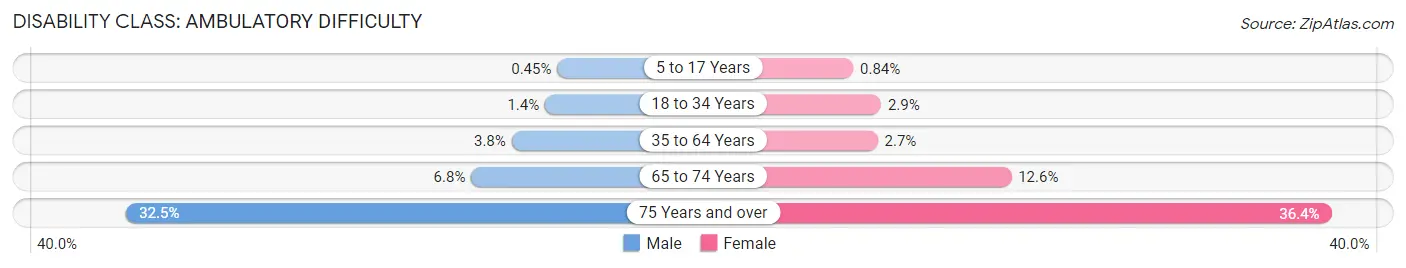
| Age Bracket | Male | Female |
| 5 to 17 Years | 12 (0.4%) | 22 (0.8%) |
| 18 to 34 Years | 42 (1.4%) | 89 (2.9%) |
| 35 to 64 Years | 240 (3.8%) | 176 (2.7%) |
| 65 to 74 Years | 135 (6.8%) | 288 (12.6%) |
| 75 Years and over | 383 (32.5%) | 694 (36.3%) |
Disability Class: Self-Care Difficulty
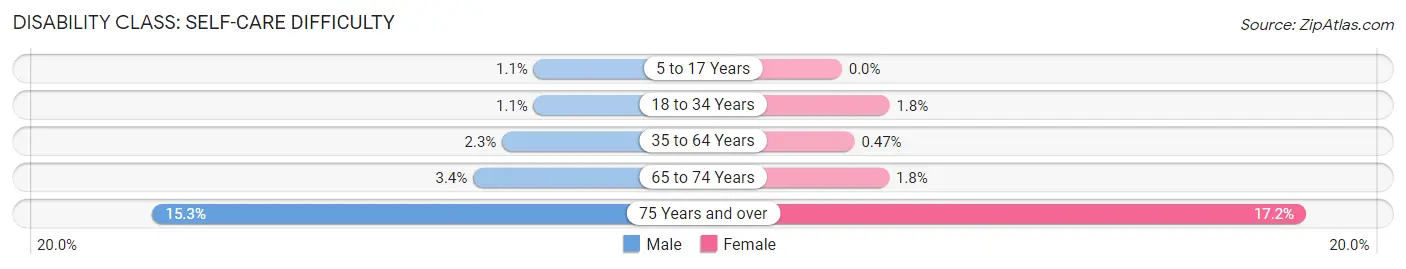
| Age Bracket | Male | Female |
| 5 to 17 Years | 29 (1.1%) | 0 (0.0%) |
| 18 to 34 Years | 34 (1.1%) | 54 (1.8%) |
| 35 to 64 Years | 142 (2.3%) | 31 (0.5%) |
| 65 to 74 Years | 66 (3.4%) | 40 (1.8%) |
| 75 Years and over | 180 (15.2%) | 329 (17.2%) |
Technology Access in Westlake
Computing Device Access in Westlake
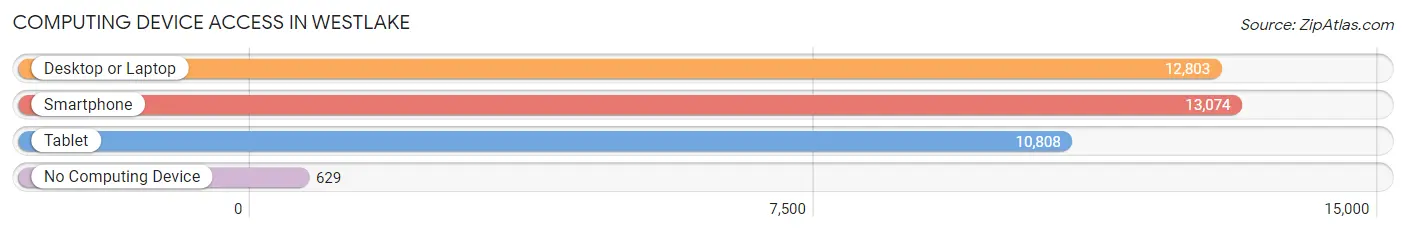
| Device Type | # Households | % Households |
| Desktop or Laptop | 12,803 | 88.1% |
| Smartphone | 13,074 | 89.9% |
| Tablet | 10,808 | 74.4% |
| No Computing Device | 629 | 4.3% |
| Total | 14,537 | 100.0% |
Internet Access in Westlake
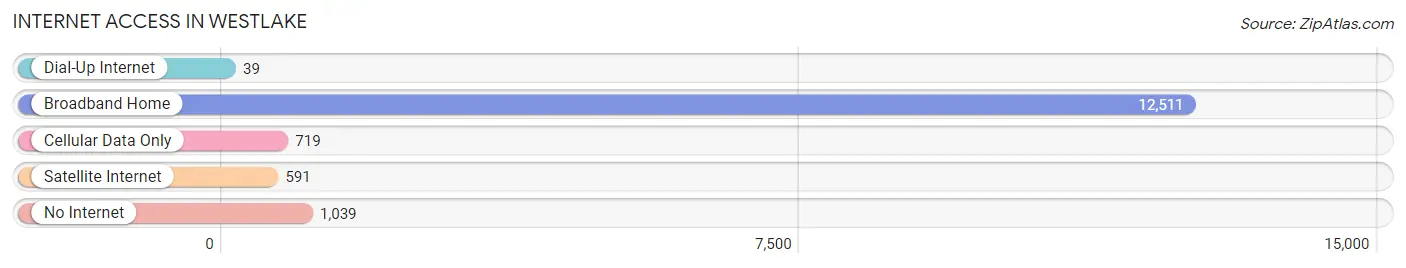
| Internet Type | # Households | % Households |
| Dial-Up Internet | 39 | 0.3% |
| Broadband Home | 12,511 | 86.1% |
| Cellular Data Only | 719 | 5.0% |
| Satellite Internet | 591 | 4.1% |
| No Internet | 1,039 | 7.1% |
| Total | 14,537 | 100.0% |
Westlake Summary
Westlake, Ohio is a city located in Cuyahoga County, Ohio, United States. It is a suburb of Cleveland and is located approximately 15 miles west of downtown Cleveland. The city was incorporated in 1945 and has a population of 32,729 as of the 2010 census.
History
Westlake was first settled in 1810 by John and Sarah Westlake, who were among the first settlers in the area. The Westlakes built a log cabin on the banks of the Rocky River and named the area Westlake after themselves. The area was primarily agricultural until the late 19th century, when it began to develop into a residential community. In 1945, Westlake was officially incorporated as a village.
In the 1950s, Westlake experienced a period of rapid growth and development. The population increased from 1,000 in 1950 to over 10,000 by 1960. This growth was largely due to the development of the Crocker Park shopping center, which opened in the late 1950s. The shopping center was the first of its kind in the area and attracted many new residents to the city.
In the 1970s, Westlake continued to experience growth and development. The population increased to over 20,000 by 1980. The city also saw the development of many new businesses and residential neighborhoods.
Geography
Westlake is located at 41°27′N 81°51′W (41.45, -81.85). According to the United States Census Bureau, the city has a total area of 16.2 square miles (41.9 km2), of which 16.1 square miles (41.7 km2) is land and 0.1 square miles (0.2 km2) is water.
Westlake is bordered by the cities of North Olmsted to the north, Rocky River to the east, Bay Village to the south, and Avon and Avon Lake to the west. The city is located on the western edge of the Cleveland metropolitan area.
Economy
Westlake has a diverse economy that is largely based on retail, professional services, and healthcare. The city is home to several large employers, including Crocker Park, a large shopping center that is home to over 100 stores and restaurants. Other major employers in the city include St. John Medical Center, Hyland Software, and the Westlake City School District.
Westlake also has a thriving small business community. The city is home to many small businesses, including restaurants, retail stores, and professional services.
Demographics
As of the 2010 census, there were 32,729 people, 13,845 households, and 9,717 families residing in the city. The population density was 2,037.2 people per square mile (788.7/km2). There were 14,717 housing units at an average density of 914.3 per square mile (353.2/km2). The racial makeup of the city was 90.2% White, 3.2% African American, 0.2% Native American, 4.2% Asian, 0.7% from other races, and 1.5% from two or more races. Hispanic or Latino of any race were 2.3% of the population.
The median income for a household in the city was $76,837, and the median income for a family was $93,945. Males had a median income of $63,945 versus $45,945 for females. The per capita income for the city was $37,945. About 2.2% of families and 3.2% of the population were below the poverty line, including 3.7% of those under age 18 and 3.2% of those age 65 or over.
Common Questions
What is the Total Population of Westlake?
Total Population of Westlake is 34,027.
What is the Total Male Population of Westlake?
Total Male Population of Westlake is 16,204.
What is the Total Female Population of Westlake?
Total Female Population of Westlake is 17,823.
What is the Ratio of Males per 100 Females in Westlake?
There are 90.92 Males per 100 Females in Westlake.
What is the Ratio of Females per 100 Males in Westlake?
There are 109.99 Females per 100 Males in Westlake.
What is the Median Population Age in Westlake?
Median Population Age in Westlake is 47.0 Years.
What is the Average Family Size in Westlake
Average Family Size in Westlake is 3.0 People.
What is the Average Household Size in Westlake
Average Household Size in Westlake is 2.3 People.
What is Per Capita Income in Westlake?
Per Capita income in Westlake is $64,001.
What is the Median Family Income in Westlake?
Median Family Income in Westlake is $138,186.
What is the Median Household income in Westlake?
Median Household Income in Westlake is $103,658.
What is Income or Wage Gap in Westlake?
Income or Wage Gap in Westlake is 32.6%.
Women in Westlake earn 67.4 cents for every dollar earned by a man.
What is Family Income Deficit in Westlake?
Family Income Deficit in Westlake is $12,165.
Families that are below poverty line in Westlake earn $12,165 less on average than the poverty threshold level.
What is Inequality or Gini Index in Westlake?
Inequality or Gini Index in Westlake is 0.48.
How Large is the Labor Force in Westlake?
There are 17,529 People in the Labor Forcein in Westlake.
What is the Percentage of People in the Labor Force in Westlake?
61.7% of People are in the Labor Force in Westlake.
What is the Unemployment Rate in Westlake?
Unemployment Rate in Westlake is 3.6%.