Middletown, OH
Middletown Map
Middletown Overview
50,514
TOTAL POPULATION
24,440
MALE POPULATION
26,074
FEMALE POPULATION
93.73
MALES / 100 FEMALES
106.69
FEMALES / 100 MALES
38.6
MEDIAN AGE
3.0
AVG FAMILY SIZE
2.4
AVG HOUSEHOLD SIZE
$28,831
PER CAPITA INCOME
$65,601
AVG FAMILY INCOME
$50,457
AVG HOUSEHOLD INCOME
37.5%
WAGE / INCOME GAP [ % ]
62.5¢/ $1
WAGE / INCOME GAP [ $ ]
$13,036
FAMILY INCOME DEFICIT
0.45
INEQUALITY / GINI INDEX
24,221
LABOR FORCE [ PEOPLE ]
59.0%
PERCENT IN LABOR FORCE
7.2%
UNEMPLOYMENT RATE
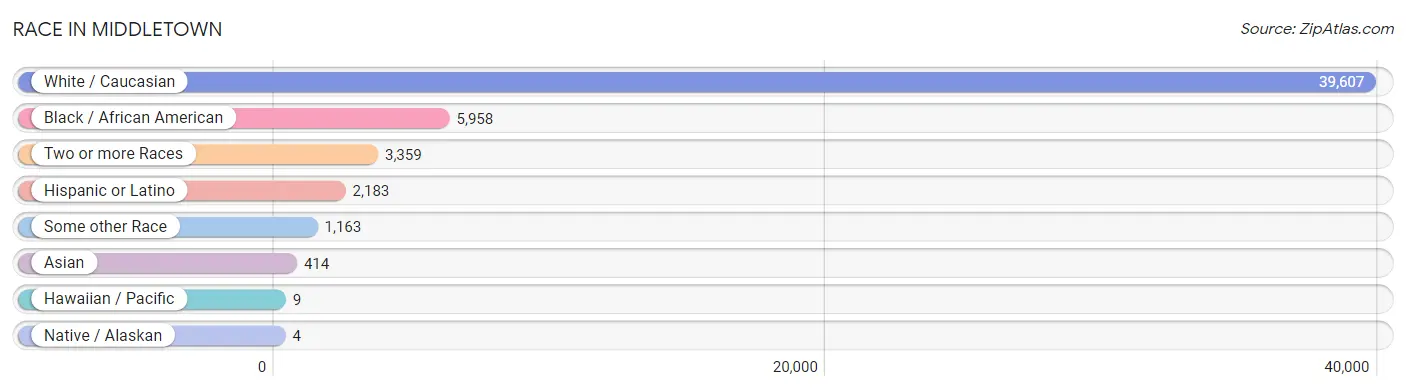
Race in Middletown
The most populous races in Middletown are White / Caucasian (39,607 | 78.4%), Black / African American (5,958 | 11.8%), and Two or more Races (3,359 | 6.7%).
| Race | # Population | % Population |
| Asian | 414 | 0.8% |
| Black / African American | 5,958 | 11.8% |
| Hawaiian / Pacific | 9 | 0.0% |
| Hispanic or Latino | 2,183 | 4.3% |
| Native / Alaskan | 4 | 0.0% |
| White / Caucasian | 39,607 | 78.4% |
| Two or more Races | 3,359 | 6.7% |
| Some other Race | 1,163 | 2.3% |
| Total | 50,514 | 100.0% |
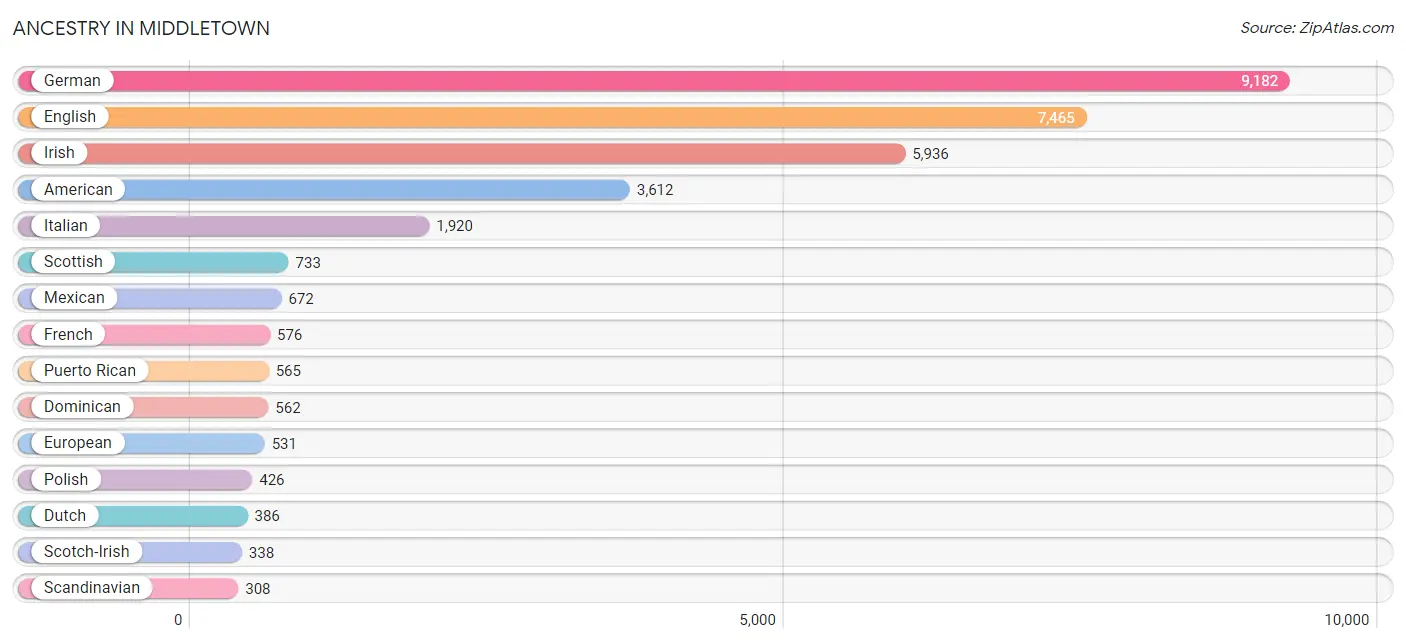
Ancestry in Middletown
The most populous ancestries reported in Middletown are German (9,182 | 18.2%), English (7,465 | 14.8%), Irish (5,936 | 11.7%), American (3,612 | 7.1%), and Italian (1,920 | 3.8%), together accounting for 55.7% of all Middletown residents.
| Ancestry | # Population | % Population |
| African | 129 | 0.3% |
| Albanian | 29 | 0.1% |
| American | 3,612 | 7.1% |
| Arab | 39 | 0.1% |
| Austrian | 30 | 0.1% |
| Bhutanese | 20 | 0.0% |
| Blackfeet | 9 | 0.0% |
| British | 214 | 0.4% |
| Bulgarian | 8 | 0.0% |
| Burmese | 180 | 0.4% |
| Cambodian | 40 | 0.1% |
| Canadian | 44 | 0.1% |
| Central American | 48 | 0.1% |
| Cherokee | 93 | 0.2% |
| Chickasaw | 9 | 0.0% |
| Choctaw | 10 | 0.0% |
| Colombian | 127 | 0.3% |
| Comanche | 3 | 0.0% |
| Cuban | 18 | 0.0% |
| Czechoslovakian | 36 | 0.1% |
| Danish | 11 | 0.0% |
| Dominican | 562 | 1.1% |
| Dutch | 386 | 0.8% |
| Eastern European | 91 | 0.2% |
| Egyptian | 10 | 0.0% |
| English | 7,465 | 14.8% |
| European | 531 | 1.1% |
| French | 576 | 1.1% |
| French Canadian | 33 | 0.1% |
| German | 9,182 | 18.2% |
| Greek | 145 | 0.3% |
| Guatemalan | 23 | 0.1% |
| Honduran | 4 | 0.0% |
| Hungarian | 230 | 0.5% |
| Indian (Asian) | 244 | 0.5% |
| Irish | 5,936 | 11.7% |
| Israeli | 37 | 0.1% |
| Italian | 1,920 | 3.8% |
| Jamaican | 107 | 0.2% |
| Korean | 86 | 0.2% |
| Lithuanian | 70 | 0.1% |
| Mexican | 672 | 1.3% |
| Nicaraguan | 13 | 0.0% |
| Nigerian | 129 | 0.3% |
| Northern European | 18 | 0.0% |
| Norwegian | 204 | 0.4% |
| Osage | 55 | 0.1% |
| Panamanian | 8 | 0.0% |
| Pennsylvania German | 4 | 0.0% |
| Polish | 426 | 0.8% |
| Puerto Rican | 565 | 1.1% |
| Romanian | 17 | 0.0% |
| Russian | 45 | 0.1% |
| Samoan | 9 | 0.0% |
| Scandinavian | 308 | 0.6% |
| Scotch-Irish | 338 | 0.7% |
| Scottish | 733 | 1.5% |
| Serbian | 47 | 0.1% |
| Sioux | 10 | 0.0% |
| Slavic | 21 | 0.0% |
| Slovak | 74 | 0.2% |
| South American | 127 | 0.3% |
| Spaniard | 9 | 0.0% |
| Spanish | 12 | 0.0% |
| Sri Lankan | 34 | 0.1% |
| Subsaharan African | 299 | 0.6% |
| Swedish | 211 | 0.4% |
| Swiss | 51 | 0.1% |
| Syrian | 13 | 0.0% |
| Thai | 135 | 0.3% |
| Welsh | 176 | 0.4% |
| Yugoslavian | 32 | 0.1% | View All 72 Rows |
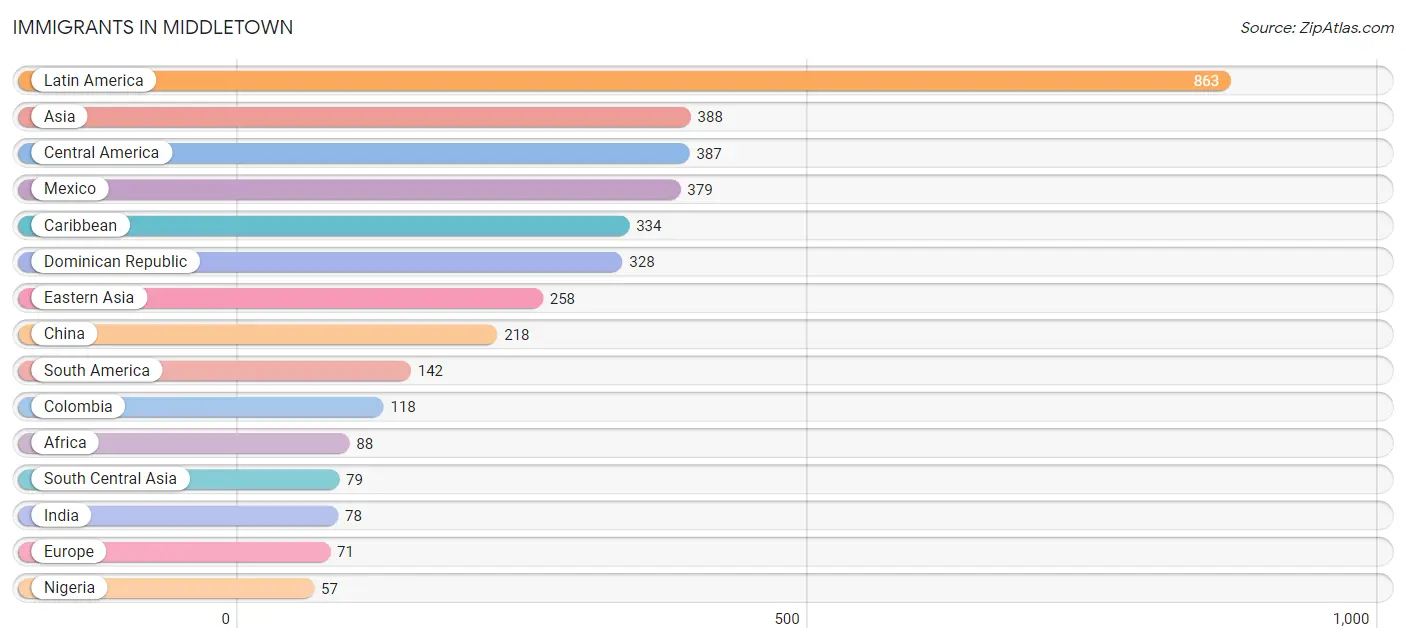
Immigrants in Middletown
The most numerous immigrant groups reported in Middletown came from Latin America (863 | 1.7%), Asia (388 | 0.8%), Central America (387 | 0.8%), Mexico (379 | 0.7%), and Caribbean (334 | 0.7%), together accounting for 4.7% of all Middletown residents.
| Immigration Origin | # Population | % Population |
| Africa | 88 | 0.2% |
| Asia | 388 | 0.8% |
| Bosnia and Herzegovina | 16 | 0.0% |
| Brazil | 12 | 0.0% |
| Canada | 29 | 0.1% |
| Caribbean | 334 | 0.7% |
| Central America | 387 | 0.8% |
| China | 218 | 0.4% |
| Colombia | 118 | 0.2% |
| Cuba | 6 | 0.0% |
| Dominican Republic | 328 | 0.6% |
| Eastern Asia | 258 | 0.5% |
| Eastern Europe | 16 | 0.0% |
| England | 4 | 0.0% |
| Europe | 71 | 0.1% |
| France | 7 | 0.0% |
| Germany | 6 | 0.0% |
| Greece | 15 | 0.0% |
| India | 78 | 0.2% |
| Italy | 5 | 0.0% |
| Latin America | 863 | 1.7% |
| Malaysia | 14 | 0.0% |
| Mexico | 379 | 0.7% |
| Morocco | 31 | 0.1% |
| Nepal | 1 | 0.0% |
| Netherlands | 3 | 0.0% |
| Nigeria | 57 | 0.1% |
| Northern Africa | 31 | 0.1% |
| Northern Europe | 19 | 0.0% |
| Oceania | 26 | 0.1% |
| Panama | 8 | 0.0% |
| Peru | 10 | 0.0% |
| Scotland | 15 | 0.0% |
| South America | 142 | 0.3% |
| South Central Asia | 79 | 0.2% |
| South Eastern Asia | 35 | 0.1% |
| Southern Europe | 20 | 0.0% |
| Uruguay | 2 | 0.0% |
| Vietnam | 21 | 0.0% |
| Western Africa | 57 | 0.1% |
| Western Europe | 16 | 0.0% | View All 41 Rows |
Sex and Age in Middletown
Sex and Age in Middletown
The most populous age groups in Middletown are 20 to 24 Years (2,371 | 9.7%) for men and 60 to 64 Years (2,102 | 8.1%) for women.

| Age Bracket | Male | Female |
| Under 5 Years | 1,260 (5.2%) | 1,396 (5.3%) |
| 5 to 9 Years | 1,426 (5.8%) | 1,534 (5.9%) |
| 10 to 14 Years | 1,582 (6.5%) | 1,773 (6.8%) |
| 15 to 19 Years | 1,208 (4.9%) | 1,464 (5.6%) |
| 20 to 24 Years | 2,371 (9.7%) | 2,080 (8.0%) |
| 25 to 29 Years | 2,261 (9.2%) | 1,496 (5.7%) |
| 30 to 34 Years | 1,465 (6.0%) | 1,526 (5.9%) |
| 35 to 39 Years | 1,873 (7.7%) | 1,409 (5.4%) |
| 40 to 44 Years | 952 (3.9%) | 1,456 (5.6%) |
| 45 to 49 Years | 1,537 (6.3%) | 1,423 (5.5%) |
| 50 to 54 Years | 1,392 (5.7%) | 1,727 (6.6%) |
| 55 to 59 Years | 2,068 (8.5%) | 1,442 (5.5%) |
| 60 to 64 Years | 1,308 (5.3%) | 2,102 (8.1%) |
| 65 to 69 Years | 1,198 (4.9%) | 1,932 (7.4%) |
| 70 to 74 Years | 1,122 (4.6%) | 1,272 (4.9%) |
| 75 to 79 Years | 621 (2.5%) | 714 (2.7%) |
| 80 to 84 Years | 436 (1.8%) | 479 (1.8%) |
| 85 Years and over | 360 (1.5%) | 849 (3.3%) |
| Total | 24,440 (100.0%) | 26,074 (100.0%) |
Families and Households in Middletown
Median Family Size in Middletown
The median family size in Middletown is 3.04 persons per family, with single female/mother families (3,332 | 27.6%) accounting for the largest median family size of 3.24 persons per family. On the other hand, single male/father families (1,643 | 13.6%) represent the smallest median family size with 2.75 persons per family.

| Family Type | # Families | Family Size |
| Married-Couple | 7,118 (58.9%) | 3.02 |
| Single Male/Father | 1,643 (13.6%) | 2.75 |
| Single Female/Mother | 3,332 (27.6%) | 3.24 |
| Total Families | 12,093 (100.0%) | 3.04 |
Median Household Size in Middletown
The median household size in Middletown is 2.38 persons per household, with single female/mother households (3,332 | 15.9%) accounting for the largest median household size of 3.55 persons per household. non-family households (8,848 | 42.2%) represent the smallest median household size with 1.24 persons per household.

| Household Type | # Households | Household Size |
| Married-Couple | 7,118 (34.0%) | 3.03 |
| Single Male/Father | 1,643 (7.9%) | 3.26 |
| Single Female/Mother | 3,332 (15.9%) | 3.55 |
| Non-family | 8,848 (42.2%) | 1.24 |
| Total Households | 20,941 (100.0%) | 2.38 |
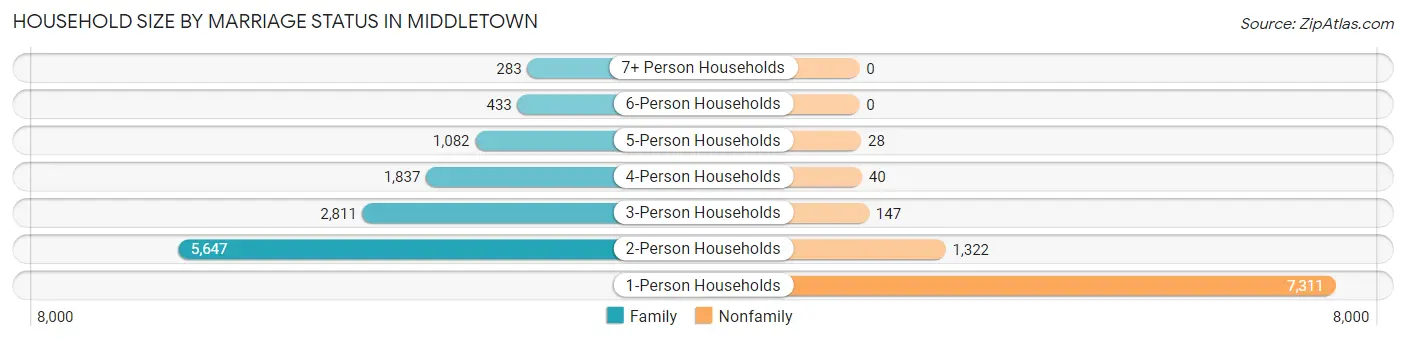
Household Size by Marriage Status in Middletown
Out of a total of 20,941 households in Middletown, 12,093 (57.8%) are family households, while 8,848 (42.2%) are nonfamily households. The most numerous type of family households are 2-person households, comprising 5,647, and the most common type of nonfamily households are 1-person households, comprising 7,311.
| Household Size | Family Households | Nonfamily Households |
| 1-Person Households | - | 7,311 (34.9%) |
| 2-Person Households | 5,647 (27.0%) | 1,322 (6.3%) |
| 3-Person Households | 2,811 (13.4%) | 147 (0.7%) |
| 4-Person Households | 1,837 (8.8%) | 40 (0.2%) |
| 5-Person Households | 1,082 (5.2%) | 28 (0.1%) |
| 6-Person Households | 433 (2.1%) | 0 (0.0%) |
| 7+ Person Households | 283 (1.3%) | 0 (0.0%) |
| Total | 12,093 (57.8%) | 8,848 (42.2%) |
Female Fertility in Middletown
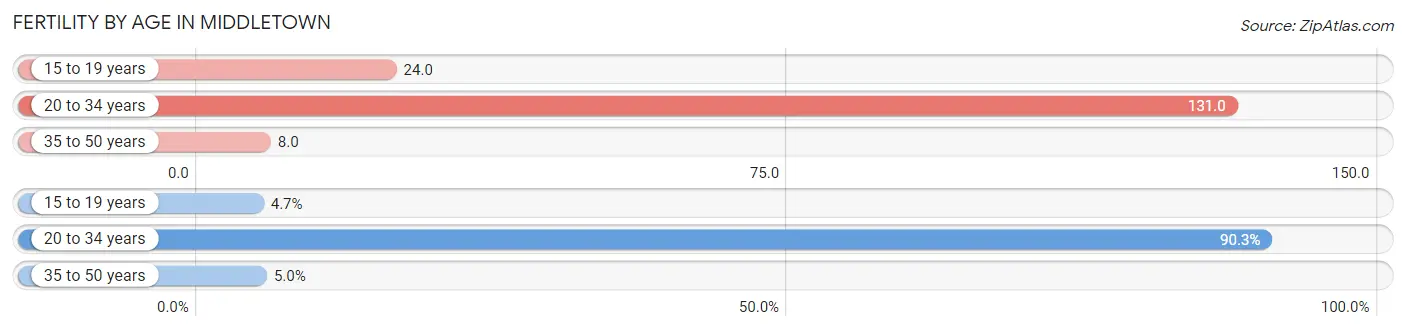
Fertility by Age in Middletown
Average fertility rate in Middletown is 66.0 births per 1,000 women. Women in the age bracket of 20 to 34 years have the highest fertility rate with 131.0 births per 1,000 women. Women in the age bracket of 20 to 34 years acount for 90.3% of all women with births.
| Age Bracket | Women with Births | Births / 1,000 Women |
| 15 to 19 years | 35 (4.7%) | 24.0 |
| 20 to 34 years | 668 (90.3%) | 131.0 |
| 35 to 50 years | 37 (5.0%) | 8.0 |
| Total | 740 (100.0%) | 66.0 |
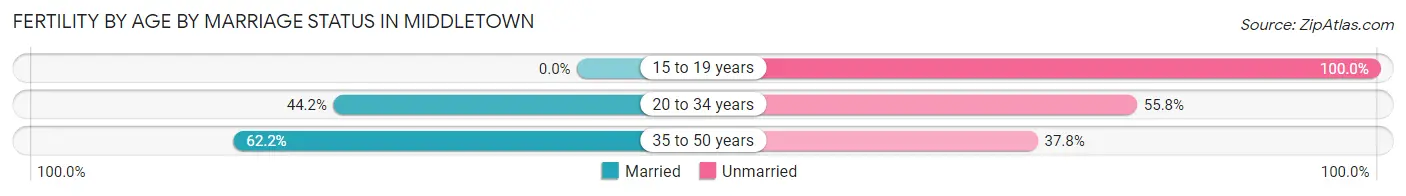
Fertility by Age by Marriage Status in Middletown
43.0% of women with births (740) in Middletown are married. The highest percentage of unmarried women with births falls into 15 to 19 years age bracket with 100.0% of them unmarried at the time of birth, while the lowest percentage of unmarried women with births belong to 35 to 50 years age bracket with 37.8% of them unmarried.
| Age Bracket | Married | Unmarried |
| 15 to 19 years | 0 (0.0%) | 35 (100.0%) |
| 20 to 34 years | 295 (44.2%) | 373 (55.8%) |
| 35 to 50 years | 23 (62.2%) | 14 (37.8%) |
| Total | 318 (43.0%) | 422 (57.0%) |
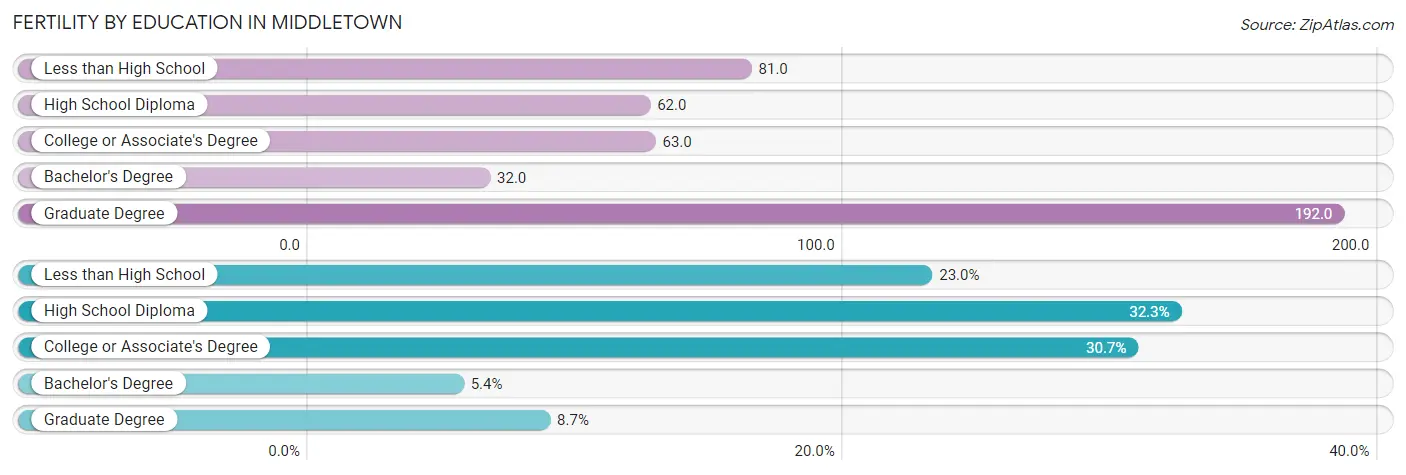
Fertility by Education in Middletown
Average fertility rate in Middletown is 66.0 births per 1,000 women. Women with the education attainment of graduate degree have the highest fertility rate of 192.0 births per 1,000 women, while women with the education attainment of bachelor's degree have the lowest fertility at 32.0 births per 1,000 women. Women with the education attainment of high school diploma represent 32.3% of all women with births.
| Educational Attainment | Women with Births | Births / 1,000 Women |
| Less than High School | 170 (23.0%) | 81.0 |
| High School Diploma | 239 (32.3%) | 62.0 |
| College or Associate's Degree | 227 (30.7%) | 63.0 |
| Bachelor's Degree | 40 (5.4%) | 32.0 |
| Graduate Degree | 64 (8.6%) | 192.0 |
| Total | 740 (100.0%) | 66.0 |
Fertility by Education by Marriage Status in Middletown
57.0% of women with births in Middletown are unmarried. Women with the educational attainment of graduate degree are most likely to be married with 90.6% of them married at childbirth, while women with the educational attainment of less than high school are least likely to be married with 87.6% of them unmarried at childbirth.
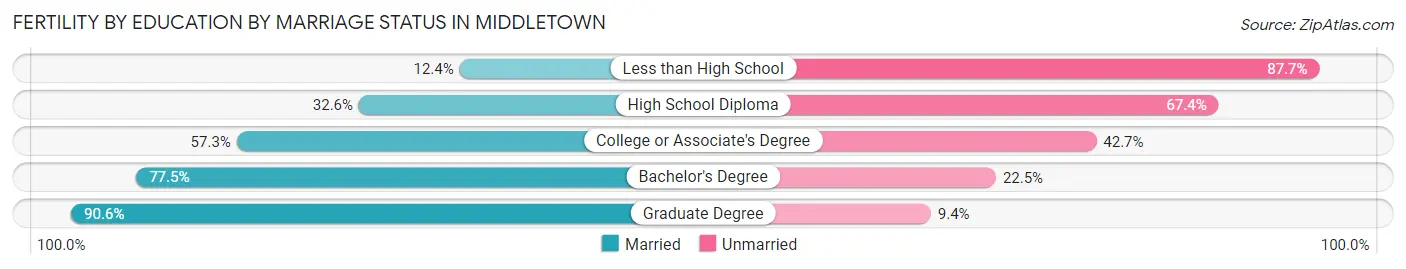
| Educational Attainment | Married | Unmarried |
| Less than High School | 21 (12.3%) | 149 (87.6%) |
| High School Diploma | 78 (32.6%) | 161 (67.4%) |
| College or Associate's Degree | 130 (57.3%) | 97 (42.7%) |
| Bachelor's Degree | 31 (77.5%) | 9 (22.5%) |
| Graduate Degree | 58 (90.6%) | 6 (9.4%) |
| Total | 318 (43.0%) | 422 (57.0%) |
Income in Middletown
Income Overview in Middletown
Per Capita Income in Middletown is $28,831, while median incomes of families and households are $65,601 and $50,457 respectively.
| Characteristic | Number | Measure |
| Per Capita Income | 50,514 | $28,831 |
| Median Family Income | 12,093 | $65,601 |
| Mean Family Income | 12,093 | $81,902 |
| Median Household Income | 20,941 | $50,457 |
| Mean Household Income | 20,941 | $66,889 |
| Income Deficit | 12,093 | $13,036 |
| Wage / Income Gap (%) | 50,514 | 37.46% |
| Wage / Income Gap ($) | 50,514 | 62.54¢ per $1 |
| Gini / Inequality Index | 50,514 | 0.45 |
Earnings by Sex in Middletown
Average Earnings in Middletown are $33,207, $40,529 for men and $25,345 for women, a difference of 37.5%.
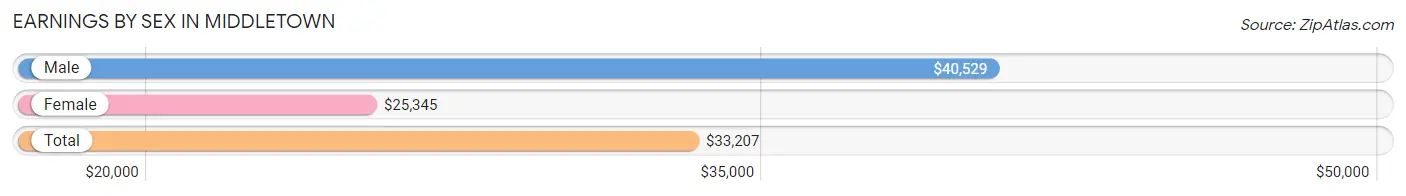
| Sex | Number | Average Earnings |
| Male | 13,356 (52.8%) | $40,529 |
| Female | 11,957 (47.2%) | $25,345 |
| Total | 25,313 (100.0%) | $33,207 |
Earnings by Sex by Income Bracket in Middletown
The most common earnings brackets in Middletown are $55,000 to $64,999 for men (1,397 | 10.5%) and $25,000 to $29,999 for women (1,186 | 9.9%).
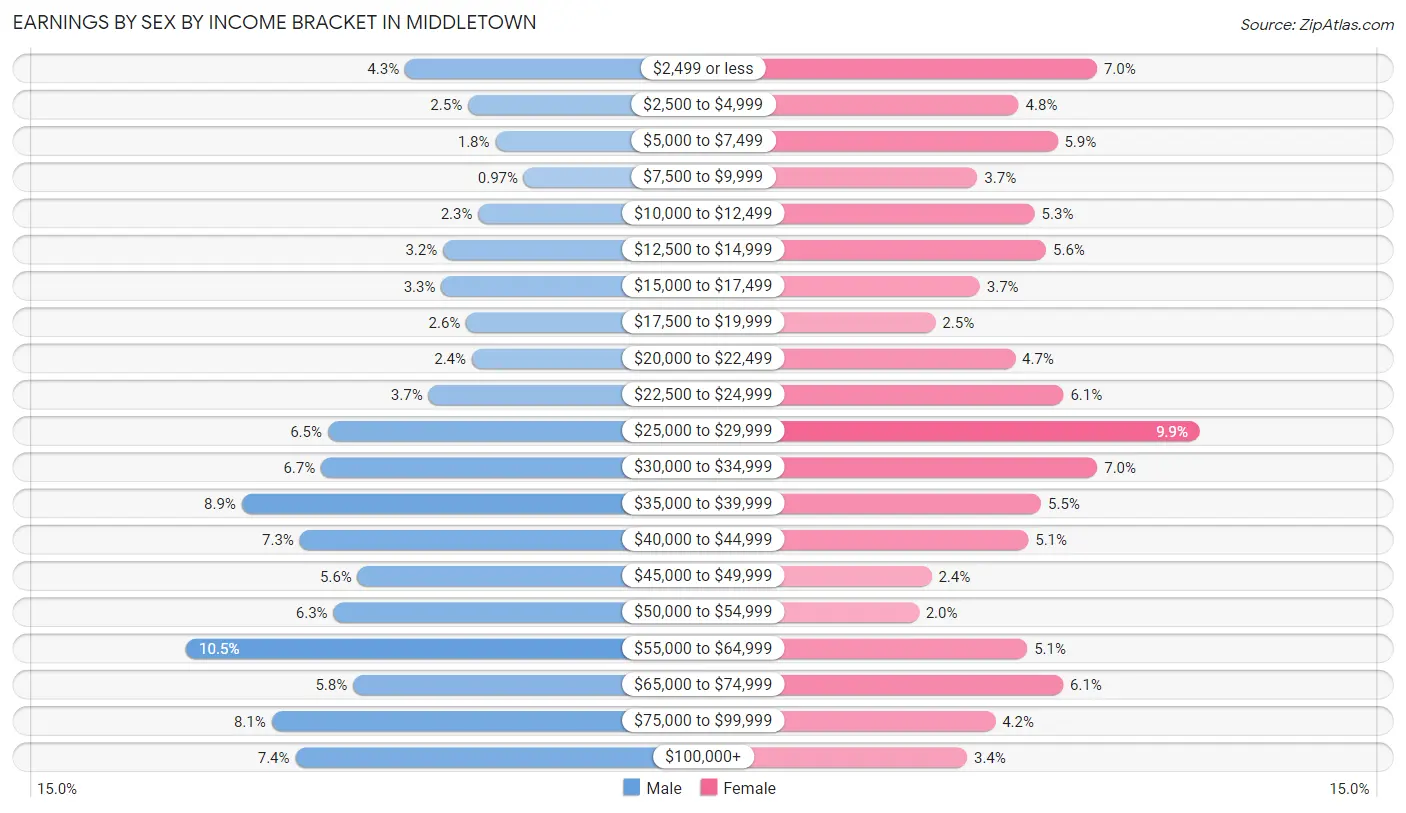
| Income | Male | Female |
| $2,499 or less | 576 (4.3%) | 841 (7.0%) |
| $2,500 to $4,999 | 339 (2.5%) | 578 (4.8%) |
| $5,000 to $7,499 | 237 (1.8%) | 708 (5.9%) |
| $7,500 to $9,999 | 130 (1.0%) | 439 (3.7%) |
| $10,000 to $12,499 | 300 (2.2%) | 631 (5.3%) |
| $12,500 to $14,999 | 433 (3.2%) | 669 (5.6%) |
| $15,000 to $17,499 | 439 (3.3%) | 447 (3.7%) |
| $17,500 to $19,999 | 346 (2.6%) | 298 (2.5%) |
| $20,000 to $22,499 | 324 (2.4%) | 565 (4.7%) |
| $22,500 to $24,999 | 487 (3.6%) | 728 (6.1%) |
| $25,000 to $29,999 | 866 (6.5%) | 1,186 (9.9%) |
| $30,000 to $34,999 | 891 (6.7%) | 842 (7.0%) |
| $35,000 to $39,999 | 1,189 (8.9%) | 653 (5.5%) |
| $40,000 to $44,999 | 971 (7.3%) | 610 (5.1%) |
| $45,000 to $49,999 | 753 (5.6%) | 285 (2.4%) |
| $50,000 to $54,999 | 844 (6.3%) | 241 (2.0%) |
| $55,000 to $64,999 | 1,397 (10.5%) | 606 (5.1%) |
| $65,000 to $74,999 | 770 (5.8%) | 727 (6.1%) |
| $75,000 to $99,999 | 1,077 (8.1%) | 499 (4.2%) |
| $100,000+ | 987 (7.4%) | 404 (3.4%) |
| Total | 13,356 (100.0%) | 11,957 (100.0%) |
Earnings by Sex by Educational Attainment in Middletown
Average earnings in Middletown are $45,190 for men and $29,457 for women, a difference of 34.8%. Men with an educational attainment of graduate degree enjoy the highest average annual earnings of $71,979, while those with less than high school education earn the least with $30,912. Women with an educational attainment of graduate degree earn the most with the average annual earnings of $69,691, while those with less than high school education have the smallest earnings of $21,543.
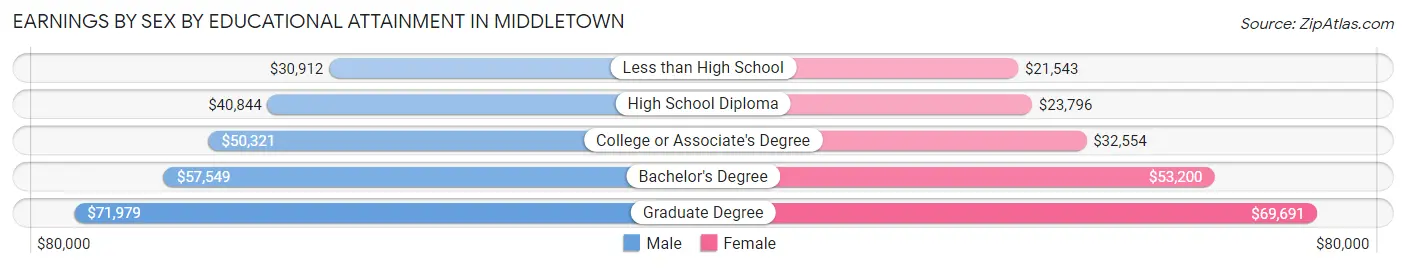
| Educational Attainment | Male Income | Female Income |
| Less than High School | $30,912 | $21,543 |
| High School Diploma | $40,844 | $23,796 |
| College or Associate's Degree | $50,321 | $32,554 |
| Bachelor's Degree | $57,549 | $53,200 |
| Graduate Degree | $71,979 | $69,691 |
| Total | $45,190 | $29,457 |
Family Income in Middletown
Family Income Brackets in Middletown
According to the Middletown family income data, there are 2,515 families falling into the $50,000 to $74,999 income range, which is the most common income bracket and makes up 20.8% of all families. Conversely, the $10,000 to $14,999 income bracket is the least frequent group with only 351 families (2.9%) belonging to this category.
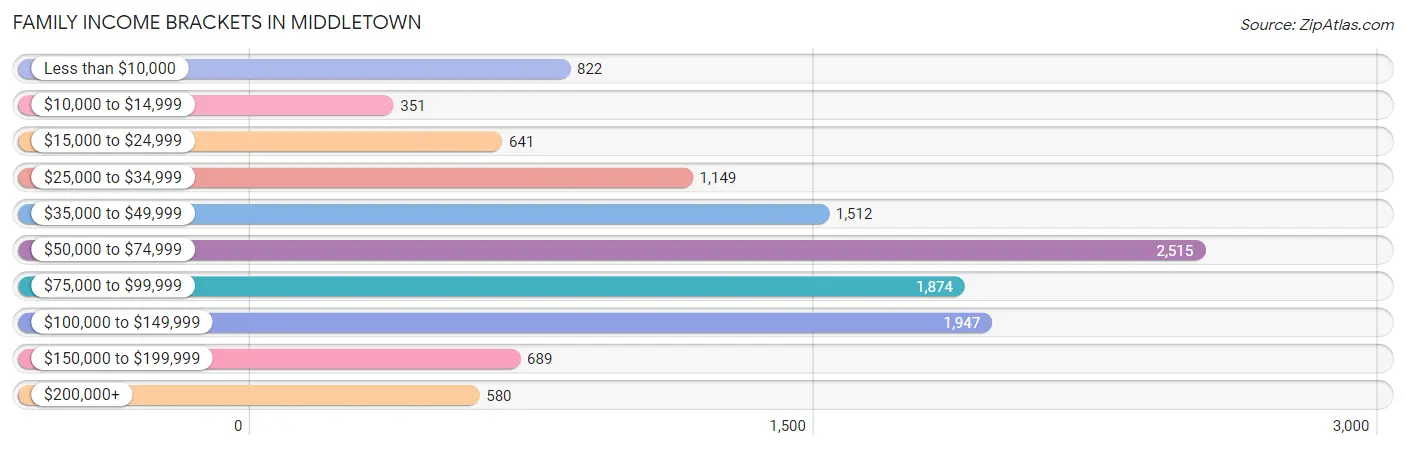
| Income Bracket | # Families | % Families |
| Less than $10,000 | 822 | 6.8% |
| $10,000 to $14,999 | 351 | 2.9% |
| $15,000 to $24,999 | 641 | 5.3% |
| $25,000 to $34,999 | 1,149 | 9.5% |
| $35,000 to $49,999 | 1,512 | 12.5% |
| $50,000 to $74,999 | 2,515 | 20.8% |
| $75,000 to $99,999 | 1,874 | 15.5% |
| $100,000 to $149,999 | 1,947 | 16.1% |
| $150,000 to $199,999 | 689 | 5.7% |
| $200,000+ | 580 | 4.8% |
Family Income by Famaliy Size in Middletown
7+ person families (96 | 0.8%) account for the highest median family income in Middletown with $111,042 per family, while 2-person families (6,318 | 52.2%) have the highest median income of $31,834 per family member.
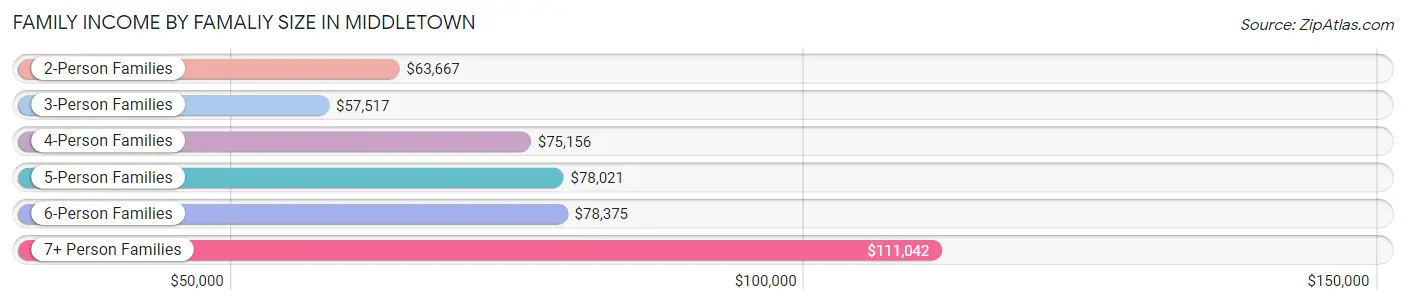
| Income Bracket | # Families | Median Income |
| 2-Person Families | 6,318 (52.2%) | $63,667 |
| 3-Person Families | 2,539 (21.0%) | $57,517 |
| 4-Person Families | 1,779 (14.7%) | $75,156 |
| 5-Person Families | 813 (6.7%) | $78,021 |
| 6-Person Families | 548 (4.5%) | $78,375 |
| 7+ Person Families | 96 (0.8%) | $111,042 |
| Total | 12,093 (100.0%) | $65,601 |
Family Income by Number of Earners in Middletown
The median family income in Middletown is $65,601, with families comprising 3+ earners (1,208) having the highest median family income of $112,344, while families with no earners (2,463) have the lowest median family income of $33,563, accounting for 10.0% and 20.4% of families, respectively.
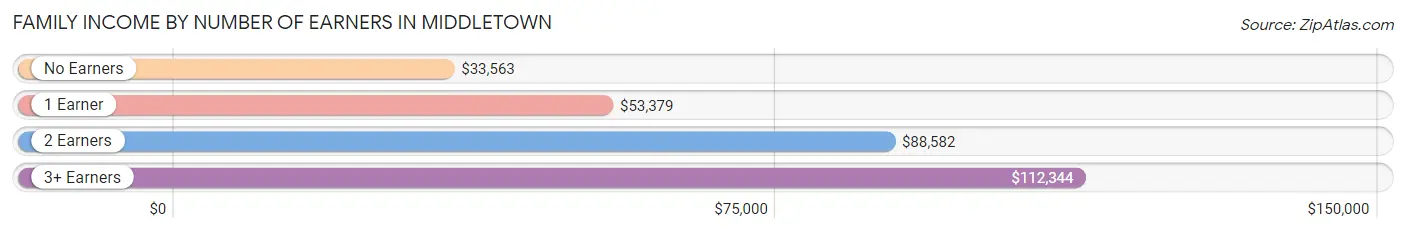
| Number of Earners | # Families | Median Income |
| No Earners | 2,463 (20.4%) | $33,563 |
| 1 Earner | 4,569 (37.8%) | $53,379 |
| 2 Earners | 3,853 (31.9%) | $88,582 |
| 3+ Earners | 1,208 (10.0%) | $112,344 |
| Total | 12,093 (100.0%) | $65,601 |
Household Income in Middletown
Household Income Brackets in Middletown
With 3,832 households falling in the category, the $50,000 to $74,999 income range is the most frequent in Middletown, accounting for 18.3% of all households. In contrast, only 649 households (3.1%) fall into the $200,000+ income bracket, making it the least populous group.
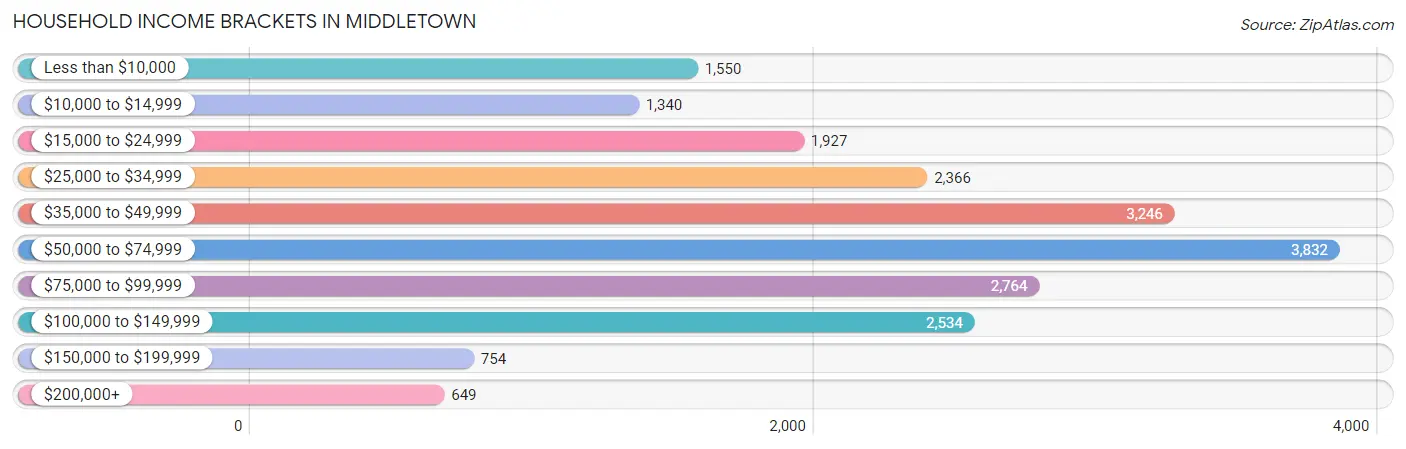
| Income Bracket | # Households | % Households |
| Less than $10,000 | 1,550 | 7.4% |
| $10,000 to $14,999 | 1,340 | 6.4% |
| $15,000 to $24,999 | 1,927 | 9.2% |
| $25,000 to $34,999 | 2,366 | 11.3% |
| $35,000 to $49,999 | 3,246 | 15.5% |
| $50,000 to $74,999 | 3,832 | 18.3% |
| $75,000 to $99,999 | 2,764 | 13.2% |
| $100,000 to $149,999 | 2,534 | 12.1% |
| $150,000 to $199,999 | 754 | 3.6% |
| $200,000+ | 649 | 3.1% |
Household Income by Householder Age in Middletown
The median household income in Middletown is $50,457, with the highest median household income of $57,742 found in the 45 to 64 years age bracket for the primary householder. A total of 7,621 households (36.4%) fall into this category. Meanwhile, the 15 to 24 years age bracket for the primary householder has the lowest median household income of $38,694, with 1,294 households (6.2%) in this group.
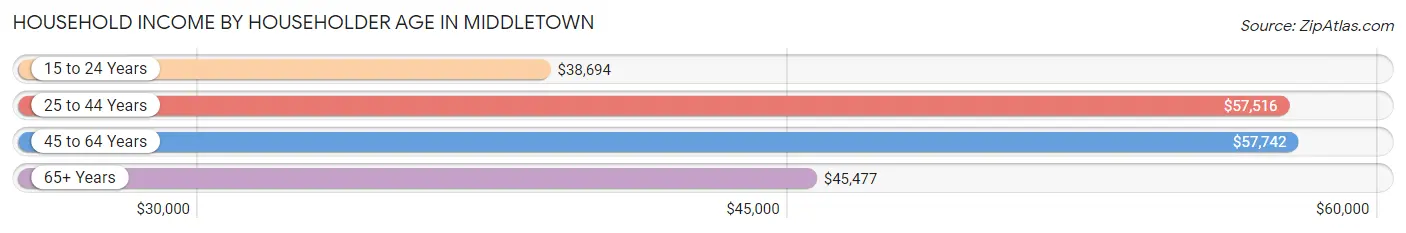
| Income Bracket | # Households | Median Income |
| 15 to 24 Years | 1,294 (6.2%) | $38,694 |
| 25 to 44 Years | 6,055 (28.9%) | $57,516 |
| 45 to 64 Years | 7,621 (36.4%) | $57,742 |
| 65+ Years | 5,971 (28.5%) | $45,477 |
| Total | 20,941 (100.0%) | $50,457 |
Poverty in Middletown
Income Below Poverty by Sex and Age in Middletown
With 17.3% poverty level for males and 21.0% for females among the residents of Middletown, 12 to 14 year old males and 15 year old females are the most vulnerable to poverty, with 343 males (34.8%) and 91 females (38.9%) in their respective age groups living below the poverty level.
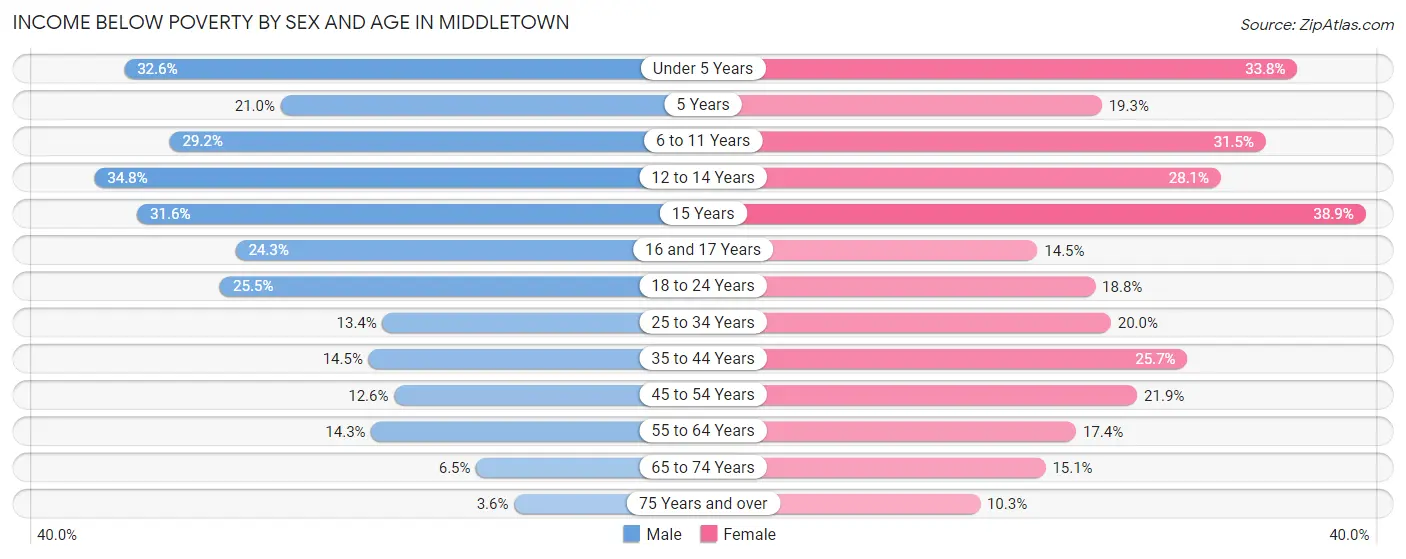
| Age Bracket | Male | Female |
| Under 5 Years | 401 (32.6%) | 462 (33.8%) |
| 5 Years | 30 (21.0%) | 66 (19.3%) |
| 6 to 11 Years | 524 (29.2%) | 612 (31.5%) |
| 12 to 14 Years | 343 (34.8%) | 278 (28.1%) |
| 15 Years | 81 (31.6%) | 91 (38.9%) |
| 16 and 17 Years | 157 (24.3%) | 80 (14.5%) |
| 18 to 24 Years | 680 (25.5%) | 519 (18.8%) |
| 25 to 34 Years | 495 (13.4%) | 602 (20.0%) |
| 35 to 44 Years | 406 (14.4%) | 734 (25.7%) |
| 45 to 54 Years | 364 (12.6%) | 686 (21.9%) |
| 55 to 64 Years | 477 (14.2%) | 612 (17.4%) |
| 65 to 74 Years | 141 (6.5%) | 483 (15.1%) |
| 75 Years and over | 50 (3.6%) | 189 (10.3%) |
| Total | 4,149 (17.3%) | 5,414 (21.0%) |
Income Above Poverty by Sex and Age in Middletown
According to the poverty statistics in Middletown, males aged 75 years and over and females aged 75 years and over are the age groups that are most secure financially, with 96.4% of males and 89.7% of females in these age groups living above the poverty line.
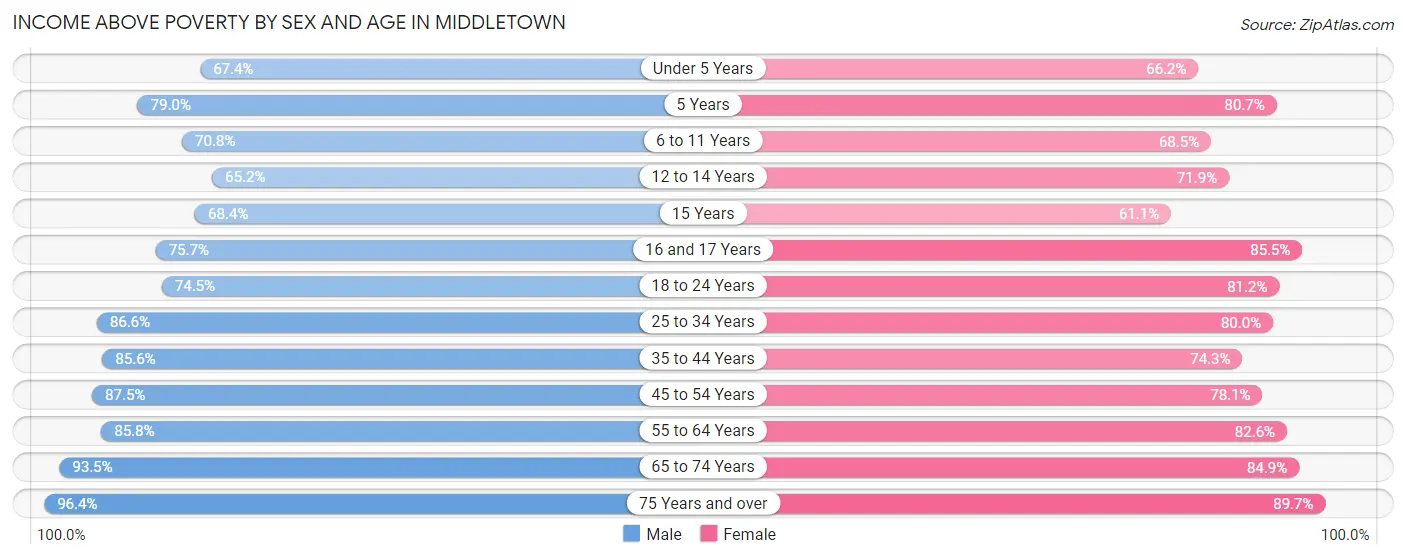
| Age Bracket | Male | Female |
| Under 5 Years | 829 (67.4%) | 904 (66.2%) |
| 5 Years | 113 (79.0%) | 276 (80.7%) |
| 6 to 11 Years | 1,268 (70.8%) | 1,332 (68.5%) |
| 12 to 14 Years | 642 (65.2%) | 710 (71.9%) |
| 15 Years | 175 (68.4%) | 143 (61.1%) |
| 16 and 17 Years | 488 (75.7%) | 471 (85.5%) |
| 18 to 24 Years | 1,989 (74.5%) | 2,240 (81.2%) |
| 25 to 34 Years | 3,194 (86.6%) | 2,413 (80.0%) |
| 35 to 44 Years | 2,403 (85.6%) | 2,126 (74.3%) |
| 45 to 54 Years | 2,537 (87.5%) | 2,442 (78.1%) |
| 55 to 64 Years | 2,870 (85.8%) | 2,907 (82.6%) |
| 65 to 74 Years | 2,042 (93.5%) | 2,711 (84.9%) |
| 75 Years and over | 1,322 (96.4%) | 1,654 (89.7%) |
| Total | 19,872 (82.7%) | 20,329 (79.0%) |
Income Below Poverty Among Married-Couple Families in Middletown
The poverty statistics for married-couple families in Middletown show that 4.5% or 323 of the total 7,118 families live below the poverty line. Families with 3 or 4 children have the highest poverty rate of 11.7%, comprising of 58 families. On the other hand, families with 5 or more children have the lowest poverty rate of 0.0%, which includes 0 families.
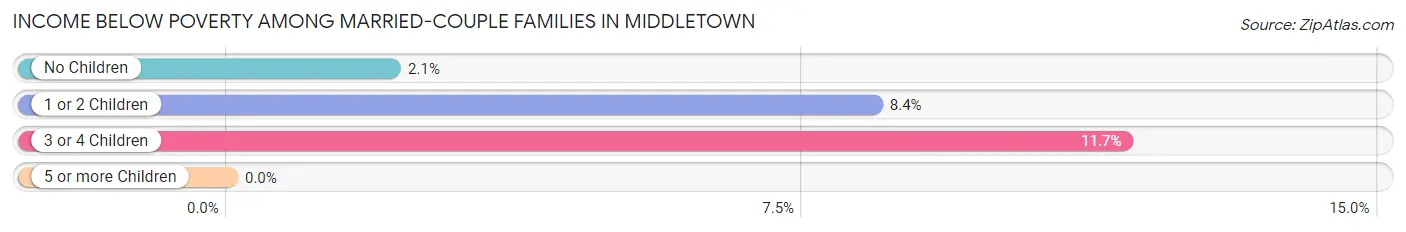
| Children | Above Poverty | Below Poverty |
| No Children | 4,549 (97.9%) | 99 (2.1%) |
| 1 or 2 Children | 1,806 (91.6%) | 166 (8.4%) |
| 3 or 4 Children | 438 (88.3%) | 58 (11.7%) |
| 5 or more Children | 2 (100.0%) | 0 (0.0%) |
| Total | 6,795 (95.5%) | 323 (4.5%) |
Income Below Poverty Among Single-Parent Households in Middletown
According to the poverty data in Middletown, 5.3% or 87 single-father households and 41.3% or 1,376 single-mother households are living below the poverty line. Among single-father households, those with 5 or more children have the highest poverty rate, with 18 households (60.0%) experiencing poverty. Likewise, among single-mother households, those with 5 or more children have the highest poverty rate, with 36 households (100.0%) falling below the poverty line.
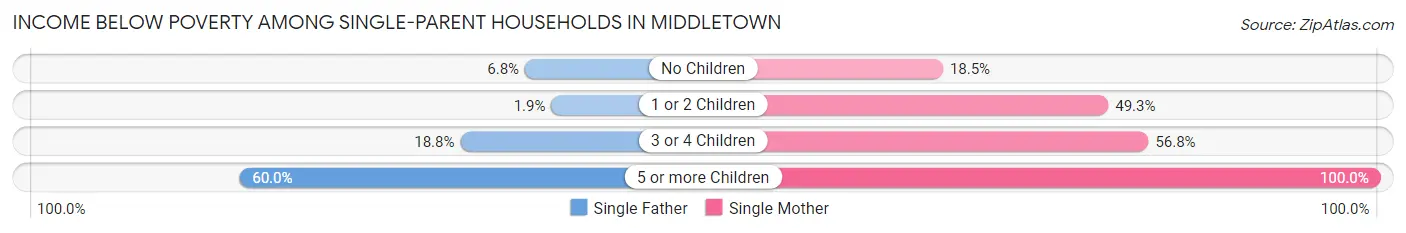
| Children | Single Father | Single Mother |
| No Children | 37 (6.8%) | 198 (18.5%) |
| 1 or 2 Children | 19 (1.9%) | 798 (49.3%) |
| 3 or 4 Children | 13 (18.8%) | 344 (56.8%) |
| 5 or more Children | 18 (60.0%) | 36 (100.0%) |
| Total | 87 (5.3%) | 1,376 (41.3%) |
Income Below Poverty Among Married-Couple vs Single-Parent Households in Middletown
The poverty data for Middletown shows that 323 of the married-couple family households (4.5%) and 1,463 of the single-parent households (29.4%) are living below the poverty level. Within the married-couple family households, those with 3 or 4 children have the highest poverty rate, with 58 households (11.7%) falling below the poverty line. Among the single-parent households, those with 5 or more children have the highest poverty rate, with 54 household (81.8%) living below poverty.
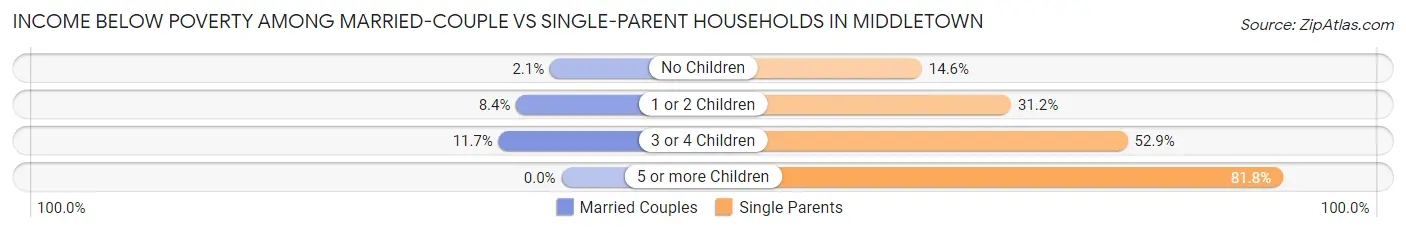
| Children | Married-Couple Families | Single-Parent Households |
| No Children | 99 (2.1%) | 235 (14.6%) |
| 1 or 2 Children | 166 (8.4%) | 817 (31.2%) |
| 3 or 4 Children | 58 (11.7%) | 357 (52.9%) |
| 5 or more Children | 0 (0.0%) | 54 (81.8%) |
| Total | 323 (4.5%) | 1,463 (29.4%) |
Employment Characteristics in Middletown
Employment by Class of Employer in Middletown
Among the 21,786 employed individuals in Middletown, private company employees (16,906 | 77.6%), not-for-profit organizations (1,848 | 8.5%), and local government employees (991 | 4.5%) make up the most common classes of employment.
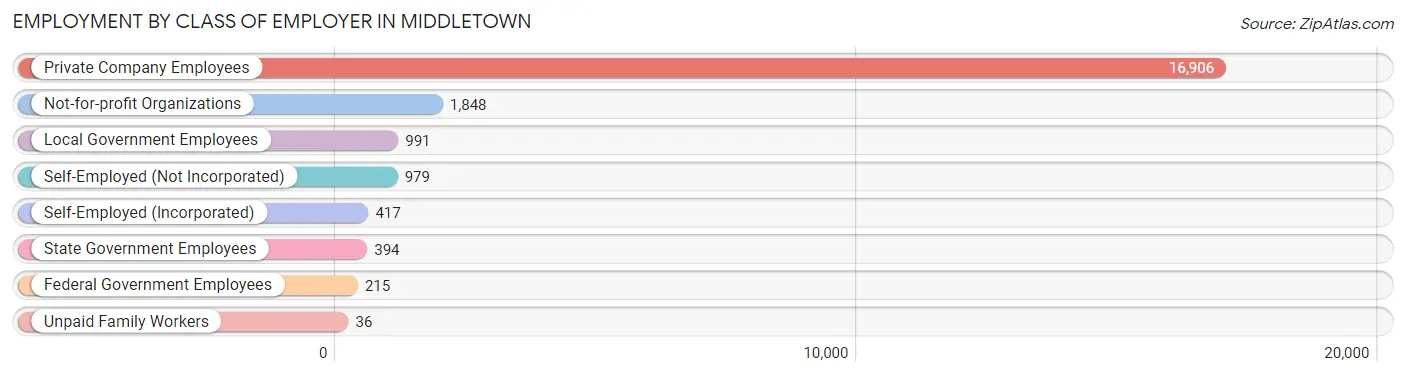
| Employer Class | # Employees | % Employees |
| Private Company Employees | 16,906 | 77.6% |
| Self-Employed (Incorporated) | 417 | 1.9% |
| Self-Employed (Not Incorporated) | 979 | 4.5% |
| Not-for-profit Organizations | 1,848 | 8.5% |
| Local Government Employees | 991 | 4.5% |
| State Government Employees | 394 | 1.8% |
| Federal Government Employees | 215 | 1.0% |
| Unpaid Family Workers | 36 | 0.2% |
| Total | 21,786 | 100.0% |
Employment Status by Age in Middletown
According to the labor force statistics for Middletown, out of the total population over 16 years of age (41,053), 59.0% or 24,221 individuals are in the labor force, with 7.2% or 1,744 of them unemployed. The age group with the highest labor force participation rate is 25 to 29 years, with 81.5% or 3,062 individuals in the labor force. Within the labor force, the 16 to 19 years age range has the highest percentage of unemployed individuals, with 14.4% or 126 of them being unemployed.
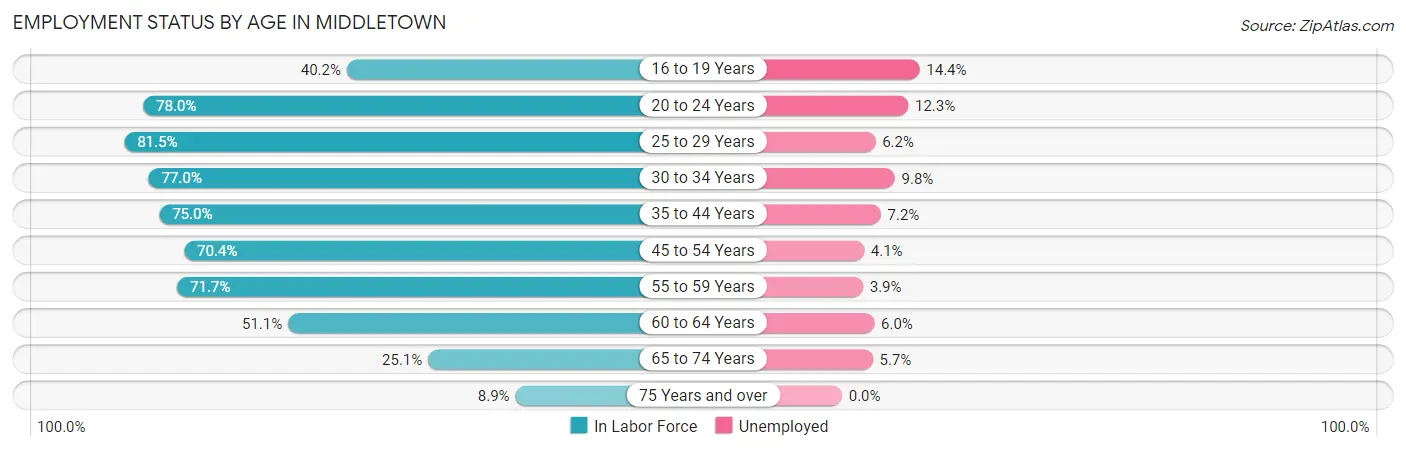
| Age Bracket | In Labor Force | Unemployed |
| 16 to 19 Years | 877 (40.2%) | 126 (14.4%) |
| 20 to 24 Years | 3,472 (78.0%) | 427 (12.3%) |
| 25 to 29 Years | 3,062 (81.5%) | 190 (6.2%) |
| 30 to 34 Years | 2,303 (77.0%) | 226 (9.8%) |
| 35 to 44 Years | 4,268 (75.0%) | 307 (7.2%) |
| 45 to 54 Years | 4,280 (70.4%) | 175 (4.1%) |
| 55 to 59 Years | 2,517 (71.7%) | 98 (3.9%) |
| 60 to 64 Years | 1,743 (51.1%) | 105 (6.0%) |
| 65 to 74 Years | 1,387 (25.1%) | 79 (5.7%) |
| 75 Years and over | 308 (8.9%) | 0 (0.0%) |
| Total | 24,221 (59.0%) | 1,744 (7.2%) |
Employment Status by Educational Attainment in Middletown
According to labor force statistics for Middletown, 71.4% of individuals (18,162) out of the total population between 25 and 64 years of age (25,437) are in the labor force, with 6.1% or 1,108 of them being unemployed. The group with the highest labor force participation rate are those with the educational attainment of bachelor's degree or higher, with 86.9% or 3,532 individuals in the labor force. Within the labor force, individuals with less than high school education have the highest percentage of unemployment, with 15.6% or 271 of them being unemployed.
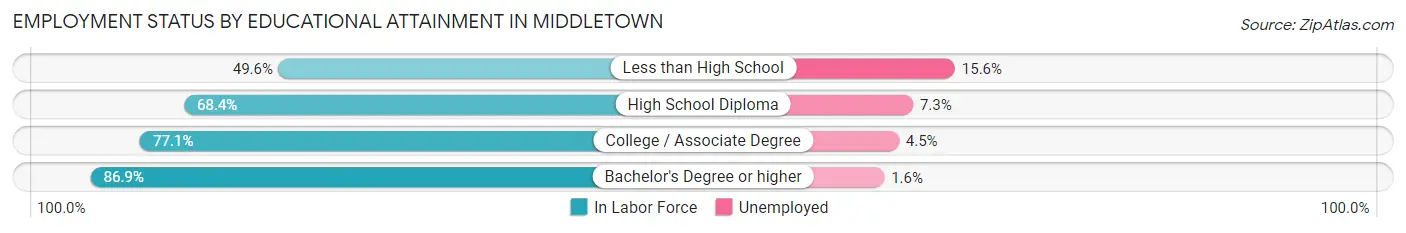
| Educational Attainment | In Labor Force | Unemployed |
| Less than High School | 1,734 (49.6%) | 545 (15.6%) |
| High School Diploma | 6,867 (68.4%) | 733 (7.3%) |
| College / Associate Degree | 6,042 (77.1%) | 353 (4.5%) |
| Bachelor's Degree or higher | 3,532 (86.9%) | 65 (1.6%) |
| Total | 18,162 (71.4%) | 1,552 (6.1%) |
Employment Occupations by Sex in Middletown
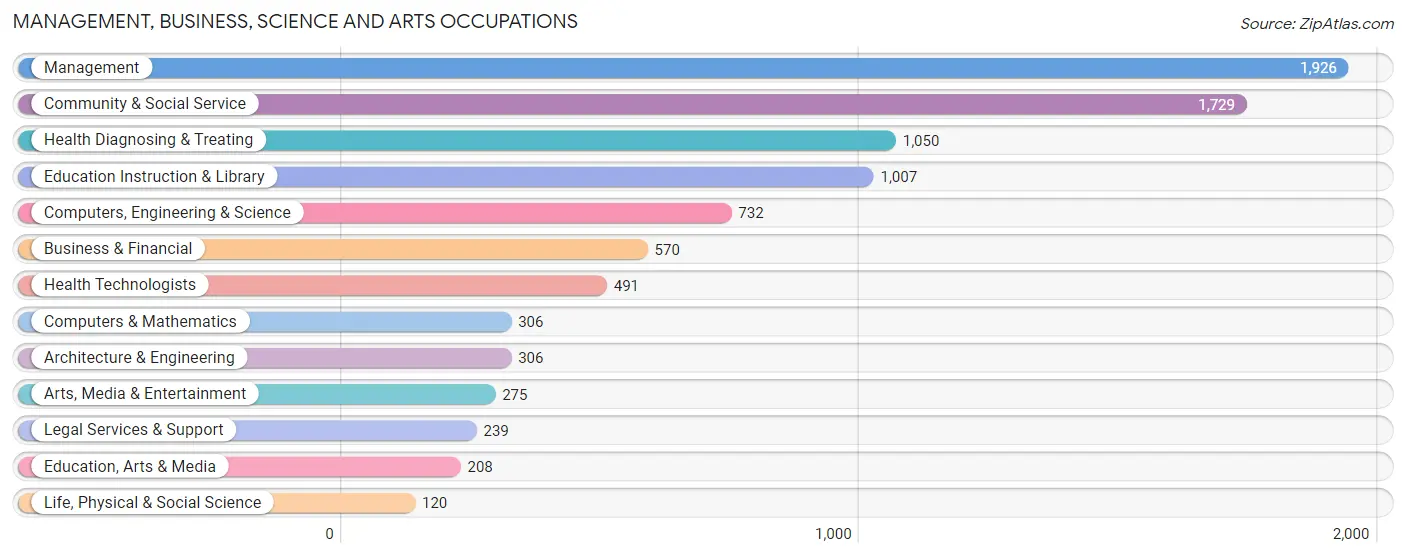
Management, Business, Science and Arts Occupations
The most common Management, Business, Science and Arts occupations in Middletown are Management (1,926 | 8.6%), Community & Social Service (1,729 | 7.7%), Health Diagnosing & Treating (1,050 | 4.7%), Education Instruction & Library (1,007 | 4.5%), and Computers, Engineering & Science (732 | 3.3%).
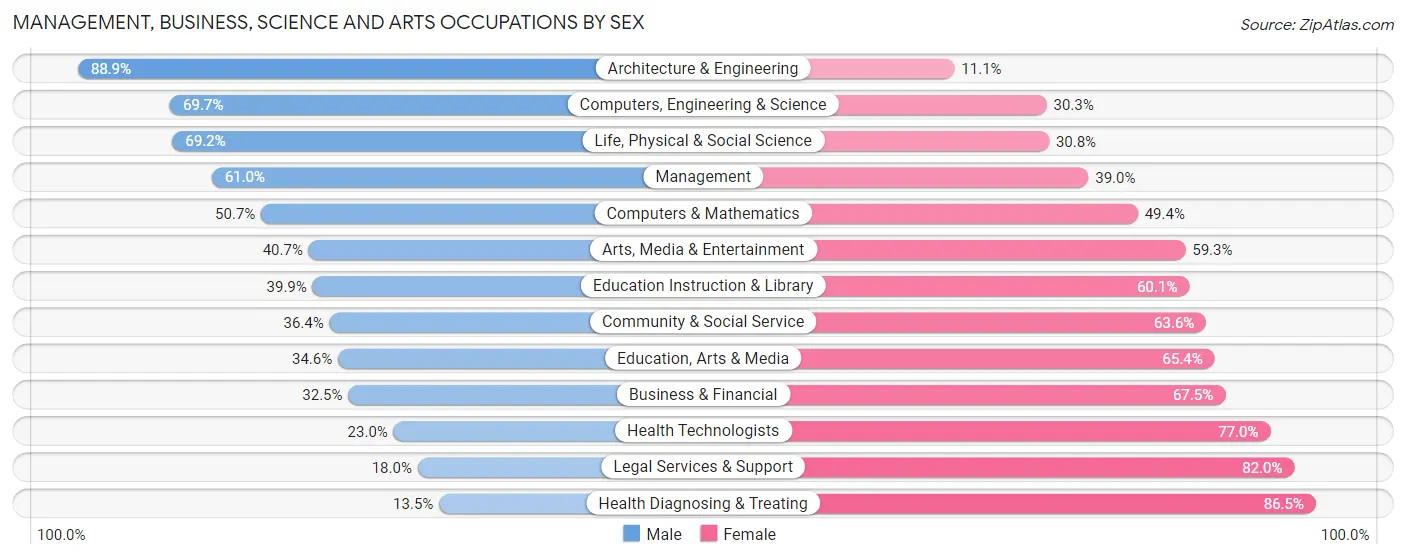
Management, Business, Science and Arts Occupations by Sex
Within the Management, Business, Science and Arts occupations in Middletown, the most male-oriented occupations are Architecture & Engineering (88.9%), Computers, Engineering & Science (69.7%), and Life, Physical & Social Science (69.2%), while the most female-oriented occupations are Health Diagnosing & Treating (86.5%), Legal Services & Support (82.0%), and Health Technologists (77.0%).
| Occupation | Male | Female |
| Management | 1,174 (61.0%) | 752 (39.0%) |
| Business & Financial | 185 (32.5%) | 385 (67.5%) |
| Computers, Engineering & Science | 510 (69.7%) | 222 (30.3%) |
| Computers & Mathematics | 155 (50.6%) | 151 (49.3%) |
| Architecture & Engineering | 272 (88.9%) | 34 (11.1%) |
| Life, Physical & Social Science | 83 (69.2%) | 37 (30.8%) |
| Community & Social Service | 629 (36.4%) | 1,100 (63.6%) |
| Education, Arts & Media | 72 (34.6%) | 136 (65.4%) |
| Legal Services & Support | 43 (18.0%) | 196 (82.0%) |
| Education Instruction & Library | 402 (39.9%) | 605 (60.1%) |
| Arts, Media & Entertainment | 112 (40.7%) | 163 (59.3%) |
| Health Diagnosing & Treating | 142 (13.5%) | 908 (86.5%) |
| Health Technologists | 113 (23.0%) | 378 (77.0%) |
| Total (Category) | 2,640 (44.0%) | 3,367 (56.0%) |
| Total (Overall) | 12,047 (53.6%) | 10,428 (46.4%) |
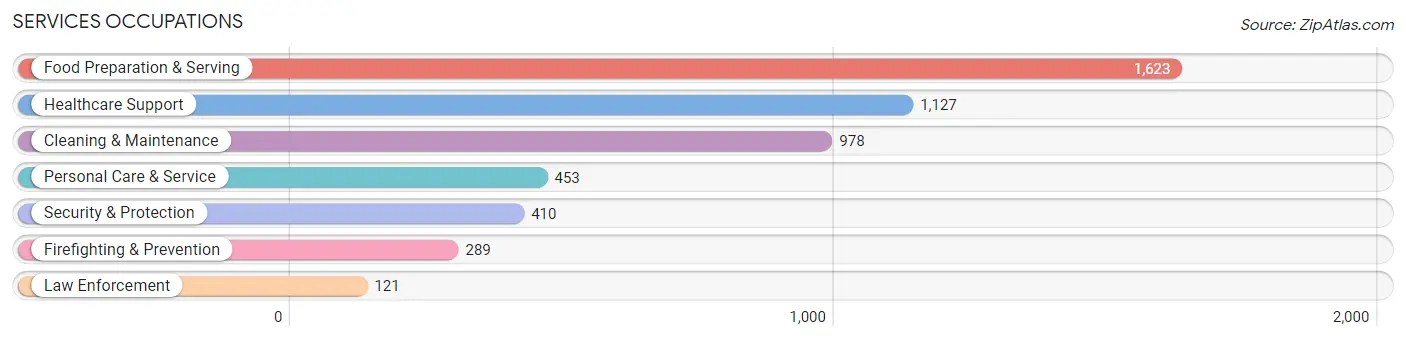
Services Occupations
The most common Services occupations in Middletown are Food Preparation & Serving (1,623 | 7.2%), Healthcare Support (1,127 | 5.0%), Cleaning & Maintenance (978 | 4.3%), Personal Care & Service (453 | 2.0%), and Security & Protection (410 | 1.8%).
Services Occupations by Sex
Within the Services occupations in Middletown, the most male-oriented occupations are Law Enforcement (87.6%), Security & Protection (71.0%), and Firefighting & Prevention (64.0%), while the most female-oriented occupations are Healthcare Support (89.8%), Personal Care & Service (82.3%), and Food Preparation & Serving (59.0%).
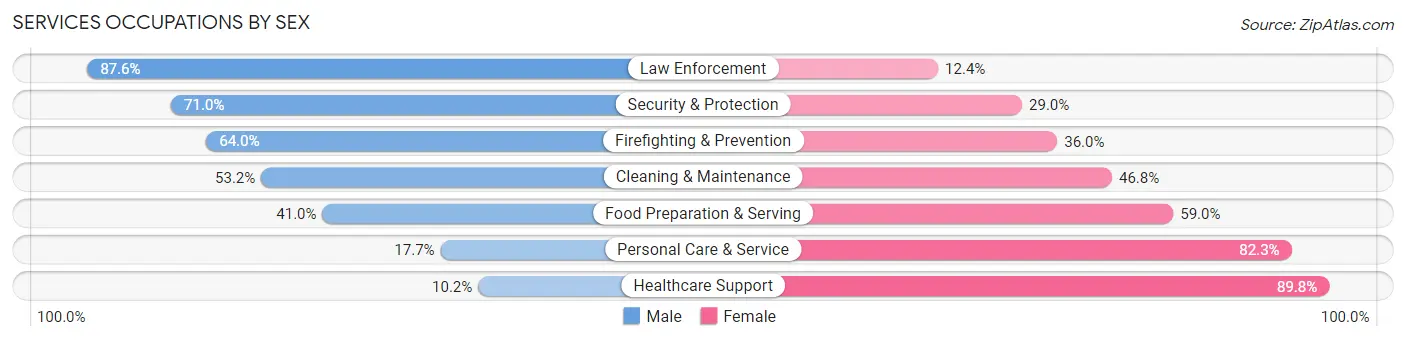
| Occupation | Male | Female |
| Healthcare Support | 115 (10.2%) | 1,012 (89.8%) |
| Security & Protection | 291 (71.0%) | 119 (29.0%) |
| Firefighting & Prevention | 185 (64.0%) | 104 (36.0%) |
| Law Enforcement | 106 (87.6%) | 15 (12.4%) |
| Food Preparation & Serving | 666 (41.0%) | 957 (59.0%) |
| Cleaning & Maintenance | 520 (53.2%) | 458 (46.8%) |
| Personal Care & Service | 80 (17.7%) | 373 (82.3%) |
| Total (Category) | 1,672 (36.4%) | 2,919 (63.6%) |
| Total (Overall) | 12,047 (53.6%) | 10,428 (46.4%) |
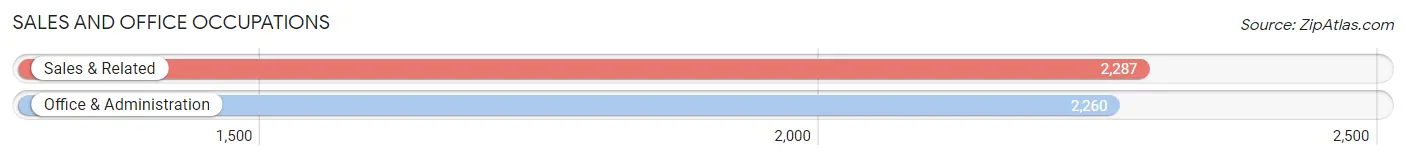
Sales and Office Occupations
The most common Sales and Office occupations in Middletown are Sales & Related (2,287 | 10.2%), and Office & Administration (2,260 | 10.1%).
Sales and Office Occupations by Sex
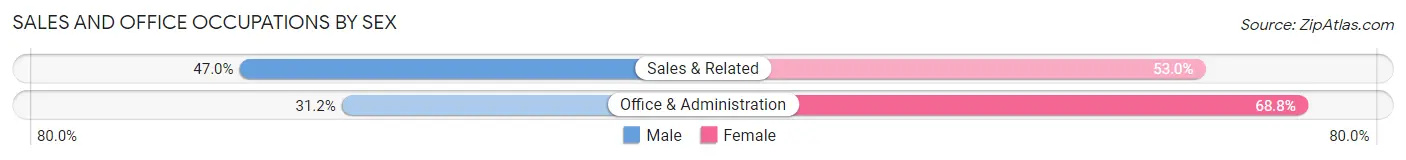
| Occupation | Male | Female |
| Sales & Related | 1,074 (47.0%) | 1,213 (53.0%) |
| Office & Administration | 706 (31.2%) | 1,554 (68.8%) |
| Total (Category) | 1,780 (39.2%) | 2,767 (60.9%) |
| Total (Overall) | 12,047 (53.6%) | 10,428 (46.4%) |
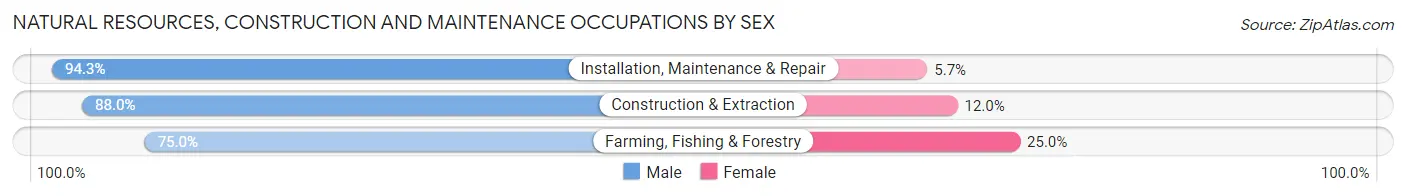
Natural Resources, Construction and Maintenance Occupations
The most common Natural Resources, Construction and Maintenance occupations in Middletown are Construction & Extraction (1,035 | 4.6%), Installation, Maintenance & Repair (736 | 3.3%), and Farming, Fishing & Forestry (36 | 0.2%).
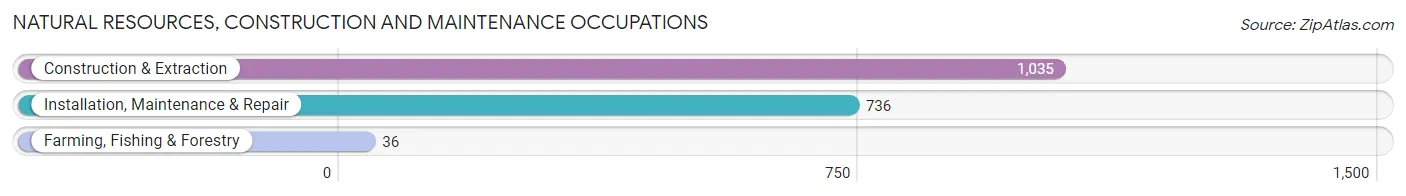
Natural Resources, Construction and Maintenance Occupations by Sex
| Occupation | Male | Female |
| Farming, Fishing & Forestry | 27 (75.0%) | 9 (25.0%) |
| Construction & Extraction | 911 (88.0%) | 124 (12.0%) |
| Installation, Maintenance & Repair | 694 (94.3%) | 42 (5.7%) |
| Total (Category) | 1,632 (90.3%) | 175 (9.7%) |
| Total (Overall) | 12,047 (53.6%) | 10,428 (46.4%) |
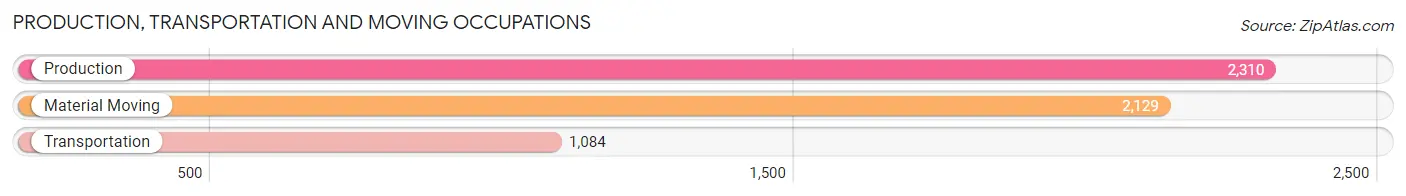
Production, Transportation and Moving Occupations
The most common Production, Transportation and Moving occupations in Middletown are Production (2,310 | 10.3%), Material Moving (2,129 | 9.5%), and Transportation (1,084 | 4.8%).
Production, Transportation and Moving Occupations by Sex
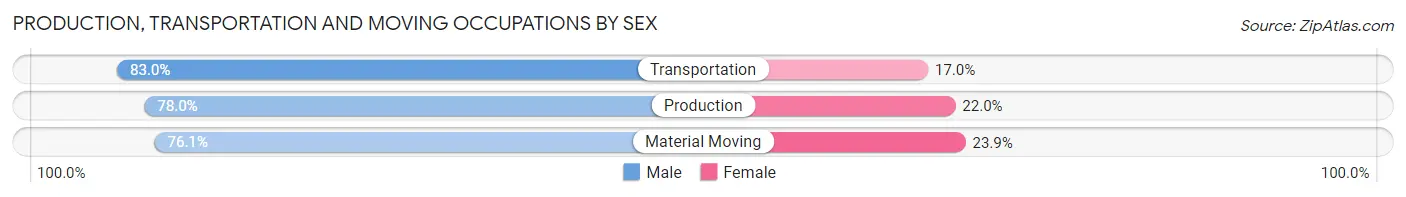
| Occupation | Male | Female |
| Production | 1,802 (78.0%) | 508 (22.0%) |
| Transportation | 900 (83.0%) | 184 (17.0%) |
| Material Moving | 1,621 (76.1%) | 508 (23.9%) |
| Total (Category) | 4,323 (78.3%) | 1,200 (21.7%) |
| Total (Overall) | 12,047 (53.6%) | 10,428 (46.4%) |
Employment Industries by Sex in Middletown
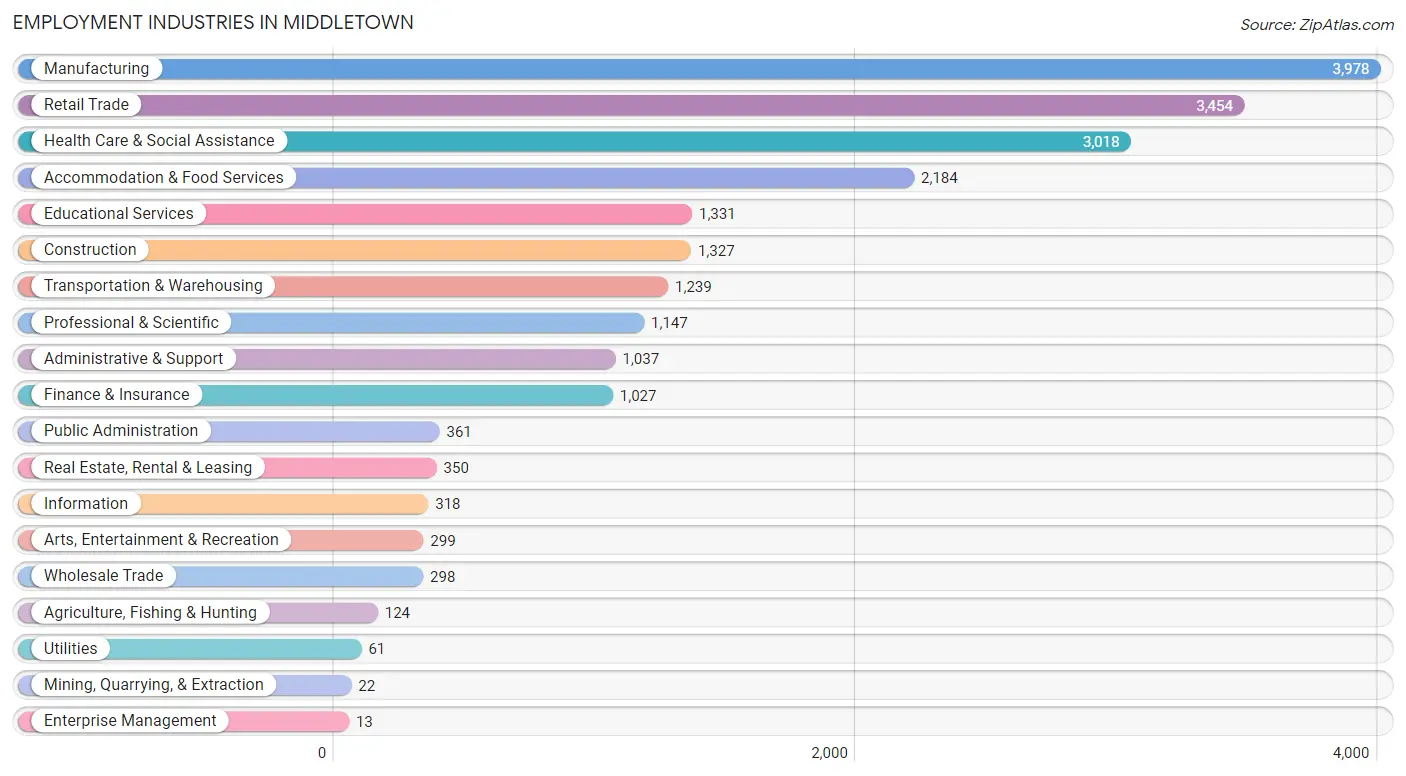
Employment Industries in Middletown
The major employment industries in Middletown include Manufacturing (3,978 | 17.7%), Retail Trade (3,454 | 15.4%), Health Care & Social Assistance (3,018 | 13.4%), Accommodation & Food Services (2,184 | 9.7%), and Educational Services (1,331 | 5.9%).
Employment Industries by Sex in Middletown
The Middletown industries that see more men than women are Mining, Quarrying, & Extraction (100.0%), Construction (86.4%), and Information (85.9%), whereas the industries that tend to have a higher number of women are Health Care & Social Assistance (88.7%), Finance & Insurance (65.3%), and Educational Services (65.2%).
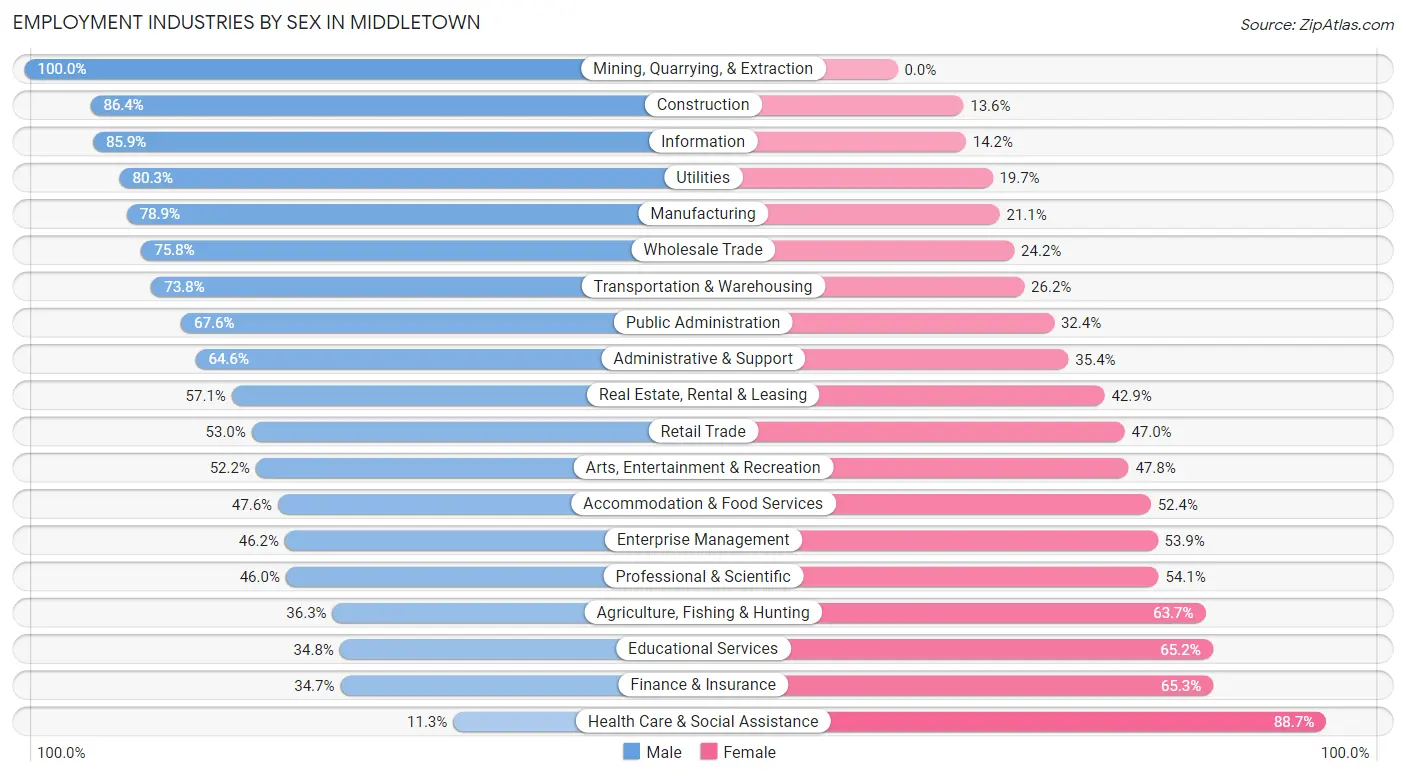
| Industry | Male | Female |
| Agriculture, Fishing & Hunting | 45 (36.3%) | 79 (63.7%) |
| Mining, Quarrying, & Extraction | 22 (100.0%) | 0 (0.0%) |
| Construction | 1,146 (86.4%) | 181 (13.6%) |
| Manufacturing | 3,137 (78.9%) | 841 (21.1%) |
| Wholesale Trade | 226 (75.8%) | 72 (24.2%) |
| Retail Trade | 1,831 (53.0%) | 1,623 (47.0%) |
| Transportation & Warehousing | 914 (73.8%) | 325 (26.2%) |
| Utilities | 49 (80.3%) | 12 (19.7%) |
| Information | 273 (85.9%) | 45 (14.1%) |
| Finance & Insurance | 356 (34.7%) | 671 (65.3%) |
| Real Estate, Rental & Leasing | 200 (57.1%) | 150 (42.9%) |
| Professional & Scientific | 527 (46.0%) | 620 (54.0%) |
| Enterprise Management | 6 (46.2%) | 7 (53.8%) |
| Administrative & Support | 670 (64.6%) | 367 (35.4%) |
| Educational Services | 463 (34.8%) | 868 (65.2%) |
| Health Care & Social Assistance | 341 (11.3%) | 2,677 (88.7%) |
| Arts, Entertainment & Recreation | 156 (52.2%) | 143 (47.8%) |
| Accommodation & Food Services | 1,039 (47.6%) | 1,145 (52.4%) |
| Public Administration | 244 (67.6%) | 117 (32.4%) |
| Total | 12,047 (53.6%) | 10,428 (46.4%) |
Education in Middletown
School Enrollment in Middletown
The most common levels of schooling among the 10,741 students in Middletown are elementary school (2,824 | 26.3%), middle school (2,465 | 23.0%), and high school (2,166 | 20.2%).

| School Level | # Students | % Students |
| Nursery / Preschool | 455 | 4.2% |
| Kindergarten | 559 | 5.2% |
| Elementary School | 2,824 | 26.3% |
| Middle School | 2,465 | 23.0% |
| High School | 2,166 | 20.2% |
| College / Undergraduate | 1,746 | 16.3% |
| Graduate / Professional | 526 | 4.9% |
| Total | 10,741 | 100.0% |
School Enrollment by Age by Funding Source in Middletown
Out of a total of 10,741 students who are enrolled in schools in Middletown, 2,062 (19.2%) attend a private institution, while the remaining 8,679 (80.8%) are enrolled in public schools. The age group of 3 to 4 year olds has the highest likelihood of being enrolled in private schools, with 165 (45.3% in the age bracket) enrolled. Conversely, the age group of 15 to 17 year olds has the lowest likelihood of being enrolled in a private school, with 1,476 (89.2% in the age bracket) attending a public institution.
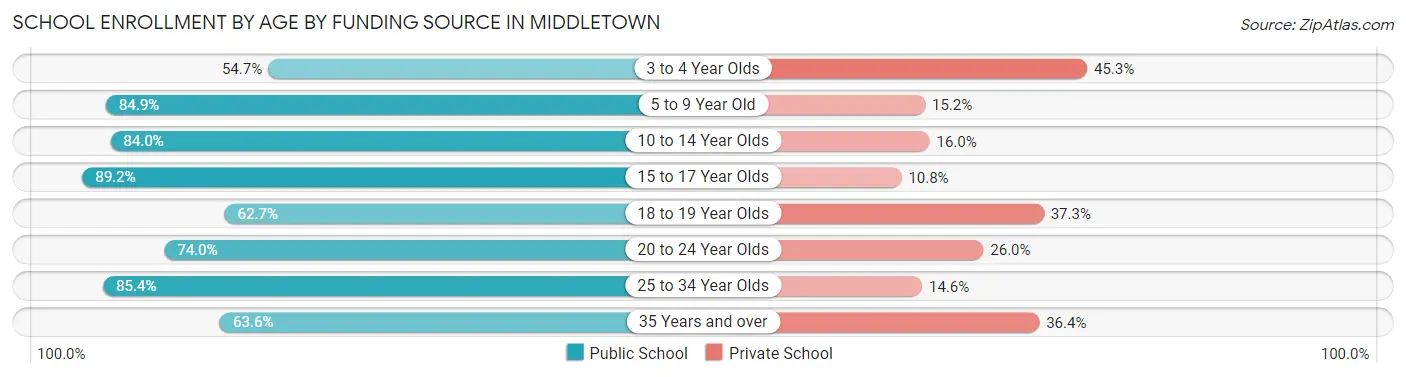
| Age Bracket | Public School | Private School |
| 3 to 4 Year Olds | 199 (54.7%) | 165 (45.3%) |
| 5 to 9 Year Old | 2,386 (84.9%) | 426 (15.1%) |
| 10 to 14 Year Olds | 2,753 (84.0%) | 524 (16.0%) |
| 15 to 17 Year Olds | 1,476 (89.2%) | 178 (10.8%) |
| 18 to 19 Year Olds | 330 (62.7%) | 196 (37.3%) |
| 20 to 24 Year Olds | 816 (74.0%) | 287 (26.0%) |
| 25 to 34 Year Olds | 298 (85.4%) | 51 (14.6%) |
| 35 Years and over | 417 (63.6%) | 239 (36.4%) |
| Total | 8,679 (80.8%) | 2,062 (19.2%) |
Educational Attainment by Field of Study in Middletown
Business (1,337 | 22.5%), education (1,267 | 21.3%), science & technology (568 | 9.5%), social sciences (325 | 5.5%), and engineering (310 | 5.2%) are the most common fields of study among 5,955 individuals in Middletown who have obtained a bachelor's degree or higher.
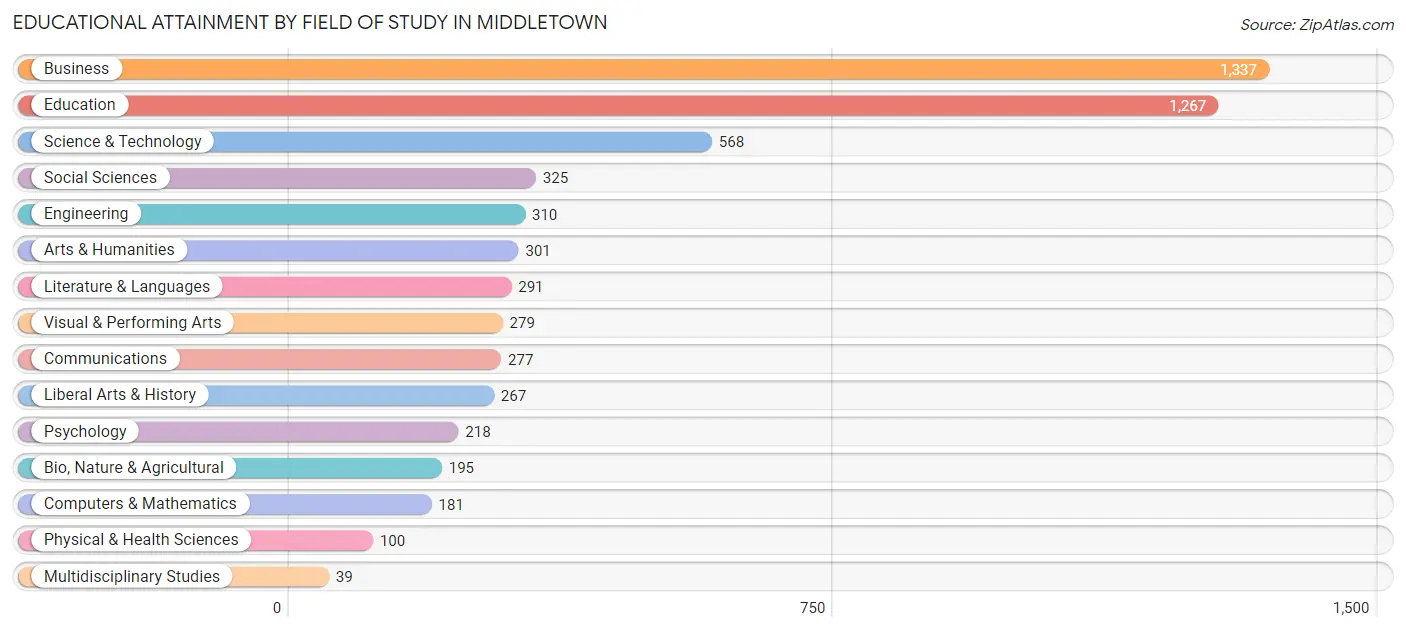
| Field of Study | # Graduates | % Graduates |
| Computers & Mathematics | 181 | 3.0% |
| Bio, Nature & Agricultural | 195 | 3.3% |
| Physical & Health Sciences | 100 | 1.7% |
| Psychology | 218 | 3.7% |
| Social Sciences | 325 | 5.5% |
| Engineering | 310 | 5.2% |
| Multidisciplinary Studies | 39 | 0.6% |
| Science & Technology | 568 | 9.5% |
| Business | 1,337 | 22.5% |
| Education | 1,267 | 21.3% |
| Literature & Languages | 291 | 4.9% |
| Liberal Arts & History | 267 | 4.5% |
| Visual & Performing Arts | 279 | 4.7% |
| Communications | 277 | 4.6% |
| Arts & Humanities | 301 | 5.1% |
| Total | 5,955 | 100.0% |
Transportation & Commute in Middletown
Vehicle Availability by Sex in Middletown
The most prevalent vehicle ownership categories in Middletown are males with 2 vehicles (4,677, accounting for 39.5%) and females with 2 vehicles (3,641, making up 47.1%).
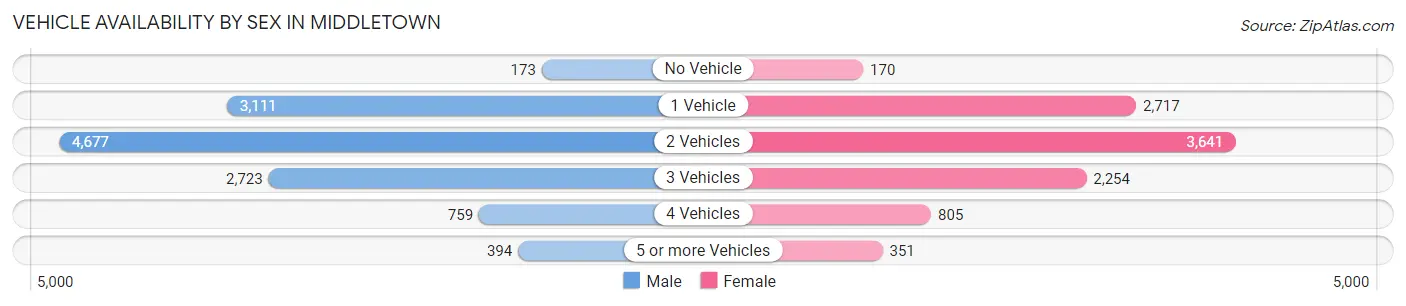
| Vehicles Available | Male | Female |
| No Vehicle | 173 (1.5%) | 170 (1.7%) |
| 1 Vehicle | 3,111 (26.3%) | 2,717 (27.3%) |
| 2 Vehicles | 4,677 (39.5%) | 3,641 (36.6%) |
| 3 Vehicles | 2,723 (23.0%) | 2,254 (22.7%) |
| 4 Vehicles | 759 (6.4%) | 805 (8.1%) |
| 5 or more Vehicles | 394 (3.3%) | 351 (3.5%) |
| Total | 11,837 (100.0%) | 9,938 (100.0%) |
Commute Time in Middletown
The most frequently occuring commute durations in Middletown are 20 to 24 minutes (3,372 commuters, 16.5%), 10 to 14 minutes (3,062 commuters, 14.9%), and 15 to 19 minutes (2,989 commuters, 14.6%).

| Commute Time | # Commuters | % Commuters |
| Less than 5 Minutes | 779 | 3.8% |
| 5 to 9 Minutes | 2,041 | 10.0% |
| 10 to 14 Minutes | 3,062 | 14.9% |
| 15 to 19 Minutes | 2,989 | 14.6% |
| 20 to 24 Minutes | 3,372 | 16.5% |
| 25 to 29 Minutes | 1,763 | 8.6% |
| 30 to 34 Minutes | 2,866 | 14.0% |
| 35 to 39 Minutes | 805 | 3.9% |
| 40 to 44 Minutes | 745 | 3.6% |
| 45 to 59 Minutes | 1,157 | 5.7% |
| 60 to 89 Minutes | 537 | 2.6% |
| 90 or more Minutes | 373 | 1.8% |
Commute Time by Sex in Middletown
The most common commute times in Middletown are 20 to 24 minutes (1,830 commuters, 16.3%) for males and 20 to 24 minutes (1,542 commuters, 16.6%) for females.
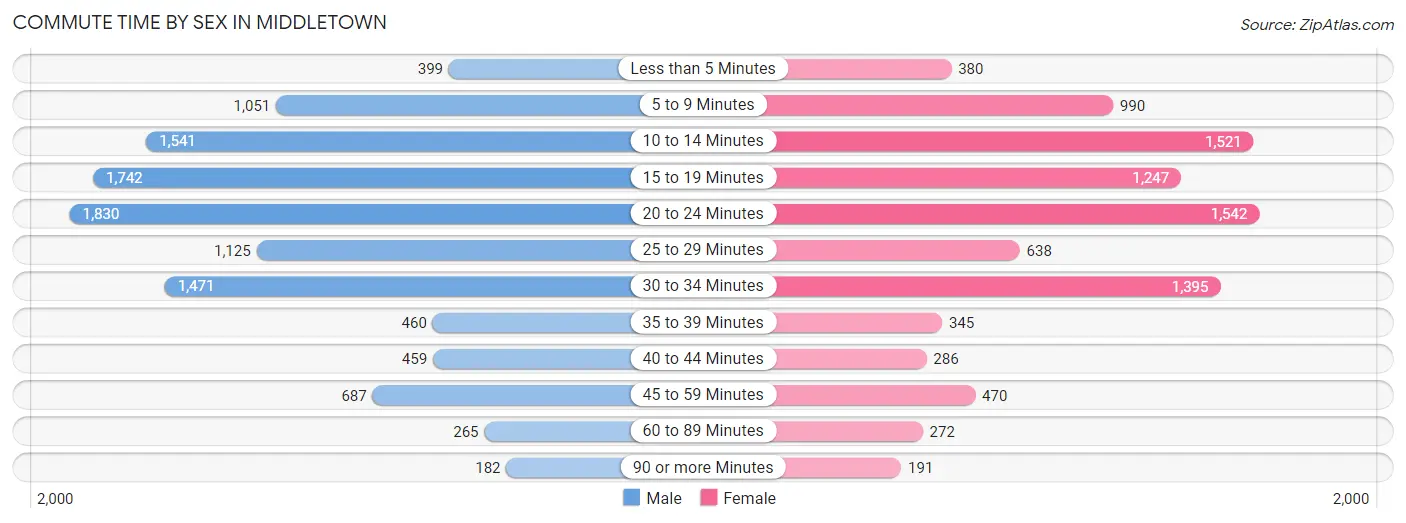
| Commute Time | Male | Female |
| Less than 5 Minutes | 399 (3.6%) | 380 (4.1%) |
| 5 to 9 Minutes | 1,051 (9.4%) | 990 (10.7%) |
| 10 to 14 Minutes | 1,541 (13.7%) | 1,521 (16.4%) |
| 15 to 19 Minutes | 1,742 (15.5%) | 1,247 (13.4%) |
| 20 to 24 Minutes | 1,830 (16.3%) | 1,542 (16.6%) |
| 25 to 29 Minutes | 1,125 (10.0%) | 638 (6.9%) |
| 30 to 34 Minutes | 1,471 (13.1%) | 1,395 (15.0%) |
| 35 to 39 Minutes | 460 (4.1%) | 345 (3.7%) |
| 40 to 44 Minutes | 459 (4.1%) | 286 (3.1%) |
| 45 to 59 Minutes | 687 (6.1%) | 470 (5.1%) |
| 60 to 89 Minutes | 265 (2.4%) | 272 (2.9%) |
| 90 or more Minutes | 182 (1.6%) | 191 (2.1%) |
Time of Departure to Work by Sex in Middletown
The most frequent times of departure to work in Middletown are 6:30 AM to 6:59 AM (1,479, 13.2%) for males and 6:00 AM to 6:29 AM (1,004, 10.8%) for females.
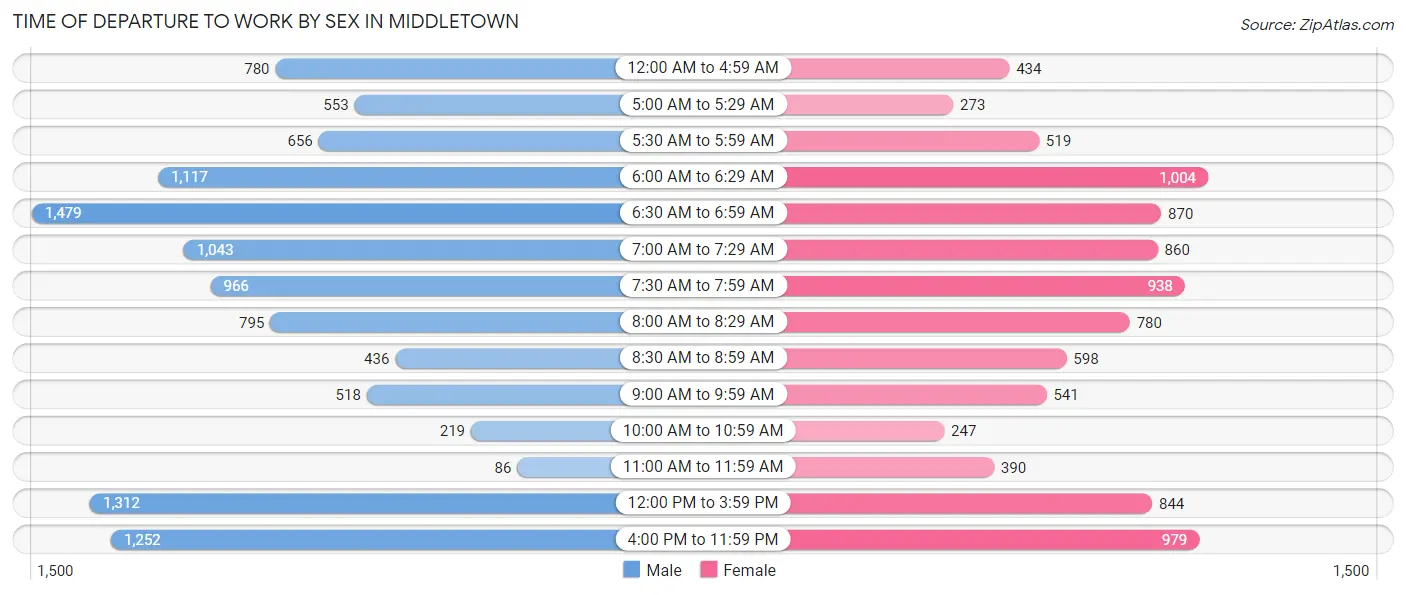
| Time of Departure | Male | Female |
| 12:00 AM to 4:59 AM | 780 (7.0%) | 434 (4.7%) |
| 5:00 AM to 5:29 AM | 553 (4.9%) | 273 (2.9%) |
| 5:30 AM to 5:59 AM | 656 (5.9%) | 519 (5.6%) |
| 6:00 AM to 6:29 AM | 1,117 (10.0%) | 1,004 (10.8%) |
| 6:30 AM to 6:59 AM | 1,479 (13.2%) | 870 (9.4%) |
| 7:00 AM to 7:29 AM | 1,043 (9.3%) | 860 (9.3%) |
| 7:30 AM to 7:59 AM | 966 (8.6%) | 938 (10.1%) |
| 8:00 AM to 8:29 AM | 795 (7.1%) | 780 (8.4%) |
| 8:30 AM to 8:59 AM | 436 (3.9%) | 598 (6.5%) |
| 9:00 AM to 9:59 AM | 518 (4.6%) | 541 (5.8%) |
| 10:00 AM to 10:59 AM | 219 (1.9%) | 247 (2.7%) |
| 11:00 AM to 11:59 AM | 86 (0.8%) | 390 (4.2%) |
| 12:00 PM to 3:59 PM | 1,312 (11.7%) | 844 (9.1%) |
| 4:00 PM to 11:59 PM | 1,252 (11.2%) | 979 (10.5%) |
| Total | 11,212 (100.0%) | 9,277 (100.0%) |
Housing Occupancy in Middletown
Occupancy by Ownership in Middletown
Of the total 20,941 dwellings in Middletown, owner-occupied units account for 11,262 (53.8%), while renter-occupied units make up 9,679 (46.2%).
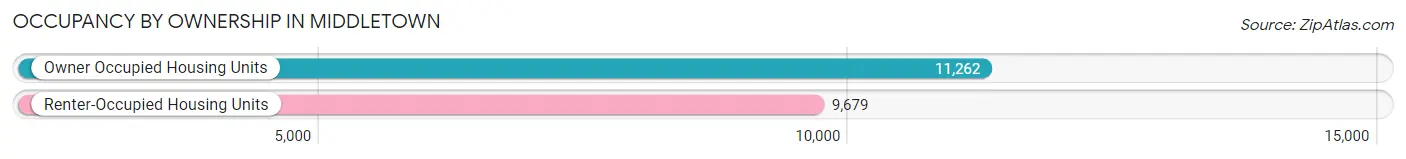
| Occupancy | # Housing Units | % Housing Units |
| Owner Occupied Housing Units | 11,262 | 53.8% |
| Renter-Occupied Housing Units | 9,679 | 46.2% |
| Total Occupied Housing Units | 20,941 | 100.0% |
Occupancy by Household Size in Middletown
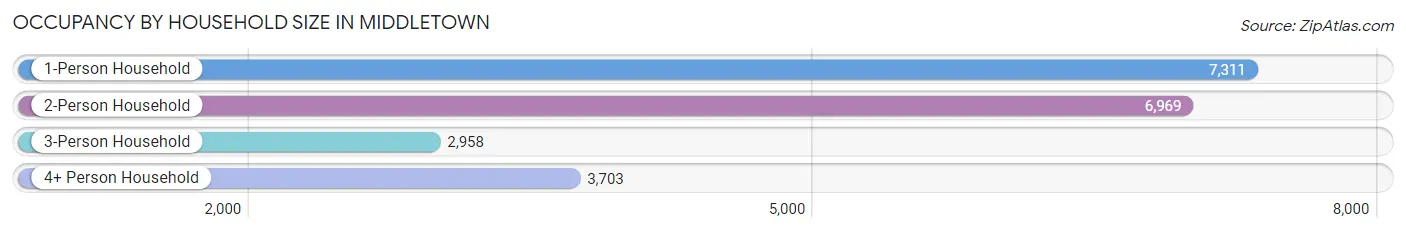
| Household Size | # Housing Units | % Housing Units |
| 1-Person Household | 7,311 | 34.9% |
| 2-Person Household | 6,969 | 33.3% |
| 3-Person Household | 2,958 | 14.1% |
| 4+ Person Household | 3,703 | 17.7% |
| Total Housing Units | 20,941 | 100.0% |
Occupancy by Ownership by Household Size in Middletown
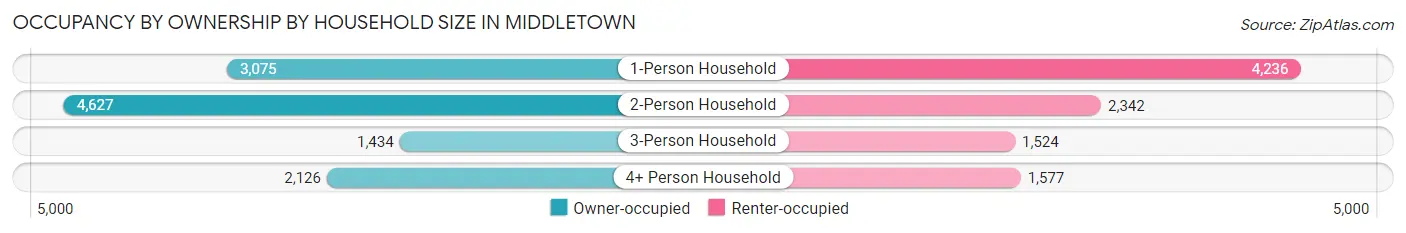
| Household Size | Owner-occupied | Renter-occupied |
| 1-Person Household | 3,075 (42.1%) | 4,236 (57.9%) |
| 2-Person Household | 4,627 (66.4%) | 2,342 (33.6%) |
| 3-Person Household | 1,434 (48.5%) | 1,524 (51.5%) |
| 4+ Person Household | 2,126 (57.4%) | 1,577 (42.6%) |
| Total Housing Units | 11,262 (53.8%) | 9,679 (46.2%) |
Occupancy by Educational Attainment in Middletown
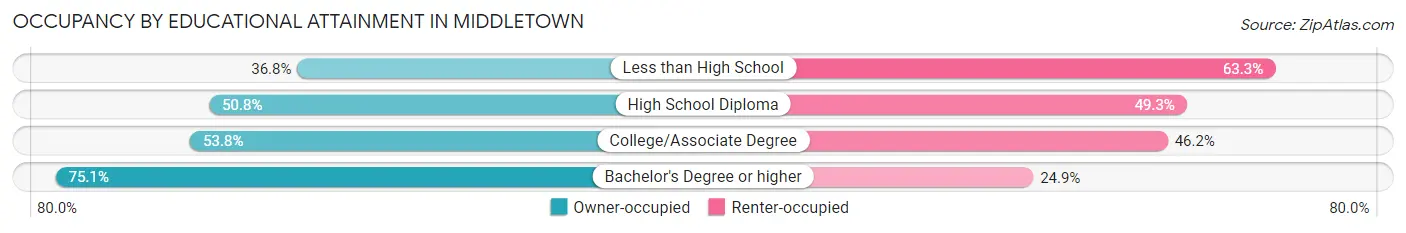
| Household Size | Owner-occupied | Renter-occupied |
| Less than High School | 1,120 (36.7%) | 1,928 (63.2%) |
| High School Diploma | 3,849 (50.7%) | 3,735 (49.2%) |
| College/Associate Degree | 3,650 (53.8%) | 3,139 (46.2%) |
| Bachelor's Degree or higher | 2,643 (75.1%) | 877 (24.9%) |
Occupancy by Age of Householder in Middletown

| Age Bracket | # Households | % Households |
| Under 35 Years | 4,552 | 21.7% |
| 35 to 44 Years | 2,797 | 13.4% |
| 45 to 54 Years | 3,195 | 15.3% |
| 55 to 64 Years | 4,426 | 21.1% |
| 65 to 74 Years | 3,792 | 18.1% |
| 75 to 84 Years | 1,435 | 6.9% |
| 85 Years and Over | 744 | 3.5% |
| Total | 20,941 | 100.0% |
Housing Finances in Middletown
Median Income by Occupancy in Middletown
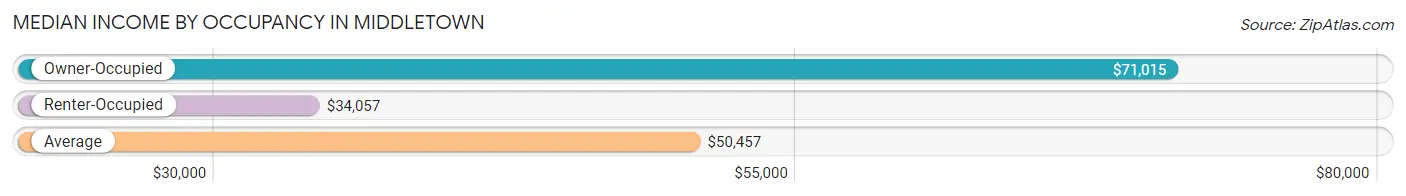
| Occupancy Type | # Households | Median Income |
| Owner-Occupied | 11,262 (53.8%) | $71,015 |
| Renter-Occupied | 9,679 (46.2%) | $34,057 |
| Average | 20,941 (100.0%) | $50,457 |
Occupancy by Householder Income Bracket in Middletown
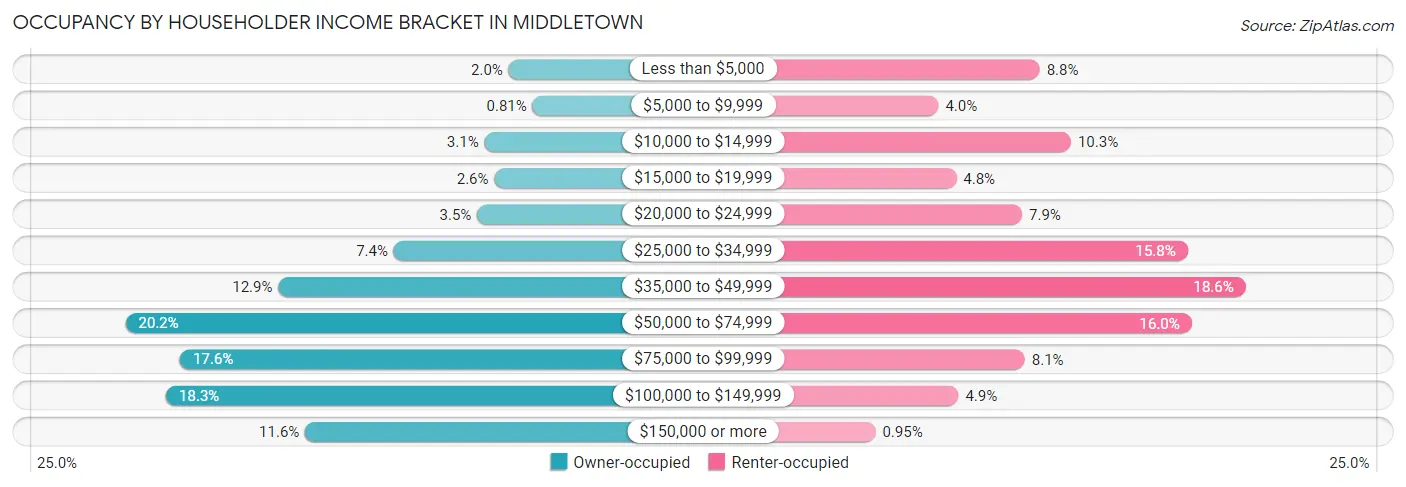
| Income Bracket | Owner-occupied | Renter-occupied |
| Less than $5,000 | 220 (1.9%) | 849 (8.8%) |
| $5,000 to $9,999 | 91 (0.8%) | 382 (4.0%) |
| $10,000 to $14,999 | 349 (3.1%) | 993 (10.3%) |
| $15,000 to $19,999 | 296 (2.6%) | 465 (4.8%) |
| $20,000 to $24,999 | 389 (3.5%) | 768 (7.9%) |
| $25,000 to $34,999 | 836 (7.4%) | 1,530 (15.8%) |
| $35,000 to $49,999 | 1,455 (12.9%) | 1,797 (18.6%) |
| $50,000 to $74,999 | 2,275 (20.2%) | 1,549 (16.0%) |
| $75,000 to $99,999 | 1,982 (17.6%) | 780 (8.1%) |
| $100,000 to $149,999 | 2,058 (18.3%) | 474 (4.9%) |
| $150,000 or more | 1,311 (11.6%) | 92 (0.9%) |
| Total | 11,262 (100.0%) | 9,679 (100.0%) |
Monthly Housing Cost Tiers in Middletown
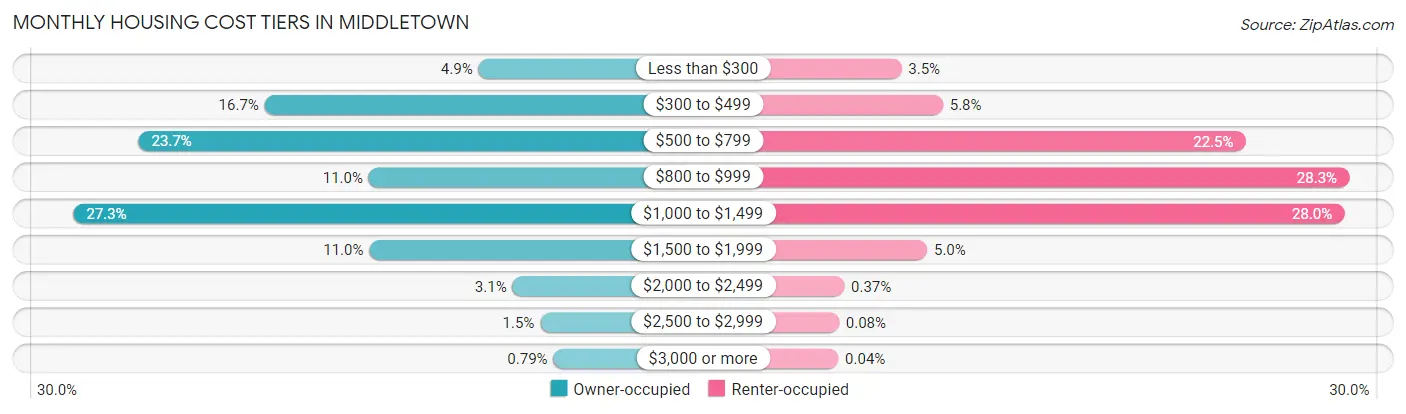
| Monthly Cost | Owner-occupied | Renter-occupied |
| Less than $300 | 555 (4.9%) | 342 (3.5%) |
| $300 to $499 | 1,885 (16.7%) | 563 (5.8%) |
| $500 to $799 | 2,670 (23.7%) | 2,181 (22.5%) |
| $800 to $999 | 1,238 (11.0%) | 2,734 (28.2%) |
| $1,000 to $1,499 | 3,076 (27.3%) | 2,708 (28.0%) |
| $1,500 to $1,999 | 1,234 (11.0%) | 479 (5.0%) |
| $2,000 to $2,499 | 344 (3.0%) | 36 (0.4%) |
| $2,500 to $2,999 | 171 (1.5%) | 8 (0.1%) |
| $3,000 or more | 89 (0.8%) | 4 (0.0%) |
| Total | 11,262 (100.0%) | 9,679 (100.0%) |
Physical Housing Characteristics in Middletown
Housing Structures in Middletown
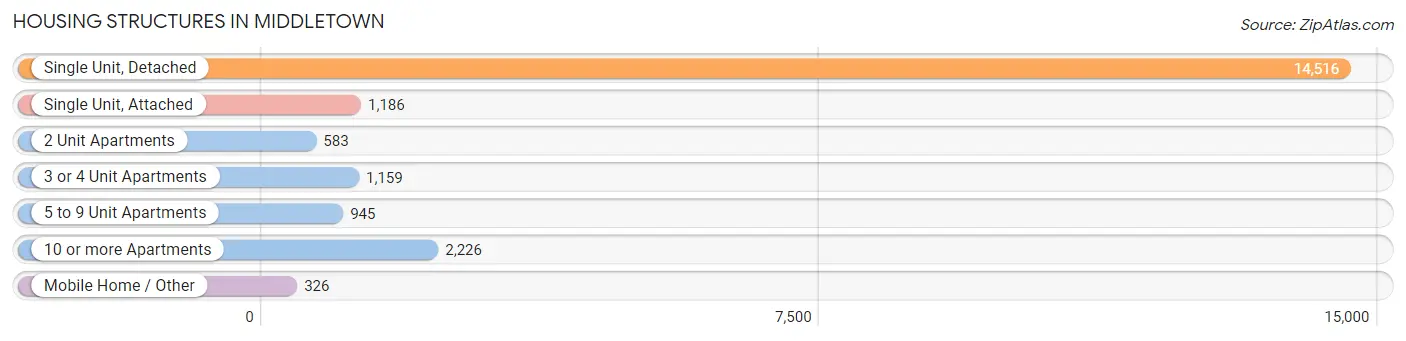
| Structure Type | # Housing Units | % Housing Units |
| Single Unit, Detached | 14,516 | 69.3% |
| Single Unit, Attached | 1,186 | 5.7% |
| 2 Unit Apartments | 583 | 2.8% |
| 3 or 4 Unit Apartments | 1,159 | 5.5% |
| 5 to 9 Unit Apartments | 945 | 4.5% |
| 10 or more Apartments | 2,226 | 10.6% |
| Mobile Home / Other | 326 | 1.6% |
| Total | 20,941 | 100.0% |
Housing Structures by Occupancy in Middletown
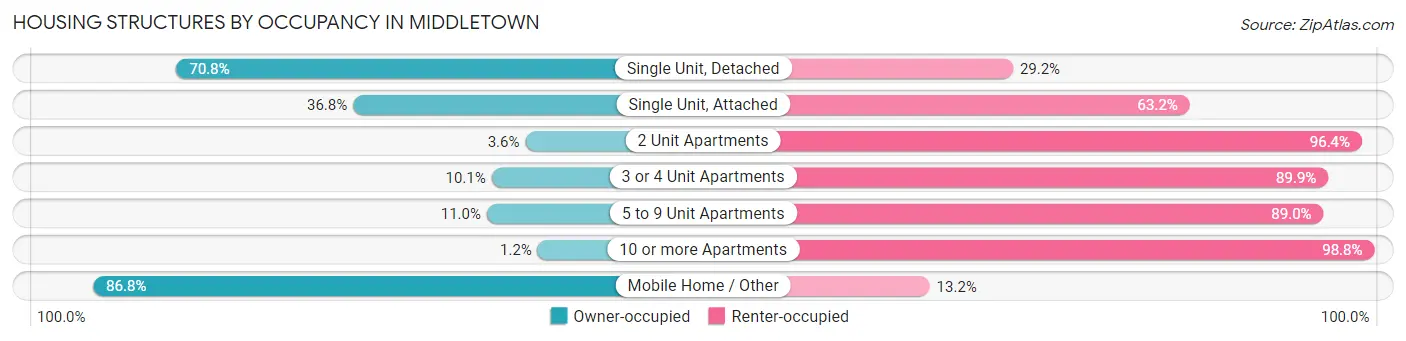
| Structure Type | Owner-occupied | Renter-occupied |
| Single Unit, Detached | 10,274 (70.8%) | 4,242 (29.2%) |
| Single Unit, Attached | 436 (36.8%) | 750 (63.2%) |
| 2 Unit Apartments | 21 (3.6%) | 562 (96.4%) |
| 3 or 4 Unit Apartments | 117 (10.1%) | 1,042 (89.9%) |
| 5 to 9 Unit Apartments | 104 (11.0%) | 841 (89.0%) |
| 10 or more Apartments | 27 (1.2%) | 2,199 (98.8%) |
| Mobile Home / Other | 283 (86.8%) | 43 (13.2%) |
| Total | 11,262 (53.8%) | 9,679 (46.2%) |
Housing Structures by Number of Rooms in Middletown
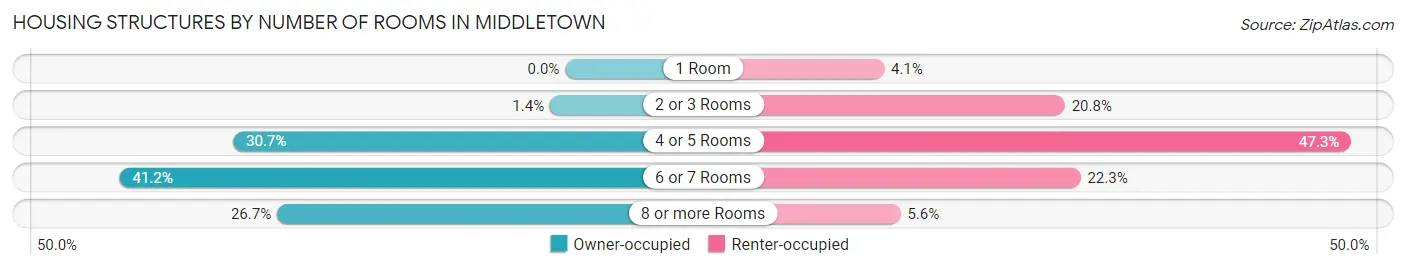
| Number of Rooms | Owner-occupied | Renter-occupied |
| 1 Room | 0 (0.0%) | 395 (4.1%) |
| 2 or 3 Rooms | 159 (1.4%) | 2,012 (20.8%) |
| 4 or 5 Rooms | 3,459 (30.7%) | 4,576 (47.3%) |
| 6 or 7 Rooms | 4,641 (41.2%) | 2,154 (22.3%) |
| 8 or more Rooms | 3,003 (26.7%) | 542 (5.6%) |
| Total | 11,262 (100.0%) | 9,679 (100.0%) |
Housing Structure by Heating Type in Middletown
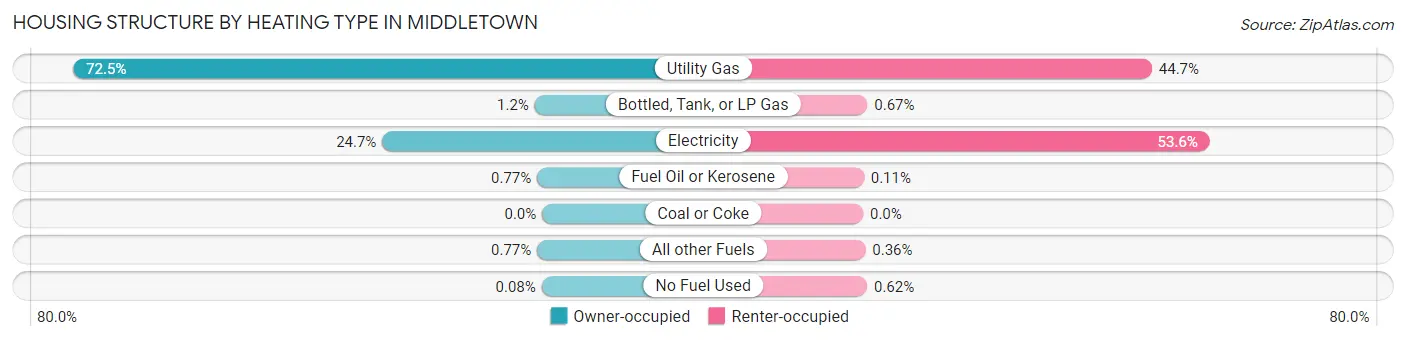
| Heating Type | Owner-occupied | Renter-occupied |
| Utility Gas | 8,166 (72.5%) | 4,322 (44.7%) |
| Bottled, Tank, or LP Gas | 129 (1.1%) | 65 (0.7%) |
| Electricity | 2,784 (24.7%) | 5,186 (53.6%) |
| Fuel Oil or Kerosene | 87 (0.8%) | 11 (0.1%) |
| Coal or Coke | 0 (0.0%) | 0 (0.0%) |
| All other Fuels | 87 (0.8%) | 35 (0.4%) |
| No Fuel Used | 9 (0.1%) | 60 (0.6%) |
| Total | 11,262 (100.0%) | 9,679 (100.0%) |
Household Vehicle Usage in Middletown
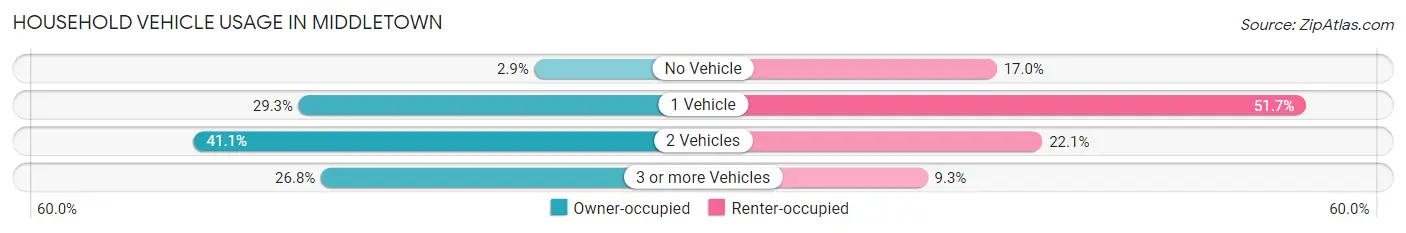
| Vehicles per Household | Owner-occupied | Renter-occupied |
| No Vehicle | 324 (2.9%) | 1,645 (17.0%) |
| 1 Vehicle | 3,298 (29.3%) | 4,999 (51.6%) |
| 2 Vehicles | 4,624 (41.1%) | 2,139 (22.1%) |
| 3 or more Vehicles | 3,016 (26.8%) | 896 (9.3%) |
| Total | 11,262 (100.0%) | 9,679 (100.0%) |
Real Estate & Mortgages in Middletown
Real Estate and Mortgage Overview in Middletown
| Characteristic | Without Mortgage | With Mortgage |
| Housing Units | 4,593 | 6,669 |
| Median Property Value | $114,000 | $144,900 |
| Median Household Income | $55,484 | $855 |
| Monthly Housing Costs | $495 | $89 |
| Real Estate Taxes | $1,744 | $126 |
Property Value by Mortgage Status in Middletown
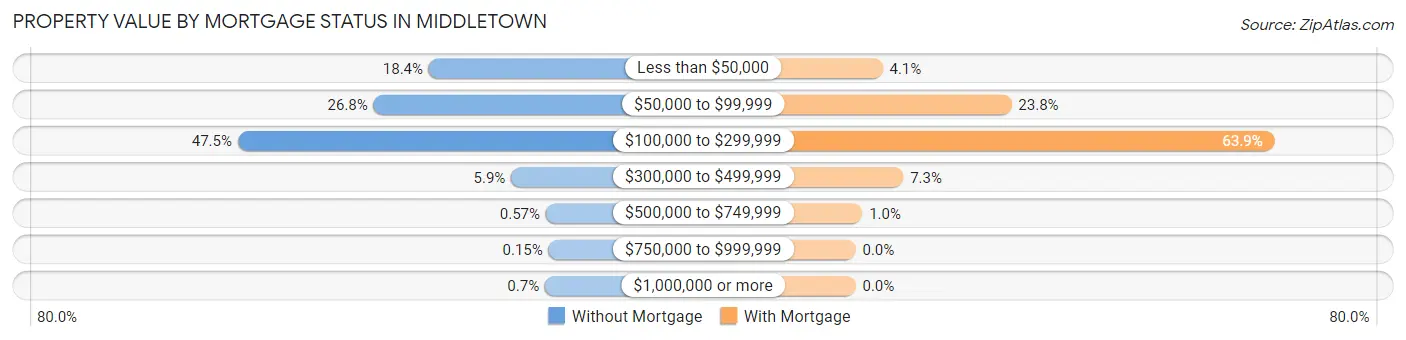
| Property Value | Without Mortgage | With Mortgage |
| Less than $50,000 | 845 (18.4%) | 274 (4.1%) |
| $50,000 to $99,999 | 1,232 (26.8%) | 1,584 (23.7%) |
| $100,000 to $299,999 | 2,182 (47.5%) | 4,258 (63.8%) |
| $300,000 to $499,999 | 269 (5.9%) | 485 (7.3%) |
| $500,000 to $749,999 | 26 (0.6%) | 68 (1.0%) |
| $750,000 to $999,999 | 7 (0.2%) | 0 (0.0%) |
| $1,000,000 or more | 32 (0.7%) | 0 (0.0%) |
| Total | 4,593 (100.0%) | 6,669 (100.0%) |
Household Income by Mortgage Status in Middletown
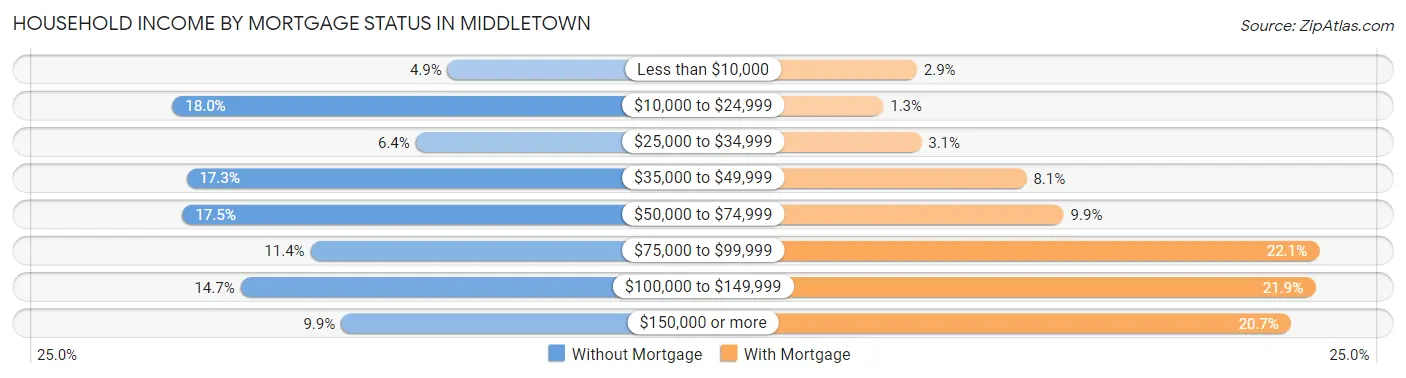
| Household Income | Without Mortgage | With Mortgage |
| Less than $10,000 | 223 (4.9%) | 195 (2.9%) |
| $10,000 to $24,999 | 825 (18.0%) | 88 (1.3%) |
| $25,000 to $34,999 | 293 (6.4%) | 209 (3.1%) |
| $35,000 to $49,999 | 794 (17.3%) | 543 (8.1%) |
| $50,000 to $74,999 | 803 (17.5%) | 661 (9.9%) |
| $75,000 to $99,999 | 523 (11.4%) | 1,472 (22.1%) |
| $100,000 to $149,999 | 676 (14.7%) | 1,459 (21.9%) |
| $150,000 or more | 456 (9.9%) | 1,382 (20.7%) |
| Total | 4,593 (100.0%) | 6,669 (100.0%) |
Property Value to Household Income Ratio in Middletown
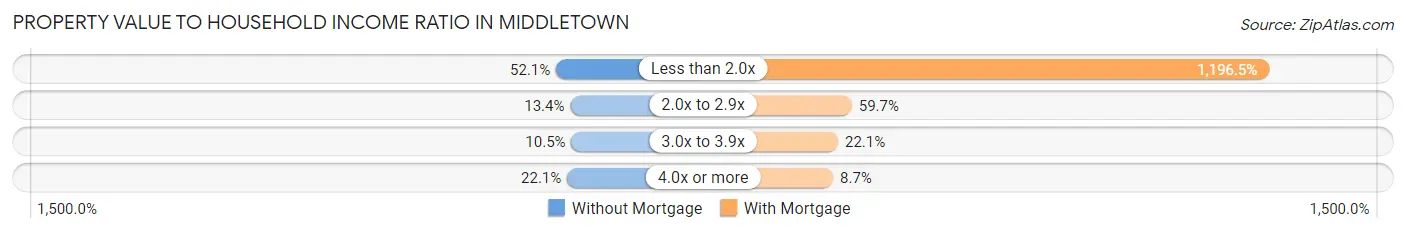
| Value-to-Income Ratio | Without Mortgage | With Mortgage |
| Less than 2.0x | 2,395 (52.1%) | 79,796 (1,196.5%) |
| 2.0x to 2.9x | 617 (13.4%) | 3,979 (59.7%) |
| 3.0x to 3.9x | 481 (10.5%) | 1,476 (22.1%) |
| 4.0x or more | 1,017 (22.1%) | 578 (8.7%) |
| Total | 4,593 (100.0%) | 6,669 (100.0%) |
Real Estate Taxes by Mortgage Status in Middletown

| Property Taxes | Without Mortgage | With Mortgage |
| Less than $800 | 694 (15.1%) | 47 (0.7%) |
| $800 to $1,499 | 1,166 (25.4%) | 683 (10.2%) |
| $800 to $1,499 | 2,547 (55.4%) | 1,510 (22.6%) |
| Total | 4,593 (100.0%) | 6,669 (100.0%) |
Health & Disability in Middletown
Health Insurance Coverage by Age in Middletown
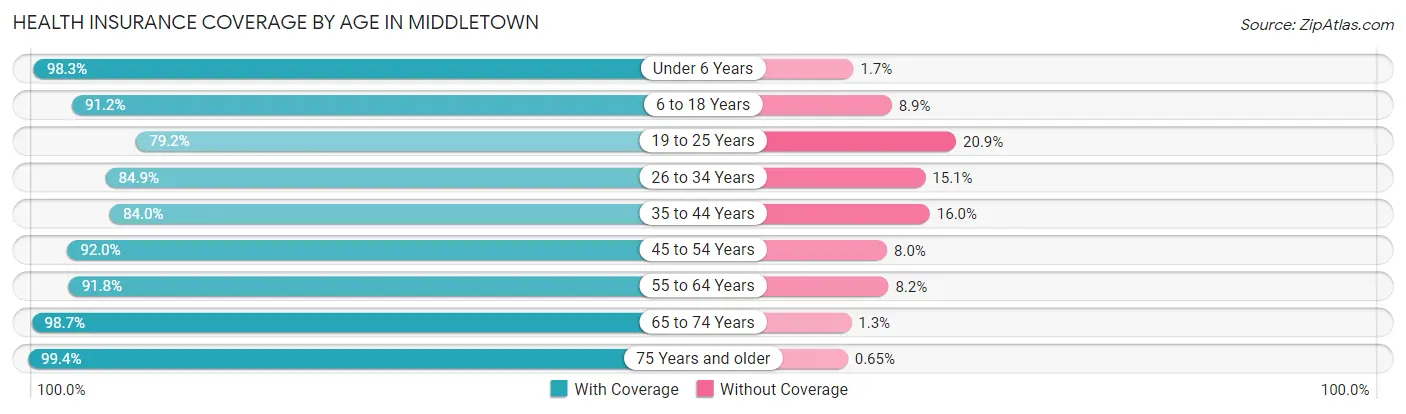
| Age Bracket | With Coverage | Without Coverage |
| Under 6 Years | 3,087 (98.3%) | 54 (1.7%) |
| 6 to 18 Years | 7,250 (91.1%) | 704 (8.8%) |
| 19 to 25 Years | 4,566 (79.1%) | 1,203 (20.8%) |
| 26 to 34 Years | 5,025 (84.9%) | 895 (15.1%) |
| 35 to 44 Years | 4,764 (84.0%) | 905 (16.0%) |
| 45 to 54 Years | 5,548 (92.0%) | 481 (8.0%) |
| 55 to 64 Years | 6,300 (91.8%) | 566 (8.2%) |
| 65 to 74 Years | 5,306 (98.7%) | 71 (1.3%) |
| 75 Years and older | 3,194 (99.4%) | 21 (0.6%) |
| Total | 45,040 (90.2%) | 4,900 (9.8%) |
Health Insurance Coverage by Citizenship Status in Middletown
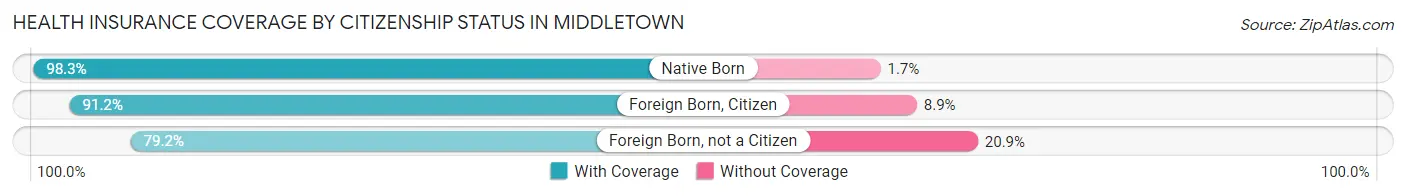
| Citizenship Status | With Coverage | Without Coverage |
| Native Born | 3,087 (98.3%) | 54 (1.7%) |
| Foreign Born, Citizen | 7,250 (91.1%) | 704 (8.8%) |
| Foreign Born, not a Citizen | 4,566 (79.1%) | 1,203 (20.8%) |
Health Insurance Coverage by Household Income in Middletown
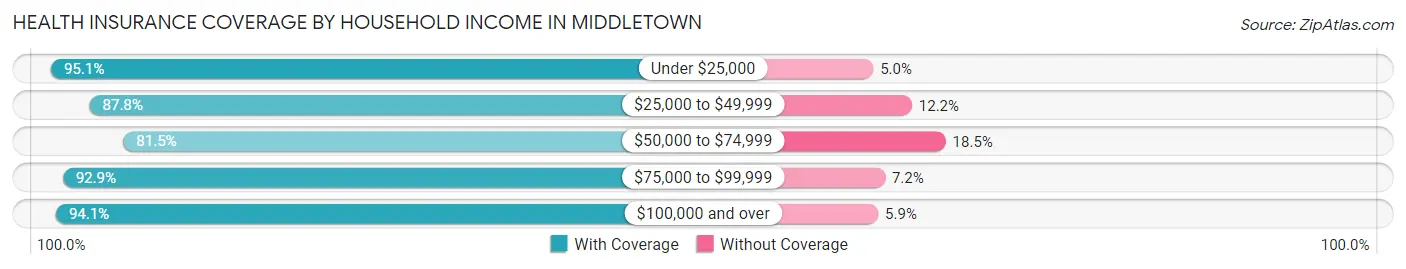
| Household Income | With Coverage | Without Coverage |
| Under $25,000 | 8,192 (95.1%) | 427 (5.0%) |
| $25,000 to $49,999 | 9,592 (87.8%) | 1,331 (12.2%) |
| $50,000 to $74,999 | 8,140 (81.5%) | 1,850 (18.5%) |
| $75,000 to $99,999 | 6,995 (92.8%) | 539 (7.1%) |
| $100,000 and over | 11,923 (94.1%) | 745 (5.9%) |
Public vs Private Health Insurance Coverage by Age in Middletown
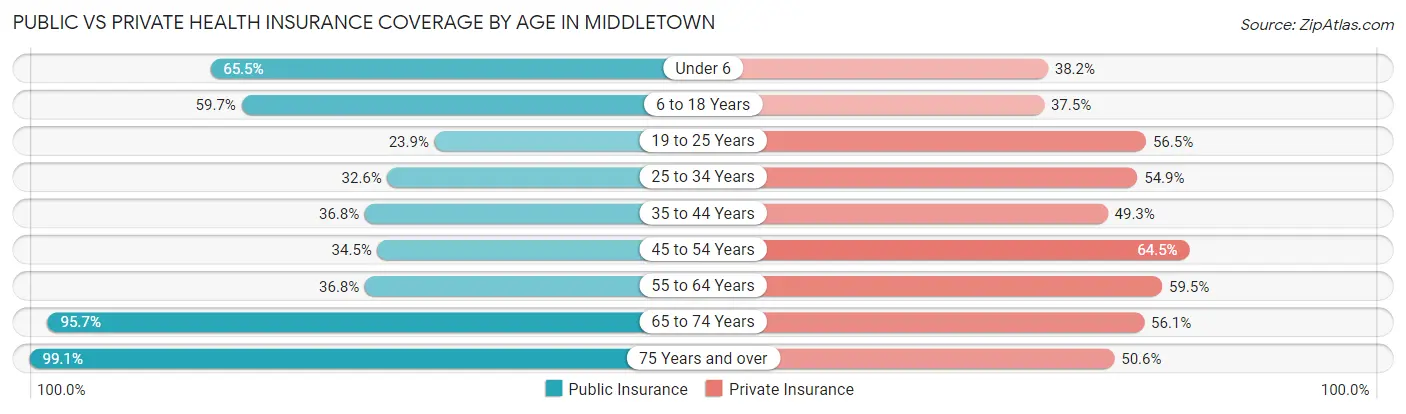
| Age Bracket | Public Insurance | Private Insurance |
| Under 6 | 2,058 (65.5%) | 1,201 (38.2%) |
| 6 to 18 Years | 4,749 (59.7%) | 2,985 (37.5%) |
| 19 to 25 Years | 1,377 (23.9%) | 3,257 (56.5%) |
| 25 to 34 Years | 1,931 (32.6%) | 3,247 (54.8%) |
| 35 to 44 Years | 2,087 (36.8%) | 2,797 (49.3%) |
| 45 to 54 Years | 2,078 (34.5%) | 3,890 (64.5%) |
| 55 to 64 Years | 2,527 (36.8%) | 4,082 (59.5%) |
| 65 to 74 Years | 5,148 (95.7%) | 3,017 (56.1%) |
| 75 Years and over | 3,185 (99.1%) | 1,626 (50.6%) |
| Total | 25,140 (50.3%) | 26,102 (52.3%) |
Disability Status by Sex by Age in Middletown
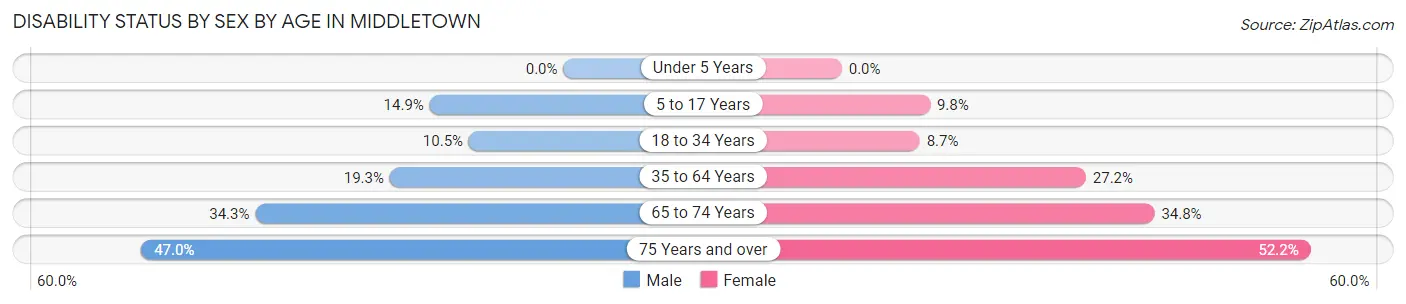
| Age Bracket | Male | Female |
| Under 5 Years | 0 (0.0%) | 0 (0.0%) |
| 5 to 17 Years | 582 (14.9%) | 402 (9.8%) |
| 18 to 34 Years | 669 (10.5%) | 501 (8.7%) |
| 35 to 64 Years | 1,751 (19.3%) | 2,584 (27.2%) |
| 65 to 74 Years | 749 (34.3%) | 1,112 (34.8%) |
| 75 Years and over | 645 (47.0%) | 962 (52.2%) |
Disability Class by Sex by Age in Middletown
Disability Class: Hearing Difficulty
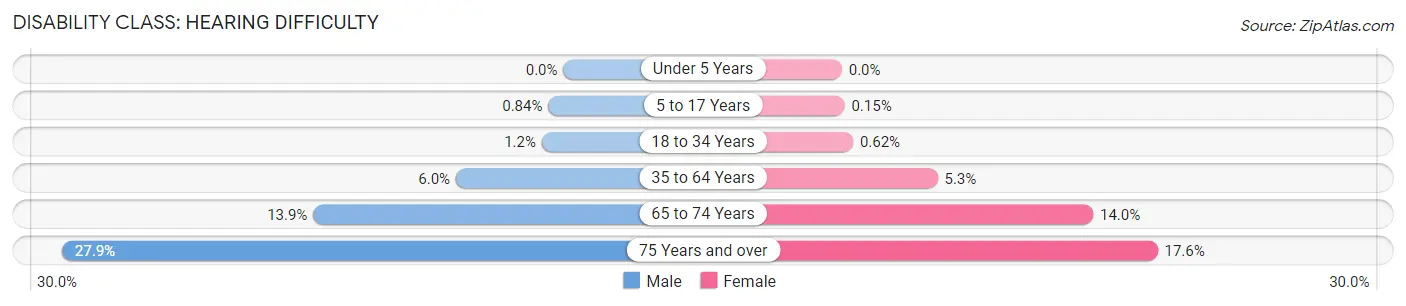
| Age Bracket | Male | Female |
| Under 5 Years | 0 (0.0%) | 0 (0.0%) |
| 5 to 17 Years | 33 (0.8%) | 6 (0.2%) |
| 18 to 34 Years | 76 (1.2%) | 36 (0.6%) |
| 35 to 64 Years | 542 (6.0%) | 507 (5.3%) |
| 65 to 74 Years | 304 (13.9%) | 447 (14.0%) |
| 75 Years and over | 383 (27.9%) | 324 (17.6%) |
Disability Class: Vision Difficulty
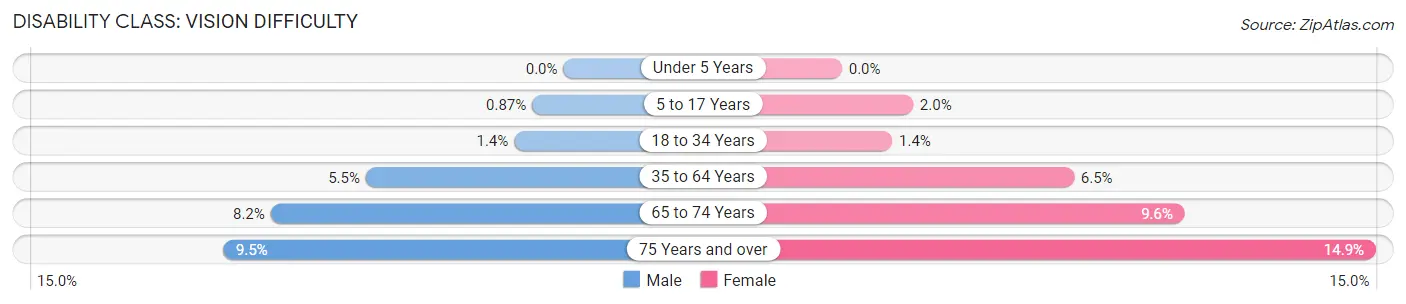
| Age Bracket | Male | Female |
| Under 5 Years | 0 (0.0%) | 0 (0.0%) |
| 5 to 17 Years | 34 (0.9%) | 81 (2.0%) |
| 18 to 34 Years | 87 (1.4%) | 81 (1.4%) |
| 35 to 64 Years | 498 (5.5%) | 614 (6.5%) |
| 65 to 74 Years | 178 (8.2%) | 305 (9.6%) |
| 75 Years and over | 130 (9.5%) | 274 (14.9%) |
Disability Class: Cognitive Difficulty
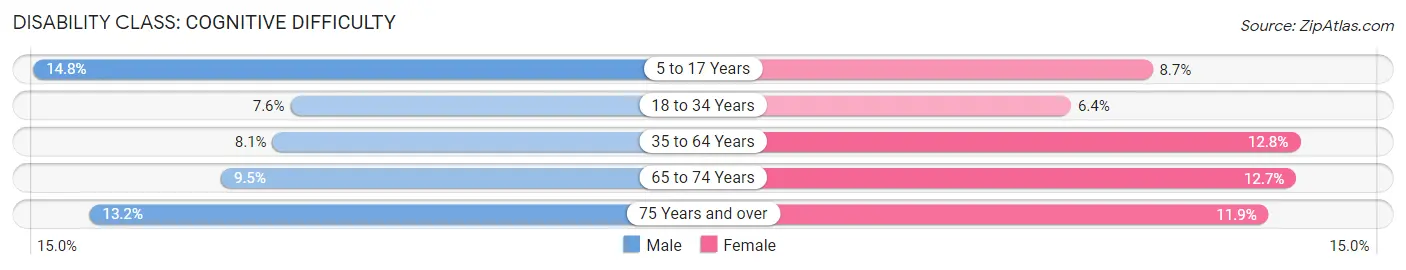
| Age Bracket | Male | Female |
| 5 to 17 Years | 577 (14.8%) | 354 (8.6%) |
| 18 to 34 Years | 483 (7.6%) | 368 (6.4%) |
| 35 to 64 Years | 734 (8.1%) | 1,213 (12.8%) |
| 65 to 74 Years | 208 (9.5%) | 404 (12.7%) |
| 75 Years and over | 181 (13.2%) | 219 (11.9%) |
Disability Class: Ambulatory Difficulty
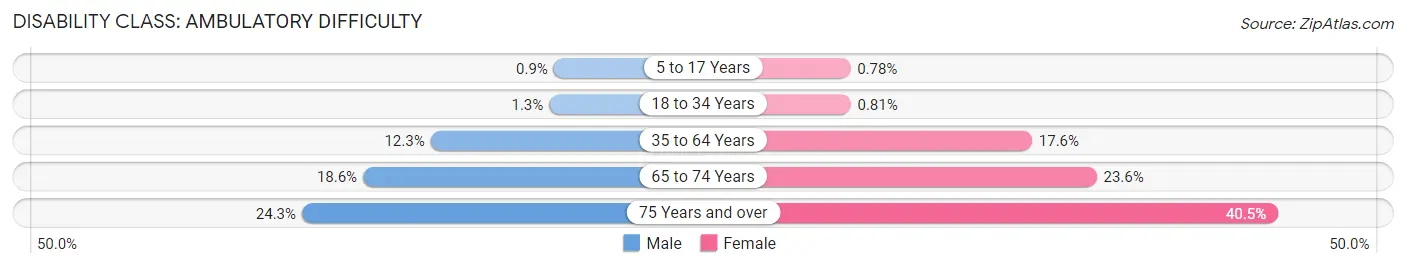
| Age Bracket | Male | Female |
| 5 to 17 Years | 35 (0.9%) | 32 (0.8%) |
| 18 to 34 Years | 84 (1.3%) | 47 (0.8%) |
| 35 to 64 Years | 1,117 (12.3%) | 1,677 (17.6%) |
| 65 to 74 Years | 406 (18.6%) | 755 (23.6%) |
| 75 Years and over | 333 (24.3%) | 746 (40.5%) |
Disability Class: Self-Care Difficulty
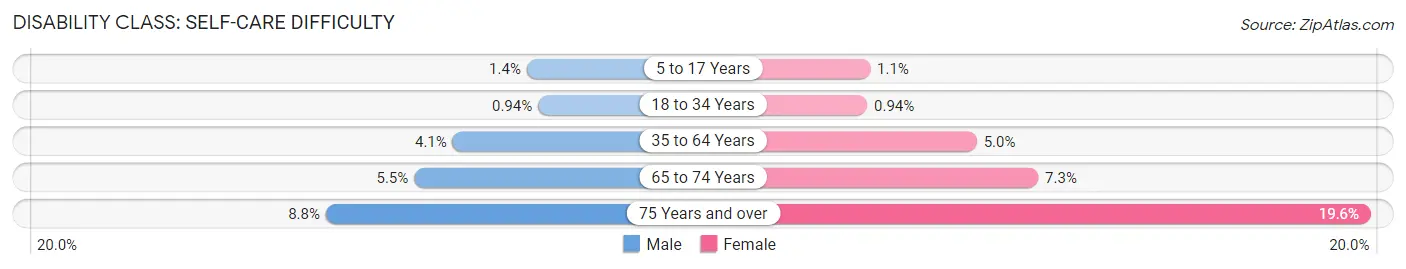
| Age Bracket | Male | Female |
| 5 to 17 Years | 53 (1.4%) | 43 (1.1%) |
| 18 to 34 Years | 60 (0.9%) | 54 (0.9%) |
| 35 to 64 Years | 372 (4.1%) | 476 (5.0%) |
| 65 to 74 Years | 121 (5.5%) | 233 (7.3%) |
| 75 Years and over | 121 (8.8%) | 362 (19.6%) |
Technology Access in Middletown
Computing Device Access in Middletown
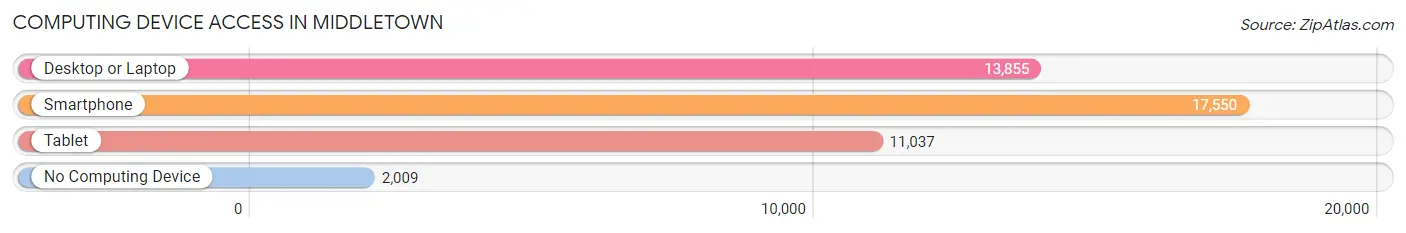
| Device Type | # Households | % Households |
| Desktop or Laptop | 13,855 | 66.2% |
| Smartphone | 17,550 | 83.8% |
| Tablet | 11,037 | 52.7% |
| No Computing Device | 2,009 | 9.6% |
| Total | 20,941 | 100.0% |
Internet Access in Middletown
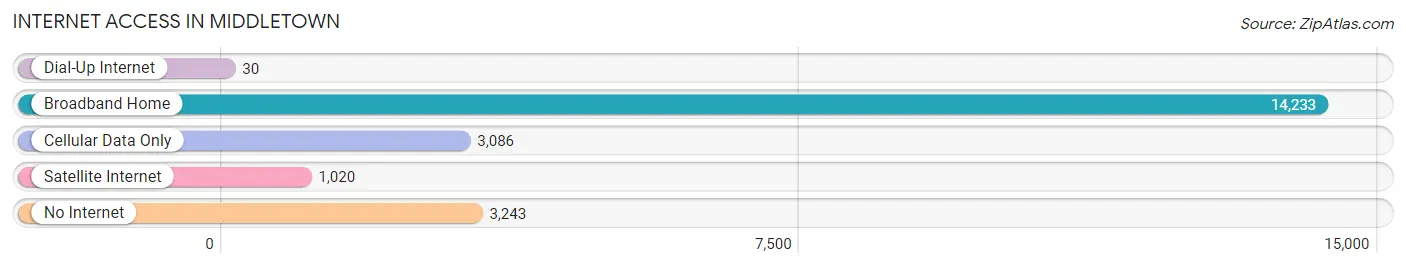
| Internet Type | # Households | % Households |
| Dial-Up Internet | 30 | 0.1% |
| Broadband Home | 14,233 | 68.0% |
| Cellular Data Only | 3,086 | 14.7% |
| Satellite Internet | 1,020 | 4.9% |
| No Internet | 3,243 | 15.5% |
| Total | 20,941 | 100.0% |
Middletown Summary
Middletown, Ohio is a city located in Butler and Warren counties in the southwestern part of the state. It is the county seat of Butler County and is part of the Cincinnati metropolitan area. The city has a population of 48,694 as of the 2010 census, making it the largest city in Butler County.
History
Middletown was founded in 1802 by a group of settlers from New Jersey led by David Stites. The city was named after Middletown, New Jersey, the hometown of one of the settlers. The city was incorporated in 1833 and became the county seat of Butler County in 1803.
Middletown was a major industrial center in the 19th and early 20th centuries. It was home to several steel mills, paper mills, and other manufacturing plants. The city was also a major railroad hub, with several railroads running through it.
The city experienced a period of decline in the mid-20th century as the steel and paper industries moved away. However, the city has since experienced a resurgence, with new businesses and industries moving into the area.
Geography
Middletown is located at 39°30'N 84°23'W (39.50, -84.38). The city is situated in the southwestern part of Ohio, about 30 miles north of Cincinnati. It is located in the Miami Valley region of the state.
The city covers an area of 16.3 square miles, of which 16.2 square miles is land and 0.1 square miles is water. The city is located on the Great Miami River, which flows through the city.
Economy
Middletown has a diverse economy, with a variety of industries represented. The city is home to several manufacturing plants, including AK Steel, Middletown Works, and Middletown Tube Works. The city is also home to several retail stores, restaurants, and other businesses.
The city is also home to several educational institutions, including Miami University Middletown, a branch of Miami University, and Middletown Christian School.
Demographics
As of the 2010 census, Middletown had a population of 48,694. The racial makeup of the city was 79.2% White, 15.3% African American, 0.4% Native American, 1.2% Asian, 0.1% Pacific Islander, 1.3% from other races, and 2.5% from two or more races. Hispanic or Latino of any race were 3.7% of the population.
The median income for a household in the city was $37,837, and the median income for a family was $45,945. The per capita income for the city was $20,845. About 15.2% of families and 19.2% of the population were below the poverty line, including 28.2% of those under age 18 and 8.2% of those age 65 or over.
Common Questions
What is the Total Population of Middletown?
Total Population of Middletown is 50,514.
What is the Total Male Population of Middletown?
Total Male Population of Middletown is 24,440.
What is the Total Female Population of Middletown?
Total Female Population of Middletown is 26,074.
What is the Ratio of Males per 100 Females in Middletown?
There are 93.73 Males per 100 Females in Middletown.
What is the Ratio of Females per 100 Males in Middletown?
There are 106.69 Females per 100 Males in Middletown.
What is the Median Population Age in Middletown?
Median Population Age in Middletown is 38.6 Years.
What is the Average Family Size in Middletown
Average Family Size in Middletown is 3.0 People.
What is the Average Household Size in Middletown
Average Household Size in Middletown is 2.4 People.
What is Per Capita Income in Middletown?
Per Capita income in Middletown is $28,831.
What is the Median Family Income in Middletown?
Median Family Income in Middletown is $65,601.
What is the Median Household income in Middletown?
Median Household Income in Middletown is $50,457.
What is Income or Wage Gap in Middletown?
Income or Wage Gap in Middletown is 37.5%.
Women in Middletown earn 62.5 cents for every dollar earned by a man.
What is Family Income Deficit in Middletown?
Family Income Deficit in Middletown is $13,036.
Families that are below poverty line in Middletown earn $13,036 less on average than the poverty threshold level.
What is Inequality or Gini Index in Middletown?
Inequality or Gini Index in Middletown is 0.45.
How Large is the Labor Force in Middletown?
There are 24,221 People in the Labor Forcein in Middletown.
What is the Percentage of People in the Labor Force in Middletown?
59.0% of People are in the Labor Force in Middletown.
What is the Unemployment Rate in Middletown?
Unemployment Rate in Middletown is 7.2%.