Solon, OH
Solon Map
Solon Overview
24,053
TOTAL POPULATION
11,752
MALE POPULATION
12,301
FEMALE POPULATION
95.54
MALES / 100 FEMALES
104.67
FEMALES / 100 MALES
45.1
MEDIAN AGE
3.2
AVG FAMILY SIZE
2.7
AVG HOUSEHOLD SIZE
$66,670
PER CAPITA INCOME
$158,492
AVG FAMILY INCOME
$128,470
AVG HOUSEHOLD INCOME
36.1%
WAGE / INCOME GAP [ % ]
63.9¢/ $1
WAGE / INCOME GAP [ $ ]
0.47
INEQUALITY / GINI INDEX
12,520
LABOR FORCE [ PEOPLE ]
66.6%
PERCENT IN LABOR FORCE
3.1%
UNEMPLOYMENT RATE
Solon Zip Codes
Solon Area Codes
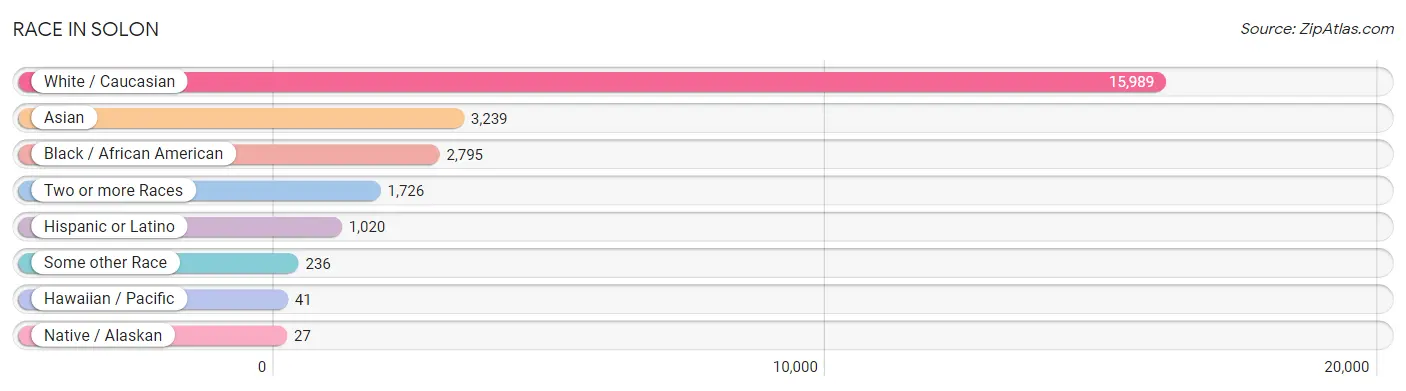
Race in Solon
The most populous races in Solon are White / Caucasian (15,989 | 66.5%), Asian (3,239 | 13.5%), and Black / African American (2,795 | 11.6%).
| Race | # Population | % Population |
| Asian | 3,239 | 13.5% |
| Black / African American | 2,795 | 11.6% |
| Hawaiian / Pacific | 41 | 0.2% |
| Hispanic or Latino | 1,020 | 4.2% |
| Native / Alaskan | 27 | 0.1% |
| White / Caucasian | 15,989 | 66.5% |
| Two or more Races | 1,726 | 7.2% |
| Some other Race | 236 | 1.0% |
| Total | 24,053 | 100.0% |
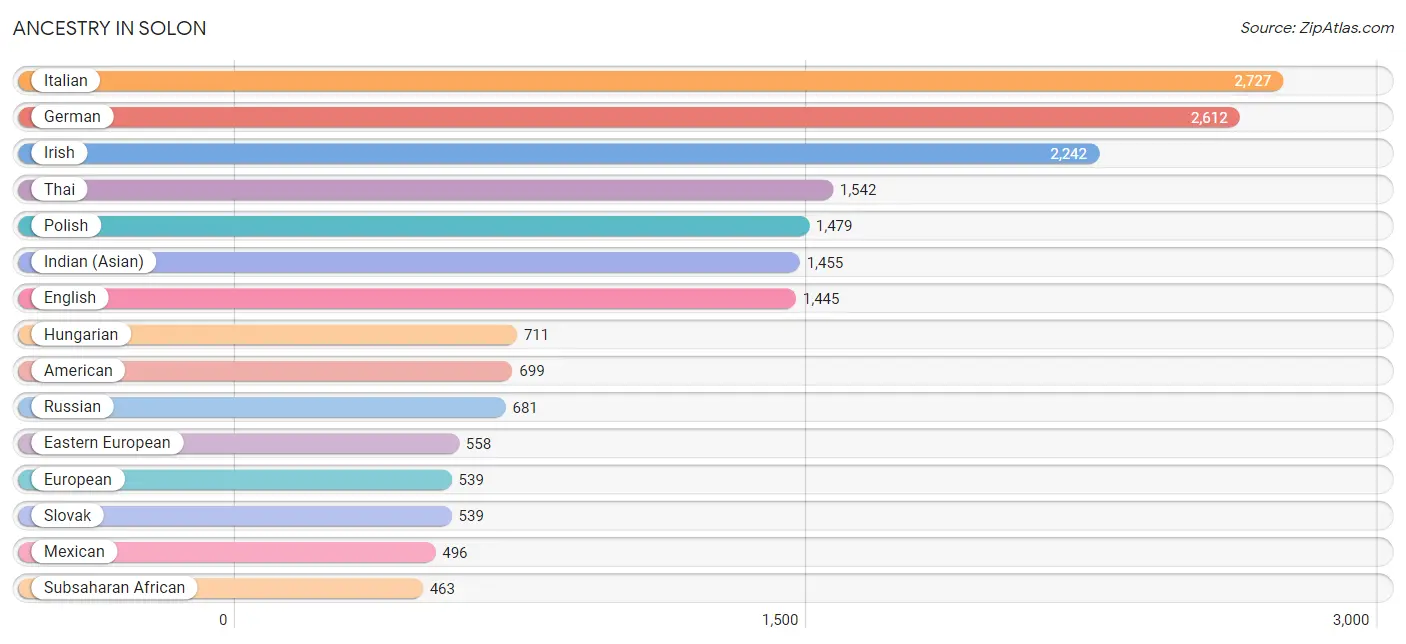
Ancestry in Solon
The most populous ancestries reported in Solon are Italian (2,727 | 11.3%), German (2,612 | 10.9%), Irish (2,242 | 9.3%), Thai (1,542 | 6.4%), and Polish (1,479 | 6.1%), together accounting for 44.1% of all Solon residents.
| Ancestry | # Population | % Population |
| African | 136 | 0.6% |
| American | 699 | 2.9% |
| Arab | 258 | 1.1% |
| Armenian | 29 | 0.1% |
| Austrian | 42 | 0.2% |
| Belgian | 31 | 0.1% |
| Bhutanese | 48 | 0.2% |
| Brazilian | 20 | 0.1% |
| British | 47 | 0.2% |
| Burmese | 161 | 0.7% |
| Canadian | 5 | 0.0% |
| Cherokee | 21 | 0.1% |
| Colombian | 161 | 0.7% |
| Croatian | 137 | 0.6% |
| Czech | 312 | 1.3% |
| Czechoslovakian | 111 | 0.5% |
| Danish | 20 | 0.1% |
| Dominican | 102 | 0.4% |
| Dutch | 34 | 0.1% |
| Eastern European | 558 | 2.3% |
| English | 1,445 | 6.0% |
| Ethiopian | 12 | 0.1% |
| European | 539 | 2.2% |
| Filipino | 23 | 0.1% |
| Finnish | 101 | 0.4% |
| French | 337 | 1.4% |
| French Canadian | 37 | 0.2% |
| German | 2,612 | 10.9% |
| Greek | 104 | 0.4% |
| Haitian | 9 | 0.0% |
| Hungarian | 711 | 3.0% |
| Indian (Asian) | 1,455 | 6.0% |
| Iranian | 101 | 0.4% |
| Irish | 2,242 | 9.3% |
| Iroquois | 4 | 0.0% |
| Israeli | 72 | 0.3% |
| Italian | 2,727 | 11.3% |
| Japanese | 34 | 0.1% |
| Korean | 269 | 1.1% |
| Laotian | 29 | 0.1% |
| Latvian | 22 | 0.1% |
| Lebanese | 177 | 0.7% |
| Lithuanian | 66 | 0.3% |
| Macedonian | 18 | 0.1% |
| Mexican | 496 | 2.1% |
| Moroccan | 30 | 0.1% |
| Native Hawaiian | 8 | 0.0% |
| Nigerian | 255 | 1.1% |
| Northern European | 29 | 0.1% |
| Norwegian | 37 | 0.2% |
| Ottawa | 2 | 0.0% |
| Pennsylvania German | 14 | 0.1% |
| Peruvian | 13 | 0.1% |
| Polish | 1,479 | 6.1% |
| Puerto Rican | 76 | 0.3% |
| Romanian | 81 | 0.3% |
| Russian | 681 | 2.8% |
| Samoan | 12 | 0.1% |
| Scandinavian | 4 | 0.0% |
| Scotch-Irish | 59 | 0.3% |
| Scottish | 169 | 0.7% |
| Serbian | 143 | 0.6% |
| Slavic | 8 | 0.0% |
| Slovak | 539 | 2.2% |
| Slovene | 247 | 1.0% |
| South African | 42 | 0.2% |
| South American | 287 | 1.2% |
| Sri Lankan | 237 | 1.0% |
| Subsaharan African | 463 | 1.9% |
| Sudanese | 18 | 0.1% |
| Swedish | 253 | 1.1% |
| Swiss | 60 | 0.3% |
| Syrian | 5 | 0.0% |
| Thai | 1,542 | 6.4% |
| Trinidadian and Tobagonian | 20 | 0.1% |
| Turkish | 96 | 0.4% |
| Ukrainian | 262 | 1.1% |
| Venezuelan | 113 | 0.5% |
| Welsh | 176 | 0.7% | View All 79 Rows |
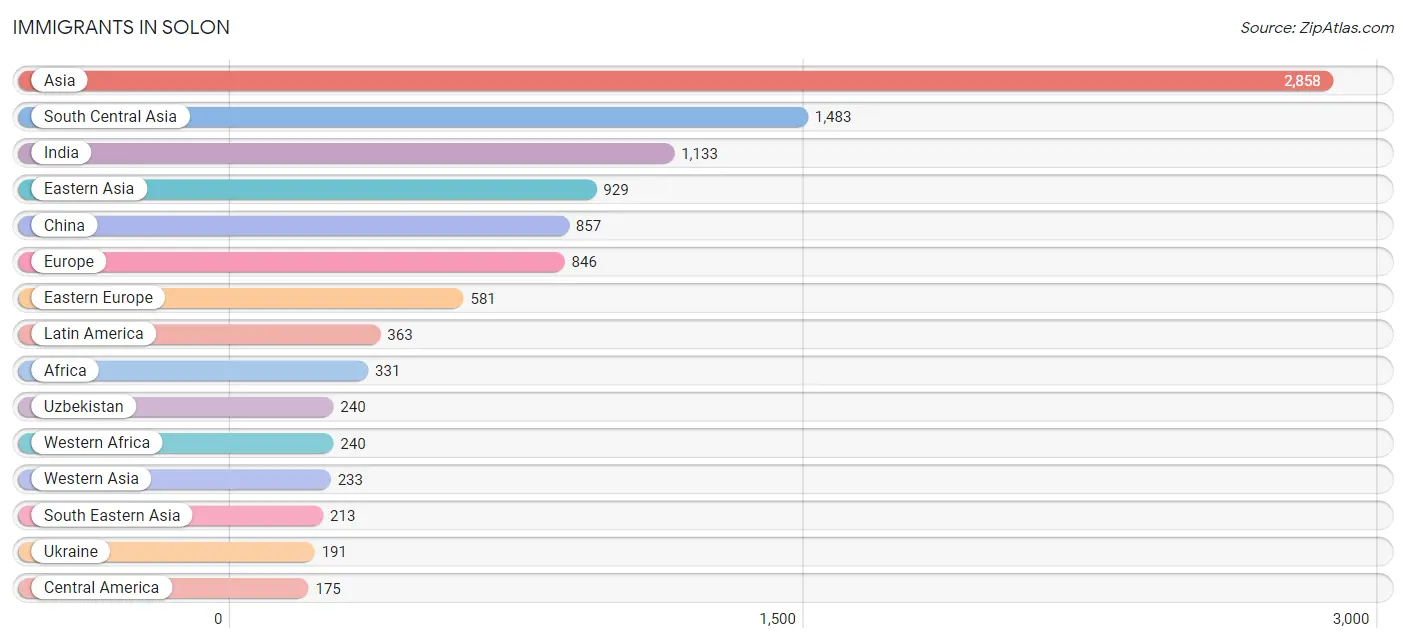
Immigrants in Solon
The most numerous immigrant groups reported in Solon came from Asia (2,858 | 11.9%), South Central Asia (1,483 | 6.2%), India (1,133 | 4.7%), Eastern Asia (929 | 3.9%), and China (857 | 3.6%), together accounting for 30.2% of all Solon residents.
| Immigration Origin | # Population | % Population |
| Africa | 331 | 1.4% |
| Asia | 2,858 | 11.9% |
| Belarus | 74 | 0.3% |
| Belgium | 18 | 0.1% |
| Brazil | 7 | 0.0% |
| Bulgaria | 14 | 0.1% |
| Canada | 68 | 0.3% |
| Caribbean | 20 | 0.1% |
| Central America | 175 | 0.7% |
| China | 857 | 3.6% |
| Colombia | 118 | 0.5% |
| Czechoslovakia | 8 | 0.0% |
| Eastern Africa | 12 | 0.1% |
| Eastern Asia | 929 | 3.9% |
| Eastern Europe | 581 | 2.4% |
| England | 24 | 0.1% |
| Ethiopia | 12 | 0.1% |
| Europe | 846 | 3.5% |
| Fiji | 10 | 0.0% |
| France | 7 | 0.0% |
| Germany | 38 | 0.2% |
| Hong Kong | 55 | 0.2% |
| Hungary | 26 | 0.1% |
| India | 1,133 | 4.7% |
| Iran | 101 | 0.4% |
| Ireland | 56 | 0.2% |
| Israel | 64 | 0.3% |
| Italy | 56 | 0.2% |
| Korea | 72 | 0.3% |
| Kuwait | 19 | 0.1% |
| Latin America | 363 | 1.5% |
| Lebanon | 75 | 0.3% |
| Liberia | 49 | 0.2% |
| Mexico | 175 | 0.7% |
| Moldova | 5 | 0.0% |
| Morocco | 30 | 0.1% |
| Nigeria | 171 | 0.7% |
| North Macedonia | 5 | 0.0% |
| Northern Africa | 37 | 0.2% |
| Northern Europe | 102 | 0.4% |
| Oceania | 16 | 0.1% |
| Pakistan | 9 | 0.0% |
| Peru | 13 | 0.1% |
| Philippines | 60 | 0.3% |
| Poland | 24 | 0.1% |
| Romania | 4 | 0.0% |
| Russia | 162 | 0.7% |
| Sierra Leone | 20 | 0.1% |
| South Africa | 42 | 0.2% |
| South America | 168 | 0.7% |
| South Central Asia | 1,483 | 6.2% |
| South Eastern Asia | 213 | 0.9% |
| Southern Europe | 56 | 0.2% |
| Sudan | 7 | 0.0% |
| Taiwan | 35 | 0.2% |
| Trinidad and Tobago | 20 | 0.1% |
| Turkey | 75 | 0.3% |
| Ukraine | 191 | 0.8% |
| Uzbekistan | 240 | 1.0% |
| Venezuela | 30 | 0.1% |
| Vietnam | 153 | 0.6% |
| Western Africa | 240 | 1.0% |
| Western Asia | 233 | 1.0% |
| Western Europe | 63 | 0.3% | View All 64 Rows |
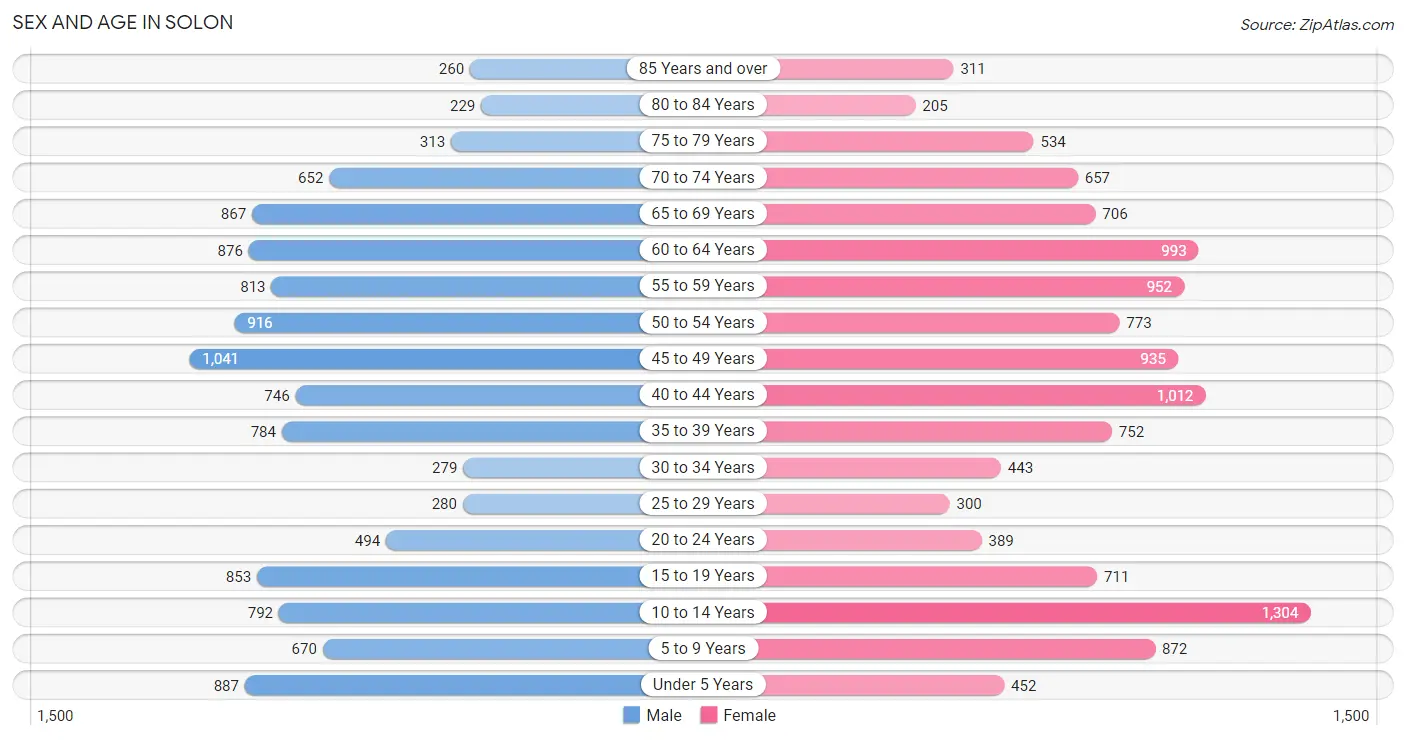
Sex and Age in Solon
Sex and Age in Solon
The most populous age groups in Solon are 45 to 49 Years (1,041 | 8.9%) for men and 10 to 14 Years (1,304 | 10.6%) for women.
| Age Bracket | Male | Female |
| Under 5 Years | 887 (7.5%) | 452 (3.7%) |
| 5 to 9 Years | 670 (5.7%) | 872 (7.1%) |
| 10 to 14 Years | 792 (6.7%) | 1,304 (10.6%) |
| 15 to 19 Years | 853 (7.3%) | 711 (5.8%) |
| 20 to 24 Years | 494 (4.2%) | 389 (3.2%) |
| 25 to 29 Years | 280 (2.4%) | 300 (2.4%) |
| 30 to 34 Years | 279 (2.4%) | 443 (3.6%) |
| 35 to 39 Years | 784 (6.7%) | 752 (6.1%) |
| 40 to 44 Years | 746 (6.4%) | 1,012 (8.2%) |
| 45 to 49 Years | 1,041 (8.9%) | 935 (7.6%) |
| 50 to 54 Years | 916 (7.8%) | 773 (6.3%) |
| 55 to 59 Years | 813 (6.9%) | 952 (7.7%) |
| 60 to 64 Years | 876 (7.4%) | 993 (8.1%) |
| 65 to 69 Years | 867 (7.4%) | 706 (5.7%) |
| 70 to 74 Years | 652 (5.6%) | 657 (5.3%) |
| 75 to 79 Years | 313 (2.7%) | 534 (4.3%) |
| 80 to 84 Years | 229 (1.9%) | 205 (1.7%) |
| 85 Years and over | 260 (2.2%) | 311 (2.5%) |
| Total | 11,752 (100.0%) | 12,301 (100.0%) |
Families and Households in Solon
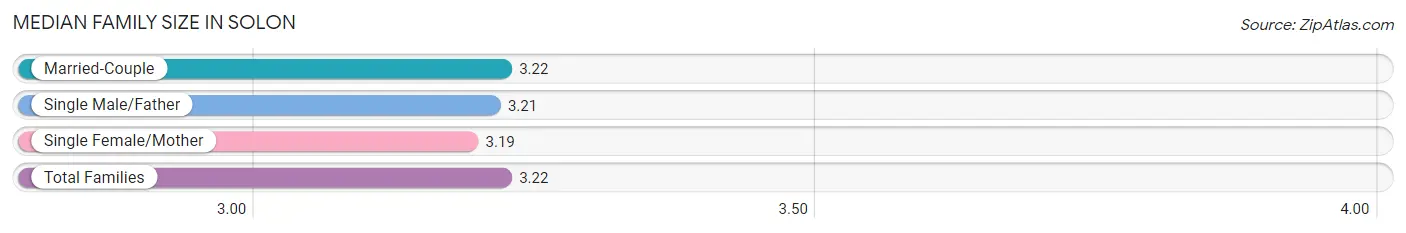
Median Family Size in Solon
The median family size in Solon is 3.22 persons per family, with married-couple families (5,955 | 89.9%) accounting for the largest median family size of 3.22 persons per family. On the other hand, single female/mother families (466 | 7.0%) represent the smallest median family size with 3.19 persons per family.
| Family Type | # Families | Family Size |
| Married-Couple | 5,955 (89.9%) | 3.22 |
| Single Male/Father | 202 (3.0%) | 3.21 |
| Single Female/Mother | 466 (7.0%) | 3.19 |
| Total Families | 6,623 (100.0%) | 3.22 |
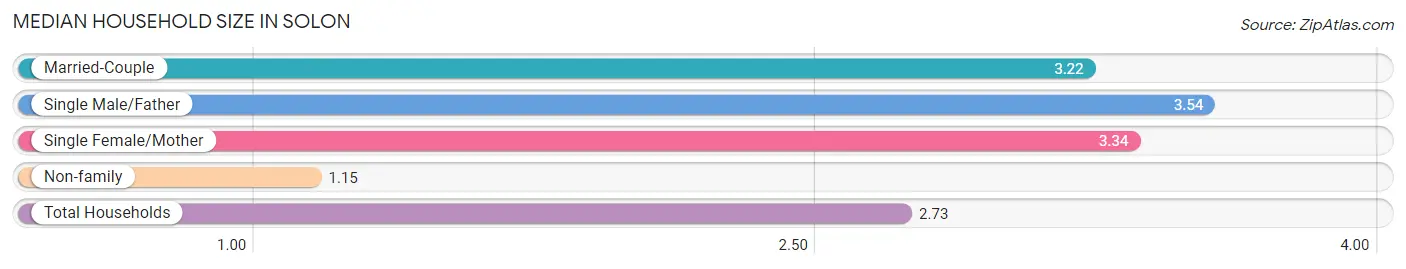
Median Household Size in Solon
The median household size in Solon is 2.73 persons per household, with single male/father households (202 | 2.3%) accounting for the largest median household size of 3.54 persons per household. non-family households (2,150 | 24.5%) represent the smallest median household size with 1.15 persons per household.
| Household Type | # Households | Household Size |
| Married-Couple | 5,955 (67.9%) | 3.22 |
| Single Male/Father | 202 (2.3%) | 3.54 |
| Single Female/Mother | 466 (5.3%) | 3.34 |
| Non-family | 2,150 (24.5%) | 1.15 |
| Total Households | 8,773 (100.0%) | 2.73 |
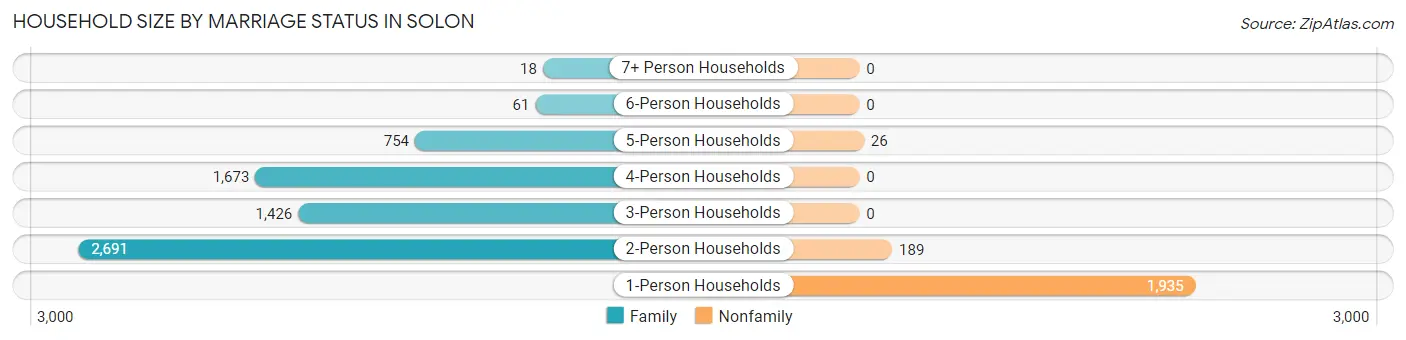
Household Size by Marriage Status in Solon
Out of a total of 8,773 households in Solon, 6,623 (75.5%) are family households, while 2,150 (24.5%) are nonfamily households. The most numerous type of family households are 2-person households, comprising 2,691, and the most common type of nonfamily households are 1-person households, comprising 1,935.
| Household Size | Family Households | Nonfamily Households |
| 1-Person Households | - | 1,935 (22.1%) |
| 2-Person Households | 2,691 (30.7%) | 189 (2.1%) |
| 3-Person Households | 1,426 (16.3%) | 0 (0.0%) |
| 4-Person Households | 1,673 (19.1%) | 0 (0.0%) |
| 5-Person Households | 754 (8.6%) | 26 (0.3%) |
| 6-Person Households | 61 (0.7%) | 0 (0.0%) |
| 7+ Person Households | 18 (0.2%) | 0 (0.0%) |
| Total | 6,623 (75.5%) | 2,150 (24.5%) |
Female Fertility in Solon
Fertility by Age in Solon
Average fertility rate in Solon is 42.0 births per 1,000 women. Women in the age bracket of 20 to 34 years have the highest fertility rate with 79.0 births per 1,000 women. Women in the age bracket of 35 to 50 years acount for 55.0% of all women with births.
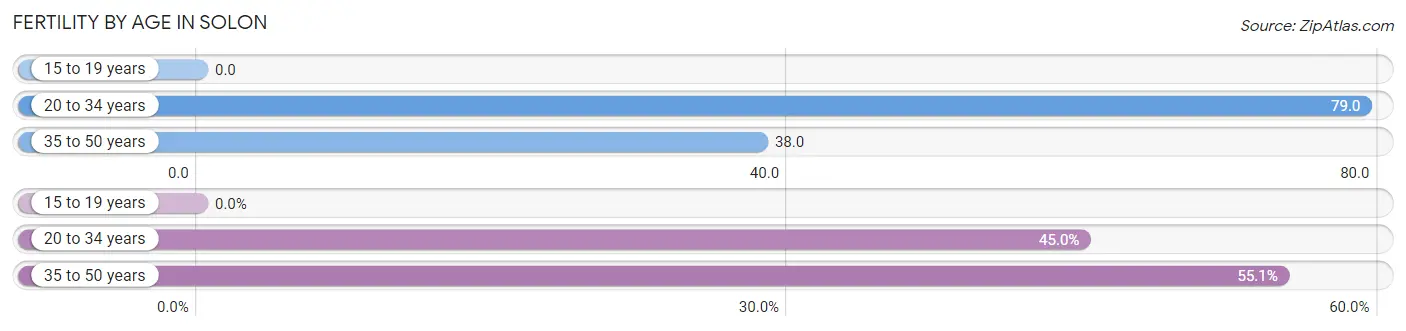
| Age Bracket | Women with Births | Births / 1,000 Women |
| 15 to 19 years | 0 (0.0%) | 0.0 |
| 20 to 34 years | 89 (45.0%) | 79.0 |
| 35 to 50 years | 109 (55.0%) | 38.0 |
| Total | 198 (100.0%) | 42.0 |
Fertility by Age by Marriage Status in Solon
92.4% of women with births (198) in Solon are married. The highest percentage of unmarried women with births falls into 35 to 50 years age bracket with 9.2% of them unmarried at the time of birth, while the lowest percentage of unmarried women with births belong to 20 to 34 years age bracket with 5.6% of them unmarried.
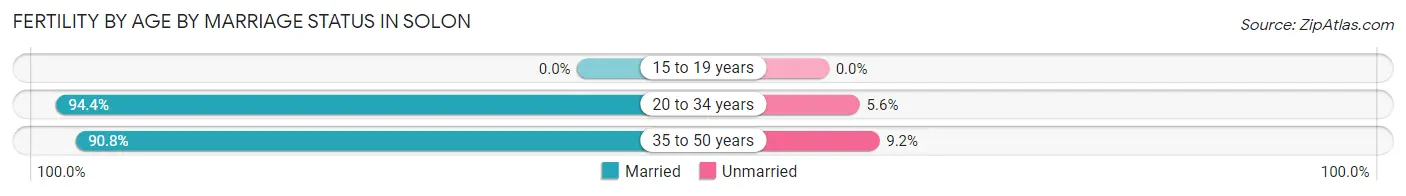
| Age Bracket | Married | Unmarried |
| 15 to 19 years | 0 (0.0%) | 0 (0.0%) |
| 20 to 34 years | 84 (94.4%) | 5 (5.6%) |
| 35 to 50 years | 99 (90.8%) | 10 (9.2%) |
| Total | 183 (92.4%) | 15 (7.6%) |
Fertility by Education in Solon
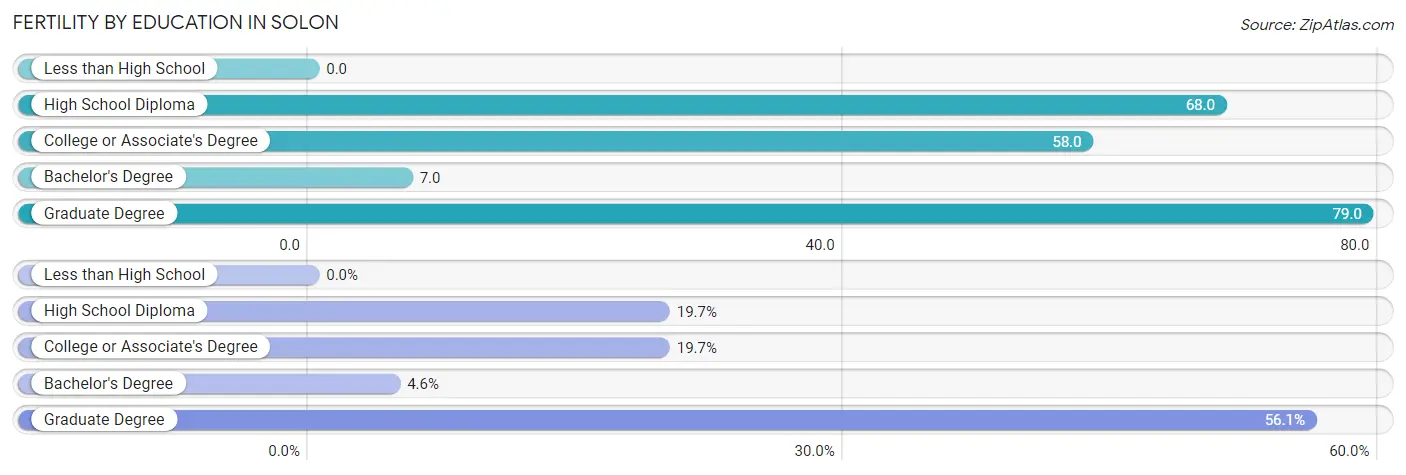
| Educational Attainment | Women with Births | Births / 1,000 Women |
| Less than High School | 0 (0.0%) | 0.0 |
| High School Diploma | 39 (19.7%) | 68.0 |
| College or Associate's Degree | 39 (19.7%) | 58.0 |
| Bachelor's Degree | 9 (4.5%) | 7.0 |
| Graduate Degree | 111 (56.1%) | 79.0 |
| Total | 198 (100.0%) | 42.0 |
Fertility by Education by Marriage Status in Solon
7.6% of women with births in Solon are unmarried. Women with the educational attainment of bachelor's degree are most likely to be married with 100.0% of them married at childbirth, while women with the educational attainment of college or associate's degree are least likely to be married with 25.6% of them unmarried at childbirth.
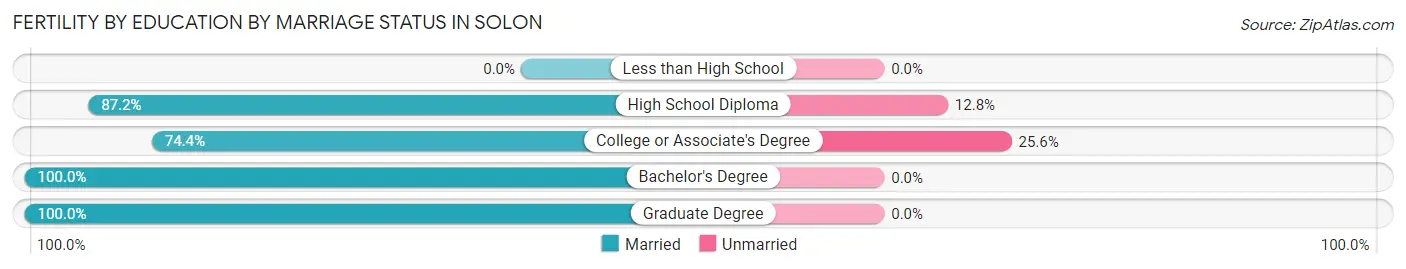
| Educational Attainment | Married | Unmarried |
| Less than High School | 0 (0.0%) | 0 (0.0%) |
| High School Diploma | 34 (87.2%) | 5 (12.8%) |
| College or Associate's Degree | 29 (74.4%) | 10 (25.6%) |
| Bachelor's Degree | 9 (100.0%) | 0 (0.0%) |
| Graduate Degree | 111 (100.0%) | 0 (0.0%) |
| Total | 183 (92.4%) | 15 (7.6%) |
Income in Solon
Income Overview in Solon
Per Capita Income in Solon is $66,670, while median incomes of families and households are $158,492 and $128,470 respectively.
| Characteristic | Number | Measure |
| Per Capita Income | 24,053 | $66,670 |
| Median Family Income | 6,623 | $158,492 |
| Mean Family Income | 6,623 | $216,730 |
| Median Household Income | 8,773 | $128,470 |
| Mean Household Income | 8,773 | $181,404 |
| Income Deficit | 6,623 | $0 |
| Wage / Income Gap (%) | 24,053 | 36.13% |
| Wage / Income Gap ($) | 24,053 | 63.87¢ per $1 |
| Gini / Inequality Index | 24,053 | 0.47 |
Earnings by Sex in Solon
Average Earnings in Solon are $70,839, $84,286 for men and $53,836 for women, a difference of 36.1%.
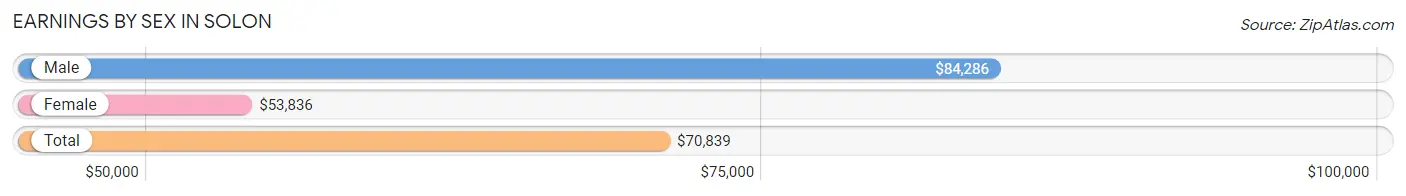
| Sex | Number | Average Earnings |
| Male | 7,126 (54.6%) | $84,286 |
| Female | 5,933 (45.4%) | $53,836 |
| Total | 13,059 (100.0%) | $70,839 |
Earnings by Sex by Income Bracket in Solon
The most common earnings brackets in Solon are $100,000+ for men (2,880 | 40.4%) and $100,000+ for women (1,340 | 22.6%).
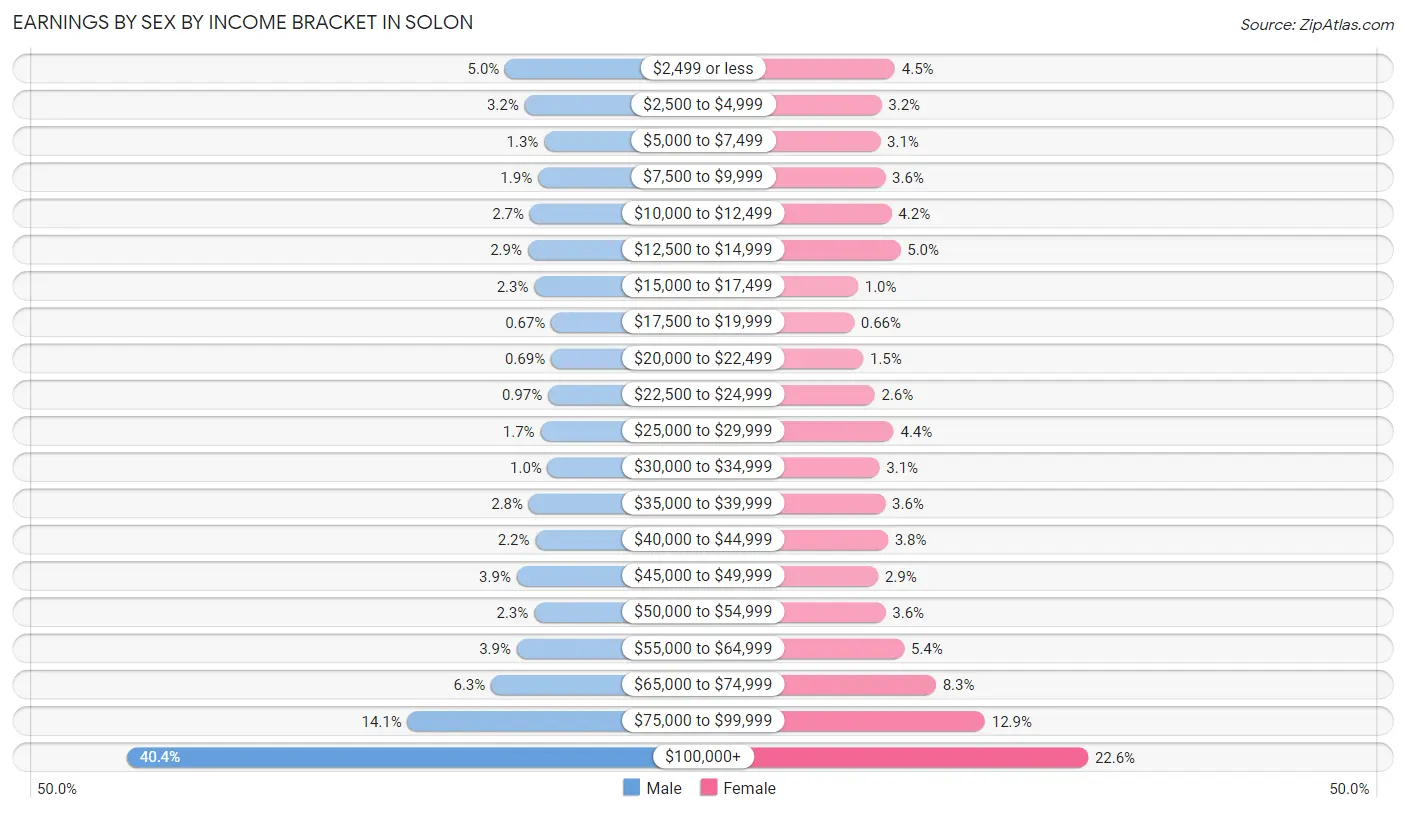
| Income | Male | Female |
| $2,499 or less | 355 (5.0%) | 267 (4.5%) |
| $2,500 to $4,999 | 226 (3.2%) | 192 (3.2%) |
| $5,000 to $7,499 | 95 (1.3%) | 185 (3.1%) |
| $7,500 to $9,999 | 136 (1.9%) | 213 (3.6%) |
| $10,000 to $12,499 | 190 (2.7%) | 248 (4.2%) |
| $12,500 to $14,999 | 204 (2.9%) | 297 (5.0%) |
| $15,000 to $17,499 | 160 (2.2%) | 61 (1.0%) |
| $17,500 to $19,999 | 48 (0.7%) | 39 (0.7%) |
| $20,000 to $22,499 | 49 (0.7%) | 90 (1.5%) |
| $22,500 to $24,999 | 69 (1.0%) | 154 (2.6%) |
| $25,000 to $29,999 | 120 (1.7%) | 260 (4.4%) |
| $30,000 to $34,999 | 71 (1.0%) | 181 (3.0%) |
| $35,000 to $39,999 | 197 (2.8%) | 213 (3.6%) |
| $40,000 to $44,999 | 153 (2.1%) | 227 (3.8%) |
| $45,000 to $49,999 | 278 (3.9%) | 173 (2.9%) |
| $50,000 to $54,999 | 162 (2.3%) | 214 (3.6%) |
| $55,000 to $64,999 | 277 (3.9%) | 318 (5.4%) |
| $65,000 to $74,999 | 449 (6.3%) | 494 (8.3%) |
| $75,000 to $99,999 | 1,007 (14.1%) | 767 (12.9%) |
| $100,000+ | 2,880 (40.4%) | 1,340 (22.6%) |
| Total | 7,126 (100.0%) | 5,933 (100.0%) |
Earnings by Sex by Educational Attainment in Solon
Average earnings in Solon are $88,839 for men and $59,884 for women, a difference of 32.6%. Men with an educational attainment of graduate degree enjoy the highest average annual earnings of $129,245, while those with high school diploma education earn the least with $51,741. Women with an educational attainment of graduate degree earn the most with the average annual earnings of $95,653, while those with high school diploma education have the smallest earnings of $28,490.
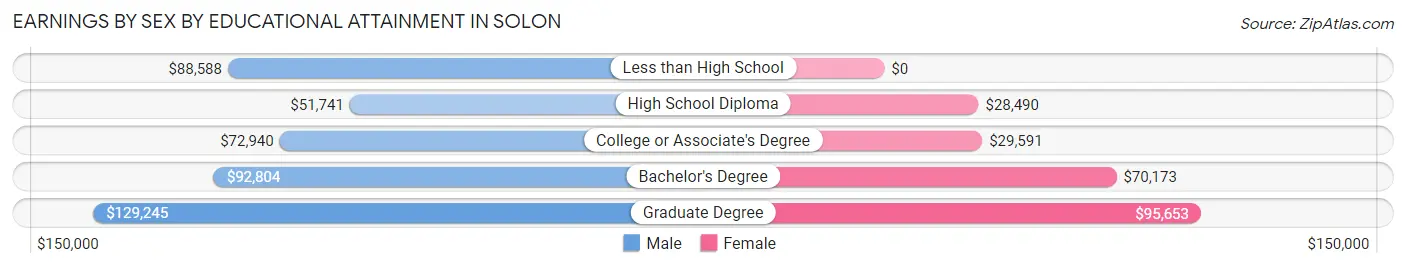
| Educational Attainment | Male Income | Female Income |
| Less than High School | $88,588 | $0 |
| High School Diploma | $51,741 | $28,490 |
| College or Associate's Degree | $72,940 | $29,591 |
| Bachelor's Degree | $92,804 | $70,173 |
| Graduate Degree | $129,245 | $95,653 |
| Total | $88,839 | $59,884 |
Family Income in Solon
Family Income Brackets in Solon
According to the Solon family income data, there are 2,583 families falling into the $200,000+ income range, which is the most common income bracket and makes up 39.0% of all families. Conversely, the less than $10,000 income bracket is the least frequent group with only 26 families (0.4%) belonging to this category.
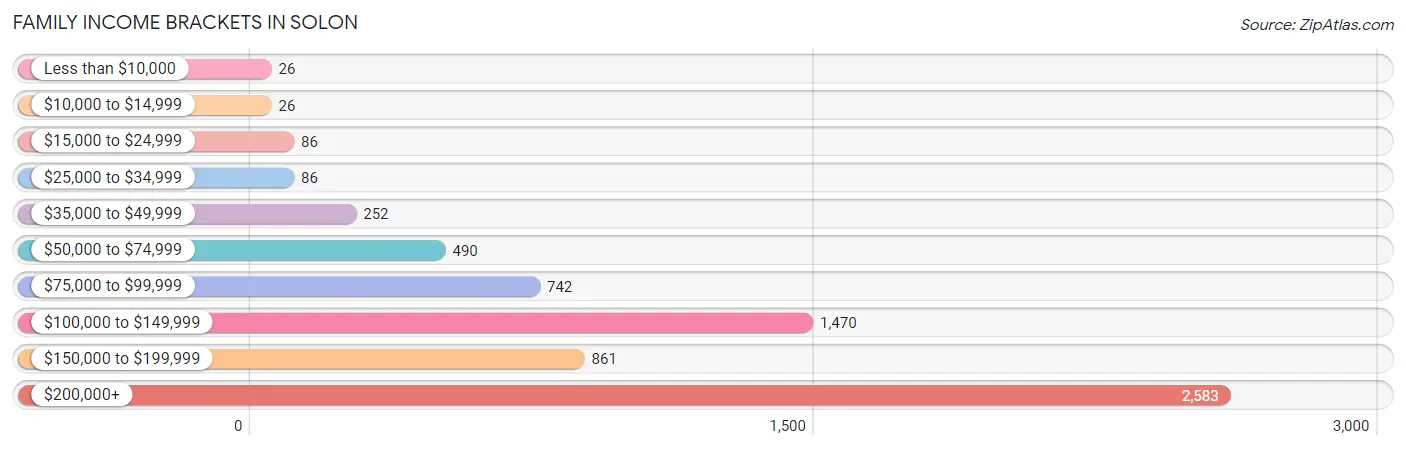
| Income Bracket | # Families | % Families |
| Less than $10,000 | 26 | 0.4% |
| $10,000 to $14,999 | 26 | 0.4% |
| $15,000 to $24,999 | 86 | 1.3% |
| $25,000 to $34,999 | 86 | 1.3% |
| $35,000 to $49,999 | 252 | 3.8% |
| $50,000 to $74,999 | 490 | 7.4% |
| $75,000 to $99,999 | 742 | 11.2% |
| $100,000 to $149,999 | 1,470 | 22.2% |
| $150,000 to $199,999 | 861 | 13.0% |
| $200,000+ | 2,583 | 39.0% |
Family Income by Famaliy Size in Solon
7+ person families (18 | 0.3%) account for the highest median family income in Solon with $250,001 per family, while 2-person families (2,749 | 41.5%) have the highest median income of $65,256 per family member.
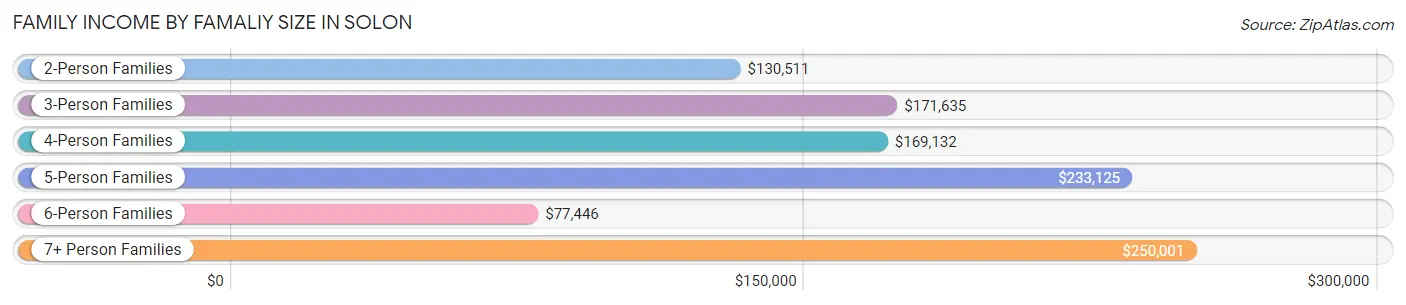
| Income Bracket | # Families | Median Income |
| 2-Person Families | 2,749 (41.5%) | $130,511 |
| 3-Person Families | 1,391 (21.0%) | $171,635 |
| 4-Person Families | 1,681 (25.4%) | $169,132 |
| 5-Person Families | 723 (10.9%) | $233,125 |
| 6-Person Families | 61 (0.9%) | $77,446 |
| 7+ Person Families | 18 (0.3%) | $250,001 |
| Total | 6,623 (100.0%) | $158,492 |
Family Income by Number of Earners in Solon
The median family income in Solon is $158,492, with families comprising 3+ earners (884) having the highest median family income of $230,227, while families with no earners (615) have the lowest median family income of $88,542, accounting for 13.4% and 9.3% of families, respectively.
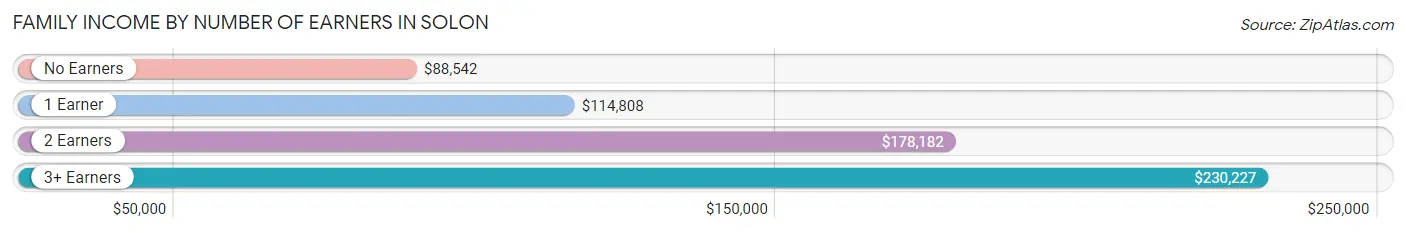
| Number of Earners | # Families | Median Income |
| No Earners | 615 (9.3%) | $88,542 |
| 1 Earner | 1,794 (27.1%) | $114,808 |
| 2 Earners | 3,330 (50.3%) | $178,182 |
| 3+ Earners | 884 (13.4%) | $230,227 |
| Total | 6,623 (100.0%) | $158,492 |
Household Income in Solon
Household Income Brackets in Solon
With 2,693 households falling in the category, the $200,000+ income range is the most frequent in Solon, accounting for 30.7% of all households. In contrast, only 61 households (0.7%) fall into the $10,000 to $14,999 income bracket, making it the least populous group.
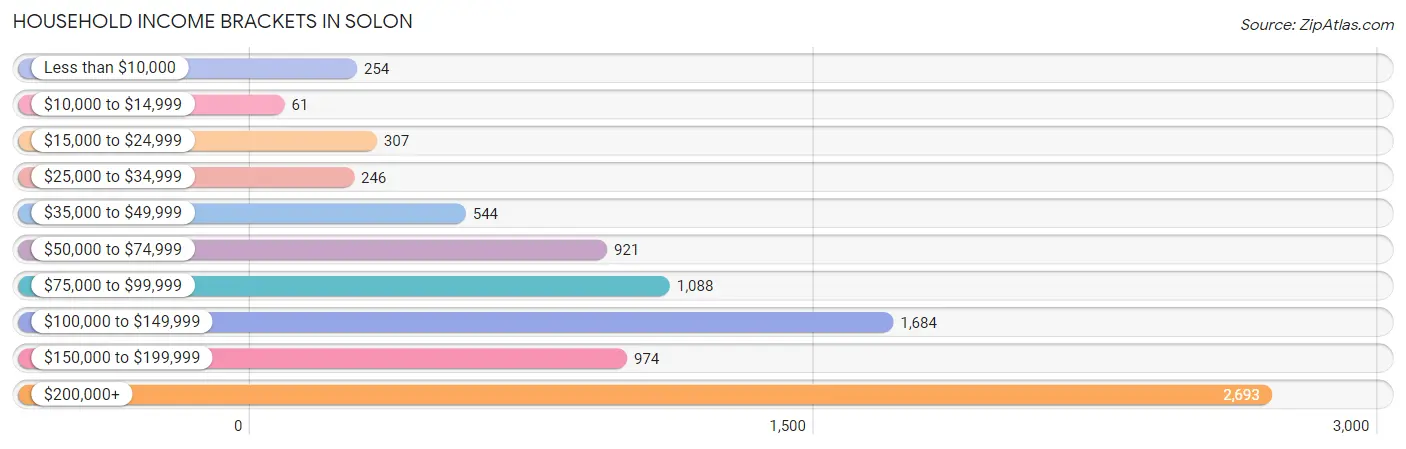
| Income Bracket | # Households | % Households |
| Less than $10,000 | 254 | 2.9% |
| $10,000 to $14,999 | 61 | 0.7% |
| $15,000 to $24,999 | 307 | 3.5% |
| $25,000 to $34,999 | 246 | 2.8% |
| $35,000 to $49,999 | 544 | 6.2% |
| $50,000 to $74,999 | 921 | 10.5% |
| $75,000 to $99,999 | 1,088 | 12.4% |
| $100,000 to $149,999 | 1,684 | 19.2% |
| $150,000 to $199,999 | 974 | 11.1% |
| $200,000+ | 2,693 | 30.7% |
Household Income by Householder Age in Solon
The median household income in Solon is $128,470, with the highest median household income of $168,429 found in the 45 to 64 years age bracket for the primary householder. A total of 3,982 households (45.4%) fall into this category. Meanwhile, the 15 to 24 years age bracket for the primary householder has the lowest median household income of $69,708, with 127 households (1.5%) in this group.
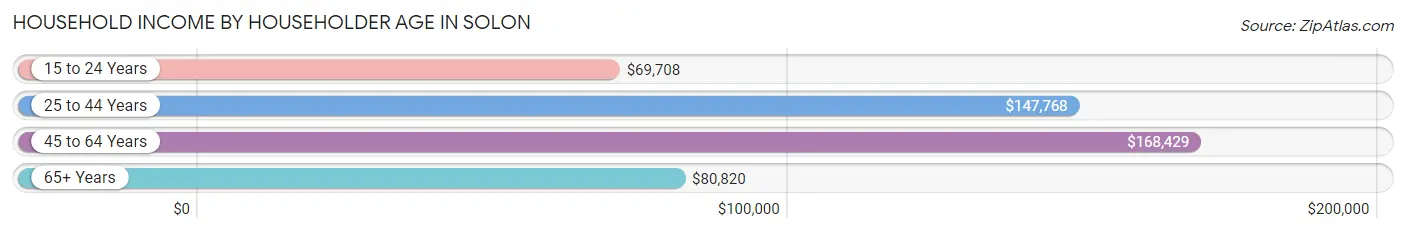
| Income Bracket | # Households | Median Income |
| 15 to 24 Years | 127 (1.5%) | $69,708 |
| 25 to 44 Years | 1,916 (21.8%) | $147,768 |
| 45 to 64 Years | 3,982 (45.4%) | $168,429 |
| 65+ Years | 2,748 (31.3%) | $80,820 |
| Total | 8,773 (100.0%) | $128,470 |
Poverty in Solon
Income Below Poverty by Sex and Age in Solon
With 2.5% poverty level for males and 4.1% for females among the residents of Solon, 5 year old males and 18 to 24 year old females are the most vulnerable to poverty, with 9 males (9.3%) and 59 females (11.0%) in their respective age groups living below the poverty level.
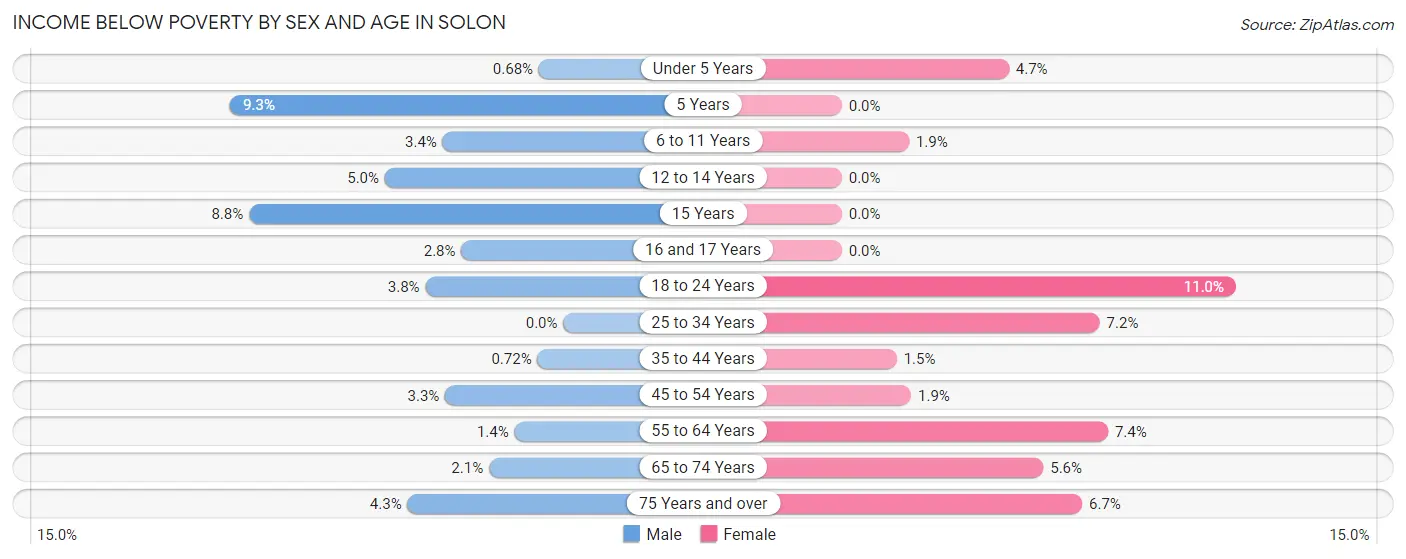
| Age Bracket | Male | Female |
| Under 5 Years | 6 (0.7%) | 21 (4.6%) |
| 5 Years | 9 (9.3%) | 0 (0.0%) |
| 6 to 11 Years | 29 (3.4%) | 24 (1.9%) |
| 12 to 14 Years | 25 (5.0%) | 0 (0.0%) |
| 15 Years | 14 (8.7%) | 0 (0.0%) |
| 16 and 17 Years | 13 (2.8%) | 0 (0.0%) |
| 18 to 24 Years | 28 (3.8%) | 59 (11.0%) |
| 25 to 34 Years | 0 (0.0%) | 53 (7.2%) |
| 35 to 44 Years | 11 (0.7%) | 27 (1.5%) |
| 45 to 54 Years | 64 (3.3%) | 33 (1.9%) |
| 55 to 64 Years | 23 (1.4%) | 144 (7.4%) |
| 65 to 74 Years | 31 (2.1%) | 76 (5.6%) |
| 75 Years and over | 34 (4.3%) | 69 (6.7%) |
| Total | 287 (2.5%) | 506 (4.1%) |
Income Above Poverty by Sex and Age in Solon
According to the poverty statistics in Solon, males aged 25 to 34 years and females aged 5 years are the age groups that are most secure financially, with 100.0% of males and 100.0% of females in these age groups living above the poverty line.
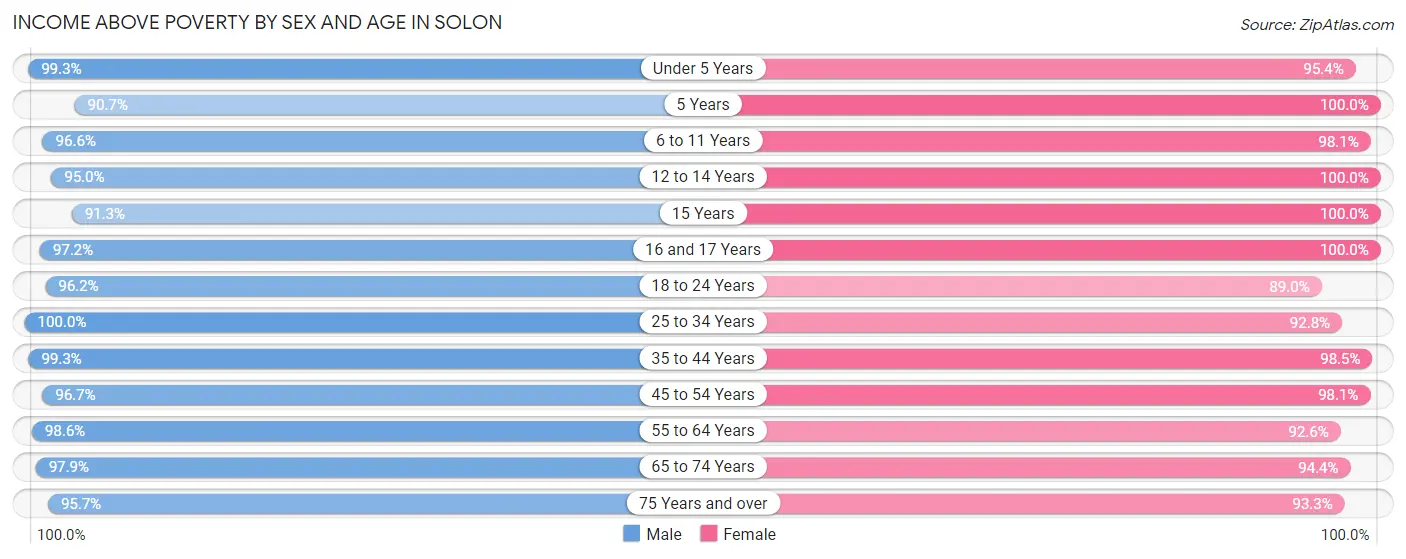
| Age Bracket | Male | Female |
| Under 5 Years | 881 (99.3%) | 431 (95.4%) |
| 5 Years | 88 (90.7%) | 130 (100.0%) |
| 6 to 11 Years | 833 (96.6%) | 1,260 (98.1%) |
| 12 to 14 Years | 478 (95.0%) | 748 (100.0%) |
| 15 Years | 146 (91.2%) | 117 (100.0%) |
| 16 and 17 Years | 445 (97.2%) | 444 (100.0%) |
| 18 to 24 Years | 701 (96.2%) | 479 (89.0%) |
| 25 to 34 Years | 542 (100.0%) | 685 (92.8%) |
| 35 to 44 Years | 1,519 (99.3%) | 1,737 (98.5%) |
| 45 to 54 Years | 1,884 (96.7%) | 1,674 (98.1%) |
| 55 to 64 Years | 1,666 (98.6%) | 1,800 (92.6%) |
| 65 to 74 Years | 1,470 (97.9%) | 1,278 (94.4%) |
| 75 Years and over | 750 (95.7%) | 963 (93.3%) |
| Total | 11,403 (97.5%) | 11,746 (95.9%) |
Income Below Poverty Among Married-Couple Families in Solon
The poverty statistics for married-couple families in Solon show that 1.2% or 70 of the total 5,955 families live below the poverty line. Families with no children have the highest poverty rate of 1.9%, comprising of 61 families. On the other hand, families with 3 or 4 children have the lowest poverty rate of 0.0%, which includes 0 families.
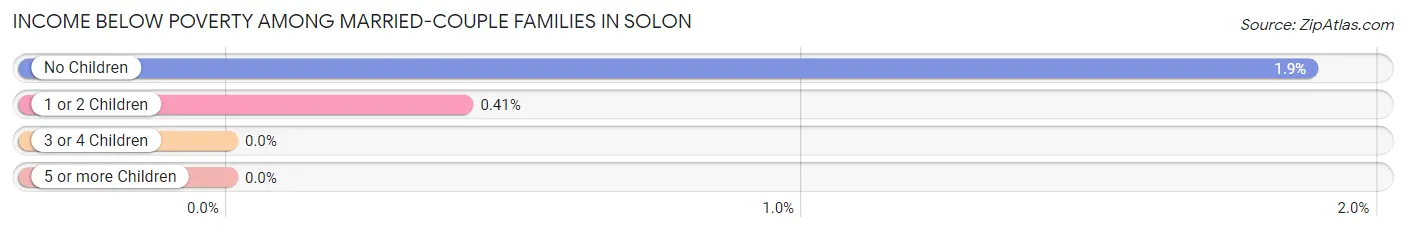
| Children | Above Poverty | Below Poverty |
| No Children | 3,183 (98.1%) | 61 (1.9%) |
| 1 or 2 Children | 2,162 (99.6%) | 9 (0.4%) |
| 3 or 4 Children | 522 (100.0%) | 0 (0.0%) |
| 5 or more Children | 18 (100.0%) | 0 (0.0%) |
| Total | 5,885 (98.8%) | 70 (1.2%) |
Income Below Poverty Among Single-Parent Households in Solon
According to the poverty data in Solon, 3.0% or 6 single-father households and 9.2% or 43 single-mother households are living below the poverty line. Among single-father households, those with no children have the highest poverty rate, with 6 households (4.9%) experiencing poverty. Likewise, among single-mother households, those with 3 or 4 children have the highest poverty rate, with 18 households (22.2%) falling below the poverty line.
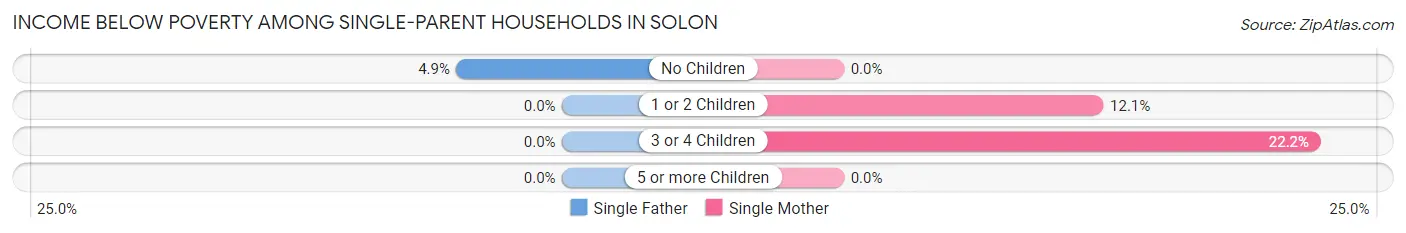
| Children | Single Father | Single Mother |
| No Children | 6 (4.9%) | 0 (0.0%) |
| 1 or 2 Children | 0 (0.0%) | 25 (12.1%) |
| 3 or 4 Children | 0 (0.0%) | 18 (22.2%) |
| 5 or more Children | 0 (0.0%) | 0 (0.0%) |
| Total | 6 (3.0%) | 43 (9.2%) |
Income Below Poverty Among Married-Couple vs Single-Parent Households in Solon
The poverty data for Solon shows that 70 of the married-couple family households (1.2%) and 49 of the single-parent households (7.3%) are living below the poverty level. Within the married-couple family households, those with no children have the highest poverty rate, with 61 households (1.9%) falling below the poverty line. Among the single-parent households, those with 3 or 4 children have the highest poverty rate, with 18 household (16.5%) living below poverty.
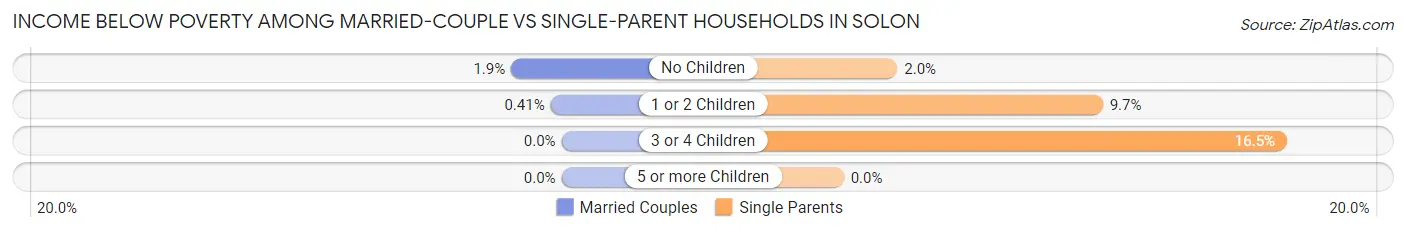
| Children | Married-Couple Families | Single-Parent Households |
| No Children | 61 (1.9%) | 6 (2.0%) |
| 1 or 2 Children | 9 (0.4%) | 25 (9.7%) |
| 3 or 4 Children | 0 (0.0%) | 18 (16.5%) |
| 5 or more Children | 0 (0.0%) | 0 (0.0%) |
| Total | 70 (1.2%) | 49 (7.3%) |
Employment Characteristics in Solon
Employment by Class of Employer in Solon
Among the 12,074 employed individuals in Solon, private company employees (7,699 | 63.8%), not-for-profit organizations (1,622 | 13.4%), and self-employed (incorporated) (893 | 7.4%) make up the most common classes of employment.
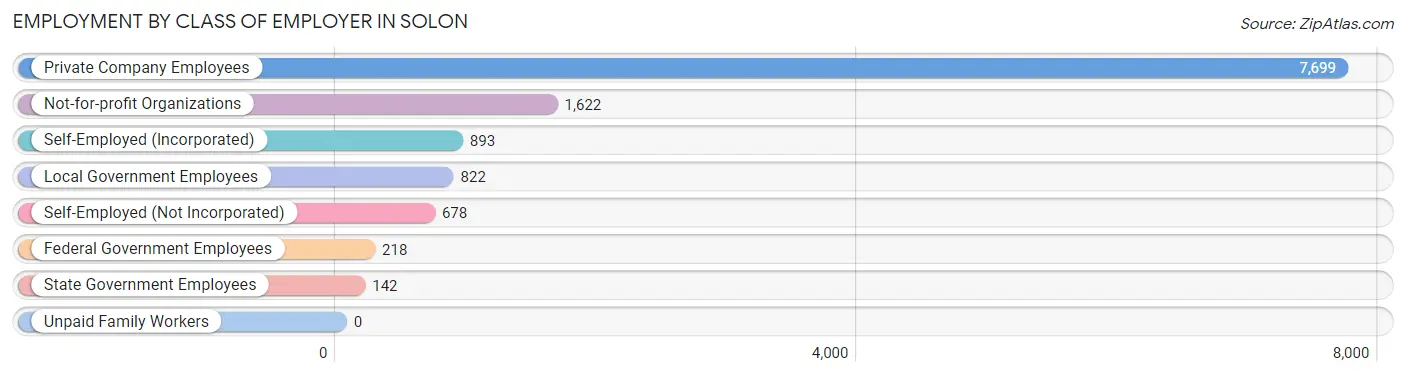
| Employer Class | # Employees | % Employees |
| Private Company Employees | 7,699 | 63.8% |
| Self-Employed (Incorporated) | 893 | 7.4% |
| Self-Employed (Not Incorporated) | 678 | 5.6% |
| Not-for-profit Organizations | 1,622 | 13.4% |
| Local Government Employees | 822 | 6.8% |
| State Government Employees | 142 | 1.2% |
| Federal Government Employees | 218 | 1.8% |
| Unpaid Family Workers | 0 | 0.0% |
| Total | 12,074 | 100.0% |
Employment Status by Age in Solon
According to the labor force statistics for Solon, out of the total population over 16 years of age (18,799), 66.6% or 12,520 individuals are in the labor force, with 3.1% or 388 of them unemployed. The age group with the highest labor force participation rate is 45 to 54 years, with 92.2% or 3,379 individuals in the labor force. Within the labor force, the 20 to 24 years age range has the highest percentage of unemployed individuals, with 14.2% or 105 of them being unemployed.
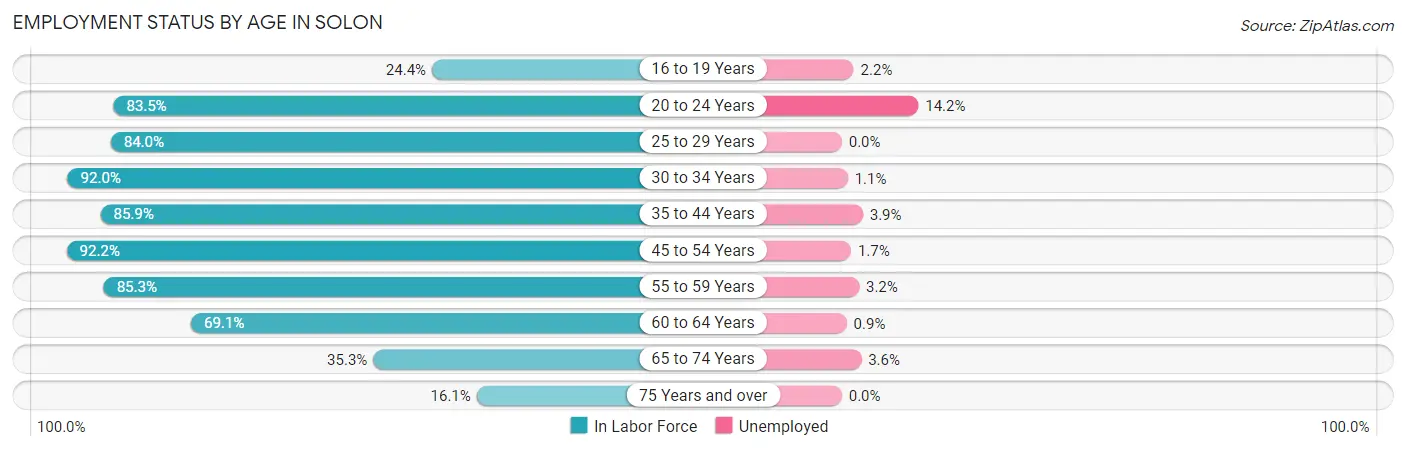
| Age Bracket | In Labor Force | Unemployed |
| 16 to 19 Years | 314 (24.4%) | 7 (2.2%) |
| 20 to 24 Years | 737 (83.5%) | 105 (14.2%) |
| 25 to 29 Years | 487 (84.0%) | 0 (0.0%) |
| 30 to 34 Years | 664 (92.0%) | 7 (1.1%) |
| 35 to 44 Years | 2,830 (85.9%) | 110 (3.9%) |
| 45 to 54 Years | 3,379 (92.2%) | 57 (1.7%) |
| 55 to 59 Years | 1,506 (85.3%) | 48 (3.2%) |
| 60 to 64 Years | 1,291 (69.1%) | 12 (0.9%) |
| 65 to 74 Years | 1,017 (35.3%) | 37 (3.6%) |
| 75 Years and over | 298 (16.1%) | 0 (0.0%) |
| Total | 12,520 (66.6%) | 388 (3.1%) |
Employment Status by Educational Attainment in Solon
According to labor force statistics for Solon, 85.4% of individuals (10,158) out of the total population between 25 and 64 years of age (11,895) are in the labor force, with 2.3% or 234 of them being unemployed. The group with the highest labor force participation rate are those with the educational attainment of less than high school, with 93.7% or 553 individuals in the labor force. Within the labor force, individuals with college / associate degree education have the highest percentage of unemployment, with 4.3% or 67 of them being unemployed.
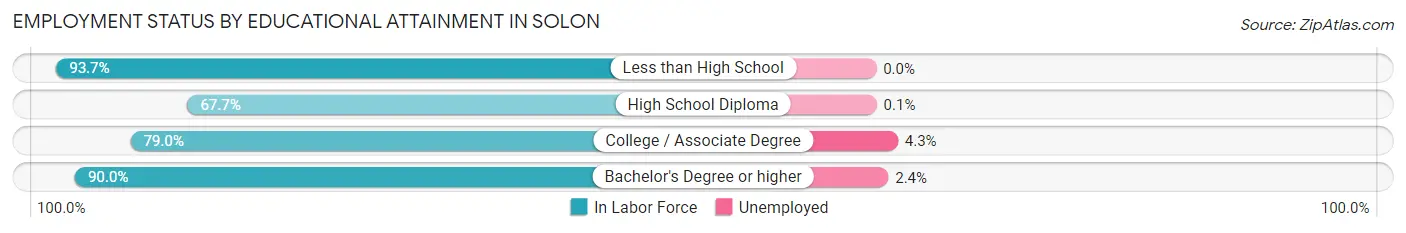
| Educational Attainment | In Labor Force | Unemployed |
| Less than High School | 553 (93.7%) | 0 (0.0%) |
| High School Diploma | 1,070 (67.7%) | 2 (0.1%) |
| College / Associate Degree | 1,558 (79.0%) | 85 (4.3%) |
| Bachelor's Degree or higher | 6,978 (90.0%) | 186 (2.4%) |
| Total | 10,158 (85.4%) | 274 (2.3%) |
Employment Occupations by Sex in Solon
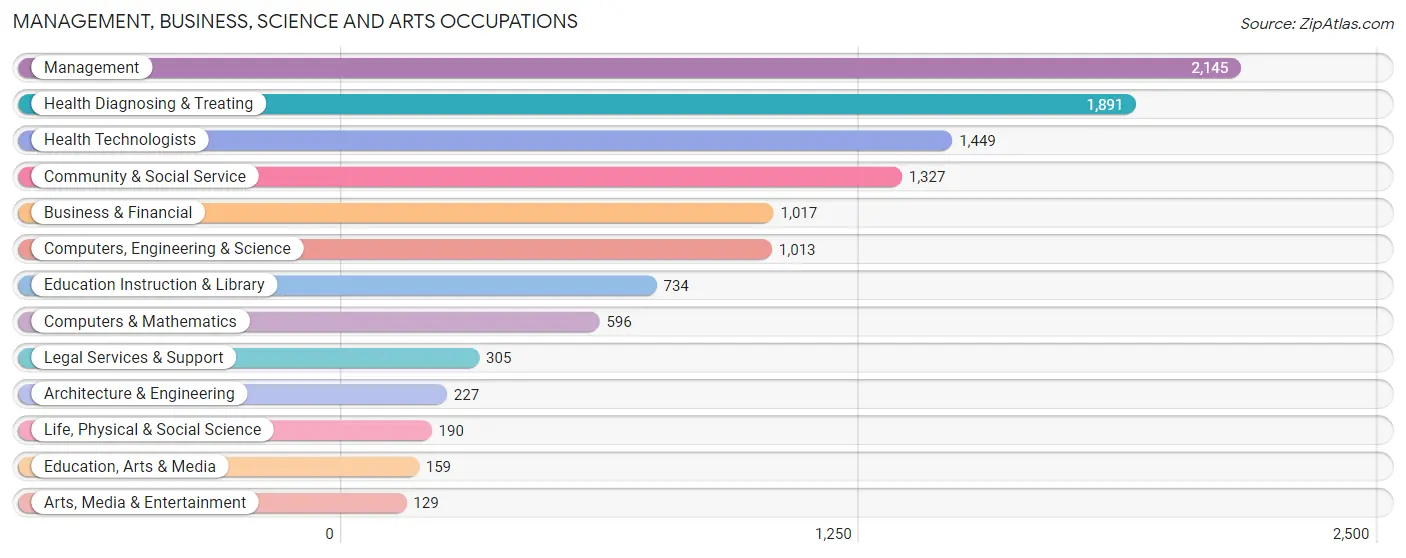
Management, Business, Science and Arts Occupations
The most common Management, Business, Science and Arts occupations in Solon are Management (2,145 | 17.7%), Health Diagnosing & Treating (1,891 | 15.6%), Health Technologists (1,449 | 11.9%), Community & Social Service (1,327 | 10.9%), and Business & Financial (1,017 | 8.4%).
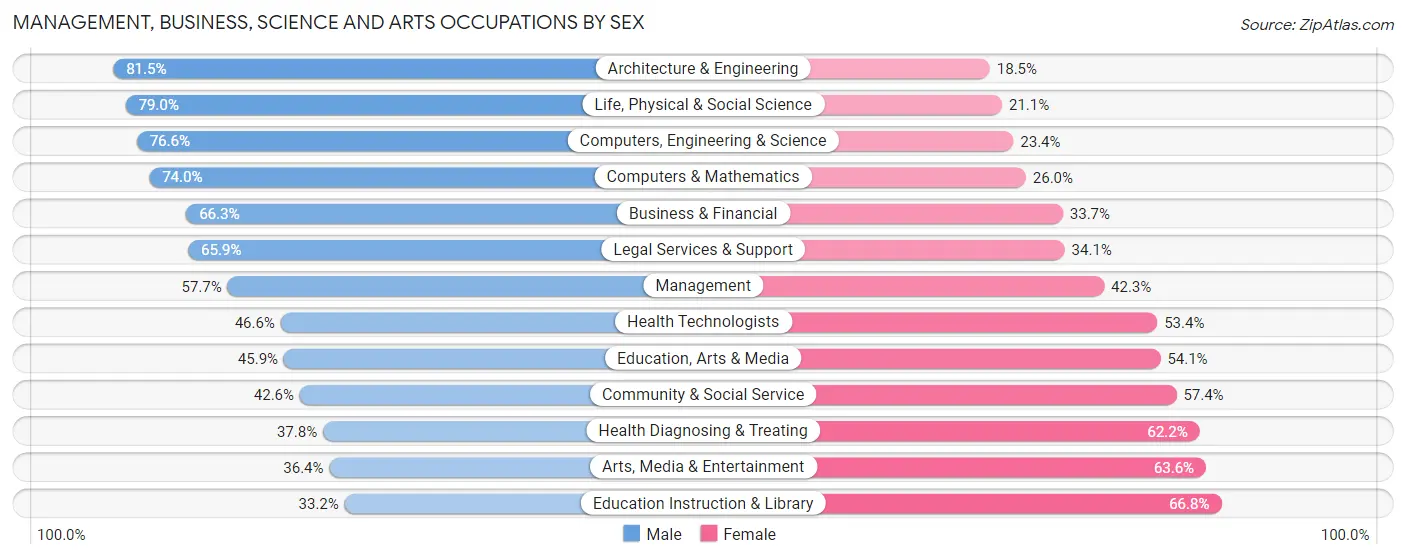
Management, Business, Science and Arts Occupations by Sex
Within the Management, Business, Science and Arts occupations in Solon, the most male-oriented occupations are Architecture & Engineering (81.5%), Life, Physical & Social Science (78.9%), and Computers, Engineering & Science (76.6%), while the most female-oriented occupations are Education Instruction & Library (66.8%), Arts, Media & Entertainment (63.6%), and Health Diagnosing & Treating (62.2%).
| Occupation | Male | Female |
| Management | 1,237 (57.7%) | 908 (42.3%) |
| Business & Financial | 674 (66.3%) | 343 (33.7%) |
| Computers, Engineering & Science | 776 (76.6%) | 237 (23.4%) |
| Computers & Mathematics | 441 (74.0%) | 155 (26.0%) |
| Architecture & Engineering | 185 (81.5%) | 42 (18.5%) |
| Life, Physical & Social Science | 150 (78.9%) | 40 (21.0%) |
| Community & Social Service | 565 (42.6%) | 762 (57.4%) |
| Education, Arts & Media | 73 (45.9%) | 86 (54.1%) |
| Legal Services & Support | 201 (65.9%) | 104 (34.1%) |
| Education Instruction & Library | 244 (33.2%) | 490 (66.8%) |
| Arts, Media & Entertainment | 47 (36.4%) | 82 (63.6%) |
| Health Diagnosing & Treating | 714 (37.8%) | 1,177 (62.2%) |
| Health Technologists | 675 (46.6%) | 774 (53.4%) |
| Total (Category) | 3,966 (53.6%) | 3,427 (46.4%) |
| Total (Overall) | 6,655 (54.9%) | 5,470 (45.1%) |
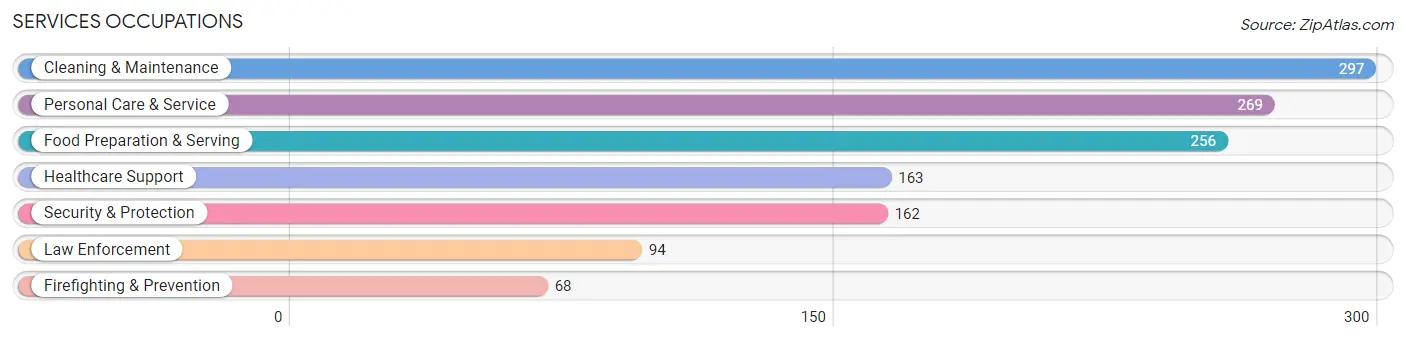
Services Occupations
The most common Services occupations in Solon are Cleaning & Maintenance (297 | 2.5%), Personal Care & Service (269 | 2.2%), Food Preparation & Serving (256 | 2.1%), Healthcare Support (163 | 1.3%), and Security & Protection (162 | 1.3%).
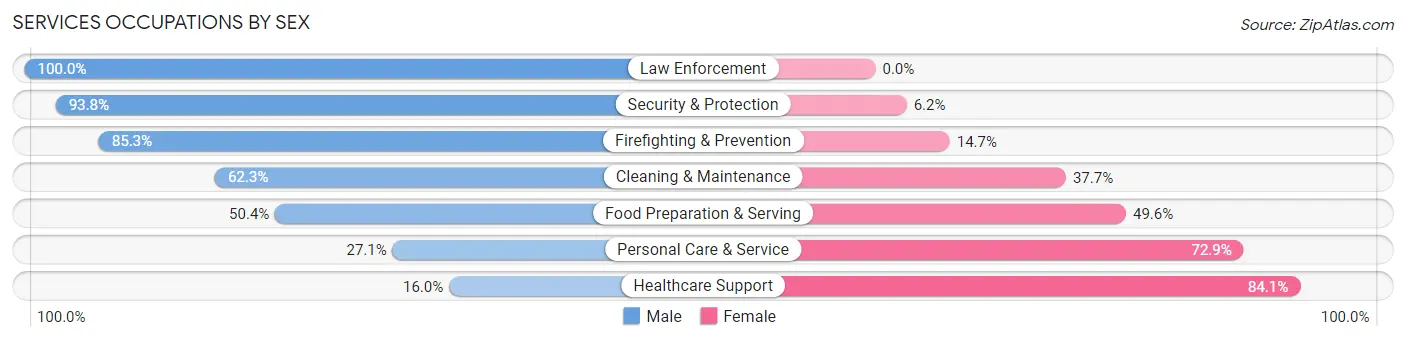
Services Occupations by Sex
Within the Services occupations in Solon, the most male-oriented occupations are Law Enforcement (100.0%), Security & Protection (93.8%), and Firefighting & Prevention (85.3%), while the most female-oriented occupations are Healthcare Support (84.1%), Personal Care & Service (72.9%), and Food Preparation & Serving (49.6%).
| Occupation | Male | Female |
| Healthcare Support | 26 (16.0%) | 137 (84.1%) |
| Security & Protection | 152 (93.8%) | 10 (6.2%) |
| Firefighting & Prevention | 58 (85.3%) | 10 (14.7%) |
| Law Enforcement | 94 (100.0%) | 0 (0.0%) |
| Food Preparation & Serving | 129 (50.4%) | 127 (49.6%) |
| Cleaning & Maintenance | 185 (62.3%) | 112 (37.7%) |
| Personal Care & Service | 73 (27.1%) | 196 (72.9%) |
| Total (Category) | 565 (49.3%) | 582 (50.7%) |
| Total (Overall) | 6,655 (54.9%) | 5,470 (45.1%) |
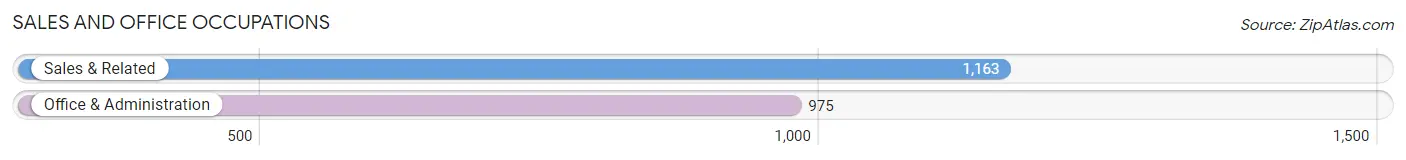
Sales and Office Occupations
The most common Sales and Office occupations in Solon are Sales & Related (1,163 | 9.6%), and Office & Administration (975 | 8.0%).
Sales and Office Occupations by Sex
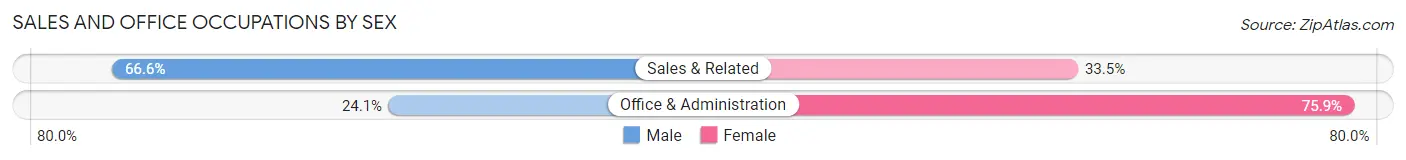
| Occupation | Male | Female |
| Sales & Related | 774 (66.5%) | 389 (33.5%) |
| Office & Administration | 235 (24.1%) | 740 (75.9%) |
| Total (Category) | 1,009 (47.2%) | 1,129 (52.8%) |
| Total (Overall) | 6,655 (54.9%) | 5,470 (45.1%) |
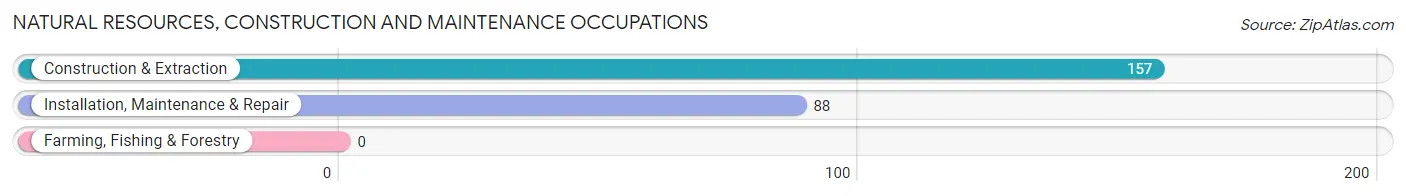
Natural Resources, Construction and Maintenance Occupations
The most common Natural Resources, Construction and Maintenance occupations in Solon are Construction & Extraction (157 | 1.3%), and Installation, Maintenance & Repair (88 | 0.7%).
Natural Resources, Construction and Maintenance Occupations by Sex
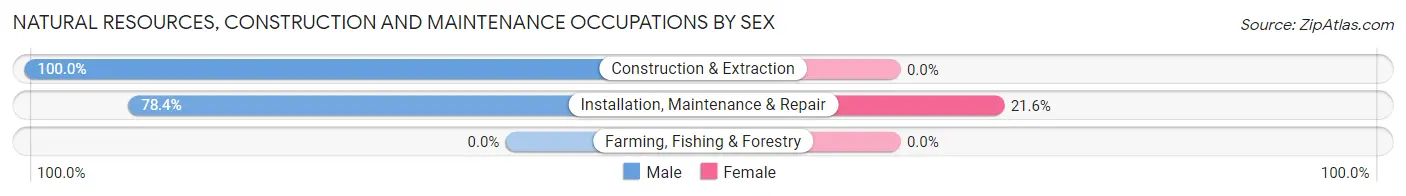
| Occupation | Male | Female |
| Farming, Fishing & Forestry | 0 (0.0%) | 0 (0.0%) |
| Construction & Extraction | 157 (100.0%) | 0 (0.0%) |
| Installation, Maintenance & Repair | 69 (78.4%) | 19 (21.6%) |
| Total (Category) | 226 (92.2%) | 19 (7.8%) |
| Total (Overall) | 6,655 (54.9%) | 5,470 (45.1%) |
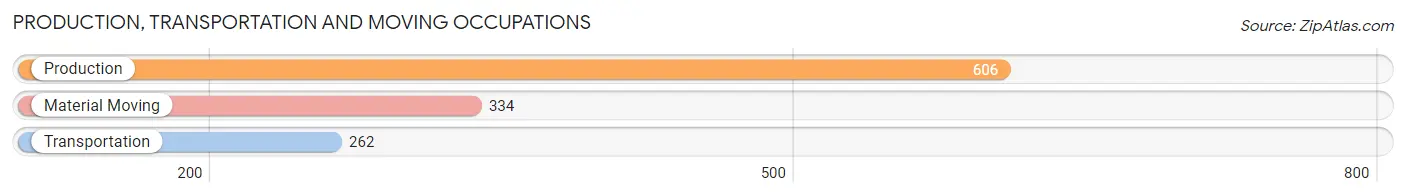
Production, Transportation and Moving Occupations
The most common Production, Transportation and Moving occupations in Solon are Production (606 | 5.0%), Material Moving (334 | 2.8%), and Transportation (262 | 2.2%).
Production, Transportation and Moving Occupations by Sex
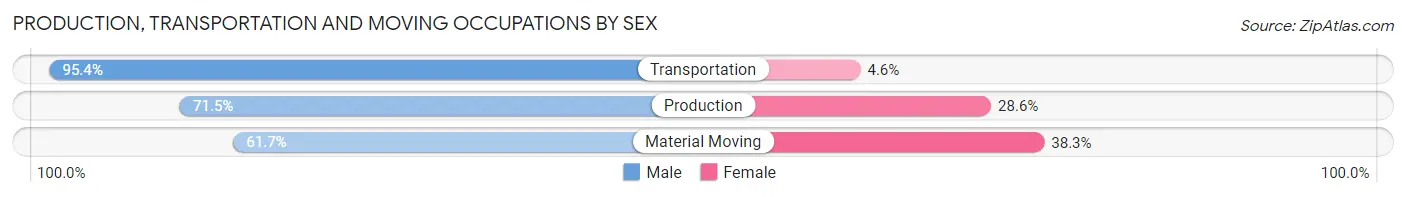
| Occupation | Male | Female |
| Production | 433 (71.5%) | 173 (28.5%) |
| Transportation | 250 (95.4%) | 12 (4.6%) |
| Material Moving | 206 (61.7%) | 128 (38.3%) |
| Total (Category) | 889 (74.0%) | 313 (26.0%) |
| Total (Overall) | 6,655 (54.9%) | 5,470 (45.1%) |
Employment Industries by Sex in Solon
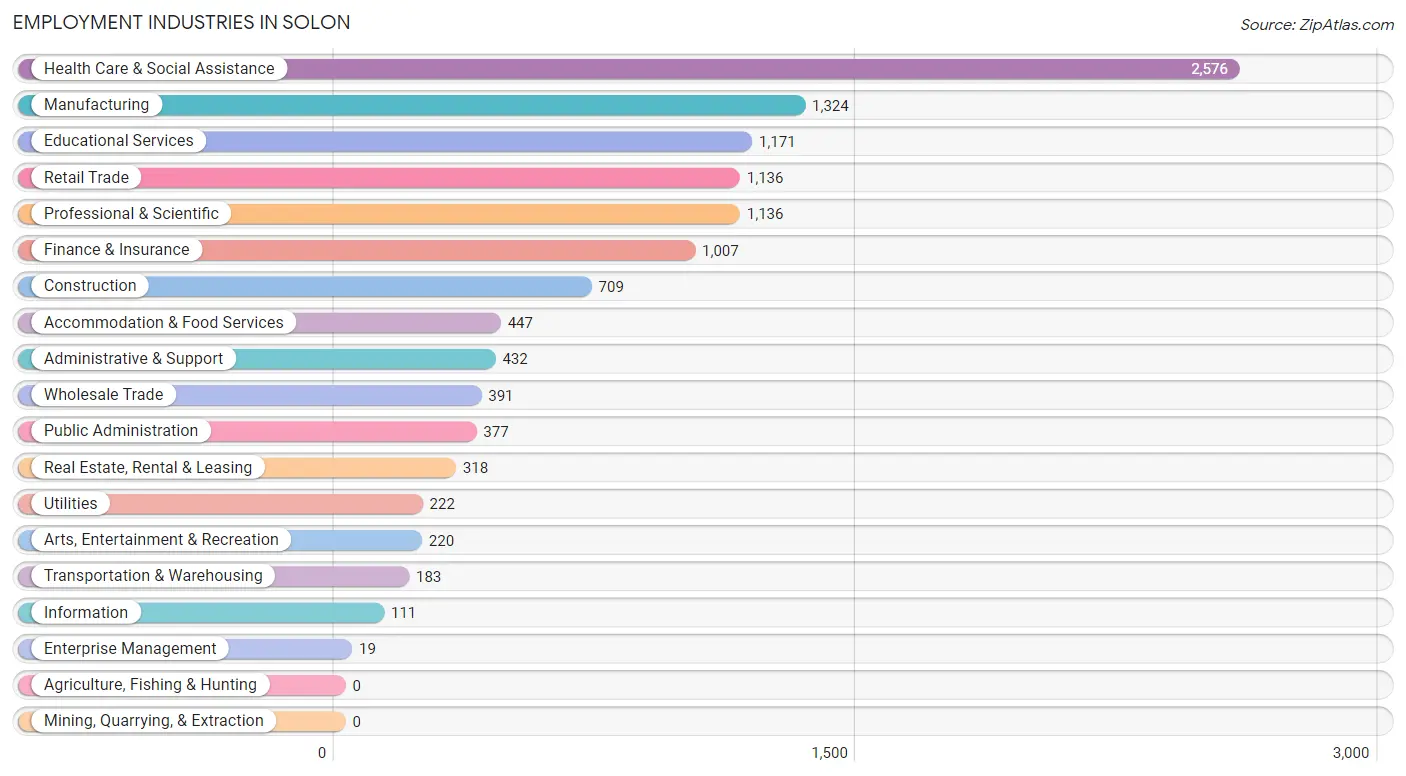
Employment Industries in Solon
The major employment industries in Solon include Health Care & Social Assistance (2,576 | 21.2%), Manufacturing (1,324 | 10.9%), Educational Services (1,171 | 9.7%), Retail Trade (1,136 | 9.4%), and Professional & Scientific (1,136 | 9.4%).
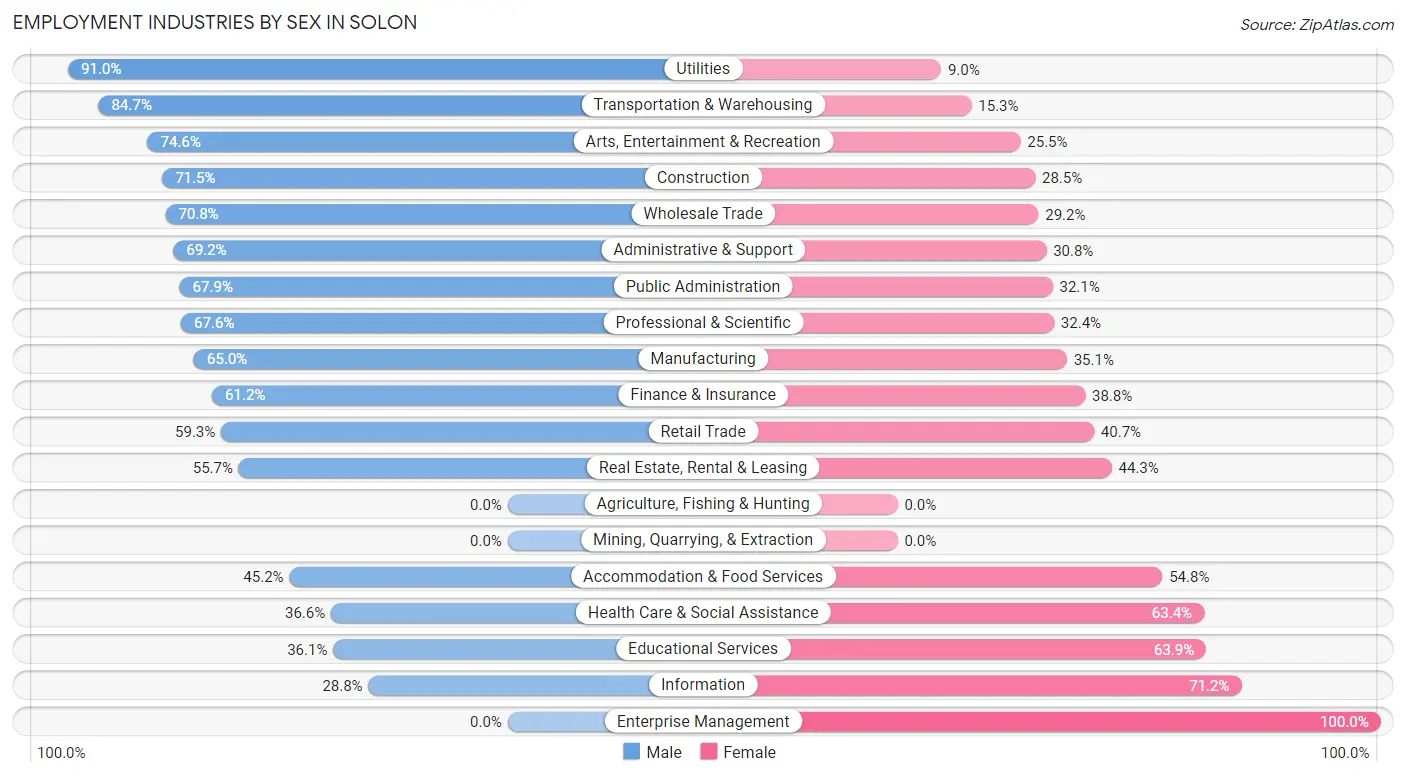
Employment Industries by Sex in Solon
The Solon industries that see more men than women are Utilities (91.0%), Transportation & Warehousing (84.7%), and Arts, Entertainment & Recreation (74.6%), whereas the industries that tend to have a higher number of women are Enterprise Management (100.0%), Information (71.2%), and Educational Services (63.9%).
| Industry | Male | Female |
| Agriculture, Fishing & Hunting | 0 (0.0%) | 0 (0.0%) |
| Mining, Quarrying, & Extraction | 0 (0.0%) | 0 (0.0%) |
| Construction | 507 (71.5%) | 202 (28.5%) |
| Manufacturing | 860 (64.9%) | 464 (35.0%) |
| Wholesale Trade | 277 (70.8%) | 114 (29.2%) |
| Retail Trade | 674 (59.3%) | 462 (40.7%) |
| Transportation & Warehousing | 155 (84.7%) | 28 (15.3%) |
| Utilities | 202 (91.0%) | 20 (9.0%) |
| Information | 32 (28.8%) | 79 (71.2%) |
| Finance & Insurance | 616 (61.2%) | 391 (38.8%) |
| Real Estate, Rental & Leasing | 177 (55.7%) | 141 (44.3%) |
| Professional & Scientific | 768 (67.6%) | 368 (32.4%) |
| Enterprise Management | 0 (0.0%) | 19 (100.0%) |
| Administrative & Support | 299 (69.2%) | 133 (30.8%) |
| Educational Services | 423 (36.1%) | 748 (63.9%) |
| Health Care & Social Assistance | 942 (36.6%) | 1,634 (63.4%) |
| Arts, Entertainment & Recreation | 164 (74.6%) | 56 (25.5%) |
| Accommodation & Food Services | 202 (45.2%) | 245 (54.8%) |
| Public Administration | 256 (67.9%) | 121 (32.1%) |
| Total | 6,655 (54.9%) | 5,470 (45.1%) |
Education in Solon
School Enrollment in Solon
The most common levels of schooling among the 6,650 students in Solon are middle school (1,606 | 24.1%), high school (1,541 | 23.2%), and elementary school (1,485 | 22.3%).
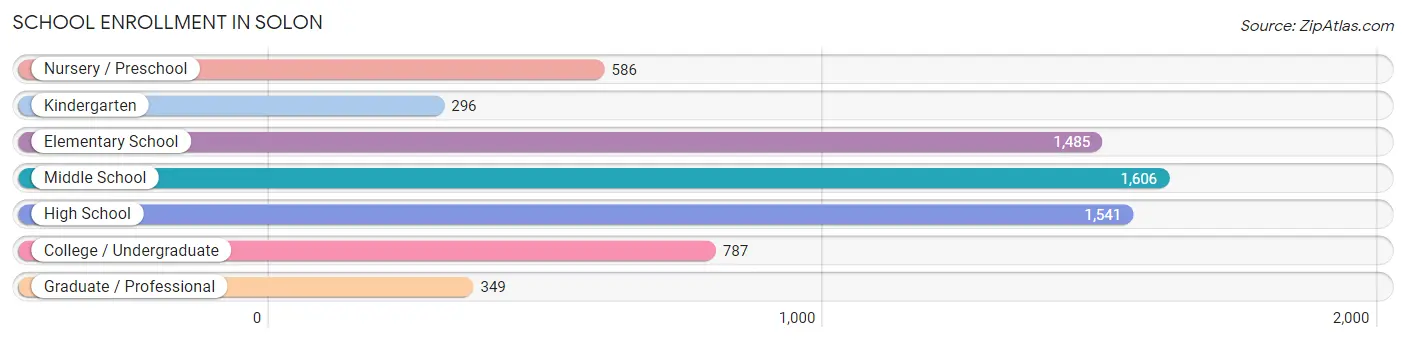
| School Level | # Students | % Students |
| Nursery / Preschool | 586 | 8.8% |
| Kindergarten | 296 | 4.4% |
| Elementary School | 1,485 | 22.3% |
| Middle School | 1,606 | 24.1% |
| High School | 1,541 | 23.2% |
| College / Undergraduate | 787 | 11.8% |
| Graduate / Professional | 349 | 5.2% |
| Total | 6,650 | 100.0% |
School Enrollment by Age by Funding Source in Solon
Out of a total of 6,650 students who are enrolled in schools in Solon, 951 (14.3%) attend a private institution, while the remaining 5,699 (85.7%) are enrolled in public schools. The age group of 3 to 4 year olds has the highest likelihood of being enrolled in private schools, with 198 (34.9% in the age bracket) enrolled. Conversely, the age group of 5 to 9 year old has the lowest likelihood of being enrolled in a private school, with 1,413 (93.8% in the age bracket) attending a public institution.
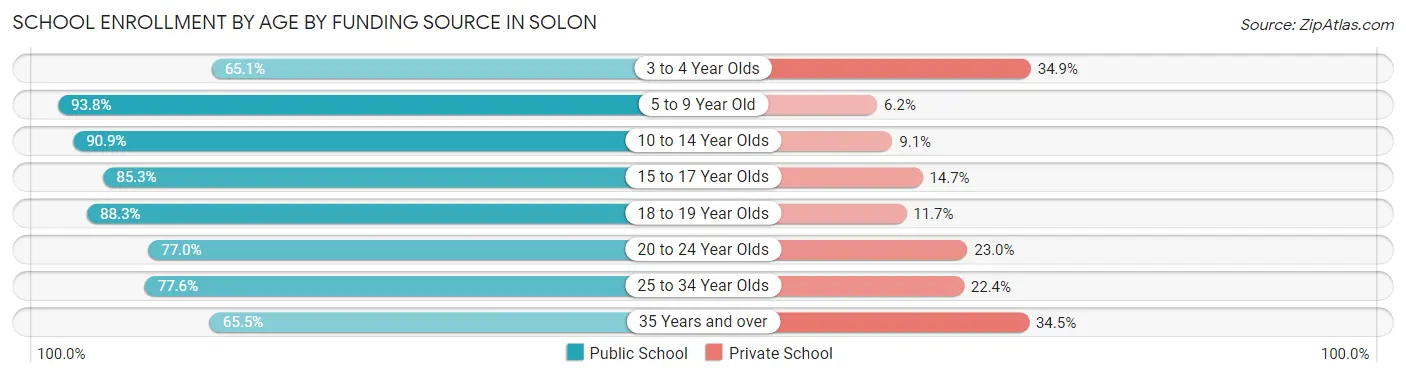
| Age Bracket | Public School | Private School |
| 3 to 4 Year Olds | 370 (65.1%) | 198 (34.9%) |
| 5 to 9 Year Old | 1,413 (93.8%) | 94 (6.2%) |
| 10 to 14 Year Olds | 1,906 (90.9%) | 190 (9.1%) |
| 15 to 17 Year Olds | 1,006 (85.3%) | 173 (14.7%) |
| 18 to 19 Year Olds | 288 (88.3%) | 38 (11.7%) |
| 20 to 24 Year Olds | 334 (77.0%) | 100 (23.0%) |
| 25 to 34 Year Olds | 201 (77.6%) | 58 (22.4%) |
| 35 Years and over | 184 (65.5%) | 97 (34.5%) |
| Total | 5,699 (85.7%) | 951 (14.3%) |
Educational Attainment by Field of Study in Solon
Business (1,974 | 17.9%), education (1,362 | 12.4%), science & technology (1,052 | 9.6%), engineering (933 | 8.5%), and social sciences (891 | 8.1%) are the most common fields of study among 11,001 individuals in Solon who have obtained a bachelor's degree or higher.
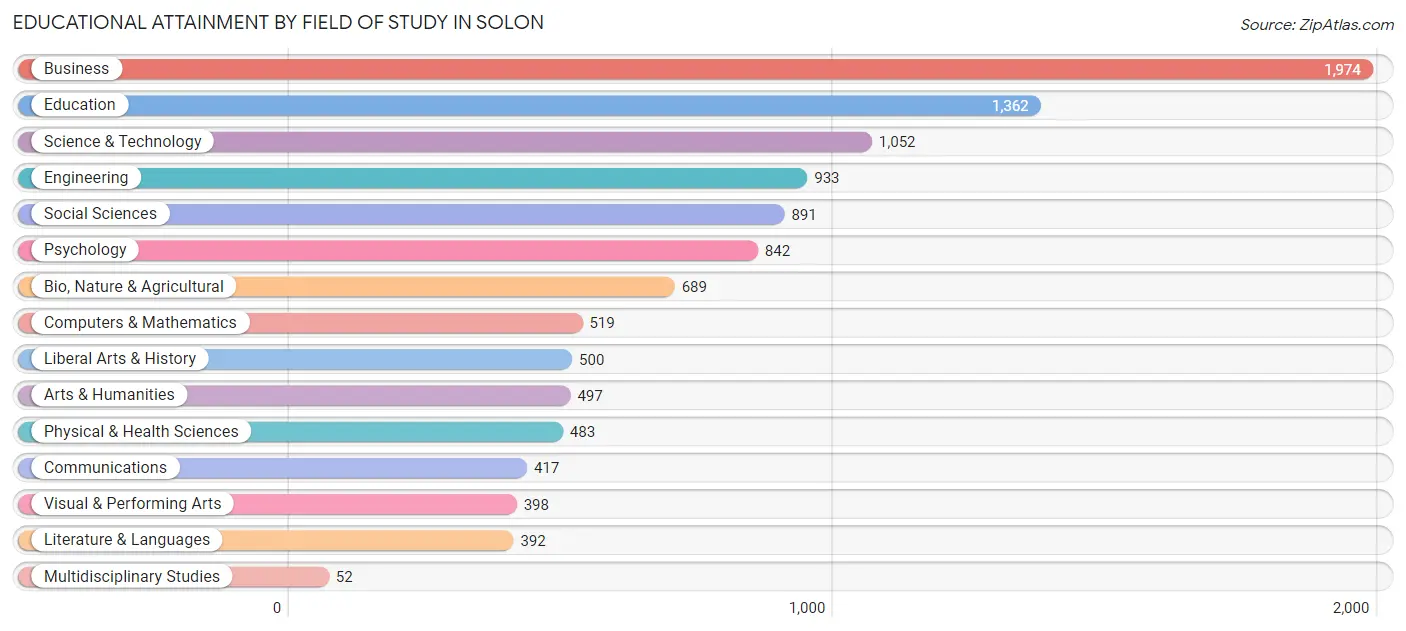
| Field of Study | # Graduates | % Graduates |
| Computers & Mathematics | 519 | 4.7% |
| Bio, Nature & Agricultural | 689 | 6.3% |
| Physical & Health Sciences | 483 | 4.4% |
| Psychology | 842 | 7.6% |
| Social Sciences | 891 | 8.1% |
| Engineering | 933 | 8.5% |
| Multidisciplinary Studies | 52 | 0.5% |
| Science & Technology | 1,052 | 9.6% |
| Business | 1,974 | 17.9% |
| Education | 1,362 | 12.4% |
| Literature & Languages | 392 | 3.6% |
| Liberal Arts & History | 500 | 4.5% |
| Visual & Performing Arts | 398 | 3.6% |
| Communications | 417 | 3.8% |
| Arts & Humanities | 497 | 4.5% |
| Total | 11,001 | 100.0% |
Transportation & Commute in Solon
Vehicle Availability by Sex in Solon
The most prevalent vehicle ownership categories in Solon are males with 2 vehicles (3,649, accounting for 55.0%) and females with 2 vehicles (2,810, making up 67.0%).
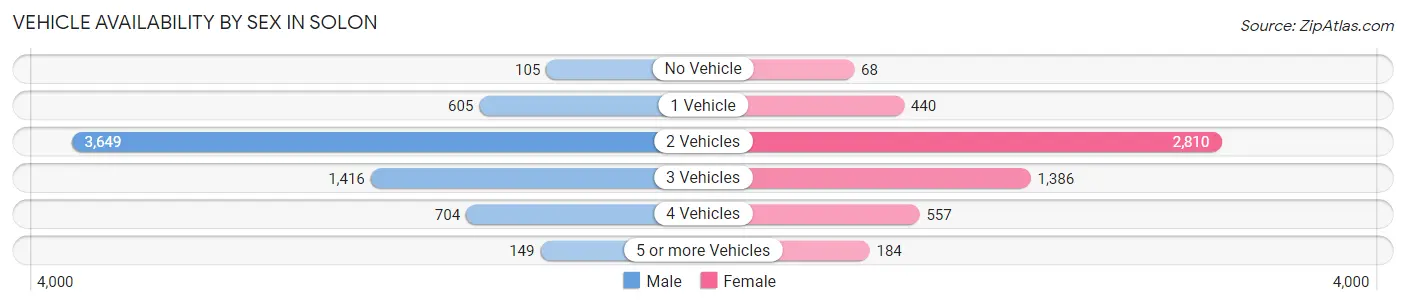
| Vehicles Available | Male | Female |
| No Vehicle | 105 (1.6%) | 68 (1.3%) |
| 1 Vehicle | 605 (9.1%) | 440 (8.1%) |
| 2 Vehicles | 3,649 (55.0%) | 2,810 (51.6%) |
| 3 Vehicles | 1,416 (21.4%) | 1,386 (25.5%) |
| 4 Vehicles | 704 (10.6%) | 557 (10.2%) |
| 5 or more Vehicles | 149 (2.2%) | 184 (3.4%) |
| Total | 6,628 (100.0%) | 5,445 (100.0%) |
Commute Time in Solon
The most frequently occuring commute durations in Solon are 30 to 34 minutes (2,184 commuters, 21.6%), 20 to 24 minutes (1,495 commuters, 14.8%), and 15 to 19 minutes (1,232 commuters, 12.2%).
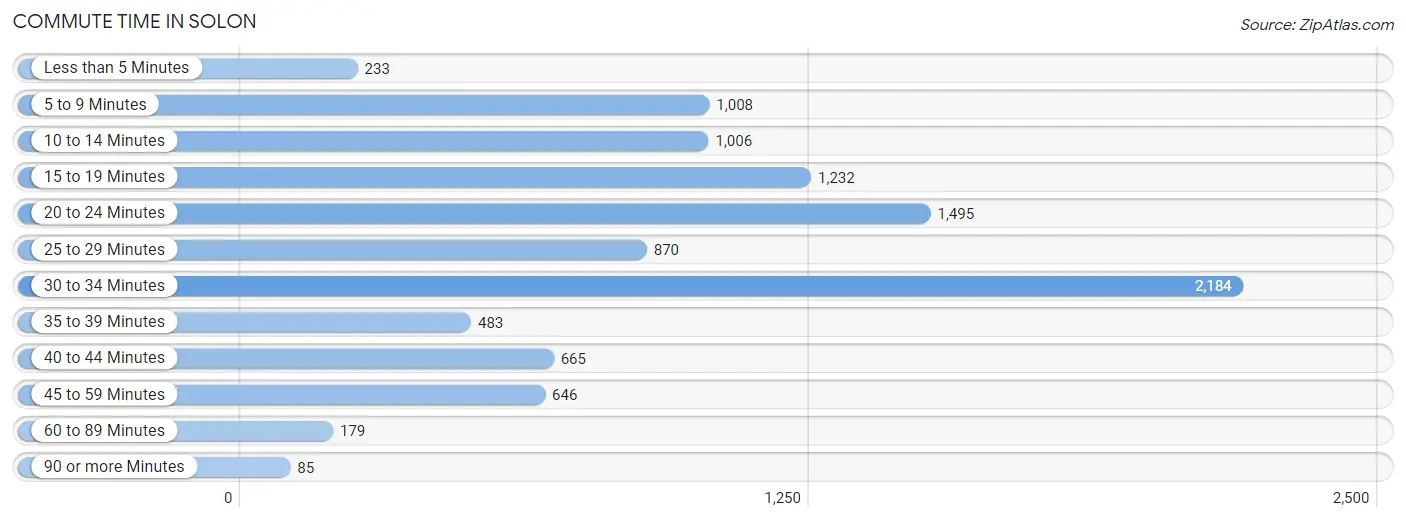
| Commute Time | # Commuters | % Commuters |
| Less than 5 Minutes | 233 | 2.3% |
| 5 to 9 Minutes | 1,008 | 10.0% |
| 10 to 14 Minutes | 1,006 | 10.0% |
| 15 to 19 Minutes | 1,232 | 12.2% |
| 20 to 24 Minutes | 1,495 | 14.8% |
| 25 to 29 Minutes | 870 | 8.6% |
| 30 to 34 Minutes | 2,184 | 21.6% |
| 35 to 39 Minutes | 483 | 4.8% |
| 40 to 44 Minutes | 665 | 6.6% |
| 45 to 59 Minutes | 646 | 6.4% |
| 60 to 89 Minutes | 179 | 1.8% |
| 90 or more Minutes | 85 | 0.8% |
Commute Time by Sex in Solon
The most common commute times in Solon are 30 to 34 minutes (1,208 commuters, 21.9%) for males and 30 to 34 minutes (976 commuters, 21.3%) for females.
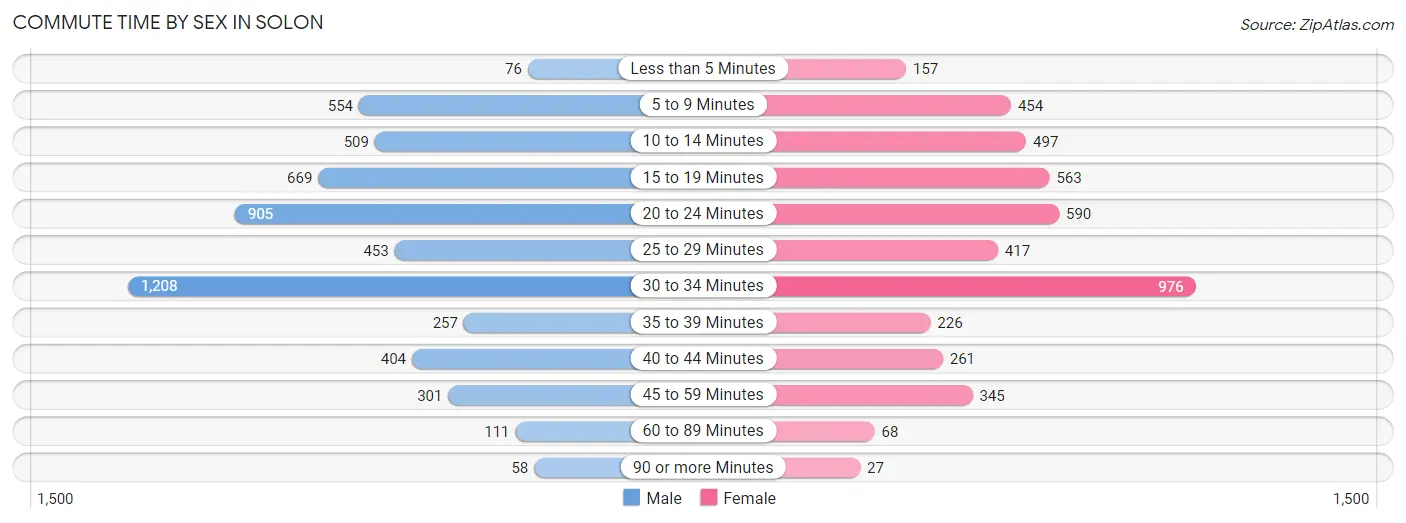
| Commute Time | Male | Female |
| Less than 5 Minutes | 76 (1.4%) | 157 (3.4%) |
| 5 to 9 Minutes | 554 (10.1%) | 454 (9.9%) |
| 10 to 14 Minutes | 509 (9.2%) | 497 (10.8%) |
| 15 to 19 Minutes | 669 (12.1%) | 563 (12.3%) |
| 20 to 24 Minutes | 905 (16.4%) | 590 (12.9%) |
| 25 to 29 Minutes | 453 (8.2%) | 417 (9.1%) |
| 30 to 34 Minutes | 1,208 (21.9%) | 976 (21.3%) |
| 35 to 39 Minutes | 257 (4.7%) | 226 (4.9%) |
| 40 to 44 Minutes | 404 (7.3%) | 261 (5.7%) |
| 45 to 59 Minutes | 301 (5.5%) | 345 (7.5%) |
| 60 to 89 Minutes | 111 (2.0%) | 68 (1.5%) |
| 90 or more Minutes | 58 (1.1%) | 27 (0.6%) |
Time of Departure to Work by Sex in Solon
The most frequent times of departure to work in Solon are 8:00 AM to 8:29 AM (1,117, 20.3%) for males and 7:30 AM to 7:59 AM (806, 17.6%) for females.
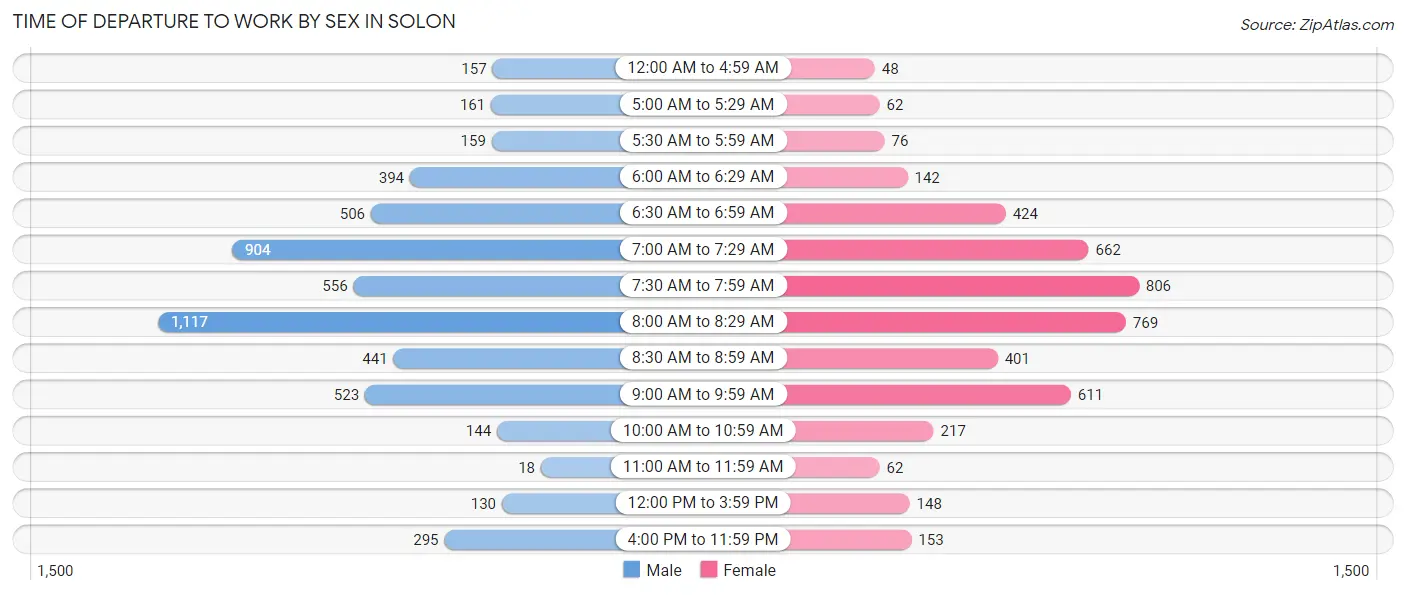
| Time of Departure | Male | Female |
| 12:00 AM to 4:59 AM | 157 (2.9%) | 48 (1.1%) |
| 5:00 AM to 5:29 AM | 161 (2.9%) | 62 (1.3%) |
| 5:30 AM to 5:59 AM | 159 (2.9%) | 76 (1.7%) |
| 6:00 AM to 6:29 AM | 394 (7.2%) | 142 (3.1%) |
| 6:30 AM to 6:59 AM | 506 (9.2%) | 424 (9.3%) |
| 7:00 AM to 7:29 AM | 904 (16.4%) | 662 (14.4%) |
| 7:30 AM to 7:59 AM | 556 (10.1%) | 806 (17.6%) |
| 8:00 AM to 8:29 AM | 1,117 (20.3%) | 769 (16.8%) |
| 8:30 AM to 8:59 AM | 441 (8.0%) | 401 (8.7%) |
| 9:00 AM to 9:59 AM | 523 (9.5%) | 611 (13.3%) |
| 10:00 AM to 10:59 AM | 144 (2.6%) | 217 (4.7%) |
| 11:00 AM to 11:59 AM | 18 (0.3%) | 62 (1.3%) |
| 12:00 PM to 3:59 PM | 130 (2.4%) | 148 (3.2%) |
| 4:00 PM to 11:59 PM | 295 (5.4%) | 153 (3.3%) |
| Total | 5,505 (100.0%) | 4,581 (100.0%) |
Housing Occupancy in Solon
Occupancy by Ownership in Solon
Of the total 8,773 dwellings in Solon, owner-occupied units account for 7,457 (85.0%), while renter-occupied units make up 1,316 (15.0%).
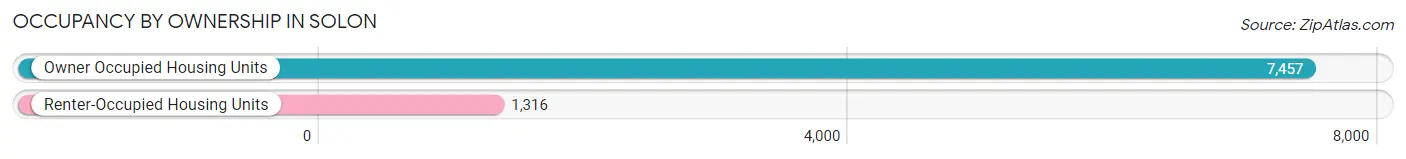
| Occupancy | # Housing Units | % Housing Units |
| Owner Occupied Housing Units | 7,457 | 85.0% |
| Renter-Occupied Housing Units | 1,316 | 15.0% |
| Total Occupied Housing Units | 8,773 | 100.0% |
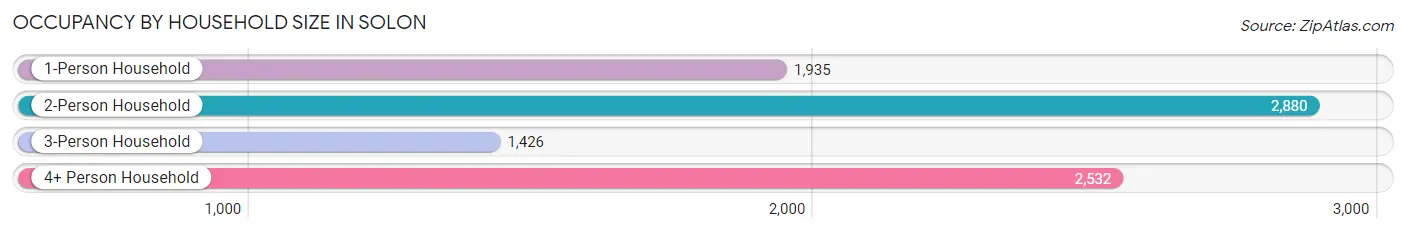
Occupancy by Household Size in Solon
| Household Size | # Housing Units | % Housing Units |
| 1-Person Household | 1,935 | 22.1% |
| 2-Person Household | 2,880 | 32.8% |
| 3-Person Household | 1,426 | 16.3% |
| 4+ Person Household | 2,532 | 28.9% |
| Total Housing Units | 8,773 | 100.0% |
Occupancy by Ownership by Household Size in Solon
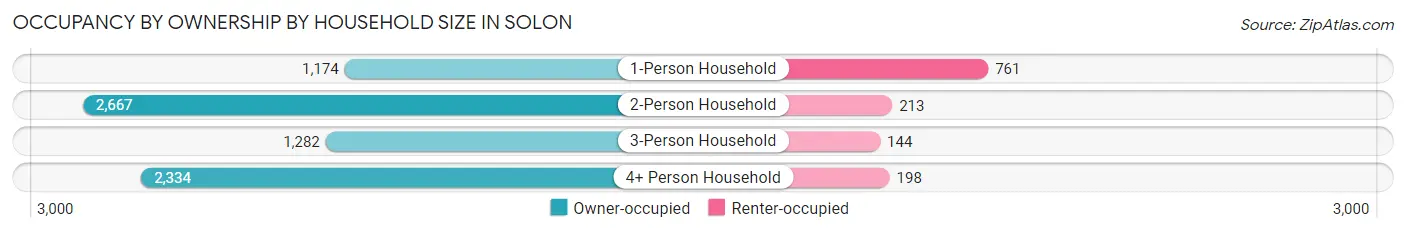
| Household Size | Owner-occupied | Renter-occupied |
| 1-Person Household | 1,174 (60.7%) | 761 (39.3%) |
| 2-Person Household | 2,667 (92.6%) | 213 (7.4%) |
| 3-Person Household | 1,282 (89.9%) | 144 (10.1%) |
| 4+ Person Household | 2,334 (92.2%) | 198 (7.8%) |
| Total Housing Units | 7,457 (85.0%) | 1,316 (15.0%) |
Occupancy by Educational Attainment in Solon
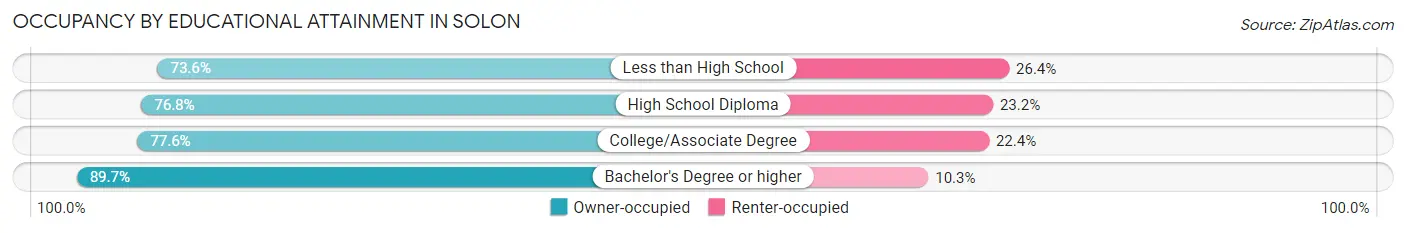
| Household Size | Owner-occupied | Renter-occupied |
| Less than High School | 324 (73.6%) | 116 (26.4%) |
| High School Diploma | 919 (76.8%) | 277 (23.2%) |
| College/Associate Degree | 1,194 (77.6%) | 344 (22.4%) |
| Bachelor's Degree or higher | 5,020 (89.7%) | 579 (10.3%) |
Occupancy by Age of Householder in Solon
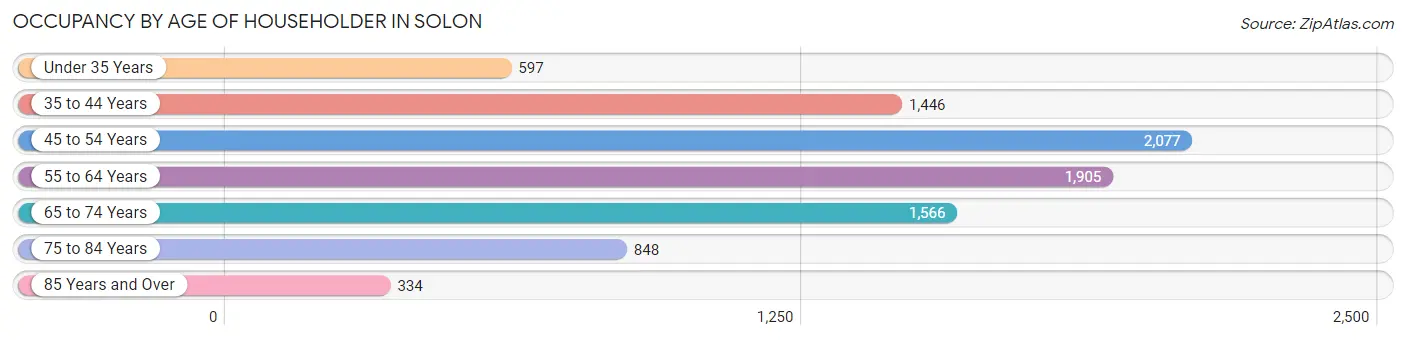
| Age Bracket | # Households | % Households |
| Under 35 Years | 597 | 6.8% |
| 35 to 44 Years | 1,446 | 16.5% |
| 45 to 54 Years | 2,077 | 23.7% |
| 55 to 64 Years | 1,905 | 21.7% |
| 65 to 74 Years | 1,566 | 17.8% |
| 75 to 84 Years | 848 | 9.7% |
| 85 Years and Over | 334 | 3.8% |
| Total | 8,773 | 100.0% |
Housing Finances in Solon
Median Income by Occupancy in Solon
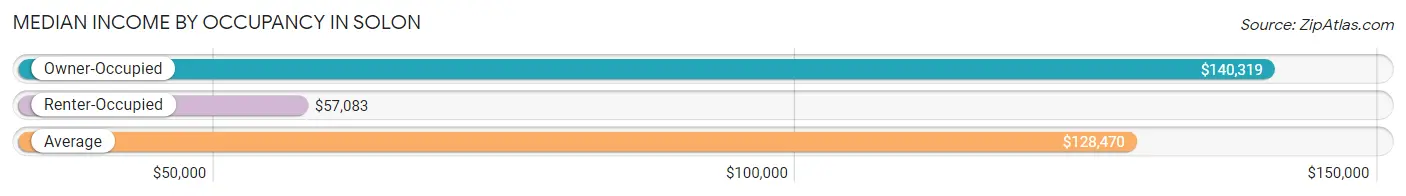
| Occupancy Type | # Households | Median Income |
| Owner-Occupied | 7,457 (85.0%) | $140,319 |
| Renter-Occupied | 1,316 (15.0%) | $57,083 |
| Average | 8,773 (100.0%) | $128,470 |
Occupancy by Householder Income Bracket in Solon
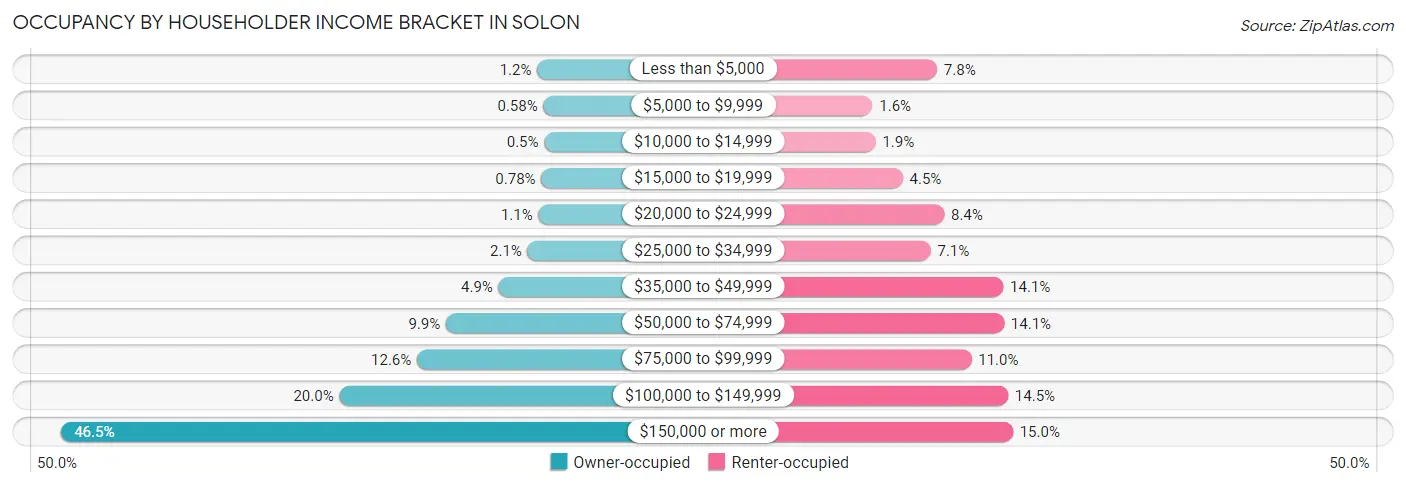
| Income Bracket | Owner-occupied | Renter-occupied |
| Less than $5,000 | 87 (1.2%) | 102 (7.7%) |
| $5,000 to $9,999 | 43 (0.6%) | 21 (1.6%) |
| $10,000 to $14,999 | 37 (0.5%) | 25 (1.9%) |
| $15,000 to $19,999 | 58 (0.8%) | 59 (4.5%) |
| $20,000 to $24,999 | 78 (1.1%) | 111 (8.4%) |
| $25,000 to $34,999 | 156 (2.1%) | 94 (7.1%) |
| $35,000 to $49,999 | 362 (4.9%) | 185 (14.1%) |
| $50,000 to $74,999 | 735 (9.9%) | 186 (14.1%) |
| $75,000 to $99,999 | 941 (12.6%) | 145 (11.0%) |
| $100,000 to $149,999 | 1,492 (20.0%) | 191 (14.5%) |
| $150,000 or more | 3,468 (46.5%) | 197 (15.0%) |
| Total | 7,457 (100.0%) | 1,316 (100.0%) |
Monthly Housing Cost Tiers in Solon
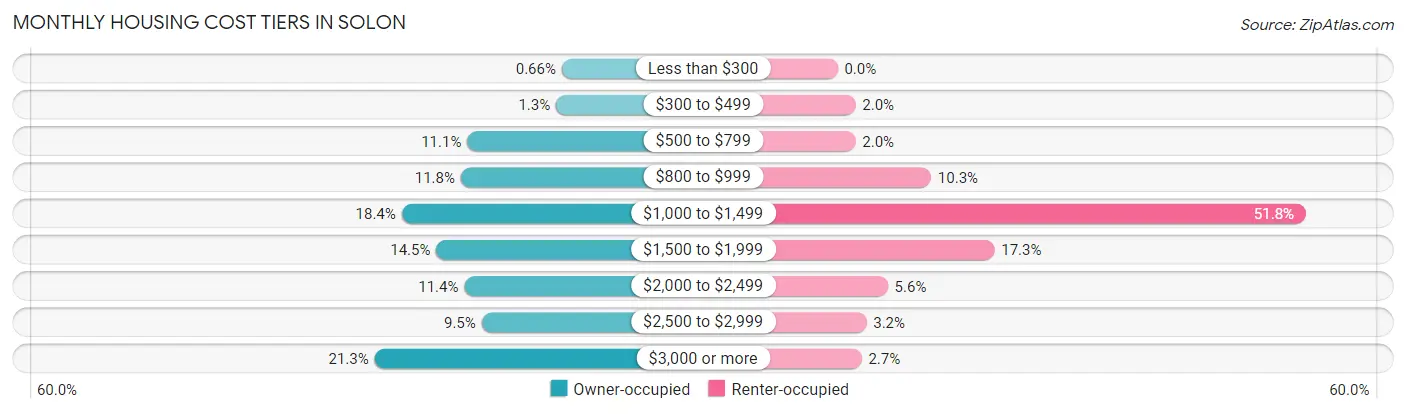
| Monthly Cost | Owner-occupied | Renter-occupied |
| Less than $300 | 49 (0.7%) | 0 (0.0%) |
| $300 to $499 | 96 (1.3%) | 26 (2.0%) |
| $500 to $799 | 828 (11.1%) | 26 (2.0%) |
| $800 to $999 | 881 (11.8%) | 136 (10.3%) |
| $1,000 to $1,499 | 1,368 (18.3%) | 681 (51.7%) |
| $1,500 to $1,999 | 1,083 (14.5%) | 228 (17.3%) |
| $2,000 to $2,499 | 852 (11.4%) | 73 (5.6%) |
| $2,500 to $2,999 | 709 (9.5%) | 42 (3.2%) |
| $3,000 or more | 1,591 (21.3%) | 35 (2.7%) |
| Total | 7,457 (100.0%) | 1,316 (100.0%) |
Physical Housing Characteristics in Solon
Housing Structures in Solon
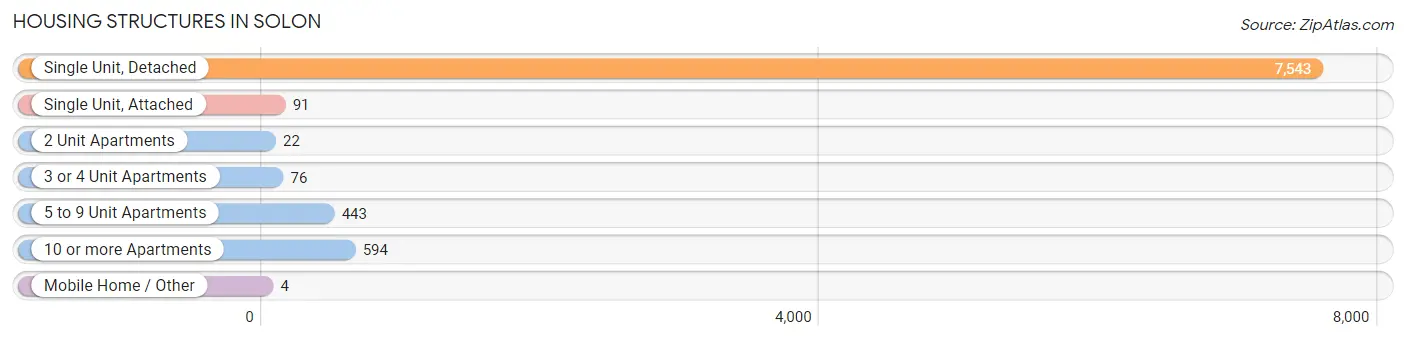
| Structure Type | # Housing Units | % Housing Units |
| Single Unit, Detached | 7,543 | 86.0% |
| Single Unit, Attached | 91 | 1.0% |
| 2 Unit Apartments | 22 | 0.3% |
| 3 or 4 Unit Apartments | 76 | 0.9% |
| 5 to 9 Unit Apartments | 443 | 5.1% |
| 10 or more Apartments | 594 | 6.8% |
| Mobile Home / Other | 4 | 0.1% |
| Total | 8,773 | 100.0% |
Housing Structures by Occupancy in Solon
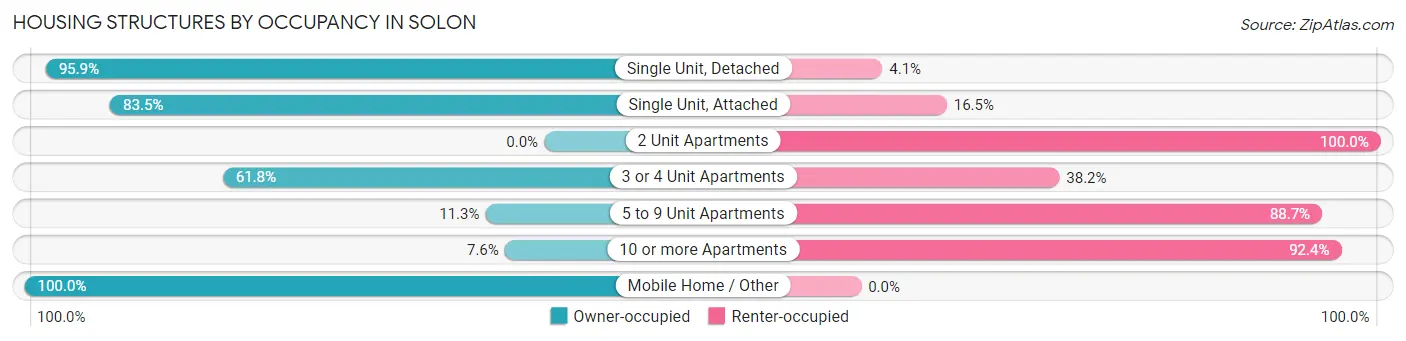
| Structure Type | Owner-occupied | Renter-occupied |
| Single Unit, Detached | 7,235 (95.9%) | 308 (4.1%) |
| Single Unit, Attached | 76 (83.5%) | 15 (16.5%) |
| 2 Unit Apartments | 0 (0.0%) | 22 (100.0%) |
| 3 or 4 Unit Apartments | 47 (61.8%) | 29 (38.2%) |
| 5 to 9 Unit Apartments | 50 (11.3%) | 393 (88.7%) |
| 10 or more Apartments | 45 (7.6%) | 549 (92.4%) |
| Mobile Home / Other | 4 (100.0%) | 0 (0.0%) |
| Total | 7,457 (85.0%) | 1,316 (15.0%) |
Housing Structures by Number of Rooms in Solon
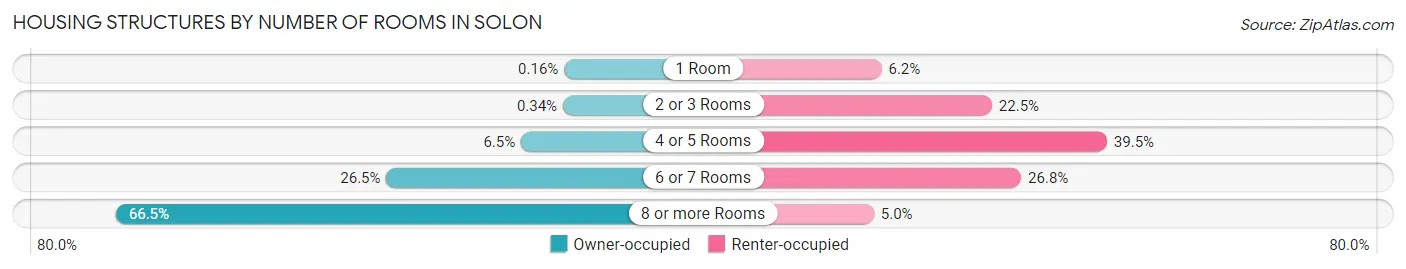
| Number of Rooms | Owner-occupied | Renter-occupied |
| 1 Room | 12 (0.2%) | 81 (6.2%) |
| 2 or 3 Rooms | 25 (0.3%) | 296 (22.5%) |
| 4 or 5 Rooms | 488 (6.5%) | 520 (39.5%) |
| 6 or 7 Rooms | 1,974 (26.5%) | 353 (26.8%) |
| 8 or more Rooms | 4,958 (66.5%) | 66 (5.0%) |
| Total | 7,457 (100.0%) | 1,316 (100.0%) |
Housing Structure by Heating Type in Solon
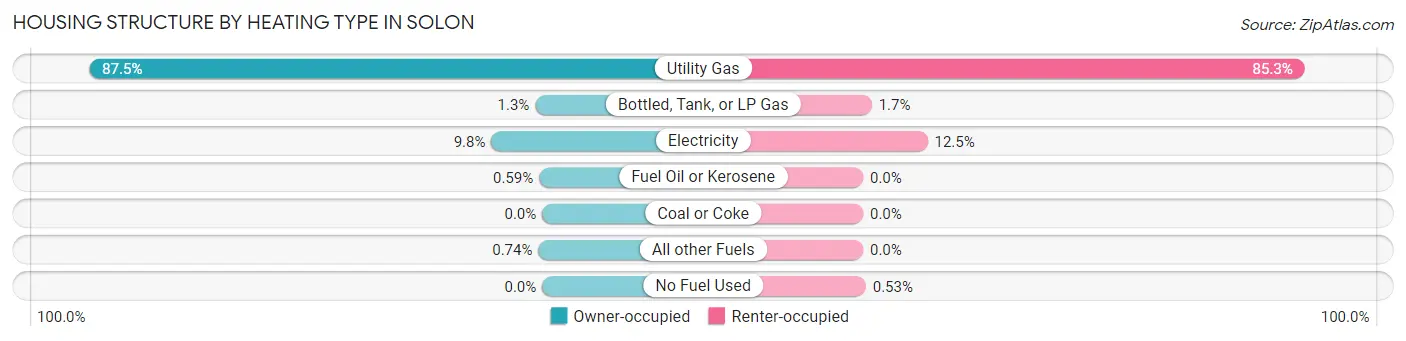
| Heating Type | Owner-occupied | Renter-occupied |
| Utility Gas | 6,527 (87.5%) | 1,123 (85.3%) |
| Bottled, Tank, or LP Gas | 99 (1.3%) | 22 (1.7%) |
| Electricity | 732 (9.8%) | 164 (12.5%) |
| Fuel Oil or Kerosene | 44 (0.6%) | 0 (0.0%) |
| Coal or Coke | 0 (0.0%) | 0 (0.0%) |
| All other Fuels | 55 (0.7%) | 0 (0.0%) |
| No Fuel Used | 0 (0.0%) | 7 (0.5%) |
| Total | 7,457 (100.0%) | 1,316 (100.0%) |
Household Vehicle Usage in Solon
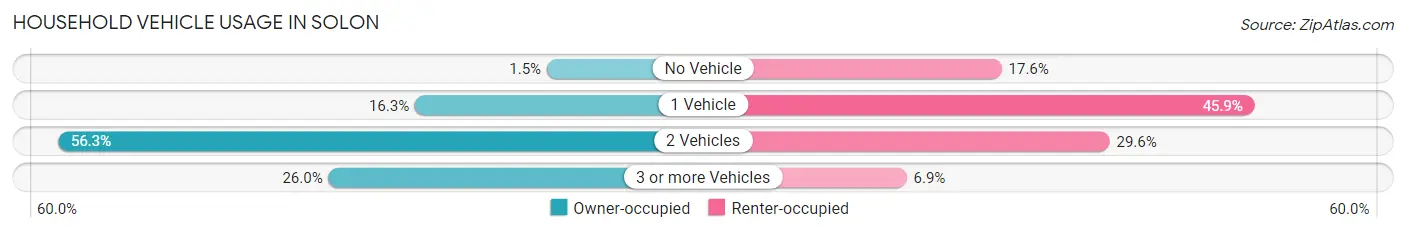
| Vehicles per Household | Owner-occupied | Renter-occupied |
| No Vehicle | 111 (1.5%) | 231 (17.5%) |
| 1 Vehicle | 1,213 (16.3%) | 604 (45.9%) |
| 2 Vehicles | 4,197 (56.3%) | 390 (29.6%) |
| 3 or more Vehicles | 1,936 (26.0%) | 91 (6.9%) |
| Total | 7,457 (100.0%) | 1,316 (100.0%) |
Real Estate & Mortgages in Solon
Real Estate and Mortgage Overview in Solon
| Characteristic | Without Mortgage | With Mortgage |
| Housing Units | 2,824 | 4,633 |
| Median Property Value | $346,600 | $381,600 |
| Median Household Income | $108,516 | $2,418 |
| Monthly Housing Costs | $923 | $1,563 |
| Real Estate Taxes | $7,071 | $76 |
Property Value by Mortgage Status in Solon
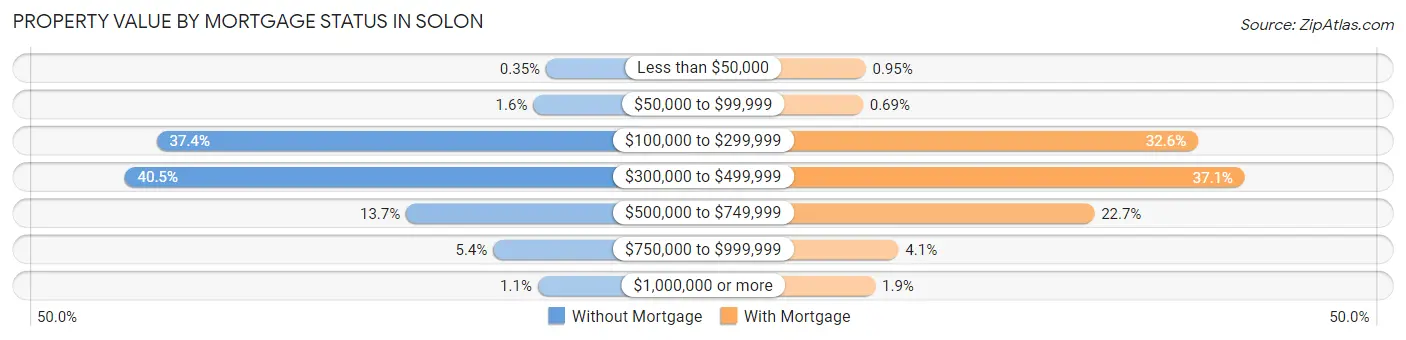
| Property Value | Without Mortgage | With Mortgage |
| Less than $50,000 | 10 (0.4%) | 44 (0.9%) |
| $50,000 to $99,999 | 44 (1.6%) | 32 (0.7%) |
| $100,000 to $299,999 | 1,057 (37.4%) | 1,511 (32.6%) |
| $300,000 to $499,999 | 1,143 (40.5%) | 1,718 (37.1%) |
| $500,000 to $749,999 | 386 (13.7%) | 1,053 (22.7%) |
| $750,000 to $999,999 | 152 (5.4%) | 189 (4.1%) |
| $1,000,000 or more | 32 (1.1%) | 86 (1.9%) |
| Total | 2,824 (100.0%) | 4,633 (100.0%) |
Household Income by Mortgage Status in Solon
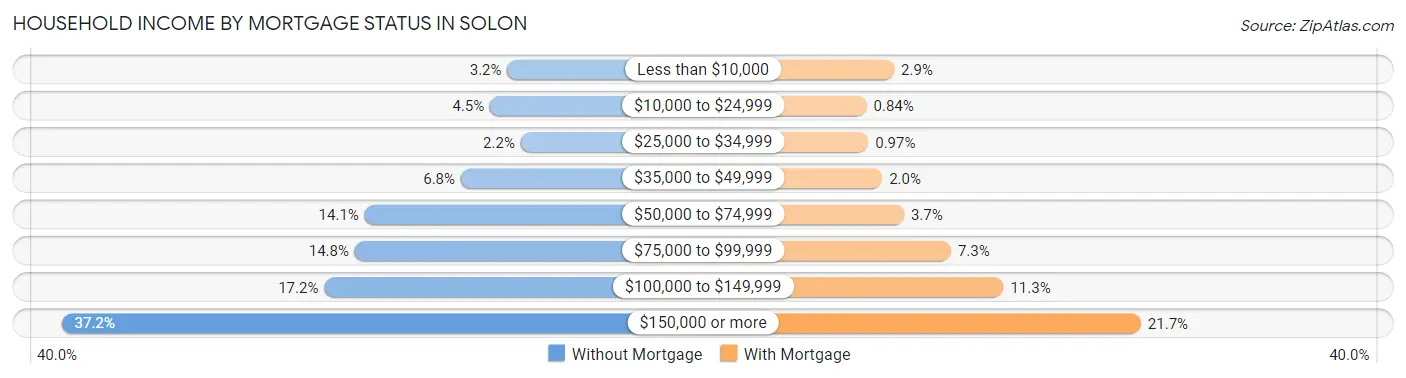
| Household Income | Without Mortgage | With Mortgage |
| Less than $10,000 | 91 (3.2%) | 136 (2.9%) |
| $10,000 to $24,999 | 128 (4.5%) | 39 (0.8%) |
| $25,000 to $34,999 | 62 (2.2%) | 45 (1.0%) |
| $35,000 to $49,999 | 191 (6.8%) | 94 (2.0%) |
| $50,000 to $74,999 | 398 (14.1%) | 171 (3.7%) |
| $75,000 to $99,999 | 419 (14.8%) | 337 (7.3%) |
| $100,000 to $149,999 | 485 (17.2%) | 522 (11.3%) |
| $150,000 or more | 1,050 (37.2%) | 1,007 (21.7%) |
| Total | 2,824 (100.0%) | 4,633 (100.0%) |
Property Value to Household Income Ratio in Solon
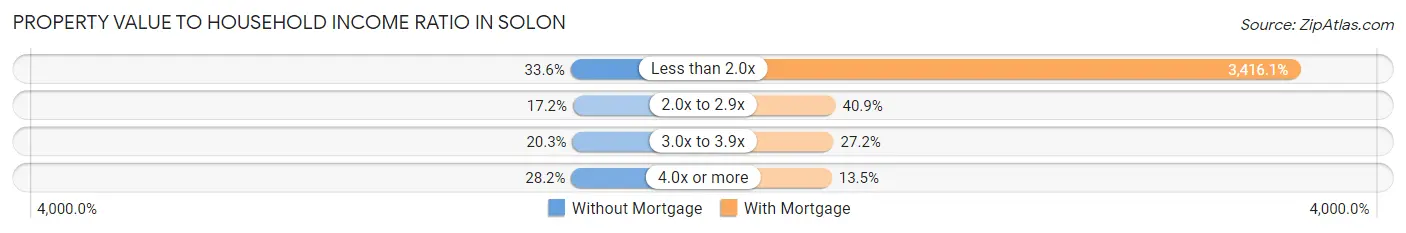
| Value-to-Income Ratio | Without Mortgage | With Mortgage |
| Less than 2.0x | 950 (33.6%) | 158,268 (3,416.1%) |
| 2.0x to 2.9x | 485 (17.2%) | 1,894 (40.9%) |
| 3.0x to 3.9x | 572 (20.3%) | 1,260 (27.2%) |
| 4.0x or more | 795 (28.1%) | 623 (13.5%) |
| Total | 2,824 (100.0%) | 4,633 (100.0%) |
Real Estate Taxes by Mortgage Status in Solon
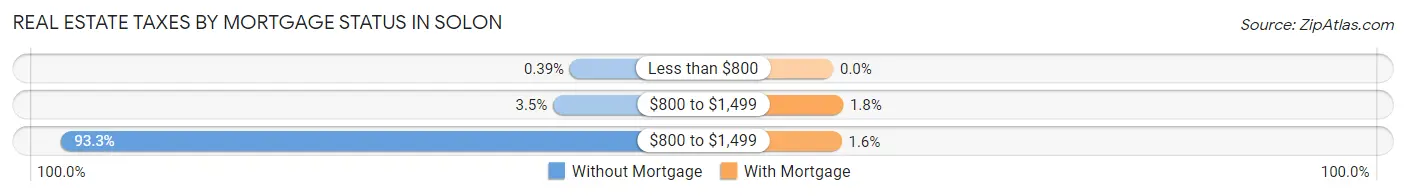
| Property Taxes | Without Mortgage | With Mortgage |
| Less than $800 | 11 (0.4%) | 0 (0.0%) |
| $800 to $1,499 | 98 (3.5%) | 84 (1.8%) |
| $800 to $1,499 | 2,634 (93.3%) | 72 (1.5%) |
| Total | 2,824 (100.0%) | 4,633 (100.0%) |
Health & Disability in Solon
Health Insurance Coverage by Age in Solon
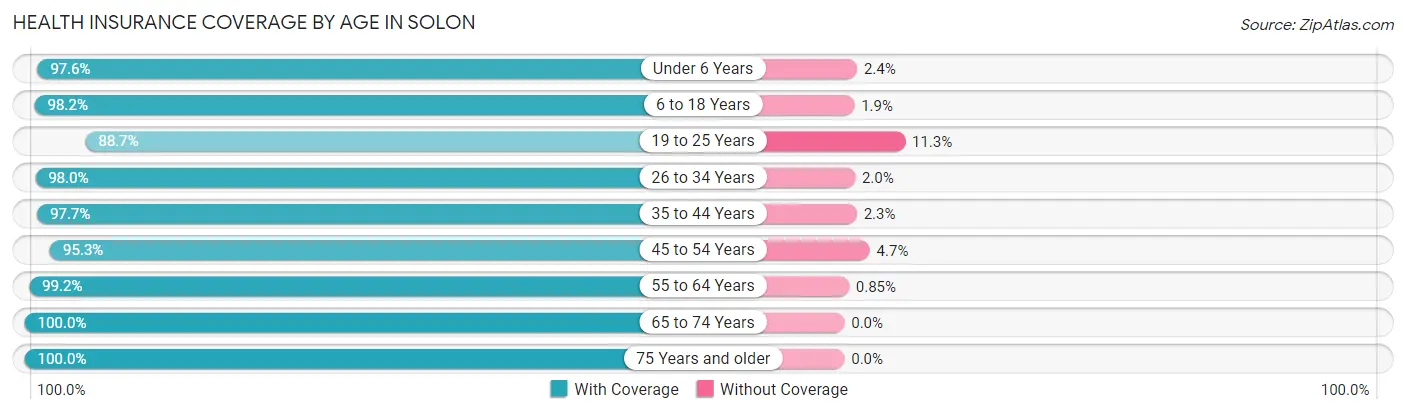
| Age Bracket | With Coverage | Without Coverage |
| Under 6 Years | 1,529 (97.6%) | 37 (2.4%) |
| 6 to 18 Years | 4,733 (98.2%) | 89 (1.8%) |
| 19 to 25 Years | 1,026 (88.7%) | 131 (11.3%) |
| 26 to 34 Years | 1,135 (98.0%) | 23 (2.0%) |
| 35 to 44 Years | 3,204 (97.7%) | 76 (2.3%) |
| 45 to 54 Years | 3,482 (95.3%) | 173 (4.7%) |
| 55 to 64 Years | 3,602 (99.2%) | 31 (0.9%) |
| 65 to 74 Years | 2,855 (100.0%) | 0 (0.0%) |
| 75 Years and older | 1,816 (100.0%) | 0 (0.0%) |
| Total | 23,382 (97.7%) | 560 (2.3%) |
Health Insurance Coverage by Citizenship Status in Solon
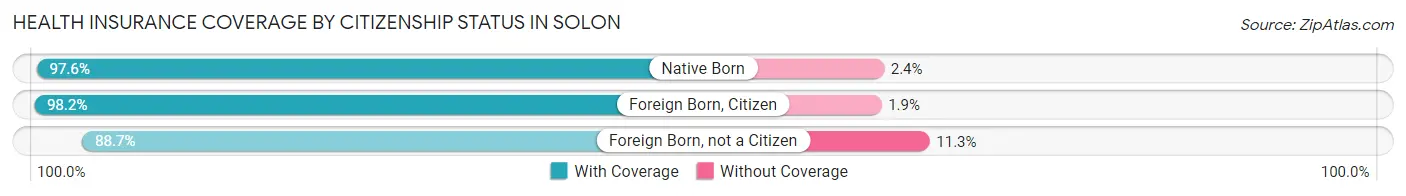
| Citizenship Status | With Coverage | Without Coverage |
| Native Born | 1,529 (97.6%) | 37 (2.4%) |
| Foreign Born, Citizen | 4,733 (98.2%) | 89 (1.8%) |
| Foreign Born, not a Citizen | 1,026 (88.7%) | 131 (11.3%) |
Health Insurance Coverage by Household Income in Solon
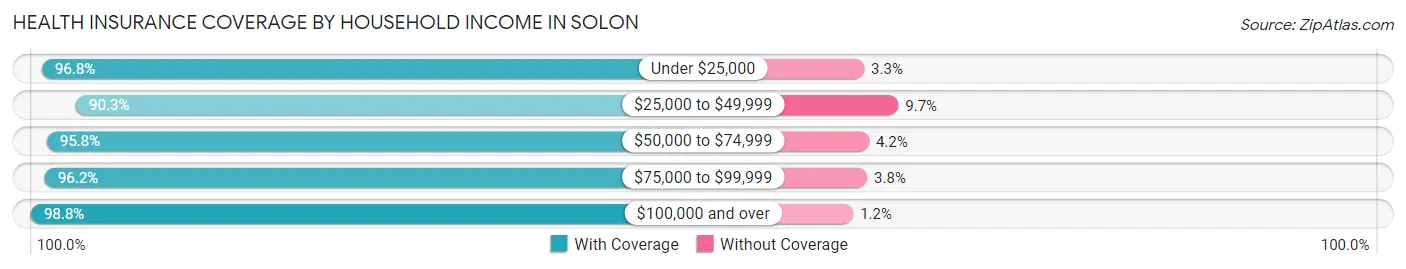
| Household Income | With Coverage | Without Coverage |
| Under $25,000 | 862 (96.8%) | 29 (3.3%) |
| $25,000 to $49,999 | 1,291 (90.3%) | 138 (9.7%) |
| $50,000 to $74,999 | 1,799 (95.8%) | 78 (4.2%) |
| $75,000 to $99,999 | 2,907 (96.2%) | 115 (3.8%) |
| $100,000 and over | 16,486 (98.8%) | 200 (1.2%) |
Public vs Private Health Insurance Coverage by Age in Solon
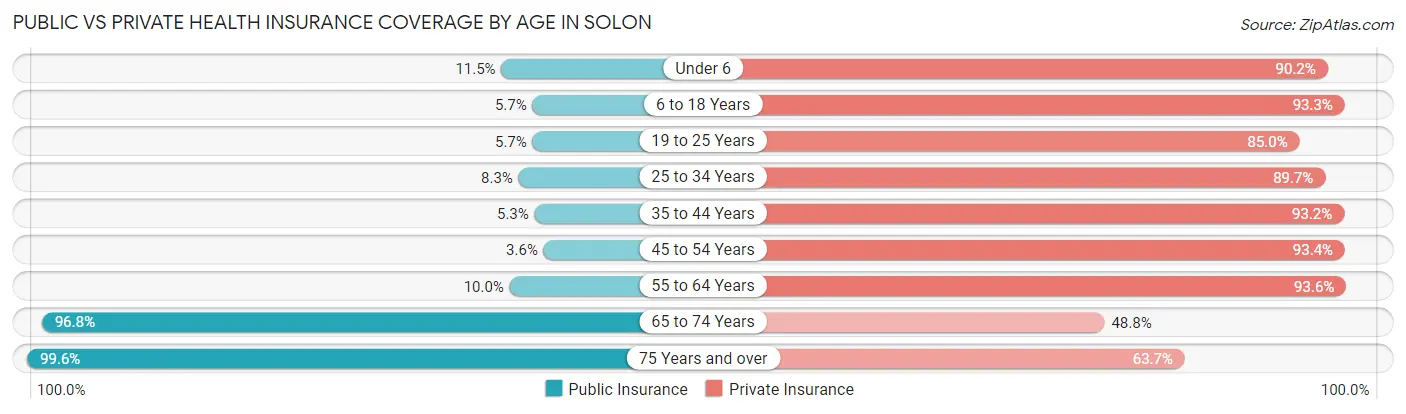
| Age Bracket | Public Insurance | Private Insurance |
| Under 6 | 180 (11.5%) | 1,412 (90.2%) |
| 6 to 18 Years | 276 (5.7%) | 4,501 (93.3%) |
| 19 to 25 Years | 66 (5.7%) | 983 (85.0%) |
| 25 to 34 Years | 96 (8.3%) | 1,039 (89.7%) |
| 35 to 44 Years | 175 (5.3%) | 3,058 (93.2%) |
| 45 to 54 Years | 133 (3.6%) | 3,413 (93.4%) |
| 55 to 64 Years | 362 (10.0%) | 3,401 (93.6%) |
| 65 to 74 Years | 2,764 (96.8%) | 1,392 (48.8%) |
| 75 Years and over | 1,808 (99.6%) | 1,156 (63.7%) |
| Total | 5,860 (24.5%) | 20,355 (85.0%) |
Disability Status by Sex by Age in Solon
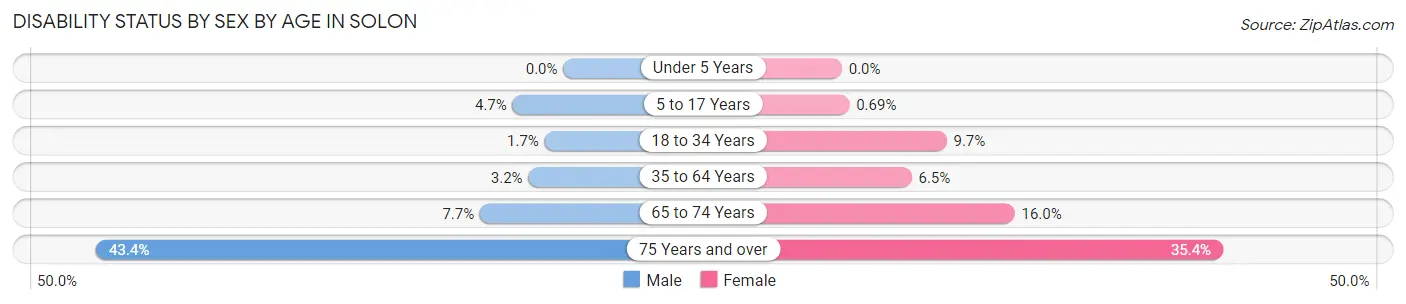
| Age Bracket | Male | Female |
| Under 5 Years | 0 (0.0%) | 0 (0.0%) |
| 5 to 17 Years | 98 (4.7%) | 19 (0.7%) |
| 18 to 34 Years | 22 (1.7%) | 124 (9.7%) |
| 35 to 64 Years | 167 (3.2%) | 350 (6.5%) |
| 65 to 74 Years | 116 (7.7%) | 217 (16.0%) |
| 75 Years and over | 340 (43.4%) | 365 (35.4%) |
Disability Class by Sex by Age in Solon
Disability Class: Hearing Difficulty
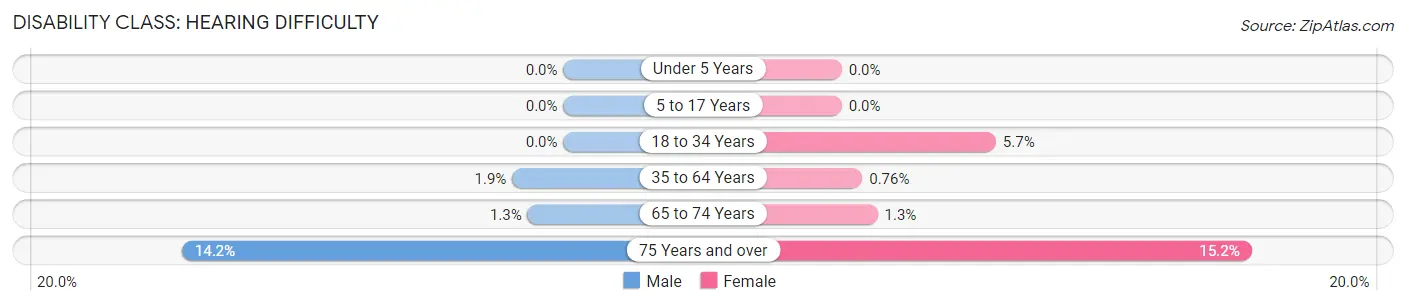
| Age Bracket | Male | Female |
| Under 5 Years | 0 (0.0%) | 0 (0.0%) |
| 5 to 17 Years | 0 (0.0%) | 0 (0.0%) |
| 18 to 34 Years | 0 (0.0%) | 73 (5.7%) |
| 35 to 64 Years | 98 (1.9%) | 41 (0.8%) |
| 65 to 74 Years | 20 (1.3%) | 18 (1.3%) |
| 75 Years and over | 111 (14.2%) | 157 (15.2%) |
Disability Class: Vision Difficulty
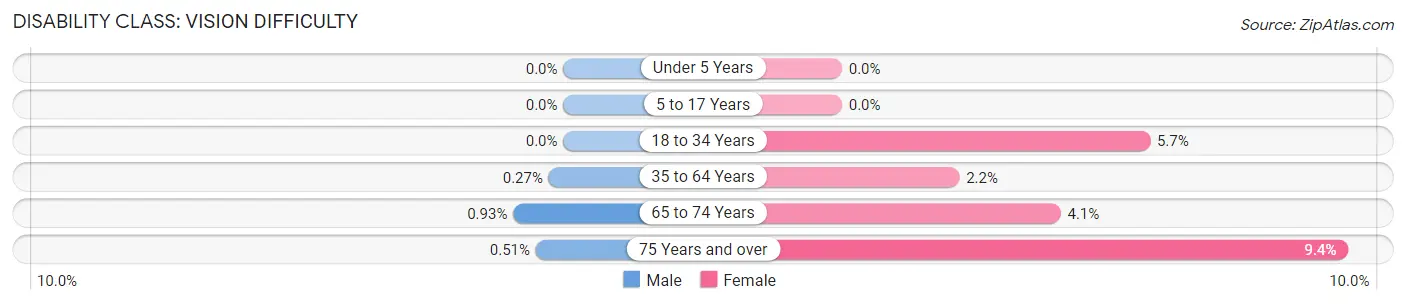
| Age Bracket | Male | Female |
| Under 5 Years | 0 (0.0%) | 0 (0.0%) |
| 5 to 17 Years | 0 (0.0%) | 0 (0.0%) |
| 18 to 34 Years | 0 (0.0%) | 73 (5.7%) |
| 35 to 64 Years | 14 (0.3%) | 118 (2.2%) |
| 65 to 74 Years | 14 (0.9%) | 55 (4.1%) |
| 75 Years and over | 4 (0.5%) | 97 (9.4%) |
Disability Class: Cognitive Difficulty
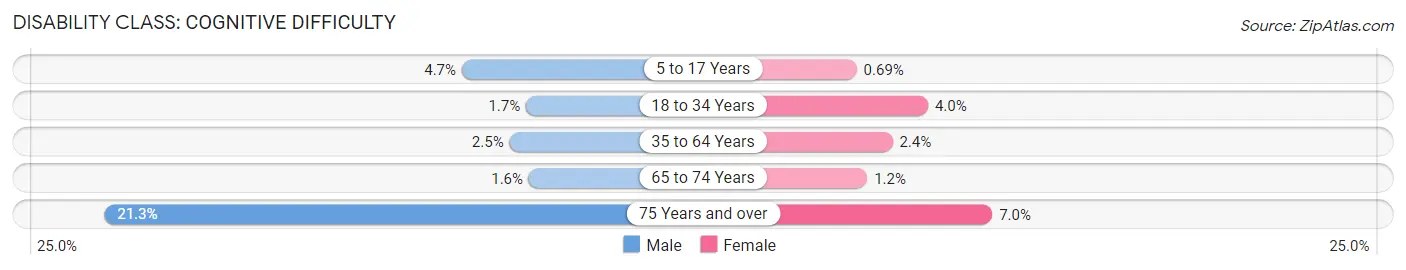
| Age Bracket | Male | Female |
| 5 to 17 Years | 98 (4.7%) | 19 (0.7%) |
| 18 to 34 Years | 22 (1.7%) | 51 (4.0%) |
| 35 to 64 Years | 129 (2.5%) | 127 (2.4%) |
| 65 to 74 Years | 24 (1.6%) | 16 (1.2%) |
| 75 Years and over | 167 (21.3%) | 72 (7.0%) |
Disability Class: Ambulatory Difficulty
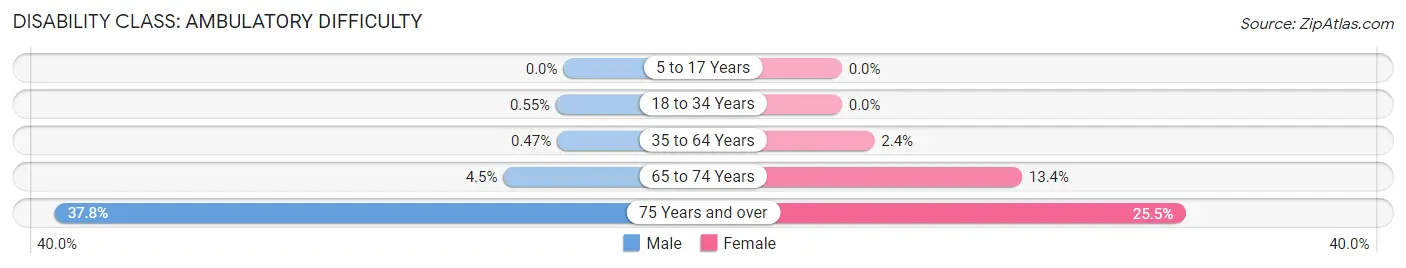
| Age Bracket | Male | Female |
| 5 to 17 Years | 0 (0.0%) | 0 (0.0%) |
| 18 to 34 Years | 7 (0.5%) | 0 (0.0%) |
| 35 to 64 Years | 24 (0.5%) | 131 (2.4%) |
| 65 to 74 Years | 67 (4.5%) | 181 (13.4%) |
| 75 Years and over | 296 (37.8%) | 263 (25.5%) |
Disability Class: Self-Care Difficulty
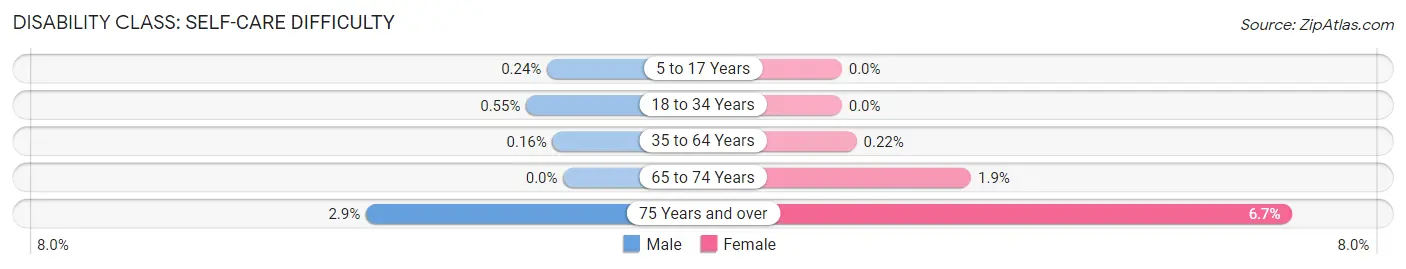
| Age Bracket | Male | Female |
| 5 to 17 Years | 5 (0.2%) | 0 (0.0%) |
| 18 to 34 Years | 7 (0.5%) | 0 (0.0%) |
| 35 to 64 Years | 8 (0.2%) | 12 (0.2%) |
| 65 to 74 Years | 0 (0.0%) | 26 (1.9%) |
| 75 Years and over | 23 (2.9%) | 69 (6.7%) |
Technology Access in Solon
Computing Device Access in Solon
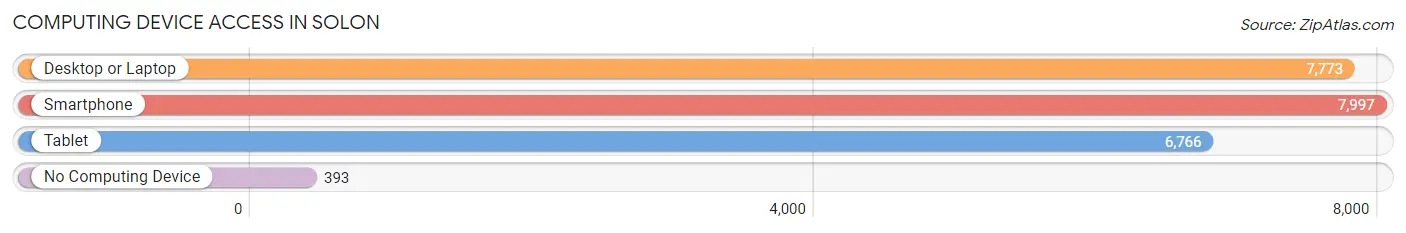
| Device Type | # Households | % Households |
| Desktop or Laptop | 7,773 | 88.6% |
| Smartphone | 7,997 | 91.1% |
| Tablet | 6,766 | 77.1% |
| No Computing Device | 393 | 4.5% |
| Total | 8,773 | 100.0% |
Internet Access in Solon
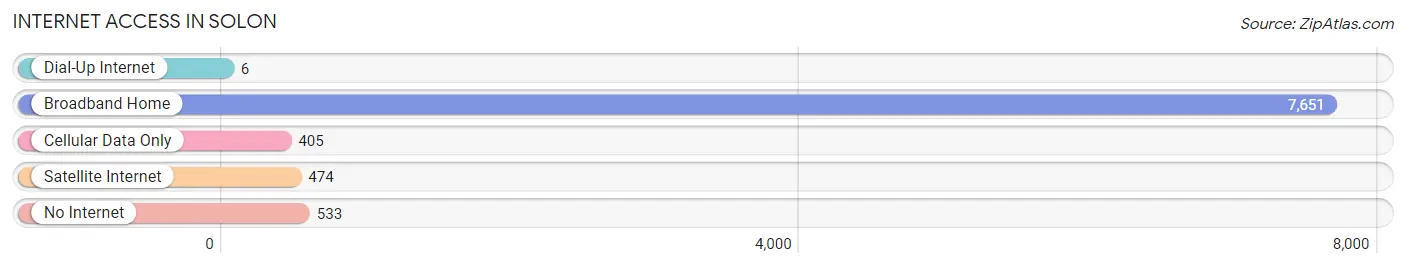
| Internet Type | # Households | % Households |
| Dial-Up Internet | 6 | 0.1% |
| Broadband Home | 7,651 | 87.2% |
| Cellular Data Only | 405 | 4.6% |
| Satellite Internet | 474 | 5.4% |
| No Internet | 533 | 6.1% |
| Total | 8,773 | 100.0% |
Solon Summary
Solon, Ohio is a city located in Cuyahoga County, Ohio, United States. It is a suburb of Cleveland and is located about 25 miles southeast of the city. As of the 2010 census, the city had a population of 23,348.
History
Solon was founded in 1820 by John and Joseph Stearns, two brothers from Connecticut. The brothers purchased land from the Connecticut Land Company and named the area after the Greek statesman Solon. The area was originally a farming community, but it quickly grew into a small village. In 1834, the village was incorporated as a township.
In the late 19th century, Solon began to experience rapid growth due to the development of the railroad and the discovery of natural gas in the area. This growth continued into the 20th century, and by the 1950s, Solon had become a thriving suburban community.
Geography
Solon is located at 41°22′N 81°25′W (41.37, -81.41). According to the United States Census Bureau, the city has a total area of 16.2 square miles (41.8 km2), of which 16.1 square miles (41.6 km2) is land and 0.1 square miles (0.2 km2) is water.
Economy
Solon is home to a number of large businesses, including Nestle USA, Swagelok, and the Cleveland Clinic. The city is also home to a number of smaller businesses, including restaurants, retail stores, and professional services.
Demographics
As of the 2010 census, there were 23,348 people, 8,845 households, and 6,717 families residing in the city. The population density was 1,445.3 people per square mile (558.9/km2). There were 9,093 housing units at an average density of 565.3 per square mile (218.6/km2). The racial makeup of the city was 81.2% White, 8.2% African American, 0.2% Native American, 7.3% Asian, 0.1% Pacific Islander, 1.2% from other races, and 1.9% from two or more races. Hispanic or Latino of any race were 3.3% of the population.
The median income for a household in the city was $87,845, and the median income for a family was $103,945. Males had a median income of $76,945 versus $50,945 for females. The per capita income for the city was $41,945. About 2.2% of families and 3.2% of the population were below the poverty line, including 3.7% of those under age 18 and 3.2% of those age 65 or over.
Common Questions
What is the Total Population of Solon?
Total Population of Solon is 24,053.
What is the Total Male Population of Solon?
Total Male Population of Solon is 11,752.
What is the Total Female Population of Solon?
Total Female Population of Solon is 12,301.
What is the Ratio of Males per 100 Females in Solon?
There are 95.54 Males per 100 Females in Solon.
What is the Ratio of Females per 100 Males in Solon?
There are 104.67 Females per 100 Males in Solon.
What is the Median Population Age in Solon?
Median Population Age in Solon is 45.1 Years.
What is the Average Family Size in Solon
Average Family Size in Solon is 3.2 People.
What is the Average Household Size in Solon
Average Household Size in Solon is 2.7 People.
What is Per Capita Income in Solon?
Per Capita income in Solon is $66,670.
What is the Median Family Income in Solon?
Median Family Income in Solon is $158,492.
What is the Median Household income in Solon?
Median Household Income in Solon is $128,470.
What is Income or Wage Gap in Solon?
Income or Wage Gap in Solon is 36.1%.
Women in Solon earn 63.9 cents for every dollar earned by a man.
What is Inequality or Gini Index in Solon?
Inequality or Gini Index in Solon is 0.47.
How Large is the Labor Force in Solon?
There are 12,520 People in the Labor Forcein in Solon.
What is the Percentage of People in the Labor Force in Solon?
66.6% of People are in the Labor Force in Solon.
What is the Unemployment Rate in Solon?
Unemployment Rate in Solon is 3.1%.