Perry Heights, OH
Perry Heights Map
Perry Heights Overview
8,762
TOTAL POPULATION
4,375
MALE POPULATION
4,387
FEMALE POPULATION
99.73
MALES / 100 FEMALES
100.27
FEMALES / 100 MALES
45.4
MEDIAN AGE
3.0
AVG FAMILY SIZE
2.5
AVG HOUSEHOLD SIZE
$28,581
PER CAPITA INCOME
$71,351
AVG FAMILY INCOME
$62,689
AVG HOUSEHOLD INCOME
31.6%
WAGE / INCOME GAP [ % ]
68.4¢/ $1
WAGE / INCOME GAP [ $ ]
0.36
INEQUALITY / GINI INDEX
4,589
LABOR FORCE [ PEOPLE ]
63.3%
PERCENT IN LABOR FORCE
2.3%
UNEMPLOYMENT RATE
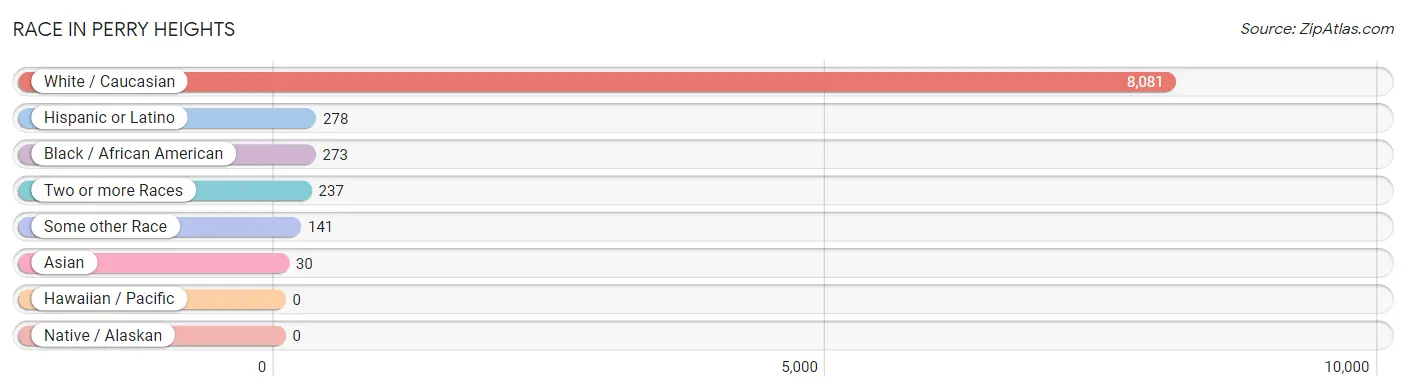
Race in Perry Heights
The most populous races in Perry Heights are White / Caucasian (8,081 | 92.2%), Hispanic or Latino (278 | 3.2%), and Black / African American (273 | 3.1%).
| Race | # Population | % Population |
| Asian | 30 | 0.3% |
| Black / African American | 273 | 3.1% |
| Hawaiian / Pacific | 0 | 0.0% |
| Hispanic or Latino | 278 | 3.2% |
| Native / Alaskan | 0 | 0.0% |
| White / Caucasian | 8,081 | 92.2% |
| Two or more Races | 237 | 2.7% |
| Some other Race | 141 | 1.6% |
| Total | 8,762 | 100.0% |
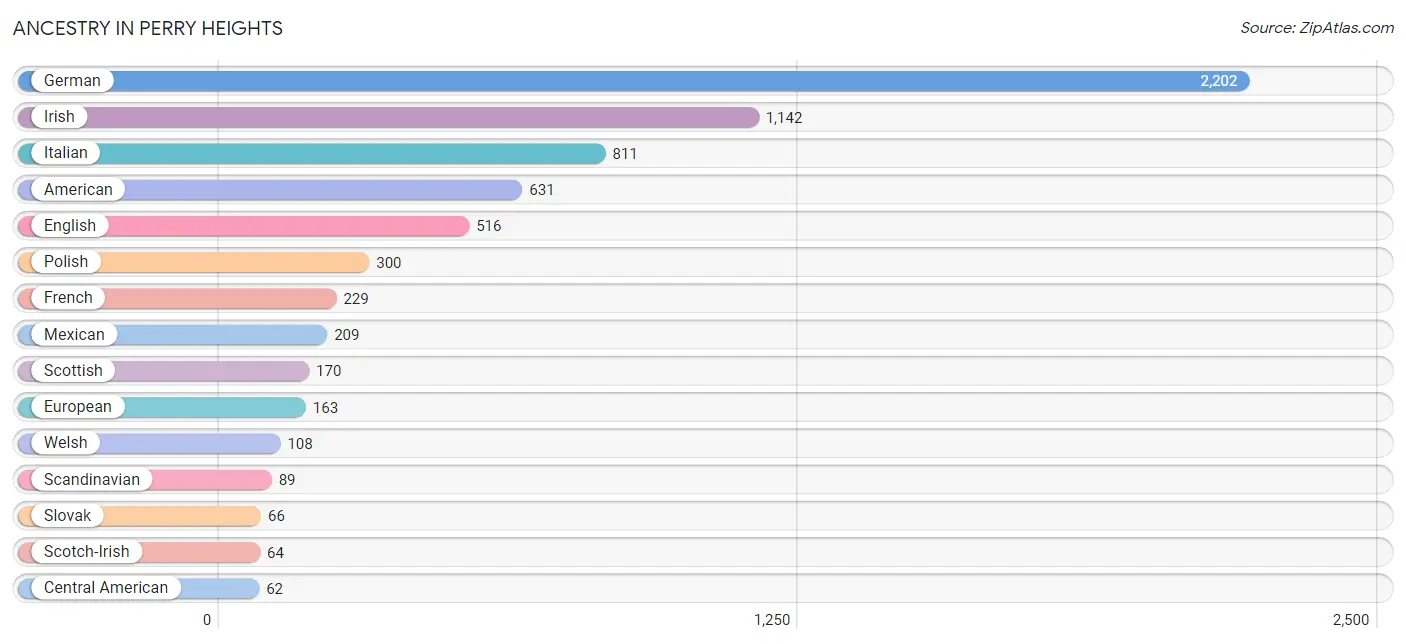
Ancestry in Perry Heights
The most populous ancestries reported in Perry Heights are German (2,202 | 25.1%), Irish (1,142 | 13.0%), Italian (811 | 9.3%), American (631 | 7.2%), and English (516 | 5.9%), together accounting for 60.5% of all Perry Heights residents.
| Ancestry | # Population | % Population |
| American | 631 | 7.2% |
| Austrian | 20 | 0.2% |
| Cape Verdean | 33 | 0.4% |
| Central American | 62 | 0.7% |
| Czech | 38 | 0.4% |
| Czechoslovakian | 14 | 0.2% |
| Danish | 9 | 0.1% |
| Dutch | 25 | 0.3% |
| Eastern European | 59 | 0.7% |
| English | 516 | 5.9% |
| European | 163 | 1.9% |
| French | 229 | 2.6% |
| French Canadian | 50 | 0.6% |
| German | 2,202 | 25.1% |
| Greek | 25 | 0.3% |
| Honduran | 62 | 0.7% |
| Hungarian | 38 | 0.4% |
| Icelander | 14 | 0.2% |
| Irish | 1,142 | 13.0% |
| Italian | 811 | 9.3% |
| Korean | 30 | 0.3% |
| Mexican | 209 | 2.4% |
| Polish | 300 | 3.4% |
| Romanian | 28 | 0.3% |
| Scandinavian | 89 | 1.0% |
| Scotch-Irish | 64 | 0.7% |
| Scottish | 170 | 1.9% |
| Serbian | 15 | 0.2% |
| Slovak | 66 | 0.7% |
| Slovene | 50 | 0.6% |
| Subsaharan African | 33 | 0.4% |
| Swedish | 14 | 0.2% |
| Swiss | 50 | 0.6% |
| Welsh | 108 | 1.2% | View All 34 Rows |
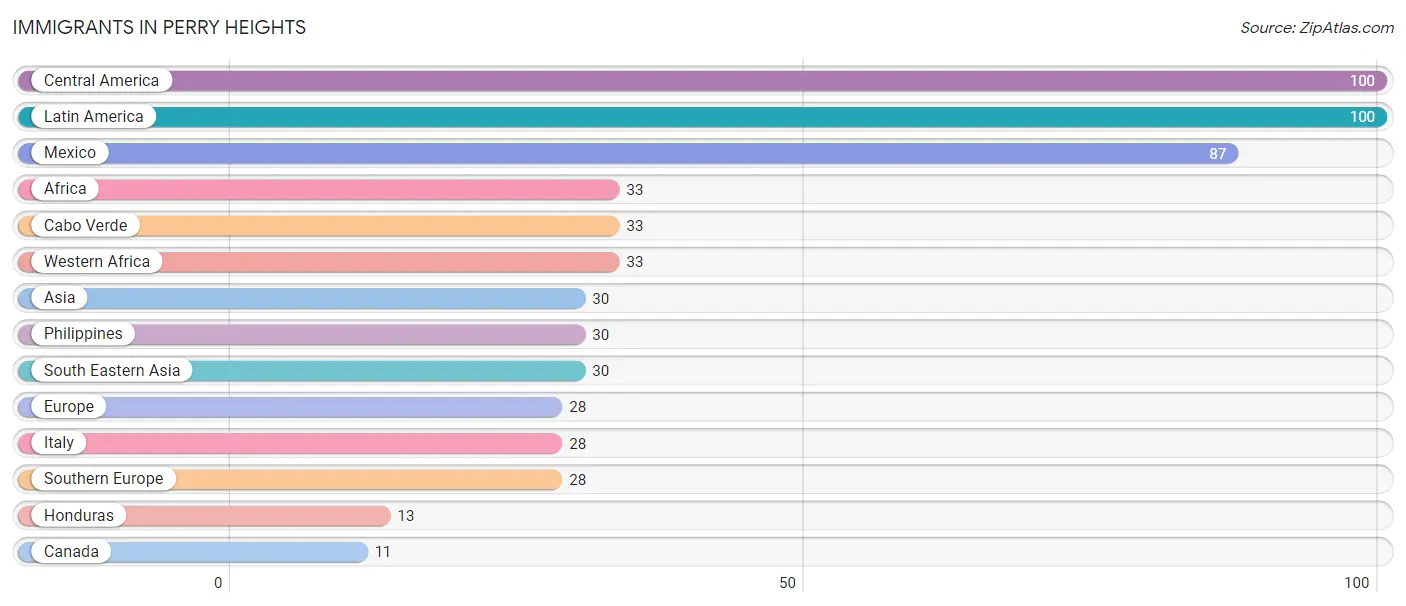
Immigrants in Perry Heights
The most numerous immigrant groups reported in Perry Heights came from Central America (100 | 1.1%), Latin America (100 | 1.1%), Mexico (87 | 1.0%), Africa (33 | 0.4%), and Cabo Verde (33 | 0.4%), together accounting for 4.0% of all Perry Heights residents.
| Immigration Origin | # Population | % Population |
| Africa | 33 | 0.4% |
| Asia | 30 | 0.3% |
| Cabo Verde | 33 | 0.4% |
| Canada | 11 | 0.1% |
| Central America | 100 | 1.1% |
| Europe | 28 | 0.3% |
| Honduras | 13 | 0.2% |
| Italy | 28 | 0.3% |
| Latin America | 100 | 1.1% |
| Mexico | 87 | 1.0% |
| Philippines | 30 | 0.3% |
| South Eastern Asia | 30 | 0.3% |
| Southern Europe | 28 | 0.3% |
| Western Africa | 33 | 0.4% | View All 14 Rows |
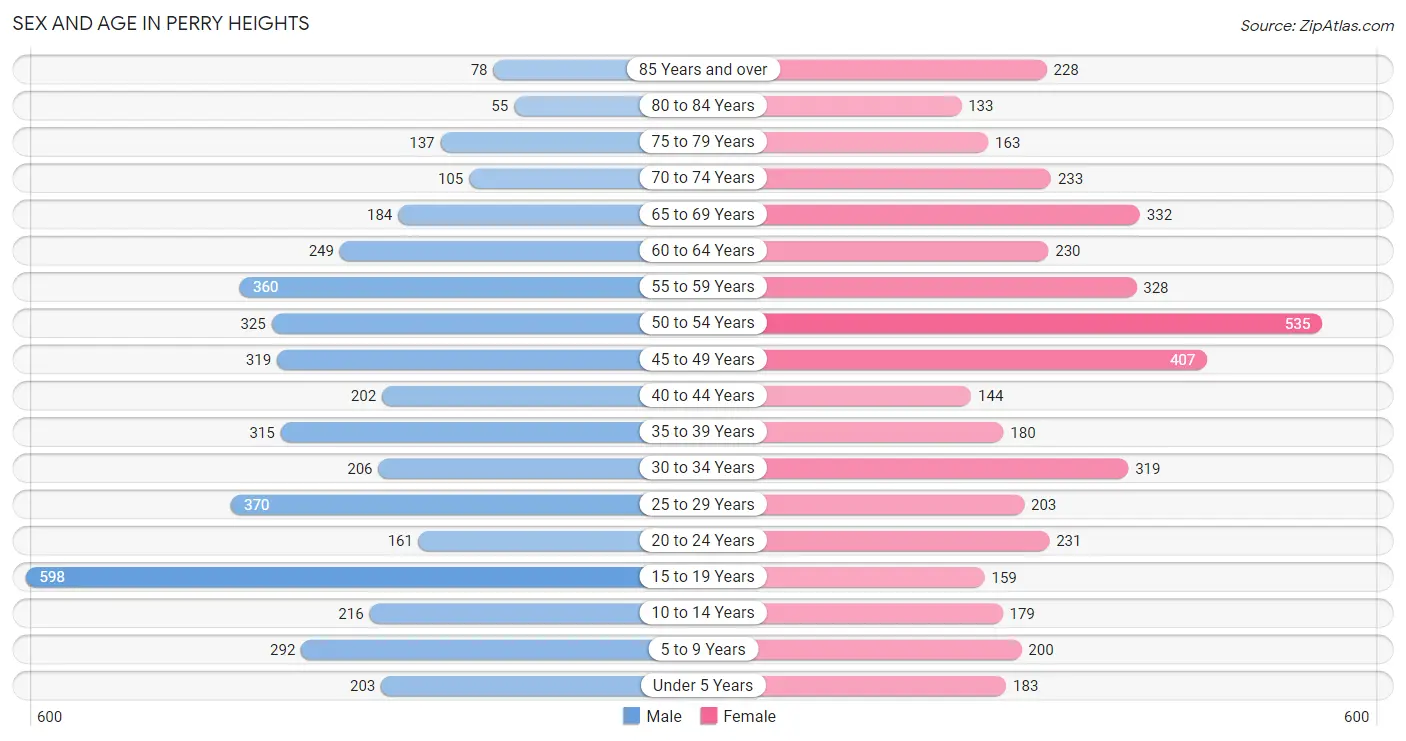
Sex and Age in Perry Heights
Sex and Age in Perry Heights
The most populous age groups in Perry Heights are 15 to 19 Years (598 | 13.7%) for men and 50 to 54 Years (535 | 12.2%) for women.
| Age Bracket | Male | Female |
| Under 5 Years | 203 (4.6%) | 183 (4.2%) |
| 5 to 9 Years | 292 (6.7%) | 200 (4.6%) |
| 10 to 14 Years | 216 (4.9%) | 179 (4.1%) |
| 15 to 19 Years | 598 (13.7%) | 159 (3.6%) |
| 20 to 24 Years | 161 (3.7%) | 231 (5.3%) |
| 25 to 29 Years | 370 (8.5%) | 203 (4.6%) |
| 30 to 34 Years | 206 (4.7%) | 319 (7.3%) |
| 35 to 39 Years | 315 (7.2%) | 180 (4.1%) |
| 40 to 44 Years | 202 (4.6%) | 144 (3.3%) |
| 45 to 49 Years | 319 (7.3%) | 407 (9.3%) |
| 50 to 54 Years | 325 (7.4%) | 535 (12.2%) |
| 55 to 59 Years | 360 (8.2%) | 328 (7.5%) |
| 60 to 64 Years | 249 (5.7%) | 230 (5.2%) |
| 65 to 69 Years | 184 (4.2%) | 332 (7.6%) |
| 70 to 74 Years | 105 (2.4%) | 233 (5.3%) |
| 75 to 79 Years | 137 (3.1%) | 163 (3.7%) |
| 80 to 84 Years | 55 (1.3%) | 133 (3.0%) |
| 85 Years and over | 78 (1.8%) | 228 (5.2%) |
| Total | 4,375 (100.0%) | 4,387 (100.0%) |
Families and Households in Perry Heights
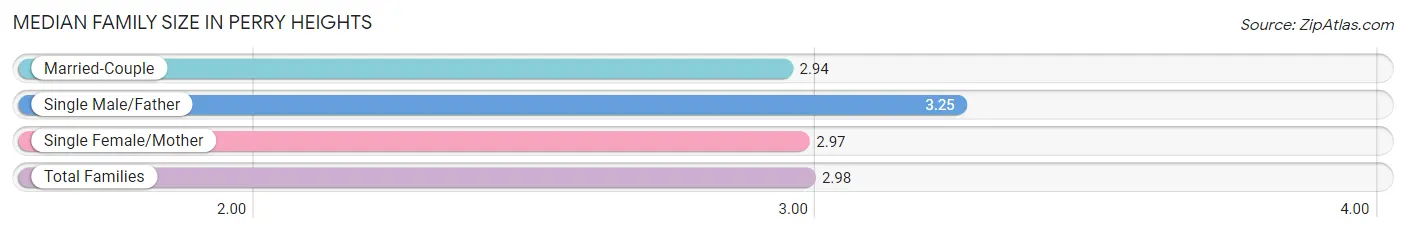
Median Family Size in Perry Heights
The median family size in Perry Heights is 2.98 persons per family, with single male/father families (200 | 8.7%) accounting for the largest median family size of 3.25 persons per family. On the other hand, married-couple families (1,420 | 62.1%) represent the smallest median family size with 2.94 persons per family.
| Family Type | # Families | Family Size |
| Married-Couple | 1,420 (62.1%) | 2.94 |
| Single Male/Father | 200 (8.7%) | 3.25 |
| Single Female/Mother | 666 (29.1%) | 2.97 |
| Total Families | 2,286 (100.0%) | 2.98 |
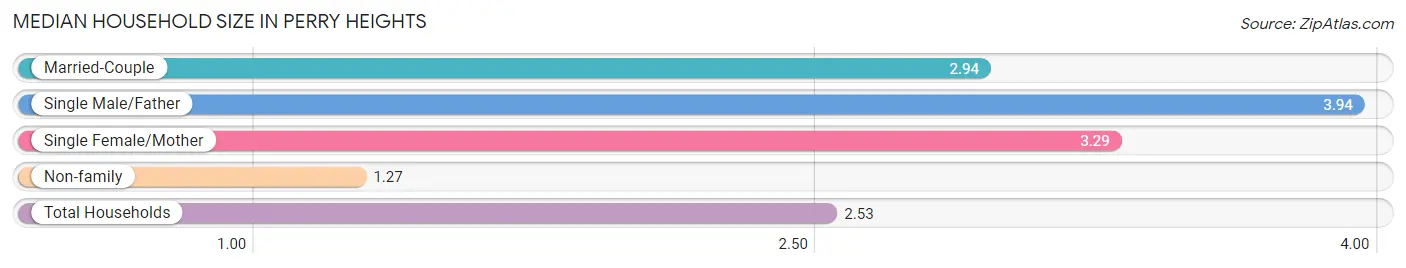
Median Household Size in Perry Heights
The median household size in Perry Heights is 2.53 persons per household, with single male/father households (200 | 5.9%) accounting for the largest median household size of 3.94 persons per household. non-family households (1,098 | 32.5%) represent the smallest median household size with 1.27 persons per household.
| Household Type | # Households | Household Size |
| Married-Couple | 1,420 (42.0%) | 2.94 |
| Single Male/Father | 200 (5.9%) | 3.94 |
| Single Female/Mother | 666 (19.7%) | 3.29 |
| Non-family | 1,098 (32.5%) | 1.27 |
| Total Households | 3,384 (100.0%) | 2.53 |
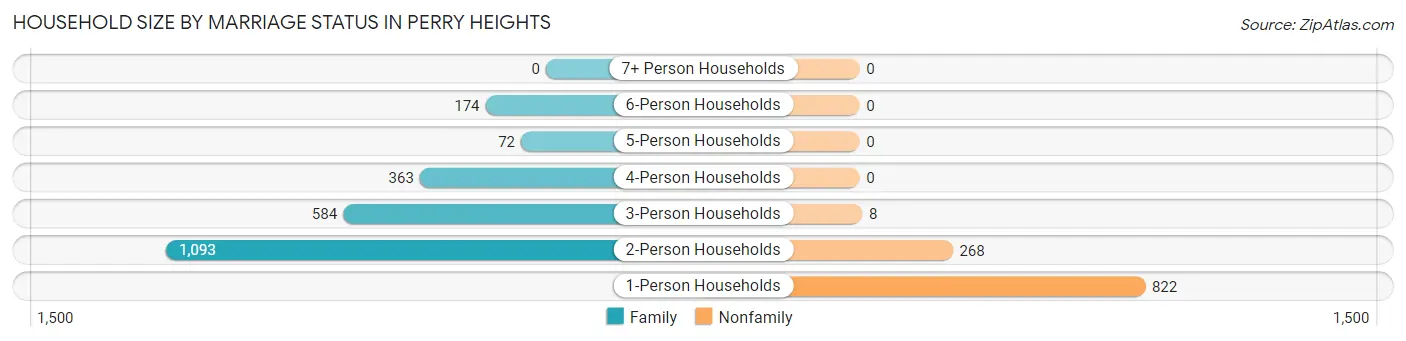
Household Size by Marriage Status in Perry Heights
Out of a total of 3,384 households in Perry Heights, 2,286 (67.5%) are family households, while 1,098 (32.5%) are nonfamily households. The most numerous type of family households are 2-person households, comprising 1,093, and the most common type of nonfamily households are 1-person households, comprising 822.
| Household Size | Family Households | Nonfamily Households |
| 1-Person Households | - | 822 (24.3%) |
| 2-Person Households | 1,093 (32.3%) | 268 (7.9%) |
| 3-Person Households | 584 (17.3%) | 8 (0.2%) |
| 4-Person Households | 363 (10.7%) | 0 (0.0%) |
| 5-Person Households | 72 (2.1%) | 0 (0.0%) |
| 6-Person Households | 174 (5.1%) | 0 (0.0%) |
| 7+ Person Households | 0 (0.0%) | 0 (0.0%) |
| Total | 2,286 (67.5%) | 1,098 (32.5%) |
Female Fertility in Perry Heights
Fertility by Age in Perry Heights
Average fertility rate in Perry Heights is 23.0 births per 1,000 women. Women in the age bracket of 20 to 34 years have the highest fertility rate with 54.0 births per 1,000 women. Women in the age bracket of 20 to 34 years acount for 100.0% of all women with births.
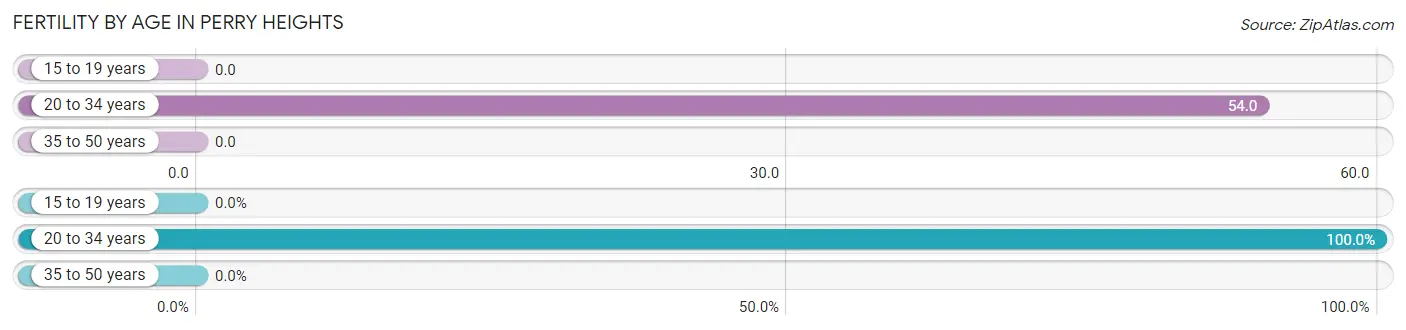
| Age Bracket | Women with Births | Births / 1,000 Women |
| 15 to 19 years | 0 (0.0%) | 0.0 |
| 20 to 34 years | 41 (100.0%) | 54.0 |
| 35 to 50 years | 0 (0.0%) | 0.0 |
| Total | 41 (100.0%) | 23.0 |
Fertility by Age by Marriage Status in Perry Heights
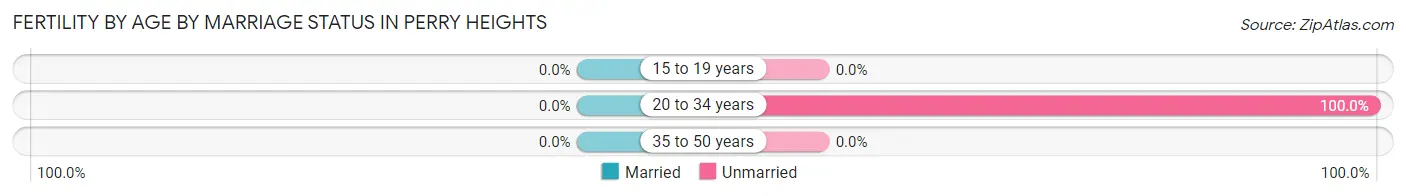
| Age Bracket | Married | Unmarried |
| 15 to 19 years | 0 (0.0%) | 0 (0.0%) |
| 20 to 34 years | 0 (0.0%) | 41 (100.0%) |
| 35 to 50 years | 0 (0.0%) | 0 (0.0%) |
| Total | 0 (0.0%) | 41 (100.0%) |
Fertility by Education in Perry Heights
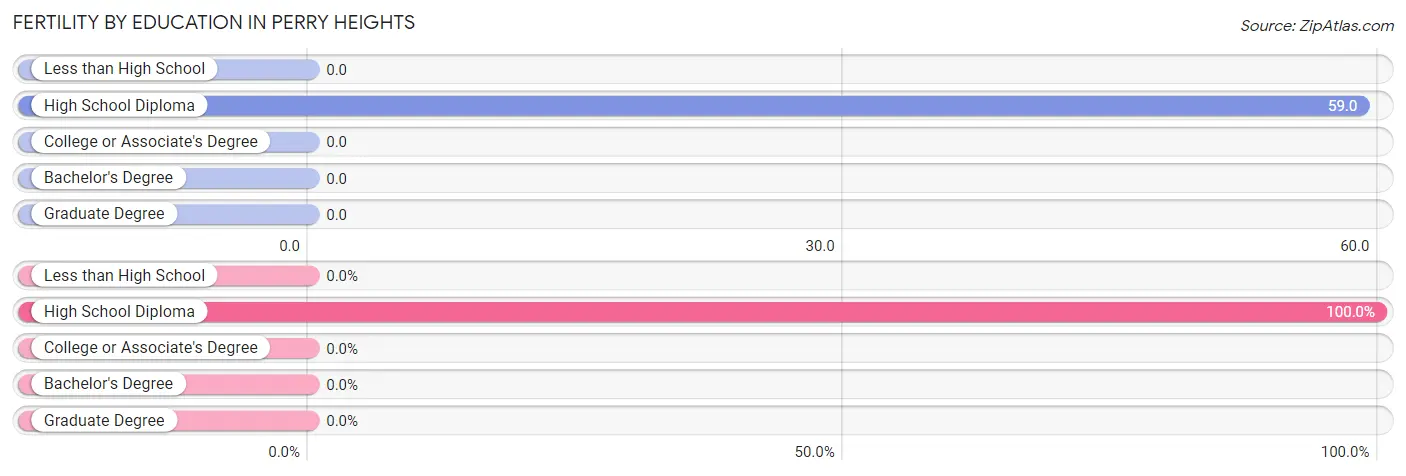
| Educational Attainment | Women with Births | Births / 1,000 Women |
| Less than High School | 0 (0.0%) | 0.0 |
| High School Diploma | 41 (100.0%) | 59.0 |
| College or Associate's Degree | 0 (0.0%) | 0.0 |
| Bachelor's Degree | 0 (0.0%) | 0.0 |
| Graduate Degree | 0 (0.0%) | 0.0 |
| Total | 41 (100.0%) | 23.0 |
Fertility by Education by Marriage Status in Perry Heights
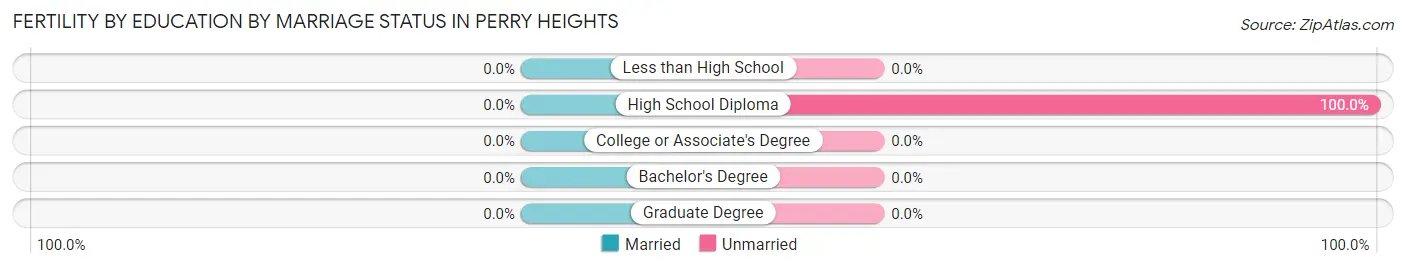
| Educational Attainment | Married | Unmarried |
| Less than High School | 0 (0.0%) | 0 (0.0%) |
| High School Diploma | 0 (0.0%) | 41 (100.0%) |
| College or Associate's Degree | 0 (0.0%) | 0 (0.0%) |
| Bachelor's Degree | 0 (0.0%) | 0 (0.0%) |
| Graduate Degree | 0 (0.0%) | 0 (0.0%) |
| Total | 0 (0.0%) | 41 (100.0%) |
Income in Perry Heights
Income Overview in Perry Heights
Per Capita Income in Perry Heights is $28,581, while median incomes of families and households are $71,351 and $62,689 respectively.
| Characteristic | Number | Measure |
| Per Capita Income | 8,762 | $28,581 |
| Median Family Income | 2,286 | $71,351 |
| Mean Family Income | 2,286 | $77,751 |
| Median Household Income | 3,384 | $62,689 |
| Mean Household Income | 3,384 | $72,453 |
| Income Deficit | 2,286 | $0 |
| Wage / Income Gap (%) | 8,762 | 31.58% |
| Wage / Income Gap ($) | 8,762 | 68.42¢ per $1 |
| Gini / Inequality Index | 8,762 | 0.36 |
Earnings by Sex in Perry Heights
Average Earnings in Perry Heights are $34,349, $41,656 for men and $28,502 for women, a difference of 31.6%.
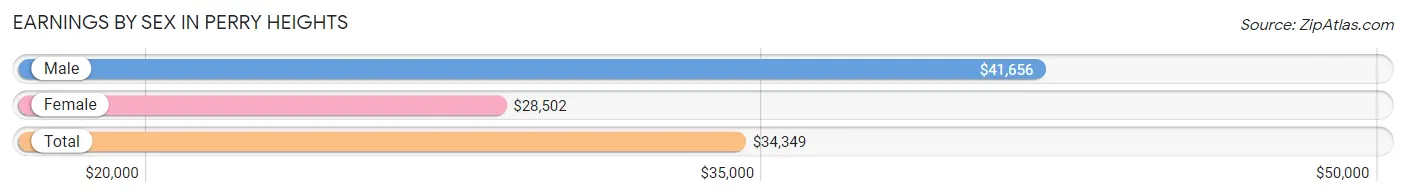
| Sex | Number | Average Earnings |
| Male | 2,542 (53.4%) | $41,656 |
| Female | 2,217 (46.6%) | $28,502 |
| Total | 4,759 (100.0%) | $34,349 |
Earnings by Sex by Income Bracket in Perry Heights
The most common earnings brackets in Perry Heights are $75,000 to $99,999 for men (383 | 15.1%) and $25,000 to $29,999 for women (275 | 12.4%).
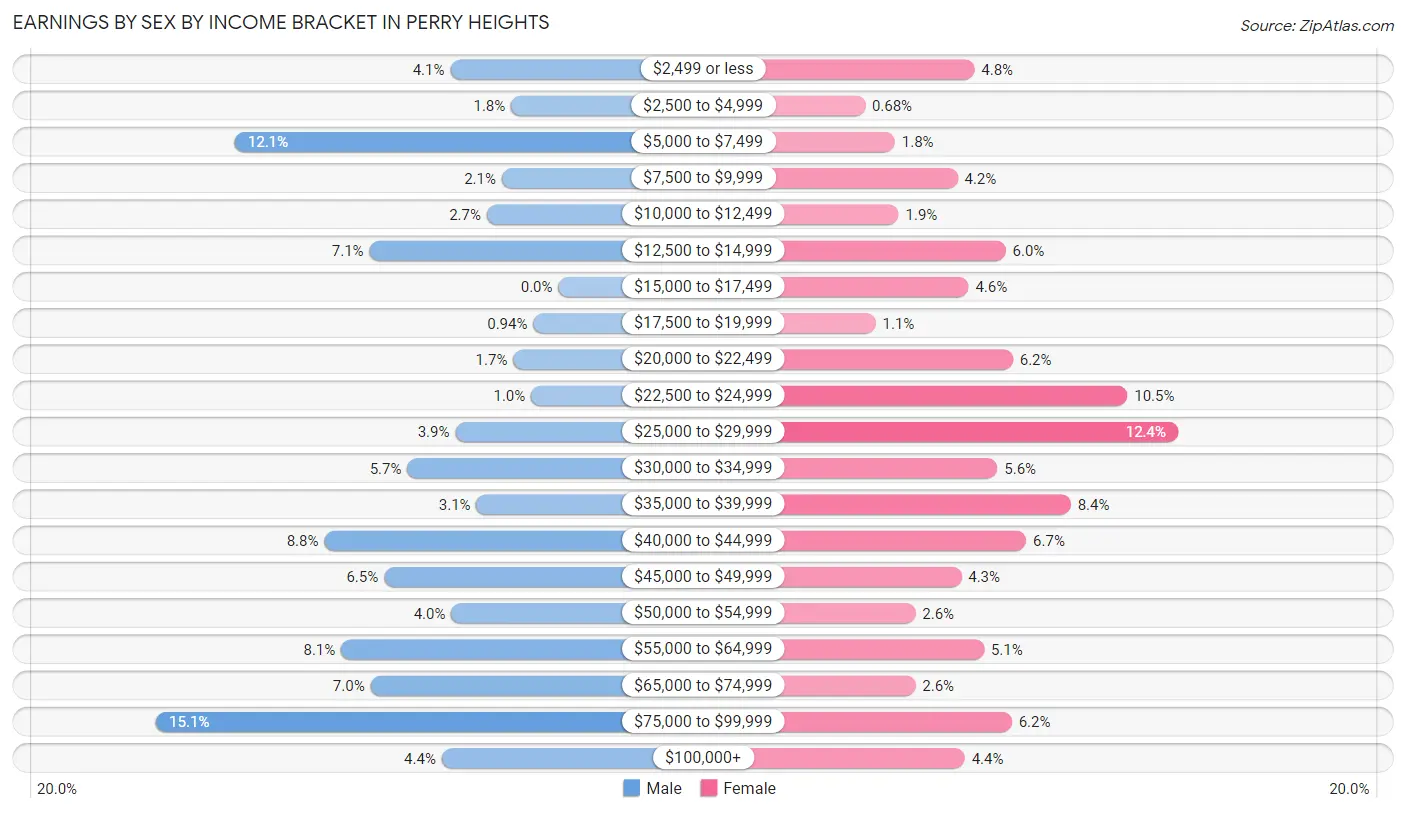
| Income | Male | Female |
| $2,499 or less | 103 (4.1%) | 106 (4.8%) |
| $2,500 to $4,999 | 45 (1.8%) | 15 (0.7%) |
| $5,000 to $7,499 | 308 (12.1%) | 40 (1.8%) |
| $7,500 to $9,999 | 54 (2.1%) | 92 (4.2%) |
| $10,000 to $12,499 | 68 (2.7%) | 43 (1.9%) |
| $12,500 to $14,999 | 180 (7.1%) | 132 (5.9%) |
| $15,000 to $17,499 | 0 (0.0%) | 101 (4.6%) |
| $17,500 to $19,999 | 24 (0.9%) | 24 (1.1%) |
| $20,000 to $22,499 | 43 (1.7%) | 138 (6.2%) |
| $22,500 to $24,999 | 26 (1.0%) | 233 (10.5%) |
| $25,000 to $29,999 | 98 (3.9%) | 275 (12.4%) |
| $30,000 to $34,999 | 144 (5.7%) | 125 (5.6%) |
| $35,000 to $39,999 | 78 (3.1%) | 186 (8.4%) |
| $40,000 to $44,999 | 223 (8.8%) | 149 (6.7%) |
| $45,000 to $49,999 | 166 (6.5%) | 95 (4.3%) |
| $50,000 to $54,999 | 102 (4.0%) | 57 (2.6%) |
| $55,000 to $64,999 | 207 (8.1%) | 114 (5.1%) |
| $65,000 to $74,999 | 179 (7.0%) | 57 (2.6%) |
| $75,000 to $99,999 | 383 (15.1%) | 137 (6.2%) |
| $100,000+ | 111 (4.4%) | 98 (4.4%) |
| Total | 2,542 (100.0%) | 2,217 (100.0%) |
Earnings by Sex by Educational Attainment in Perry Heights
Average earnings in Perry Heights are $46,750 for men and $29,516 for women, a difference of 36.9%. Men with an educational attainment of college or associate's degree enjoy the highest average annual earnings of $55,167, while those with less than high school education earn the least with $40,117. Women with an educational attainment of graduate degree earn the most with the average annual earnings of $47,411, while those with high school diploma education have the smallest earnings of $27,757.
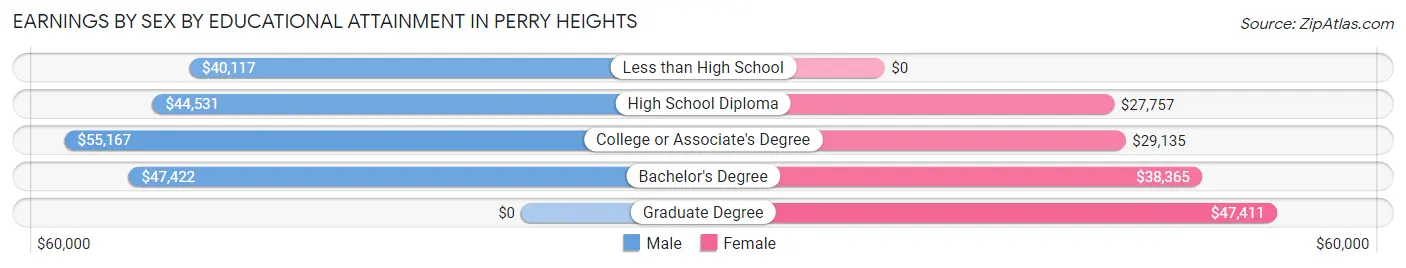
| Educational Attainment | Male Income | Female Income |
| Less than High School | $40,117 | $0 |
| High School Diploma | $44,531 | $27,757 |
| College or Associate's Degree | $55,167 | $29,135 |
| Bachelor's Degree | $47,422 | $38,365 |
| Graduate Degree | - | - |
| Total | $46,750 | $29,516 |
Family Income in Perry Heights
Family Income Brackets in Perry Heights
According to the Perry Heights family income data, there are 455 families falling into the $100,000 to $149,999 income range, which is the most common income bracket and makes up 19.9% of all families. Conversely, the less than $10,000 income bracket is the least frequent group with only 30 families (1.3%) belonging to this category.
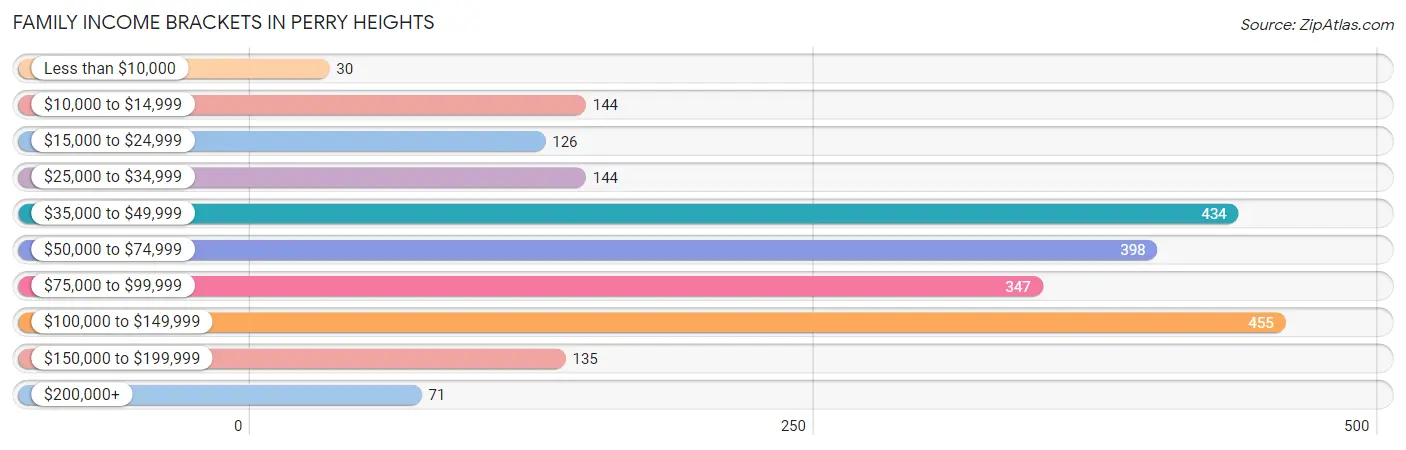
| Income Bracket | # Families | % Families |
| Less than $10,000 | 30 | 1.3% |
| $10,000 to $14,999 | 144 | 6.3% |
| $15,000 to $24,999 | 126 | 5.5% |
| $25,000 to $34,999 | 144 | 6.3% |
| $35,000 to $49,999 | 434 | 19.0% |
| $50,000 to $74,999 | 398 | 17.4% |
| $75,000 to $99,999 | 347 | 15.2% |
| $100,000 to $149,999 | 455 | 19.9% |
| $150,000 to $199,999 | 135 | 5.9% |
| $200,000+ | 71 | 3.1% |
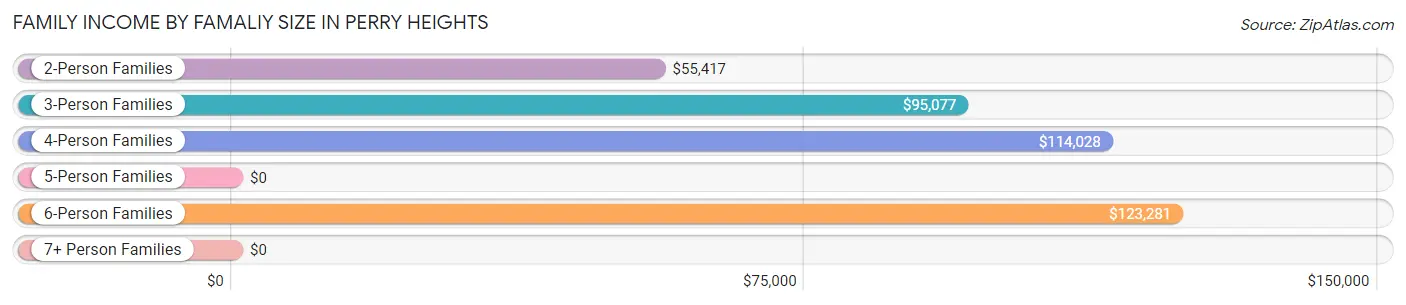
Family Income by Famaliy Size in Perry Heights
6-person families (44 | 1.9%) account for the highest median family income in Perry Heights with $123,281 per family, while 3-person families (631 | 27.6%) have the highest median income of $31,692 per family member.
| Income Bracket | # Families | Median Income |
| 2-Person Families | 1,164 (50.9%) | $55,417 |
| 3-Person Families | 631 (27.6%) | $95,077 |
| 4-Person Families | 269 (11.8%) | $114,028 |
| 5-Person Families | 178 (7.8%) | $0 |
| 6-Person Families | 44 (1.9%) | $123,281 |
| 7+ Person Families | 0 (0.0%) | $0 |
| Total | 2,286 (100.0%) | $71,351 |
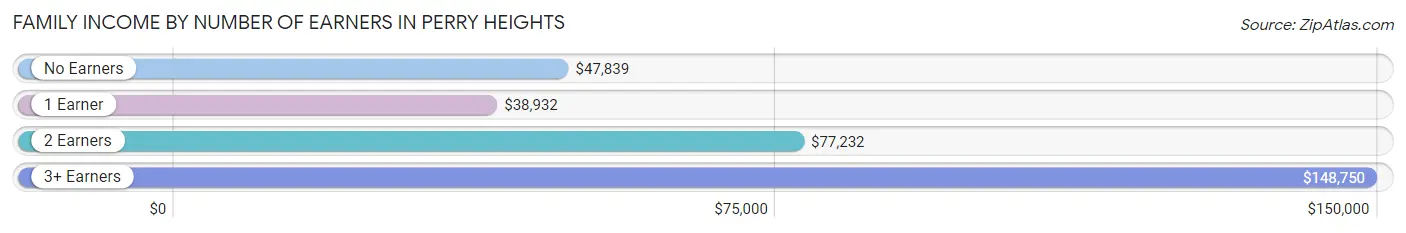
Family Income by Number of Earners in Perry Heights
The median family income in Perry Heights is $71,351, with families comprising 3+ earners (330) having the highest median family income of $148,750, while families with 1 earner (759) have the lowest median family income of $38,932, accounting for 14.4% and 33.2% of families, respectively.
| Number of Earners | # Families | Median Income |
| No Earners | 385 (16.8%) | $47,839 |
| 1 Earner | 759 (33.2%) | $38,932 |
| 2 Earners | 812 (35.5%) | $77,232 |
| 3+ Earners | 330 (14.4%) | $148,750 |
| Total | 2,286 (100.0%) | $71,351 |
Household Income in Perry Heights
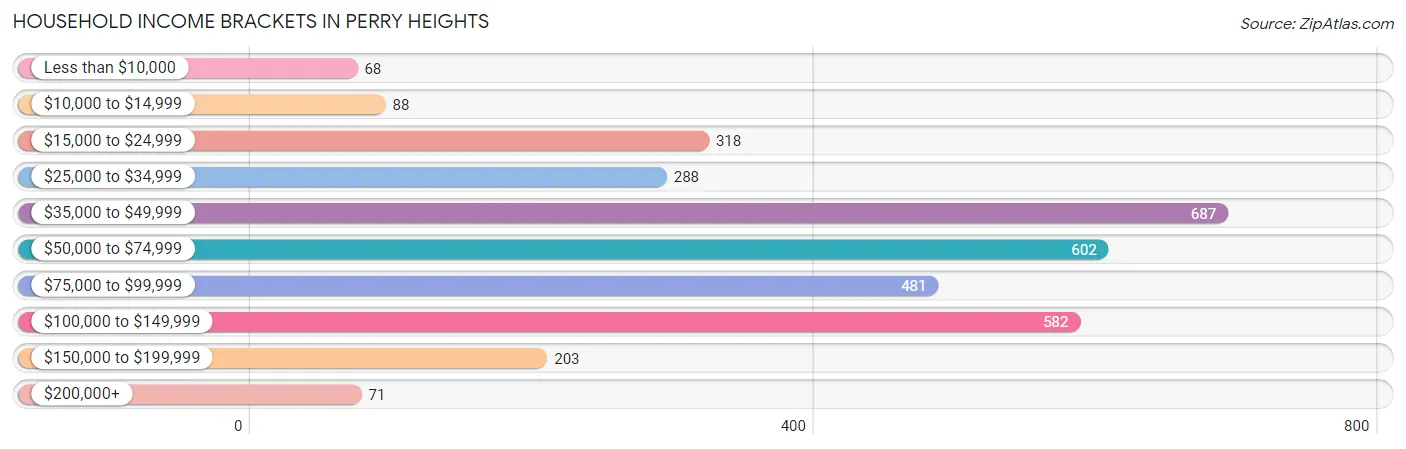
Household Income Brackets in Perry Heights
With 687 households falling in the category, the $35,000 to $49,999 income range is the most frequent in Perry Heights, accounting for 20.3% of all households. In contrast, only 68 households (2.0%) fall into the less than $10,000 income bracket, making it the least populous group.
| Income Bracket | # Households | % Households |
| Less than $10,000 | 68 | 2.0% |
| $10,000 to $14,999 | 88 | 2.6% |
| $15,000 to $24,999 | 318 | 9.4% |
| $25,000 to $34,999 | 288 | 8.5% |
| $35,000 to $49,999 | 687 | 20.3% |
| $50,000 to $74,999 | 602 | 17.8% |
| $75,000 to $99,999 | 481 | 14.2% |
| $100,000 to $149,999 | 582 | 17.2% |
| $150,000 to $199,999 | 203 | 6.0% |
| $200,000+ | 71 | 2.1% |
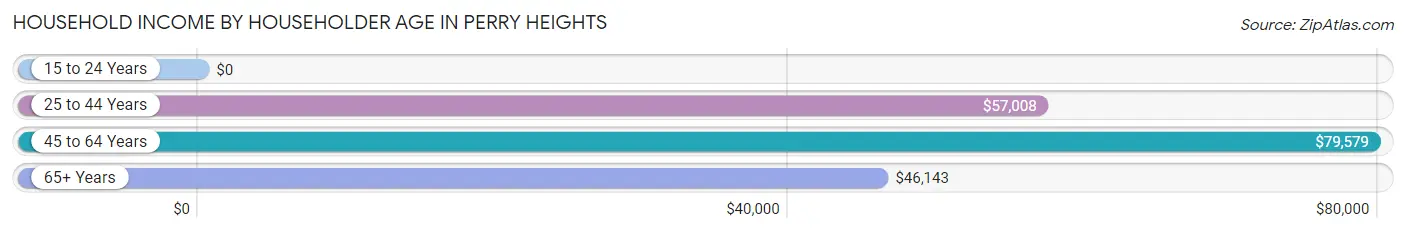
Household Income by Householder Age in Perry Heights
The median household income in Perry Heights is $62,689, with the highest median household income of $79,579 found in the 45 to 64 years age bracket for the primary householder. A total of 1,503 households (44.4%) fall into this category. Meanwhile, the 15 to 24 years age bracket for the primary householder has the lowest median household income of $0, with 42 households (1.2%) in this group.
| Income Bracket | # Households | Median Income |
| 15 to 24 Years | 42 (1.2%) | $0 |
| 25 to 44 Years | 853 (25.2%) | $57,008 |
| 45 to 64 Years | 1,503 (44.4%) | $79,579 |
| 65+ Years | 986 (29.1%) | $46,143 |
| Total | 3,384 (100.0%) | $62,689 |
Poverty in Perry Heights
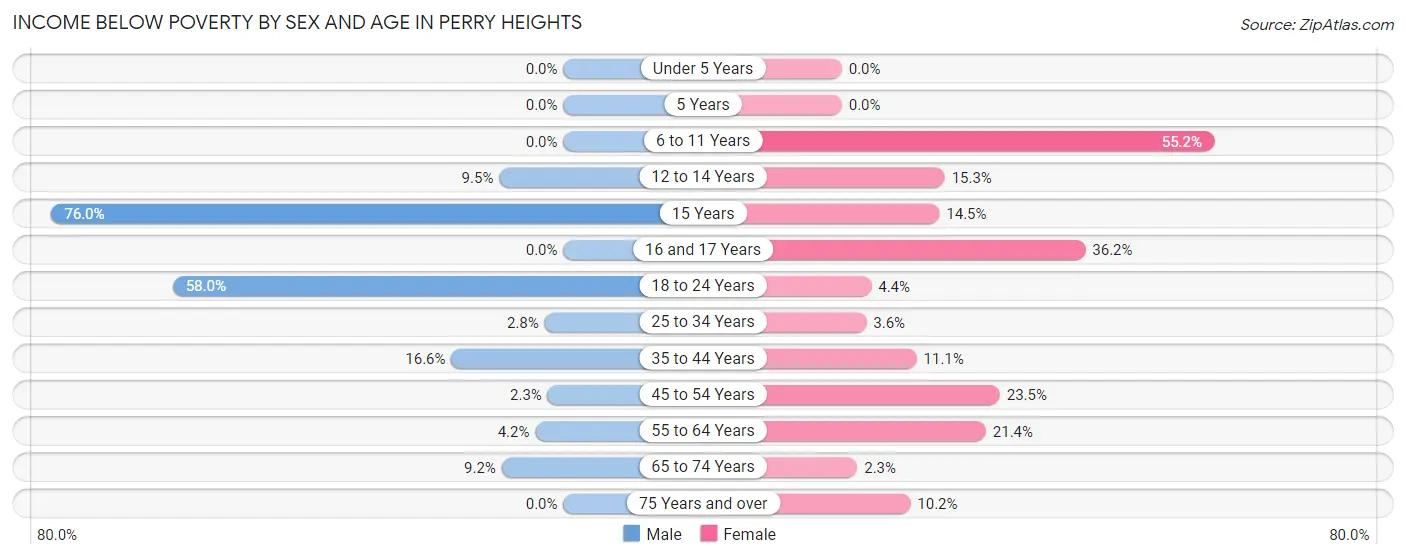
Income Below Poverty by Sex and Age in Perry Heights
With 13.2% poverty level for males and 14.6% for females among the residents of Perry Heights, 15 year old males and 6 to 11 year old females are the most vulnerable to poverty, with 130 males (76.0%) and 116 females (55.2%) in their respective age groups living below the poverty level.
| Age Bracket | Male | Female |
| Under 5 Years | 0 (0.0%) | 0 (0.0%) |
| 5 Years | 0 (0.0%) | 0 (0.0%) |
| 6 to 11 Years | 0 (0.0%) | 116 (55.2%) |
| 12 to 14 Years | 14 (9.5%) | 22 (15.3%) |
| 15 Years | 130 (76.0%) | 10 (14.5%) |
| 16 and 17 Years | 0 (0.0%) | 17 (36.2%) |
| 18 to 24 Years | 261 (58.0%) | 12 (4.4%) |
| 25 to 34 Years | 16 (2.8%) | 19 (3.6%) |
| 35 to 44 Years | 85 (16.6%) | 36 (11.1%) |
| 45 to 54 Years | 15 (2.3%) | 221 (23.5%) |
| 55 to 64 Years | 24 (4.2%) | 111 (21.4%) |
| 65 to 74 Years | 25 (9.2%) | 13 (2.3%) |
| 75 Years and over | 0 (0.0%) | 45 (10.2%) |
| Total | 570 (13.2%) | 622 (14.6%) |
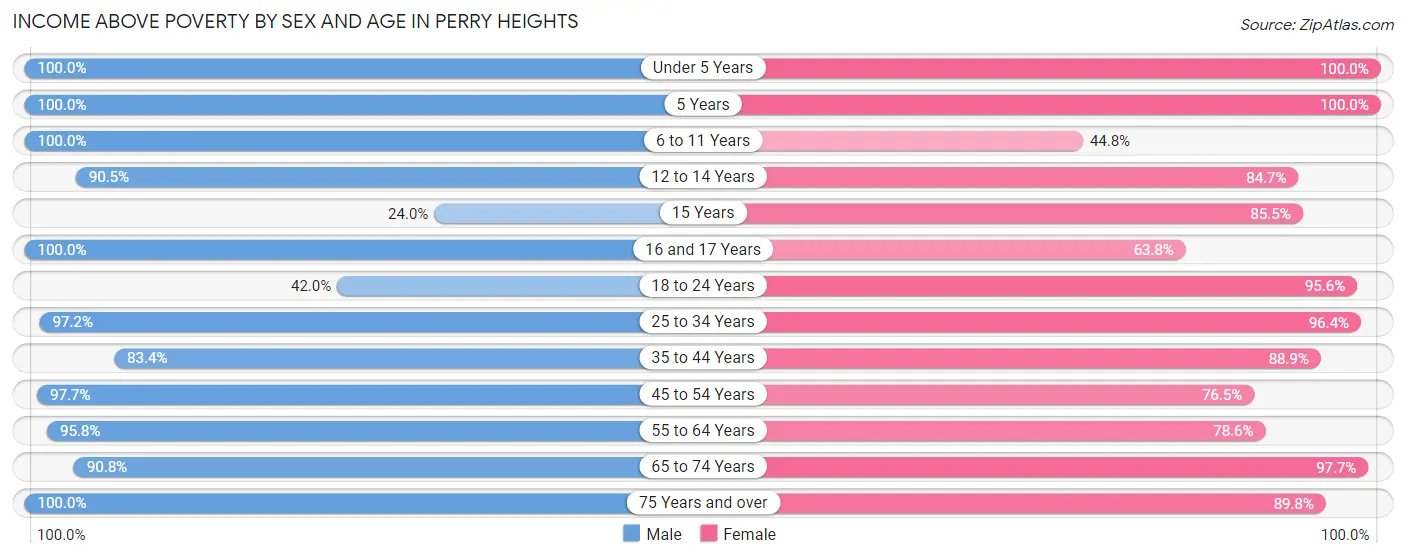
Income Above Poverty by Sex and Age in Perry Heights
According to the poverty statistics in Perry Heights, males aged under 5 years and females aged under 5 years are the age groups that are most secure financially, with 100.0% of males and 100.0% of females in these age groups living above the poverty line.
| Age Bracket | Male | Female |
| Under 5 Years | 203 (100.0%) | 176 (100.0%) |
| 5 Years | 99 (100.0%) | 25 (100.0%) |
| 6 to 11 Years | 262 (100.0%) | 94 (44.8%) |
| 12 to 14 Years | 133 (90.5%) | 122 (84.7%) |
| 15 Years | 41 (24.0%) | 59 (85.5%) |
| 16 and 17 Years | 138 (100.0%) | 30 (63.8%) |
| 18 to 24 Years | 189 (42.0%) | 262 (95.6%) |
| 25 to 34 Years | 560 (97.2%) | 503 (96.4%) |
| 35 to 44 Years | 426 (83.4%) | 288 (88.9%) |
| 45 to 54 Years | 629 (97.7%) | 721 (76.5%) |
| 55 to 64 Years | 552 (95.8%) | 408 (78.6%) |
| 65 to 74 Years | 248 (90.8%) | 552 (97.7%) |
| 75 Years and over | 255 (100.0%) | 397 (89.8%) |
| Total | 3,735 (86.8%) | 3,637 (85.4%) |
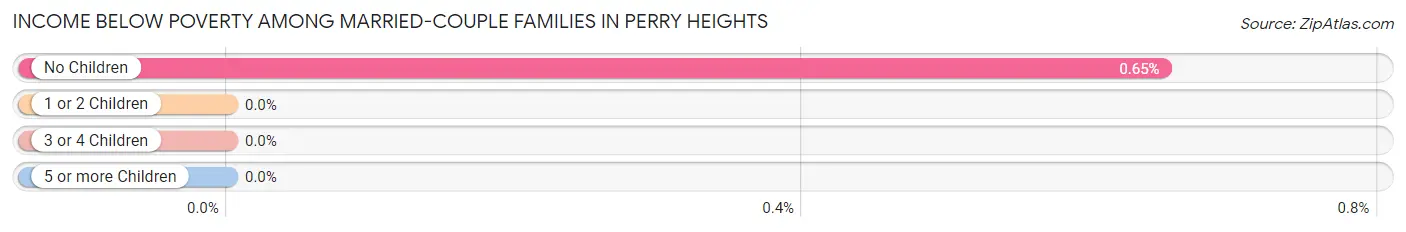
Income Below Poverty Among Married-Couple Families in Perry Heights
The poverty statistics for married-couple families in Perry Heights show that 0.4% or 6 of the total 1,420 families live below the poverty line. Families with no children have the highest poverty rate of 0.6%, comprising of 6 families. On the other hand, families with 1 or 2 children have the lowest poverty rate of 0.0%, which includes 0 families.
| Children | Above Poverty | Below Poverty |
| No Children | 916 (99.4%) | 6 (0.6%) |
| 1 or 2 Children | 450 (100.0%) | 0 (0.0%) |
| 3 or 4 Children | 48 (100.0%) | 0 (0.0%) |
| 5 or more Children | 0 (0.0%) | 0 (0.0%) |
| Total | 1,414 (99.6%) | 6 (0.4%) |
Income Below Poverty Among Single-Parent Households in Perry Heights
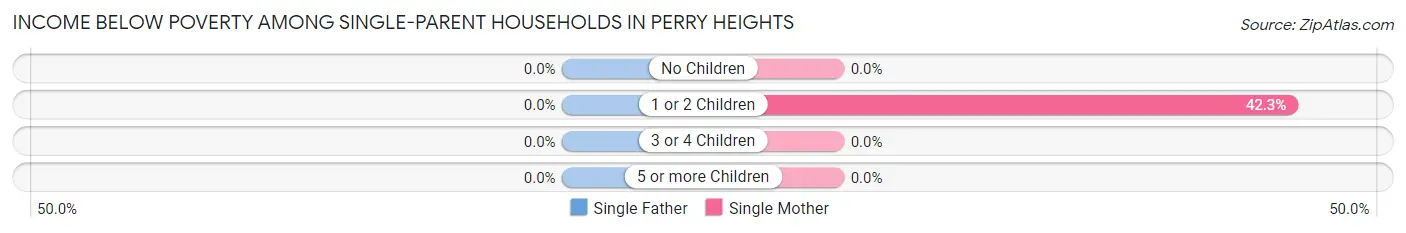
| Children | Single Father | Single Mother |
| No Children | 0 (0.0%) | 0 (0.0%) |
| 1 or 2 Children | 0 (0.0%) | 168 (42.3%) |
| 3 or 4 Children | 0 (0.0%) | 0 (0.0%) |
| 5 or more Children | 0 (0.0%) | 0 (0.0%) |
| Total | 0 (0.0%) | 168 (25.2%) |
Income Below Poverty Among Married-Couple vs Single-Parent Households in Perry Heights
The poverty data for Perry Heights shows that 6 of the married-couple family households (0.4%) and 168 of the single-parent households (19.4%) are living below the poverty level. Within the married-couple family households, those with no children have the highest poverty rate, with 6 households (0.6%) falling below the poverty line. Among the single-parent households, those with 1 or 2 children have the highest poverty rate, with 168 household (33.7%) living below poverty.
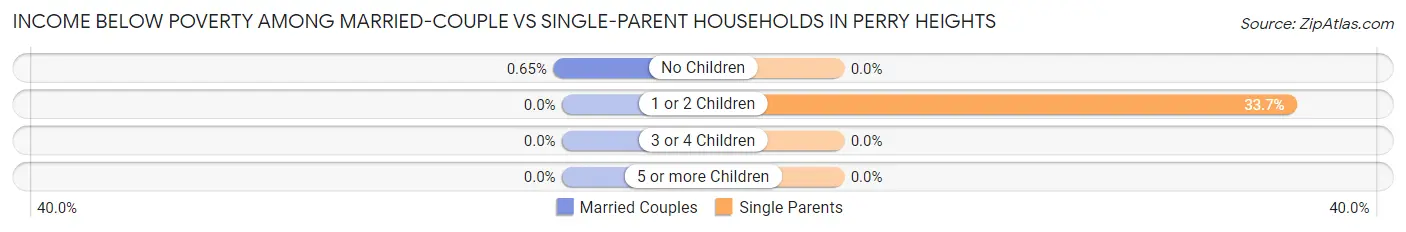
| Children | Married-Couple Families | Single-Parent Households |
| No Children | 6 (0.6%) | 0 (0.0%) |
| 1 or 2 Children | 0 (0.0%) | 168 (33.7%) |
| 3 or 4 Children | 0 (0.0%) | 0 (0.0%) |
| 5 or more Children | 0 (0.0%) | 0 (0.0%) |
| Total | 6 (0.4%) | 168 (19.4%) |
Employment Characteristics in Perry Heights
Employment by Class of Employer in Perry Heights
Among the 4,411 employed individuals in Perry Heights, private company employees (3,350 | 75.9%), not-for-profit organizations (355 | 8.1%), and local government employees (323 | 7.3%) make up the most common classes of employment.
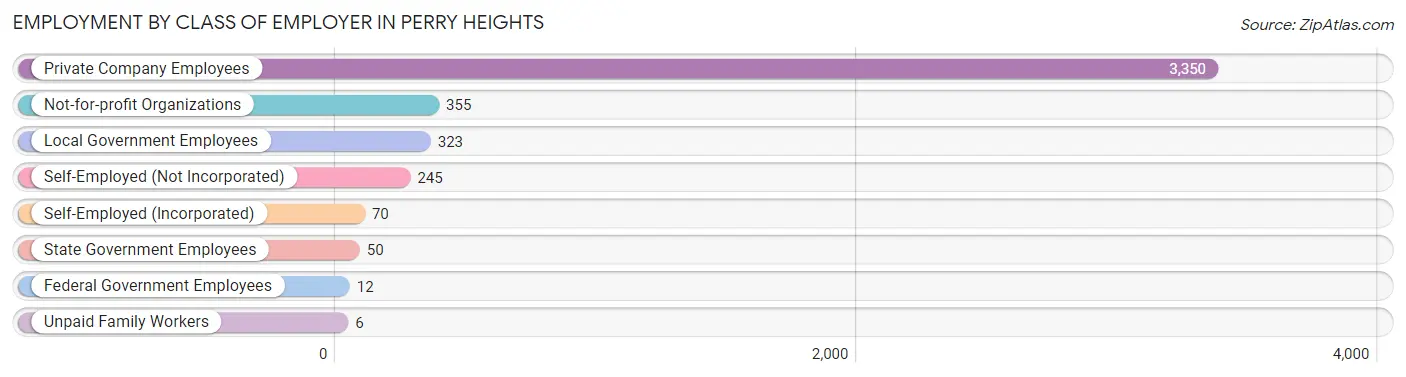
| Employer Class | # Employees | % Employees |
| Private Company Employees | 3,350 | 75.9% |
| Self-Employed (Incorporated) | 70 | 1.6% |
| Self-Employed (Not Incorporated) | 245 | 5.6% |
| Not-for-profit Organizations | 355 | 8.1% |
| Local Government Employees | 323 | 7.3% |
| State Government Employees | 50 | 1.1% |
| Federal Government Employees | 12 | 0.3% |
| Unpaid Family Workers | 6 | 0.1% |
| Total | 4,411 | 100.0% |
Employment Status by Age in Perry Heights
According to the labor force statistics for Perry Heights, out of the total population over 16 years of age (7,249), 63.3% or 4,589 individuals are in the labor force, with 2.3% or 106 of them unemployed. The age group with the highest labor force participation rate is 25 to 29 years, with 97.9% or 561 individuals in the labor force. Within the labor force, the 25 to 29 years age range has the highest percentage of unemployed individuals, with 7.3% or 41 of them being unemployed.
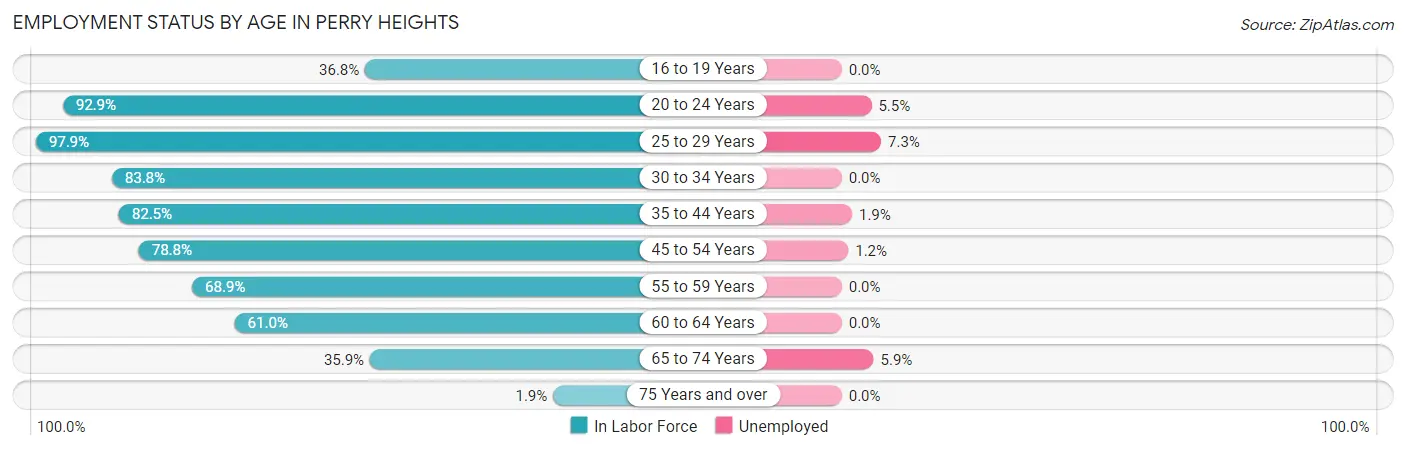
| Age Bracket | In Labor Force | Unemployed |
| 16 to 19 Years | 190 (36.8%) | 0 (0.0%) |
| 20 to 24 Years | 364 (92.9%) | 20 (5.5%) |
| 25 to 29 Years | 561 (97.9%) | 41 (7.3%) |
| 30 to 34 Years | 440 (83.8%) | 0 (0.0%) |
| 35 to 44 Years | 694 (82.5%) | 13 (1.9%) |
| 45 to 54 Years | 1,250 (78.8%) | 15 (1.2%) |
| 55 to 59 Years | 474 (68.9%) | 0 (0.0%) |
| 60 to 64 Years | 292 (61.0%) | 0 (0.0%) |
| 65 to 74 Years | 307 (35.9%) | 18 (5.9%) |
| 75 Years and over | 15 (1.9%) | 0 (0.0%) |
| Total | 4,589 (63.3%) | 106 (2.3%) |
Employment Status by Educational Attainment in Perry Heights
According to labor force statistics for Perry Heights, 79.1% of individuals (3,711) out of the total population between 25 and 64 years of age (4,692) are in the labor force, with 1.9% or 71 of them being unemployed. The group with the highest labor force participation rate are those with the educational attainment of bachelor's degree or higher, with 100.0% or 555 individuals in the labor force. Within the labor force, individuals with high school diploma education have the highest percentage of unemployment, with 3.5% or 56 of them being unemployed.
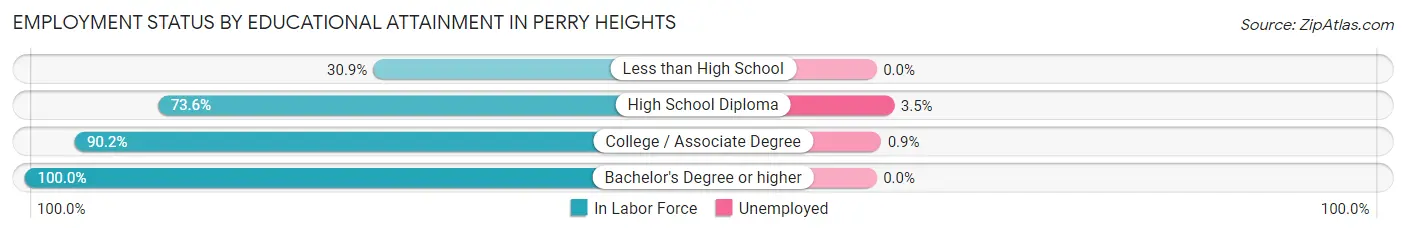
| Educational Attainment | In Labor Force | Unemployed |
| Less than High School | 113 (30.9%) | 0 (0.0%) |
| High School Diploma | 1,593 (73.6%) | 76 (3.5%) |
| College / Associate Degree | 1,450 (90.2%) | 14 (0.9%) |
| Bachelor's Degree or higher | 555 (100.0%) | 0 (0.0%) |
| Total | 3,711 (79.1%) | 89 (1.9%) |
Employment Occupations by Sex in Perry Heights
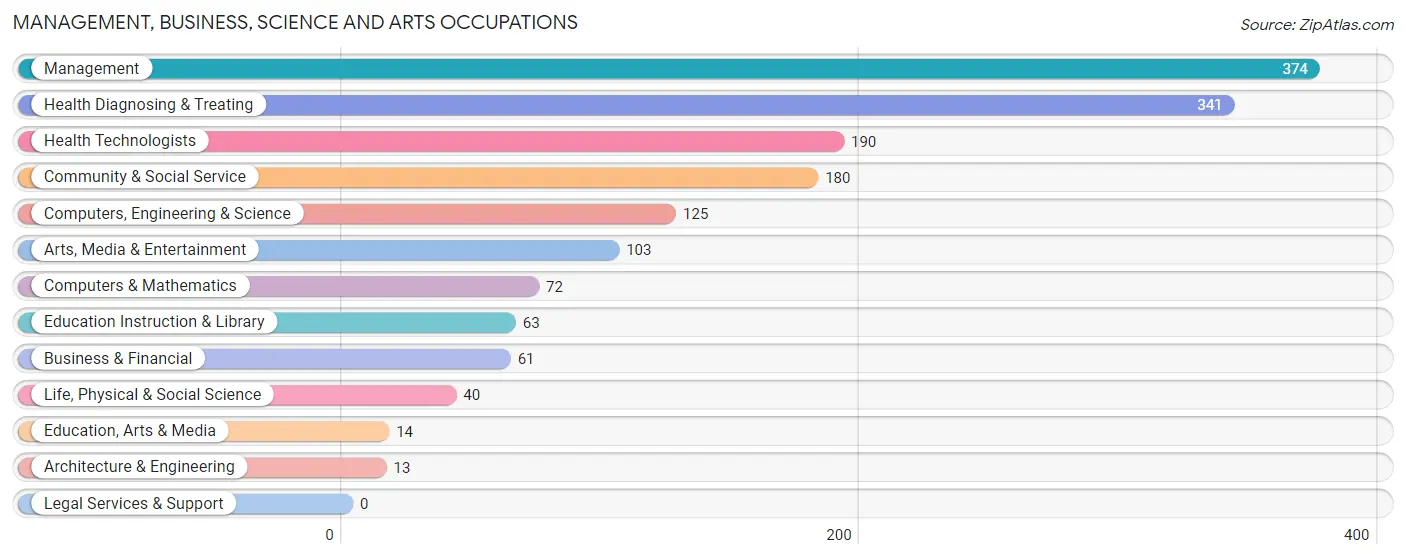
Management, Business, Science and Arts Occupations
The most common Management, Business, Science and Arts occupations in Perry Heights are Management (374 | 8.4%), Health Diagnosing & Treating (341 | 7.6%), Health Technologists (190 | 4.2%), Community & Social Service (180 | 4.0%), and Computers, Engineering & Science (125 | 2.8%).
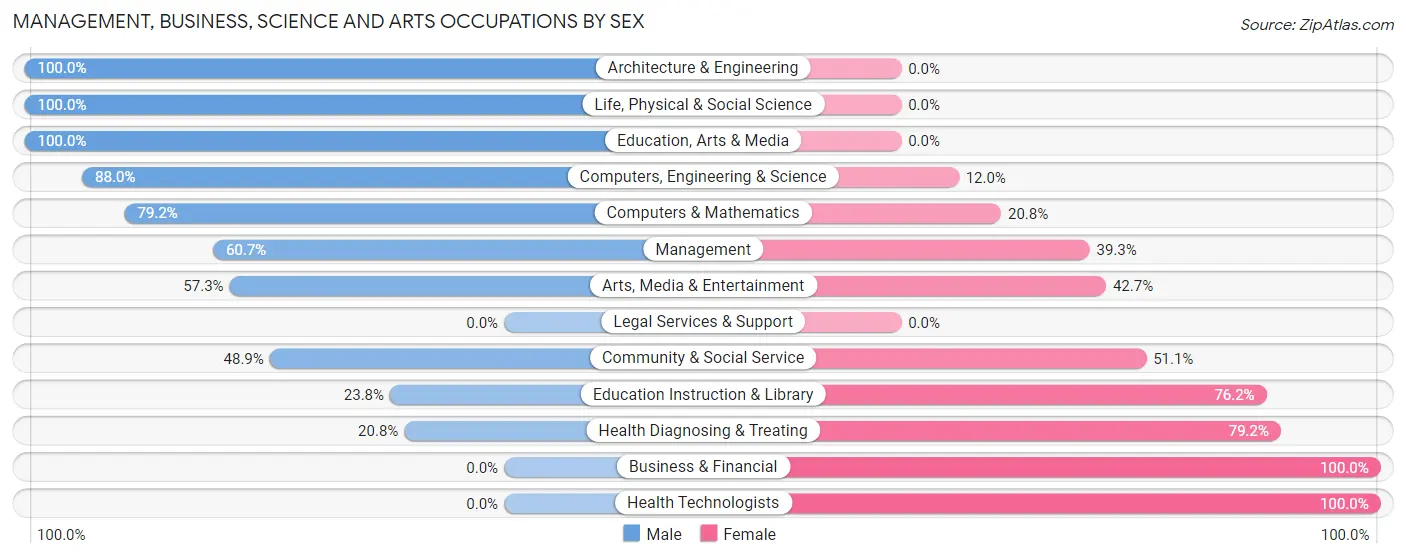
Management, Business, Science and Arts Occupations by Sex
Within the Management, Business, Science and Arts occupations in Perry Heights, the most male-oriented occupations are Architecture & Engineering (100.0%), Life, Physical & Social Science (100.0%), and Education, Arts & Media (100.0%), while the most female-oriented occupations are Business & Financial (100.0%), Health Technologists (100.0%), and Health Diagnosing & Treating (79.2%).
| Occupation | Male | Female |
| Management | 227 (60.7%) | 147 (39.3%) |
| Business & Financial | 0 (0.0%) | 61 (100.0%) |
| Computers, Engineering & Science | 110 (88.0%) | 15 (12.0%) |
| Computers & Mathematics | 57 (79.2%) | 15 (20.8%) |
| Architecture & Engineering | 13 (100.0%) | 0 (0.0%) |
| Life, Physical & Social Science | 40 (100.0%) | 0 (0.0%) |
| Community & Social Service | 88 (48.9%) | 92 (51.1%) |
| Education, Arts & Media | 14 (100.0%) | 0 (0.0%) |
| Legal Services & Support | 0 (0.0%) | 0 (0.0%) |
| Education Instruction & Library | 15 (23.8%) | 48 (76.2%) |
| Arts, Media & Entertainment | 59 (57.3%) | 44 (42.7%) |
| Health Diagnosing & Treating | 71 (20.8%) | 270 (79.2%) |
| Health Technologists | 0 (0.0%) | 190 (100.0%) |
| Total (Category) | 496 (45.9%) | 585 (54.1%) |
| Total (Overall) | 2,343 (52.3%) | 2,136 (47.7%) |
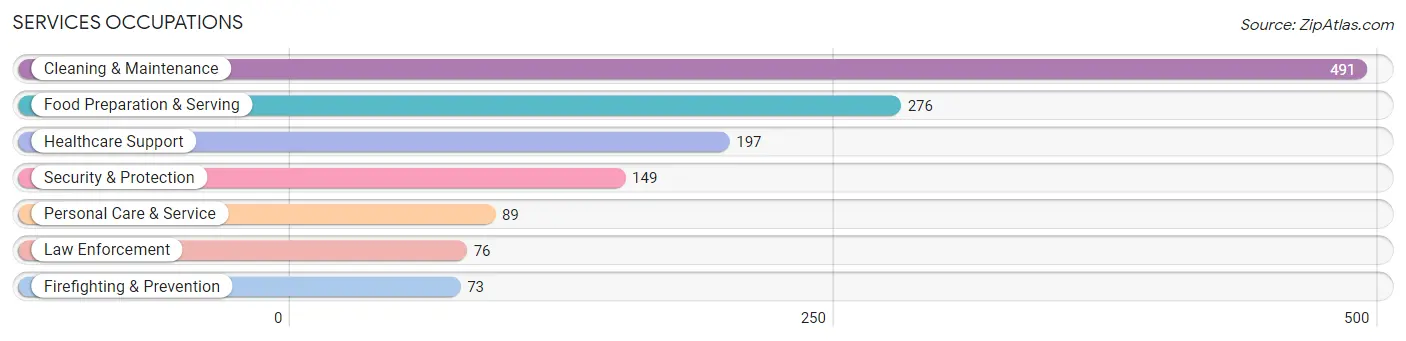
Services Occupations
The most common Services occupations in Perry Heights are Cleaning & Maintenance (491 | 11.0%), Food Preparation & Serving (276 | 6.2%), Healthcare Support (197 | 4.4%), Security & Protection (149 | 3.3%), and Personal Care & Service (89 | 2.0%).
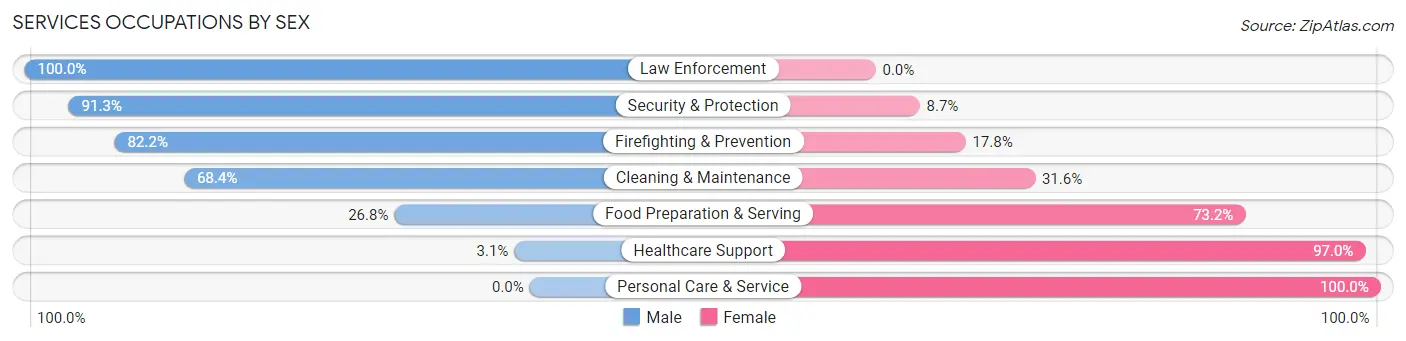
Services Occupations by Sex
Within the Services occupations in Perry Heights, the most male-oriented occupations are Law Enforcement (100.0%), Security & Protection (91.3%), and Firefighting & Prevention (82.2%), while the most female-oriented occupations are Personal Care & Service (100.0%), Healthcare Support (97.0%), and Food Preparation & Serving (73.2%).
| Occupation | Male | Female |
| Healthcare Support | 6 (3.0%) | 191 (97.0%) |
| Security & Protection | 136 (91.3%) | 13 (8.7%) |
| Firefighting & Prevention | 60 (82.2%) | 13 (17.8%) |
| Law Enforcement | 76 (100.0%) | 0 (0.0%) |
| Food Preparation & Serving | 74 (26.8%) | 202 (73.2%) |
| Cleaning & Maintenance | 336 (68.4%) | 155 (31.6%) |
| Personal Care & Service | 0 (0.0%) | 89 (100.0%) |
| Total (Category) | 552 (45.9%) | 650 (54.1%) |
| Total (Overall) | 2,343 (52.3%) | 2,136 (47.7%) |
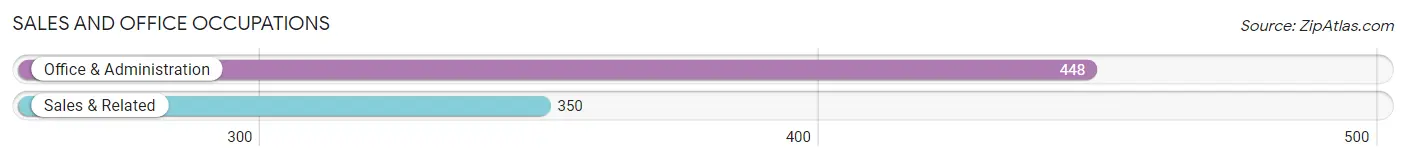
Sales and Office Occupations
The most common Sales and Office occupations in Perry Heights are Office & Administration (448 | 10.0%), and Sales & Related (350 | 7.8%).
Sales and Office Occupations by Sex
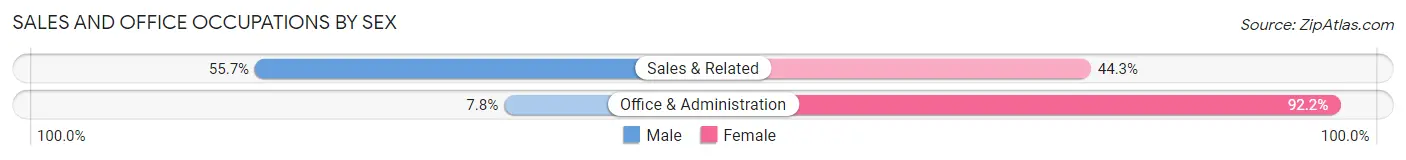
| Occupation | Male | Female |
| Sales & Related | 195 (55.7%) | 155 (44.3%) |
| Office & Administration | 35 (7.8%) | 413 (92.2%) |
| Total (Category) | 230 (28.8%) | 568 (71.2%) |
| Total (Overall) | 2,343 (52.3%) | 2,136 (47.7%) |
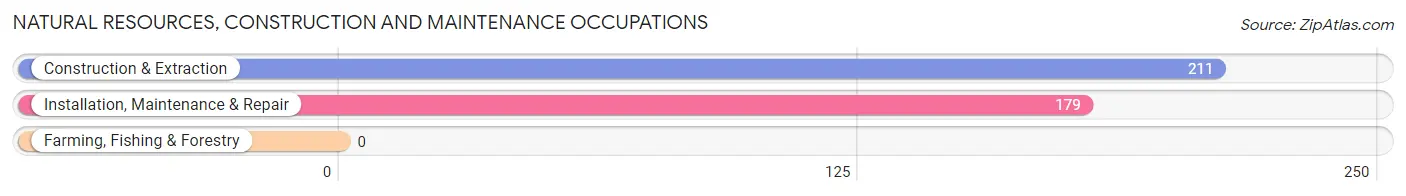
Natural Resources, Construction and Maintenance Occupations
The most common Natural Resources, Construction and Maintenance occupations in Perry Heights are Construction & Extraction (211 | 4.7%), and Installation, Maintenance & Repair (179 | 4.0%).
Natural Resources, Construction and Maintenance Occupations by Sex
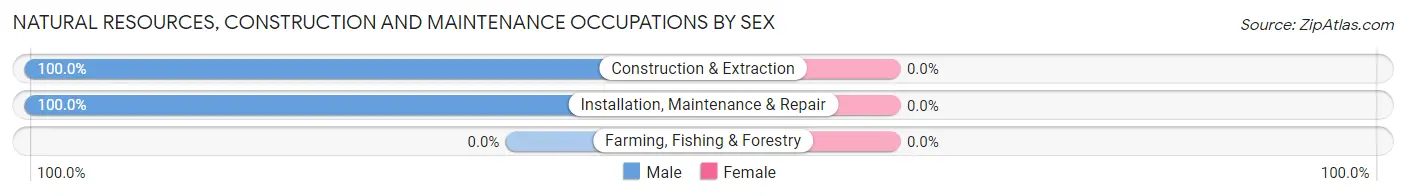
| Occupation | Male | Female |
| Farming, Fishing & Forestry | 0 (0.0%) | 0 (0.0%) |
| Construction & Extraction | 211 (100.0%) | 0 (0.0%) |
| Installation, Maintenance & Repair | 179 (100.0%) | 0 (0.0%) |
| Total (Category) | 390 (100.0%) | 0 (0.0%) |
| Total (Overall) | 2,343 (52.3%) | 2,136 (47.7%) |
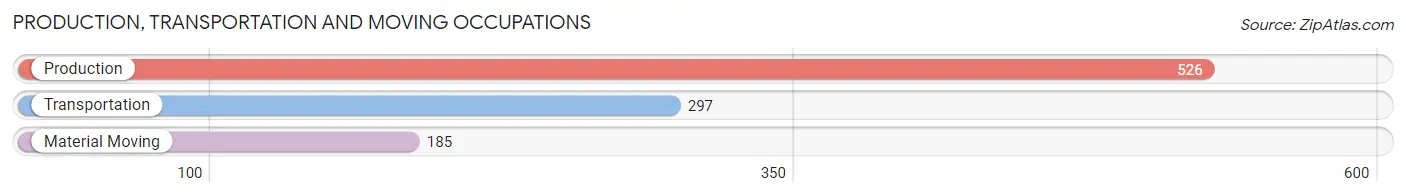
Production, Transportation and Moving Occupations
The most common Production, Transportation and Moving occupations in Perry Heights are Production (526 | 11.7%), Transportation (297 | 6.6%), and Material Moving (185 | 4.1%).
Production, Transportation and Moving Occupations by Sex
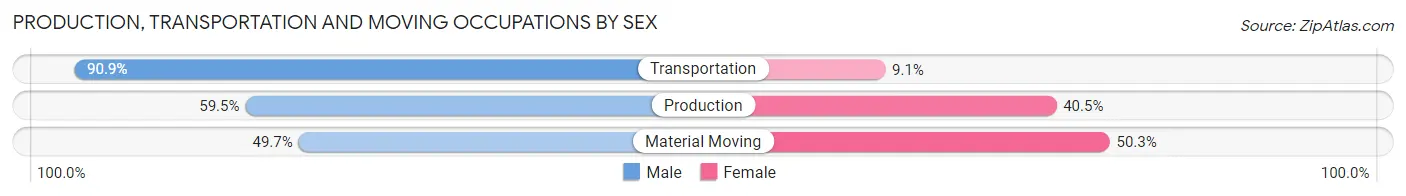
| Occupation | Male | Female |
| Production | 313 (59.5%) | 213 (40.5%) |
| Transportation | 270 (90.9%) | 27 (9.1%) |
| Material Moving | 92 (49.7%) | 93 (50.3%) |
| Total (Category) | 675 (67.0%) | 333 (33.0%) |
| Total (Overall) | 2,343 (52.3%) | 2,136 (47.7%) |
Employment Industries by Sex in Perry Heights
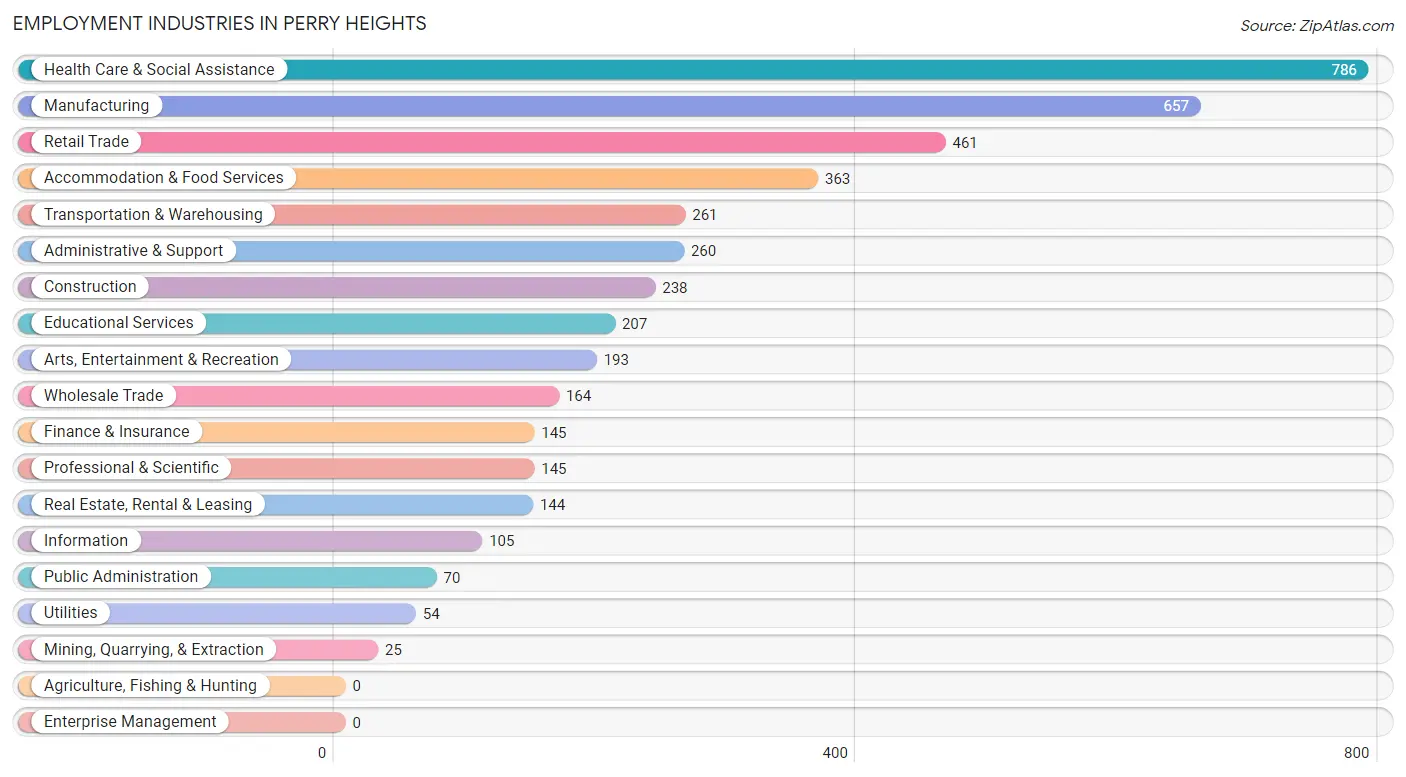
Employment Industries in Perry Heights
The major employment industries in Perry Heights include Health Care & Social Assistance (786 | 17.5%), Manufacturing (657 | 14.7%), Retail Trade (461 | 10.3%), Accommodation & Food Services (363 | 8.1%), and Transportation & Warehousing (261 | 5.8%).
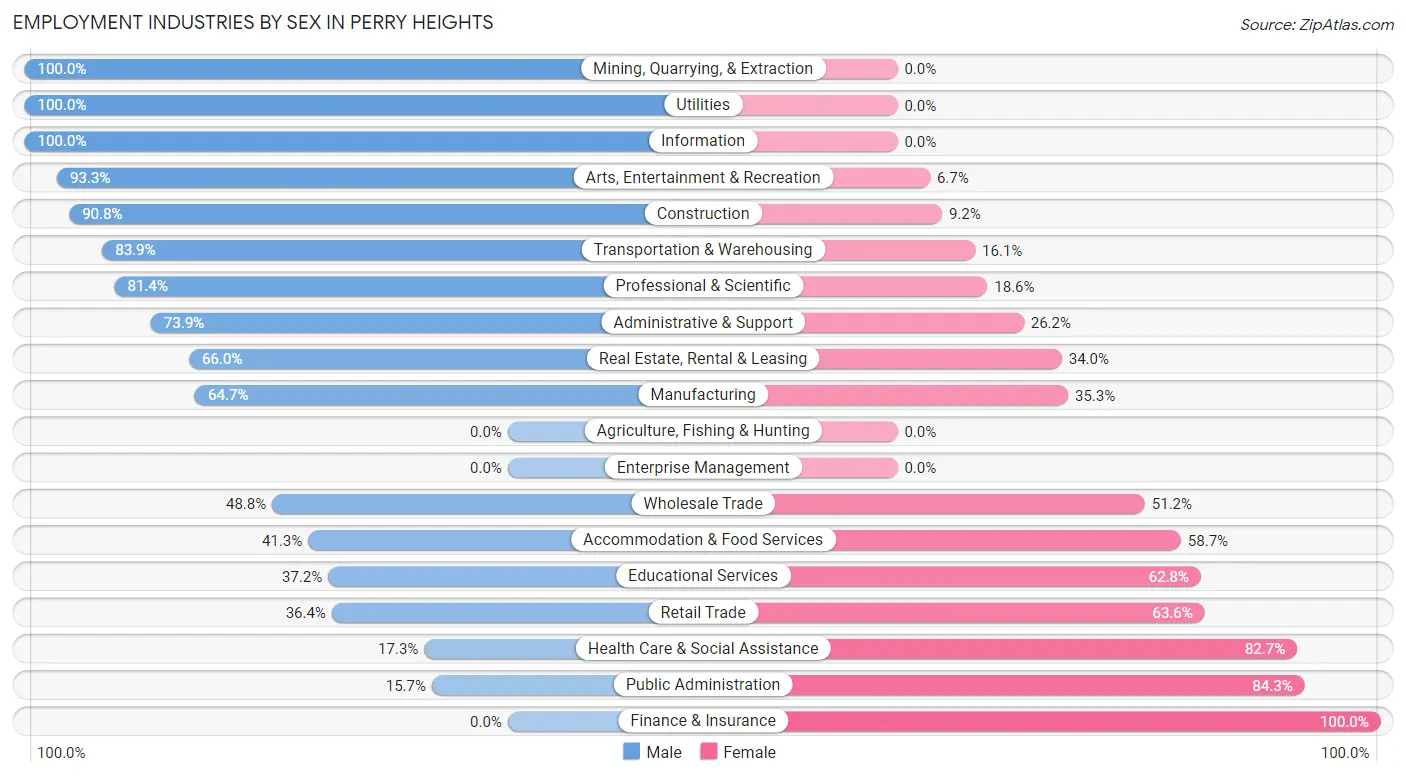
Employment Industries by Sex in Perry Heights
The Perry Heights industries that see more men than women are Mining, Quarrying, & Extraction (100.0%), Utilities (100.0%), and Information (100.0%), whereas the industries that tend to have a higher number of women are Finance & Insurance (100.0%), Public Administration (84.3%), and Health Care & Social Assistance (82.7%).
| Industry | Male | Female |
| Agriculture, Fishing & Hunting | 0 (0.0%) | 0 (0.0%) |
| Mining, Quarrying, & Extraction | 25 (100.0%) | 0 (0.0%) |
| Construction | 216 (90.8%) | 22 (9.2%) |
| Manufacturing | 425 (64.7%) | 232 (35.3%) |
| Wholesale Trade | 80 (48.8%) | 84 (51.2%) |
| Retail Trade | 168 (36.4%) | 293 (63.6%) |
| Transportation & Warehousing | 219 (83.9%) | 42 (16.1%) |
| Utilities | 54 (100.0%) | 0 (0.0%) |
| Information | 105 (100.0%) | 0 (0.0%) |
| Finance & Insurance | 0 (0.0%) | 145 (100.0%) |
| Real Estate, Rental & Leasing | 95 (66.0%) | 49 (34.0%) |
| Professional & Scientific | 118 (81.4%) | 27 (18.6%) |
| Enterprise Management | 0 (0.0%) | 0 (0.0%) |
| Administrative & Support | 192 (73.9%) | 68 (26.2%) |
| Educational Services | 77 (37.2%) | 130 (62.8%) |
| Health Care & Social Assistance | 136 (17.3%) | 650 (82.7%) |
| Arts, Entertainment & Recreation | 180 (93.3%) | 13 (6.7%) |
| Accommodation & Food Services | 150 (41.3%) | 213 (58.7%) |
| Public Administration | 11 (15.7%) | 59 (84.3%) |
| Total | 2,343 (52.3%) | 2,136 (47.7%) |
Education in Perry Heights
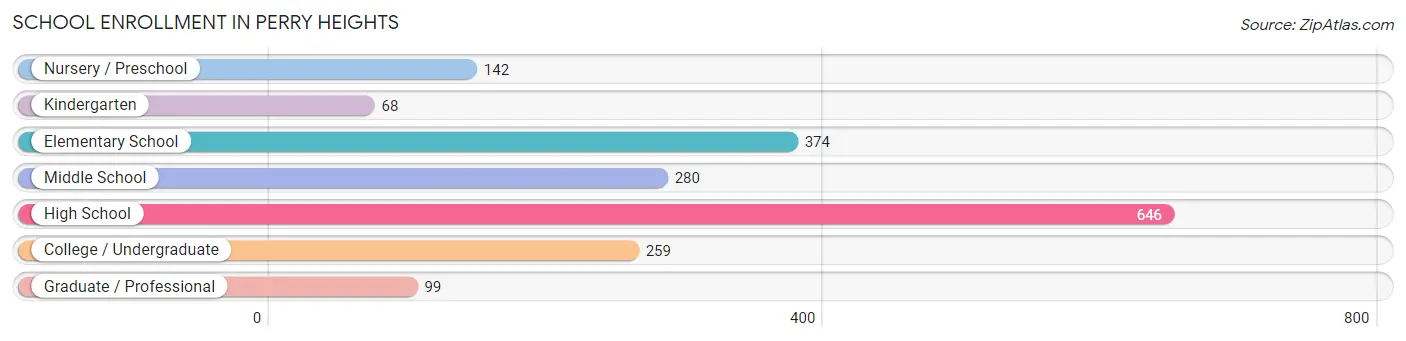
School Enrollment in Perry Heights
The most common levels of schooling among the 1,868 students in Perry Heights are high school (646 | 34.6%), elementary school (374 | 20.0%), and middle school (280 | 15.0%).
| School Level | # Students | % Students |
| Nursery / Preschool | 142 | 7.6% |
| Kindergarten | 68 | 3.6% |
| Elementary School | 374 | 20.0% |
| Middle School | 280 | 15.0% |
| High School | 646 | 34.6% |
| College / Undergraduate | 259 | 13.9% |
| Graduate / Professional | 99 | 5.3% |
| Total | 1,868 | 100.0% |
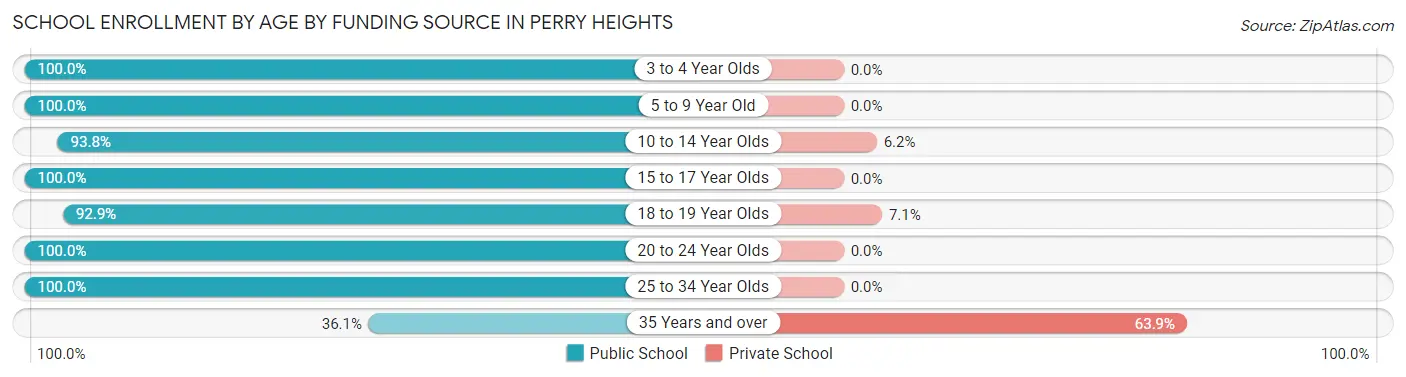
School Enrollment by Age by Funding Source in Perry Heights
Out of a total of 1,868 students who are enrolled in schools in Perry Heights, 99 (5.3%) attend a private institution, while the remaining 1,769 (94.7%) are enrolled in public schools. The age group of 35 years and over has the highest likelihood of being enrolled in private schools, with 62 (63.9% in the age bracket) enrolled. Conversely, the age group of 3 to 4 year olds has the lowest likelihood of being enrolled in a private school, with 142 (100.0% in the age bracket) attending a public institution.
| Age Bracket | Public School | Private School |
| 3 to 4 Year Olds | 142 (100.0%) | 0 (0.0%) |
| 5 to 9 Year Old | 417 (100.0%) | 0 (0.0%) |
| 10 to 14 Year Olds | 335 (93.8%) | 22 (6.2%) |
| 15 to 17 Year Olds | 425 (100.0%) | 0 (0.0%) |
| 18 to 19 Year Olds | 195 (92.9%) | 15 (7.1%) |
| 20 to 24 Year Olds | 89 (100.0%) | 0 (0.0%) |
| 25 to 34 Year Olds | 131 (100.0%) | 0 (0.0%) |
| 35 Years and over | 35 (36.1%) | 62 (63.9%) |
| Total | 1,769 (94.7%) | 99 (5.3%) |
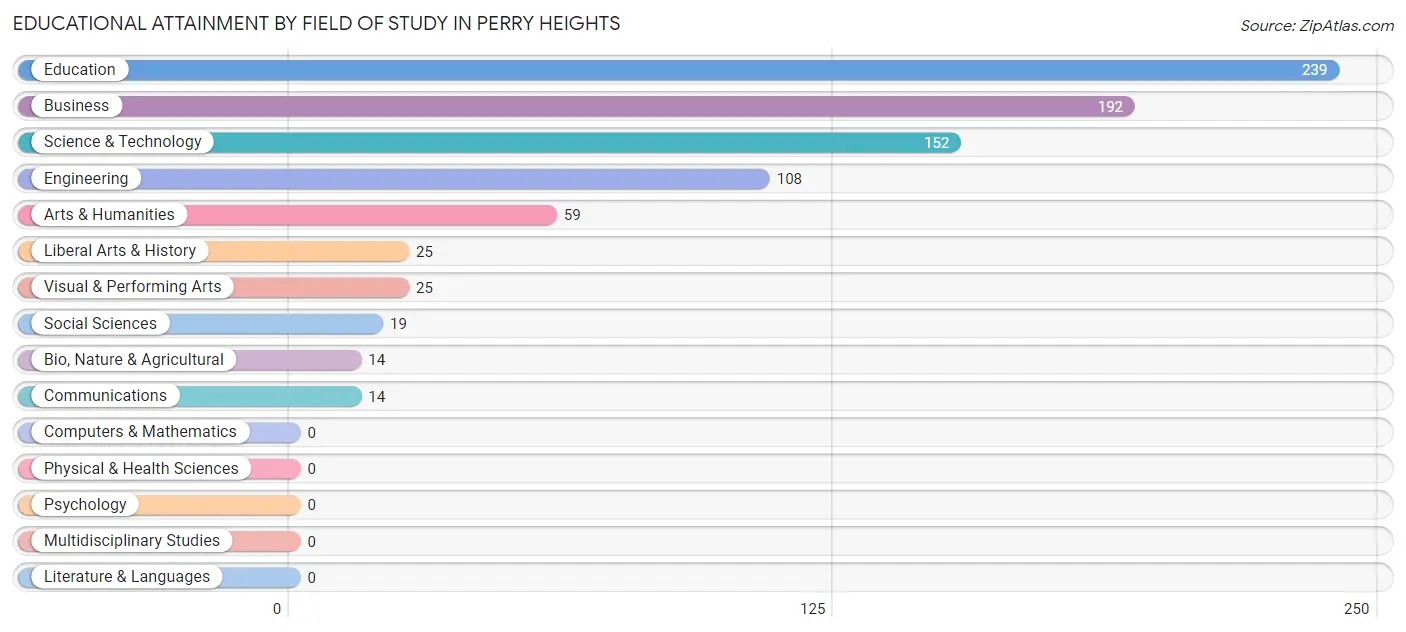
Educational Attainment by Field of Study in Perry Heights
Education (239 | 28.2%), business (192 | 22.7%), science & technology (152 | 17.9%), engineering (108 | 12.8%), and arts & humanities (59 | 7.0%) are the most common fields of study among 847 individuals in Perry Heights who have obtained a bachelor's degree or higher.
| Field of Study | # Graduates | % Graduates |
| Computers & Mathematics | 0 | 0.0% |
| Bio, Nature & Agricultural | 14 | 1.7% |
| Physical & Health Sciences | 0 | 0.0% |
| Psychology | 0 | 0.0% |
| Social Sciences | 19 | 2.2% |
| Engineering | 108 | 12.8% |
| Multidisciplinary Studies | 0 | 0.0% |
| Science & Technology | 152 | 17.9% |
| Business | 192 | 22.7% |
| Education | 239 | 28.2% |
| Literature & Languages | 0 | 0.0% |
| Liberal Arts & History | 25 | 2.9% |
| Visual & Performing Arts | 25 | 2.9% |
| Communications | 14 | 1.7% |
| Arts & Humanities | 59 | 7.0% |
| Total | 847 | 100.0% |
Transportation & Commute in Perry Heights
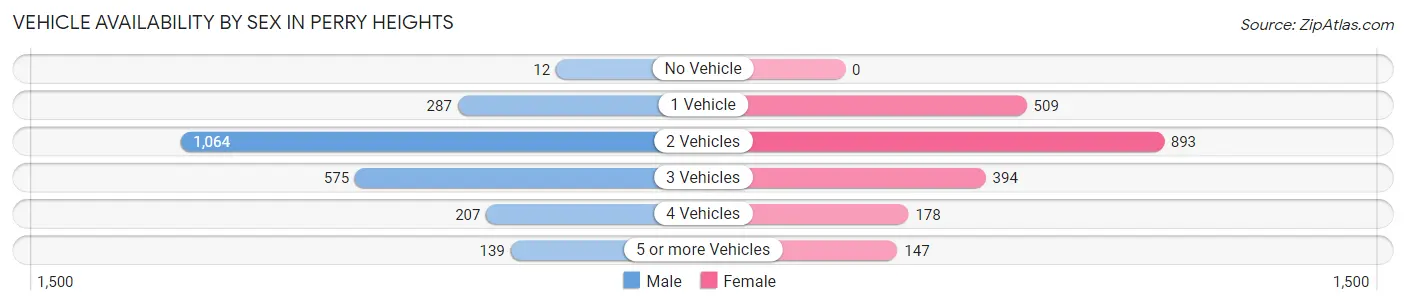
Vehicle Availability by Sex in Perry Heights
The most prevalent vehicle ownership categories in Perry Heights are males with 2 vehicles (1,064, accounting for 46.6%) and females with 2 vehicles (893, making up 50.2%).
| Vehicles Available | Male | Female |
| No Vehicle | 12 (0.5%) | 0 (0.0%) |
| 1 Vehicle | 287 (12.6%) | 509 (24.0%) |
| 2 Vehicles | 1,064 (46.6%) | 893 (42.1%) |
| 3 Vehicles | 575 (25.2%) | 394 (18.6%) |
| 4 Vehicles | 207 (9.1%) | 178 (8.4%) |
| 5 or more Vehicles | 139 (6.1%) | 147 (6.9%) |
| Total | 2,284 (100.0%) | 2,121 (100.0%) |
Commute Time in Perry Heights
The most frequently occuring commute durations in Perry Heights are 15 to 19 minutes (1,157 commuters, 28.5%), 10 to 14 minutes (720 commuters, 17.7%), and 20 to 24 minutes (531 commuters, 13.1%).
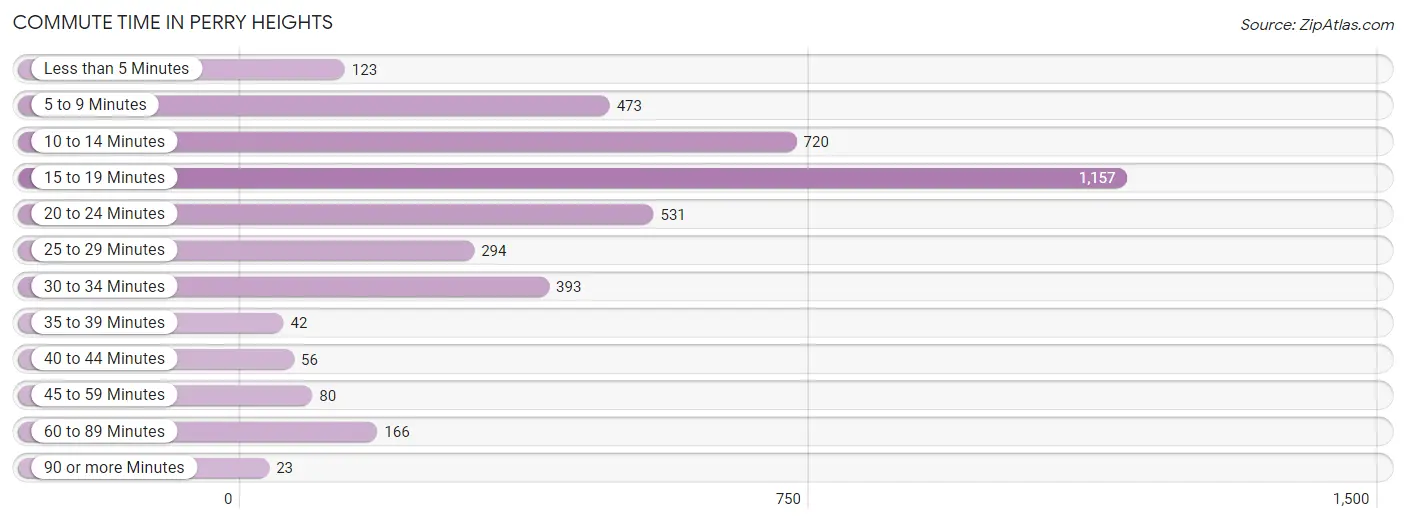
| Commute Time | # Commuters | % Commuters |
| Less than 5 Minutes | 123 | 3.0% |
| 5 to 9 Minutes | 473 | 11.7% |
| 10 to 14 Minutes | 720 | 17.7% |
| 15 to 19 Minutes | 1,157 | 28.5% |
| 20 to 24 Minutes | 531 | 13.1% |
| 25 to 29 Minutes | 294 | 7.2% |
| 30 to 34 Minutes | 393 | 9.7% |
| 35 to 39 Minutes | 42 | 1.0% |
| 40 to 44 Minutes | 56 | 1.4% |
| 45 to 59 Minutes | 80 | 2.0% |
| 60 to 89 Minutes | 166 | 4.1% |
| 90 or more Minutes | 23 | 0.6% |
Commute Time by Sex in Perry Heights
The most common commute times in Perry Heights are 15 to 19 minutes (581 commuters, 27.7%) for males and 15 to 19 minutes (576 commuters, 29.4%) for females.
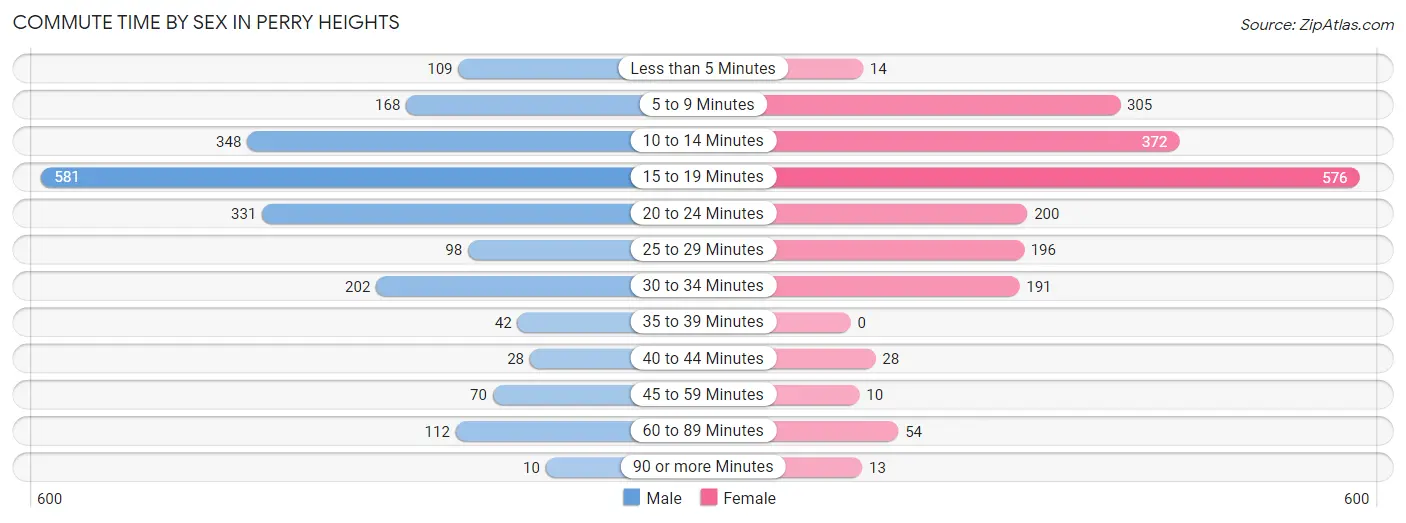
| Commute Time | Male | Female |
| Less than 5 Minutes | 109 (5.2%) | 14 (0.7%) |
| 5 to 9 Minutes | 168 (8.0%) | 305 (15.6%) |
| 10 to 14 Minutes | 348 (16.6%) | 372 (19.0%) |
| 15 to 19 Minutes | 581 (27.7%) | 576 (29.4%) |
| 20 to 24 Minutes | 331 (15.8%) | 200 (10.2%) |
| 25 to 29 Minutes | 98 (4.7%) | 196 (10.0%) |
| 30 to 34 Minutes | 202 (9.6%) | 191 (9.8%) |
| 35 to 39 Minutes | 42 (2.0%) | 0 (0.0%) |
| 40 to 44 Minutes | 28 (1.3%) | 28 (1.4%) |
| 45 to 59 Minutes | 70 (3.3%) | 10 (0.5%) |
| 60 to 89 Minutes | 112 (5.3%) | 54 (2.8%) |
| 90 or more Minutes | 10 (0.5%) | 13 (0.7%) |
Time of Departure to Work by Sex in Perry Heights
The most frequent times of departure to work in Perry Heights are 4:00 PM to 11:59 PM (379, 18.1%) for males and 7:00 AM to 7:29 AM (392, 20.0%) for females.
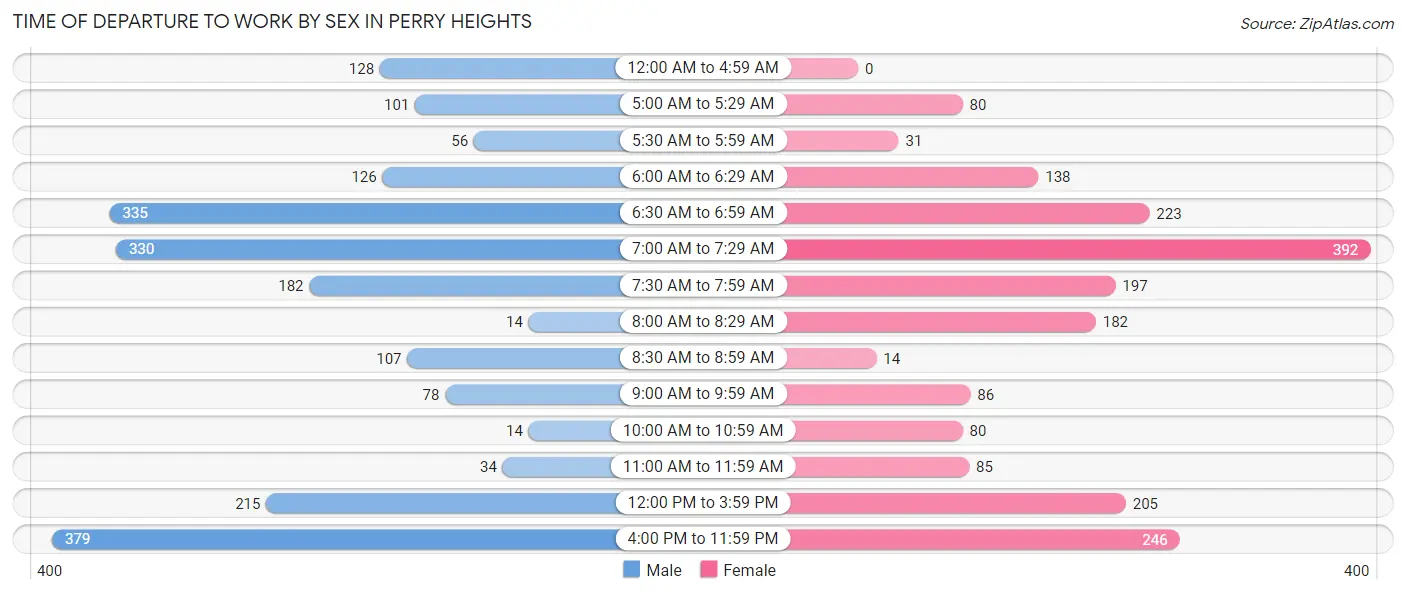
| Time of Departure | Male | Female |
| 12:00 AM to 4:59 AM | 128 (6.1%) | 0 (0.0%) |
| 5:00 AM to 5:29 AM | 101 (4.8%) | 80 (4.1%) |
| 5:30 AM to 5:59 AM | 56 (2.7%) | 31 (1.6%) |
| 6:00 AM to 6:29 AM | 126 (6.0%) | 138 (7.0%) |
| 6:30 AM to 6:59 AM | 335 (16.0%) | 223 (11.4%) |
| 7:00 AM to 7:29 AM | 330 (15.7%) | 392 (20.0%) |
| 7:30 AM to 7:59 AM | 182 (8.7%) | 197 (10.1%) |
| 8:00 AM to 8:29 AM | 14 (0.7%) | 182 (9.3%) |
| 8:30 AM to 8:59 AM | 107 (5.1%) | 14 (0.7%) |
| 9:00 AM to 9:59 AM | 78 (3.7%) | 86 (4.4%) |
| 10:00 AM to 10:59 AM | 14 (0.7%) | 80 (4.1%) |
| 11:00 AM to 11:59 AM | 34 (1.6%) | 85 (4.3%) |
| 12:00 PM to 3:59 PM | 215 (10.2%) | 205 (10.5%) |
| 4:00 PM to 11:59 PM | 379 (18.1%) | 246 (12.6%) |
| Total | 2,099 (100.0%) | 1,959 (100.0%) |
Housing Occupancy in Perry Heights
Occupancy by Ownership in Perry Heights
Of the total 3,384 dwellings in Perry Heights, owner-occupied units account for 2,260 (66.8%), while renter-occupied units make up 1,124 (33.2%).
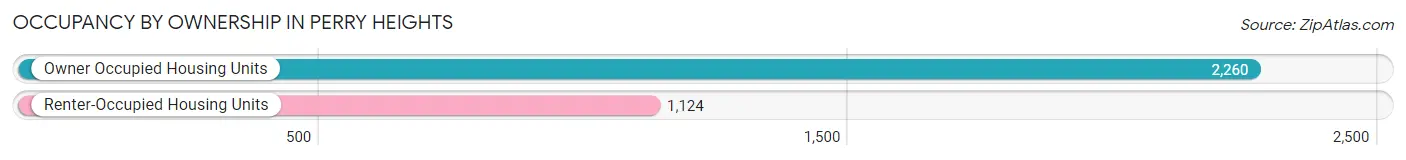
| Occupancy | # Housing Units | % Housing Units |
| Owner Occupied Housing Units | 2,260 | 66.8% |
| Renter-Occupied Housing Units | 1,124 | 33.2% |
| Total Occupied Housing Units | 3,384 | 100.0% |
Occupancy by Household Size in Perry Heights
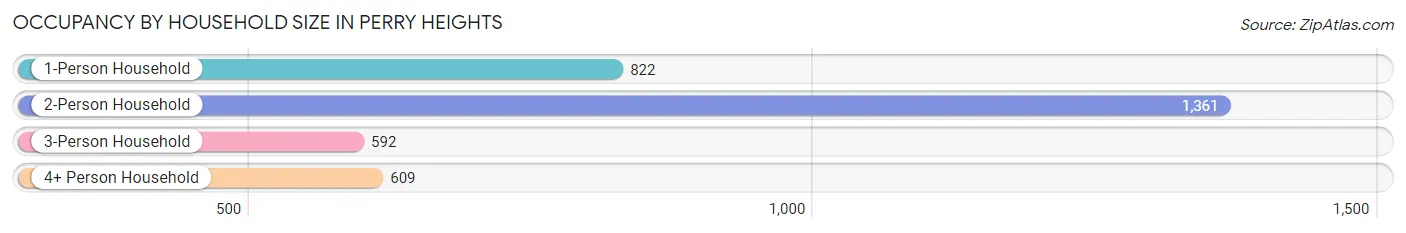
| Household Size | # Housing Units | % Housing Units |
| 1-Person Household | 822 | 24.3% |
| 2-Person Household | 1,361 | 40.2% |
| 3-Person Household | 592 | 17.5% |
| 4+ Person Household | 609 | 18.0% |
| Total Housing Units | 3,384 | 100.0% |
Occupancy by Ownership by Household Size in Perry Heights
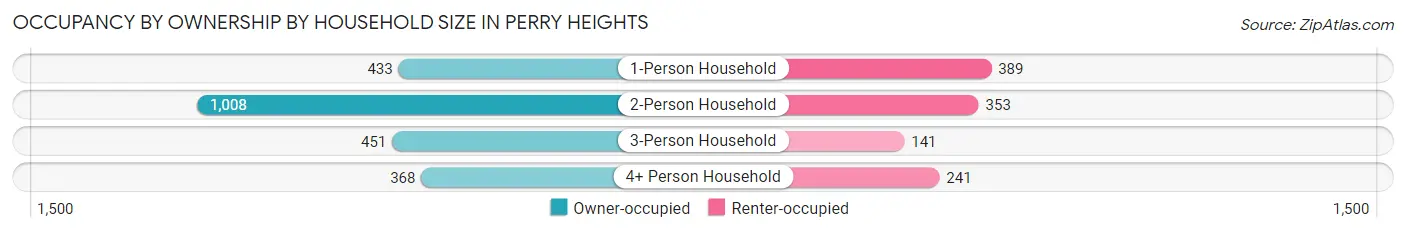
| Household Size | Owner-occupied | Renter-occupied |
| 1-Person Household | 433 (52.7%) | 389 (47.3%) |
| 2-Person Household | 1,008 (74.1%) | 353 (25.9%) |
| 3-Person Household | 451 (76.2%) | 141 (23.8%) |
| 4+ Person Household | 368 (60.4%) | 241 (39.6%) |
| Total Housing Units | 2,260 (66.8%) | 1,124 (33.2%) |
Occupancy by Educational Attainment in Perry Heights
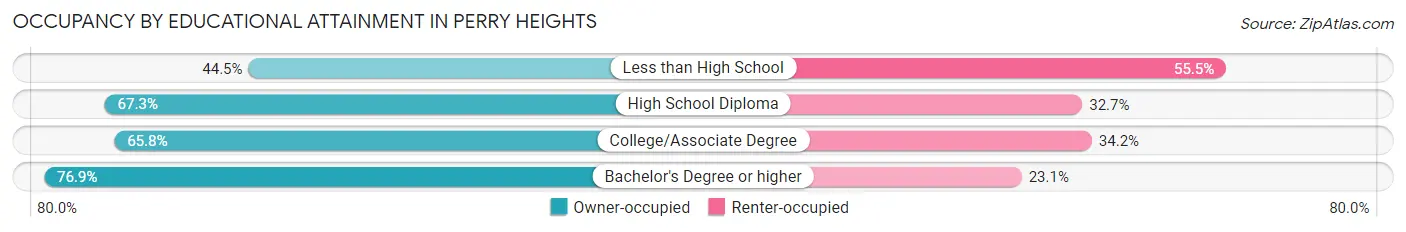
| Household Size | Owner-occupied | Renter-occupied |
| Less than High School | 81 (44.5%) | 101 (55.5%) |
| High School Diploma | 961 (67.3%) | 467 (32.7%) |
| College/Associate Degree | 865 (65.8%) | 450 (34.2%) |
| Bachelor's Degree or higher | 353 (76.9%) | 106 (23.1%) |
Occupancy by Age of Householder in Perry Heights
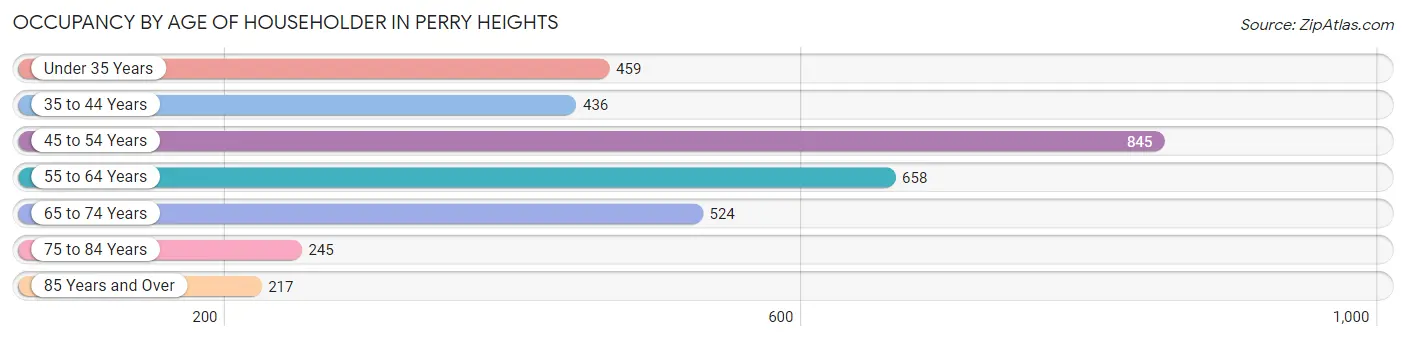
| Age Bracket | # Households | % Households |
| Under 35 Years | 459 | 13.6% |
| 35 to 44 Years | 436 | 12.9% |
| 45 to 54 Years | 845 | 25.0% |
| 55 to 64 Years | 658 | 19.4% |
| 65 to 74 Years | 524 | 15.5% |
| 75 to 84 Years | 245 | 7.2% |
| 85 Years and Over | 217 | 6.4% |
| Total | 3,384 | 100.0% |
Housing Finances in Perry Heights
Median Income by Occupancy in Perry Heights
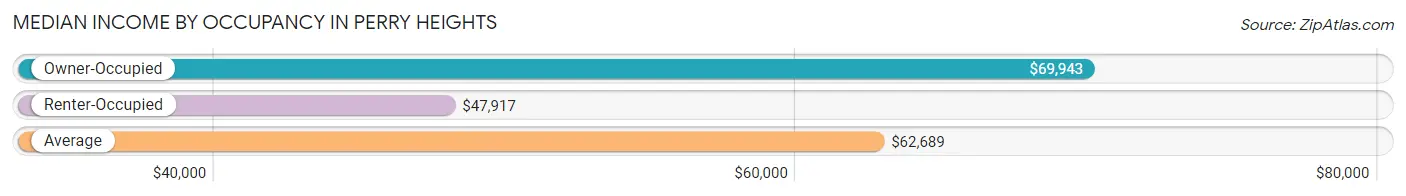
| Occupancy Type | # Households | Median Income |
| Owner-Occupied | 2,260 (66.8%) | $69,943 |
| Renter-Occupied | 1,124 (33.2%) | $47,917 |
| Average | 3,384 (100.0%) | $62,689 |
Occupancy by Householder Income Bracket in Perry Heights
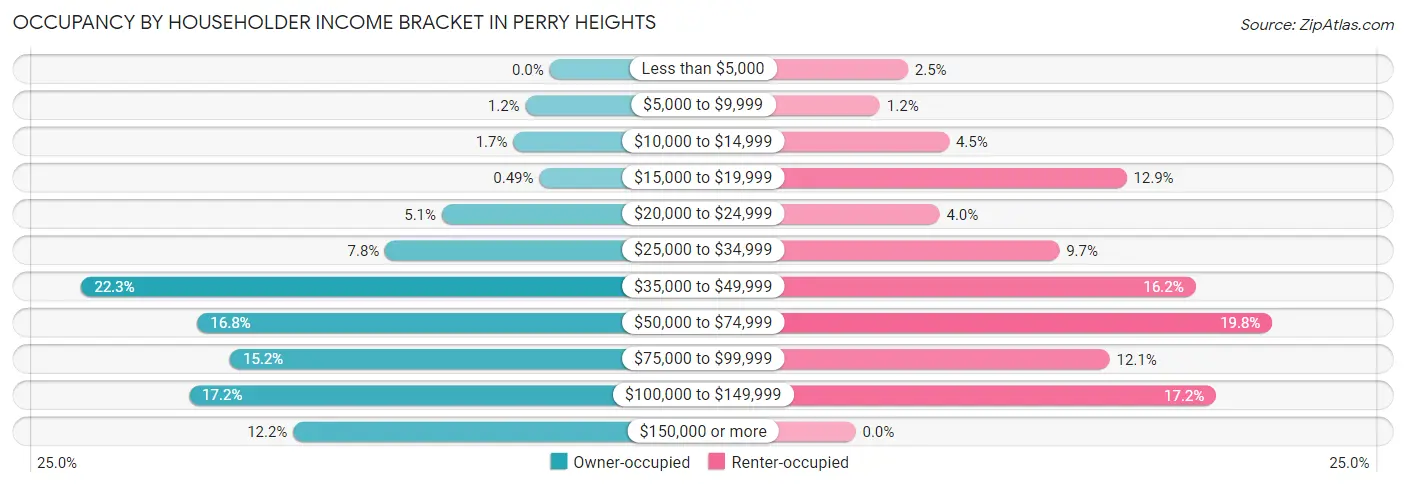
| Income Bracket | Owner-occupied | Renter-occupied |
| Less than $5,000 | 0 (0.0%) | 28 (2.5%) |
| $5,000 to $9,999 | 26 (1.1%) | 13 (1.2%) |
| $10,000 to $14,999 | 39 (1.7%) | 50 (4.4%) |
| $15,000 to $19,999 | 11 (0.5%) | 145 (12.9%) |
| $20,000 to $24,999 | 116 (5.1%) | 45 (4.0%) |
| $25,000 to $34,999 | 177 (7.8%) | 109 (9.7%) |
| $35,000 to $49,999 | 504 (22.3%) | 182 (16.2%) |
| $50,000 to $74,999 | 379 (16.8%) | 223 (19.8%) |
| $75,000 to $99,999 | 344 (15.2%) | 136 (12.1%) |
| $100,000 to $149,999 | 388 (17.2%) | 193 (17.2%) |
| $150,000 or more | 276 (12.2%) | 0 (0.0%) |
| Total | 2,260 (100.0%) | 1,124 (100.0%) |
Monthly Housing Cost Tiers in Perry Heights
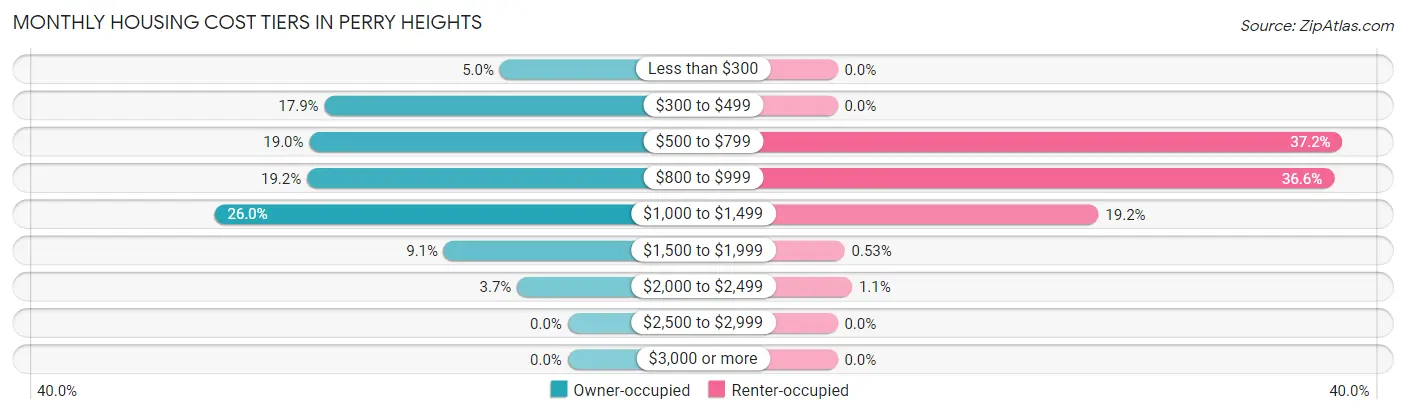
| Monthly Cost | Owner-occupied | Renter-occupied |
| Less than $300 | 113 (5.0%) | 0 (0.0%) |
| $300 to $499 | 405 (17.9%) | 0 (0.0%) |
| $500 to $799 | 430 (19.0%) | 418 (37.2%) |
| $800 to $999 | 434 (19.2%) | 411 (36.6%) |
| $1,000 to $1,499 | 588 (26.0%) | 216 (19.2%) |
| $1,500 to $1,999 | 206 (9.1%) | 6 (0.5%) |
| $2,000 to $2,499 | 84 (3.7%) | 12 (1.1%) |
| $2,500 to $2,999 | 0 (0.0%) | 0 (0.0%) |
| $3,000 or more | 0 (0.0%) | 0 (0.0%) |
| Total | 2,260 (100.0%) | 1,124 (100.0%) |
Physical Housing Characteristics in Perry Heights
Housing Structures in Perry Heights
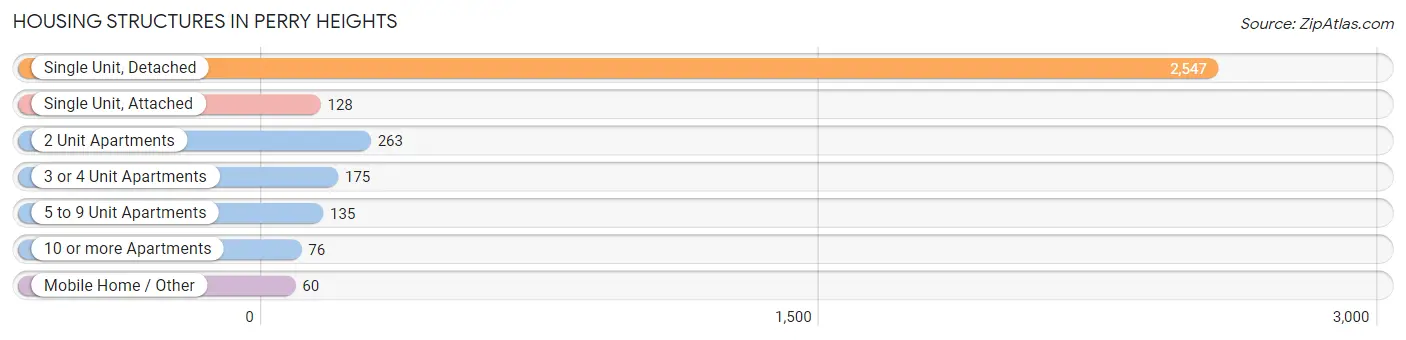
| Structure Type | # Housing Units | % Housing Units |
| Single Unit, Detached | 2,547 | 75.3% |
| Single Unit, Attached | 128 | 3.8% |
| 2 Unit Apartments | 263 | 7.8% |
| 3 or 4 Unit Apartments | 175 | 5.2% |
| 5 to 9 Unit Apartments | 135 | 4.0% |
| 10 or more Apartments | 76 | 2.2% |
| Mobile Home / Other | 60 | 1.8% |
| Total | 3,384 | 100.0% |
Housing Structures by Occupancy in Perry Heights
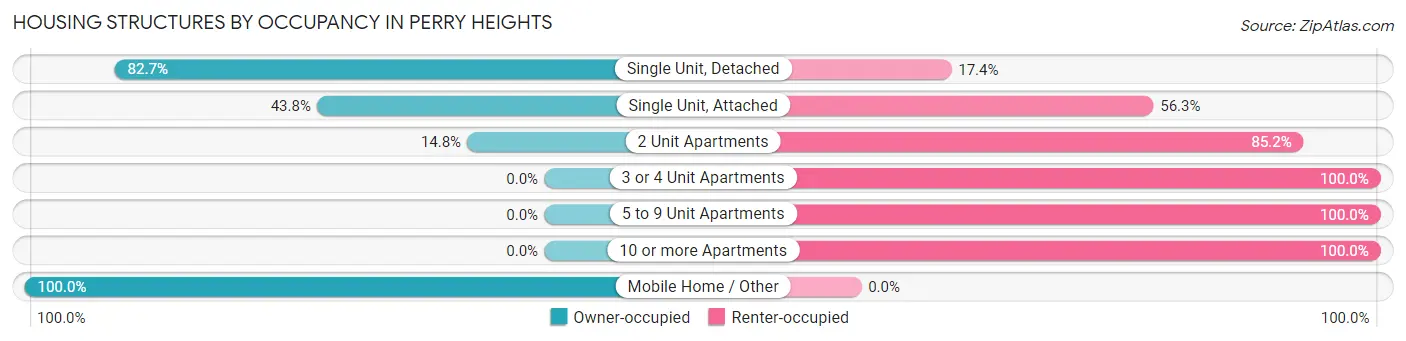
| Structure Type | Owner-occupied | Renter-occupied |
| Single Unit, Detached | 2,105 (82.7%) | 442 (17.3%) |
| Single Unit, Attached | 56 (43.8%) | 72 (56.2%) |
| 2 Unit Apartments | 39 (14.8%) | 224 (85.2%) |
| 3 or 4 Unit Apartments | 0 (0.0%) | 175 (100.0%) |
| 5 to 9 Unit Apartments | 0 (0.0%) | 135 (100.0%) |
| 10 or more Apartments | 0 (0.0%) | 76 (100.0%) |
| Mobile Home / Other | 60 (100.0%) | 0 (0.0%) |
| Total | 2,260 (66.8%) | 1,124 (33.2%) |
Housing Structures by Number of Rooms in Perry Heights
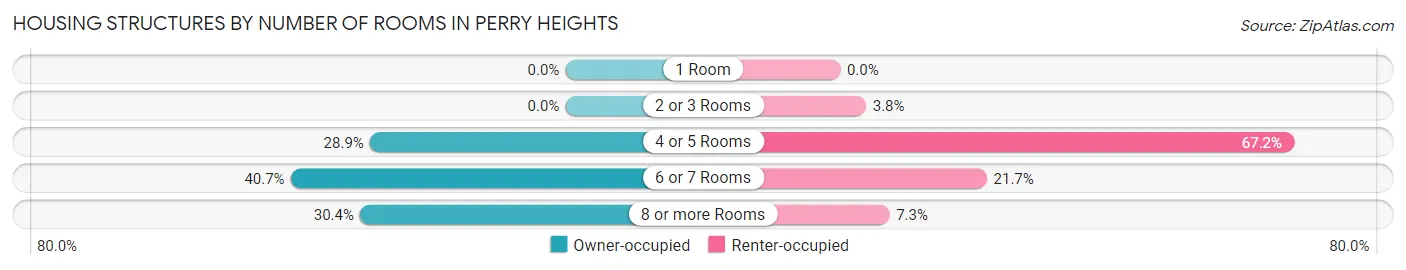
| Number of Rooms | Owner-occupied | Renter-occupied |
| 1 Room | 0 (0.0%) | 0 (0.0%) |
| 2 or 3 Rooms | 0 (0.0%) | 43 (3.8%) |
| 4 or 5 Rooms | 654 (28.9%) | 755 (67.2%) |
| 6 or 7 Rooms | 919 (40.7%) | 244 (21.7%) |
| 8 or more Rooms | 687 (30.4%) | 82 (7.3%) |
| Total | 2,260 (100.0%) | 1,124 (100.0%) |
Housing Structure by Heating Type in Perry Heights
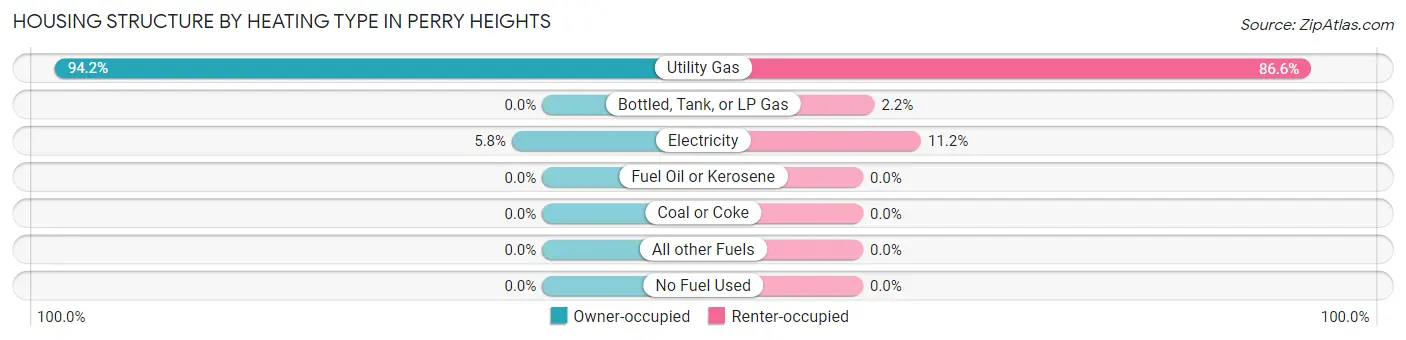
| Heating Type | Owner-occupied | Renter-occupied |
| Utility Gas | 2,128 (94.2%) | 973 (86.6%) |
| Bottled, Tank, or LP Gas | 0 (0.0%) | 25 (2.2%) |
| Electricity | 132 (5.8%) | 126 (11.2%) |
| Fuel Oil or Kerosene | 0 (0.0%) | 0 (0.0%) |
| Coal or Coke | 0 (0.0%) | 0 (0.0%) |
| All other Fuels | 0 (0.0%) | 0 (0.0%) |
| No Fuel Used | 0 (0.0%) | 0 (0.0%) |
| Total | 2,260 (100.0%) | 1,124 (100.0%) |
Household Vehicle Usage in Perry Heights
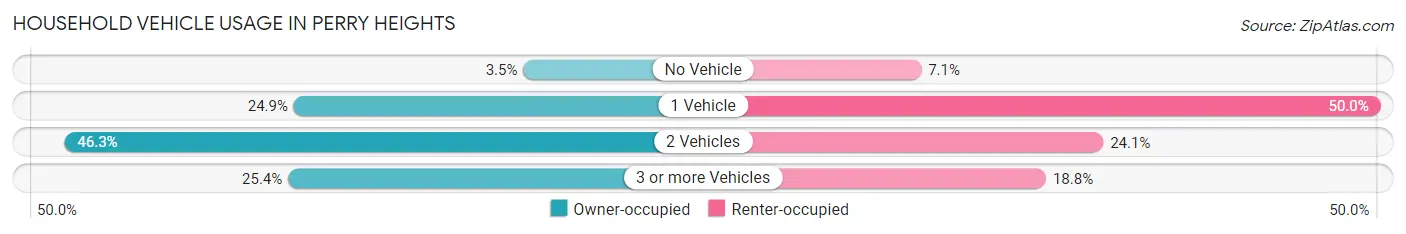
| Vehicles per Household | Owner-occupied | Renter-occupied |
| No Vehicle | 78 (3.5%) | 80 (7.1%) |
| 1 Vehicle | 562 (24.9%) | 562 (50.0%) |
| 2 Vehicles | 1,046 (46.3%) | 271 (24.1%) |
| 3 or more Vehicles | 574 (25.4%) | 211 (18.8%) |
| Total | 2,260 (100.0%) | 1,124 (100.0%) |
Real Estate & Mortgages in Perry Heights
Real Estate and Mortgage Overview in Perry Heights
| Characteristic | Without Mortgage | With Mortgage |
| Housing Units | 756 | 1,504 |
| Median Property Value | $130,900 | $148,400 |
| Median Household Income | $51,154 | $167 |
| Monthly Housing Costs | $427 | $0 |
| Real Estate Taxes | $1,538 | $27 |
Property Value by Mortgage Status in Perry Heights
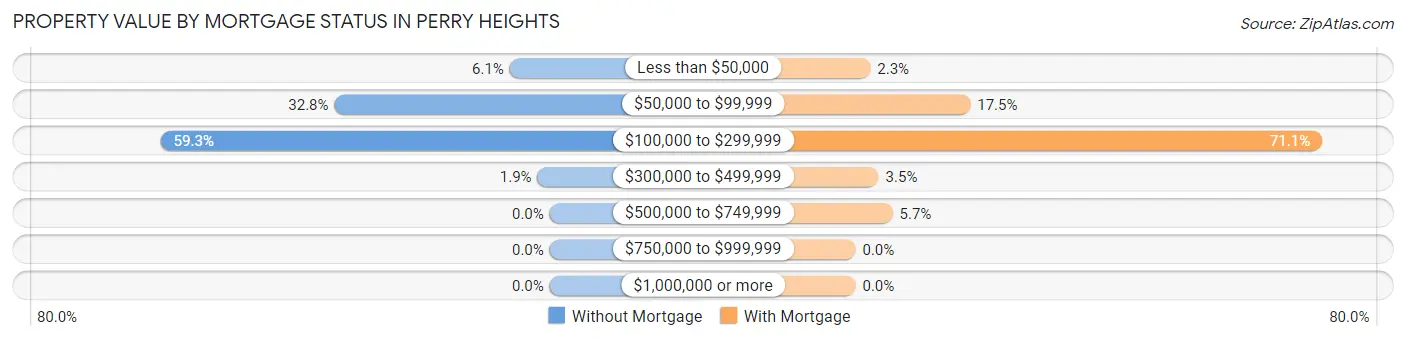
| Property Value | Without Mortgage | With Mortgage |
| Less than $50,000 | 46 (6.1%) | 34 (2.3%) |
| $50,000 to $99,999 | 248 (32.8%) | 263 (17.5%) |
| $100,000 to $299,999 | 448 (59.3%) | 1,069 (71.1%) |
| $300,000 to $499,999 | 14 (1.8%) | 53 (3.5%) |
| $500,000 to $749,999 | 0 (0.0%) | 85 (5.7%) |
| $750,000 to $999,999 | 0 (0.0%) | 0 (0.0%) |
| $1,000,000 or more | 0 (0.0%) | 0 (0.0%) |
| Total | 756 (100.0%) | 1,504 (100.0%) |
Household Income by Mortgage Status in Perry Heights
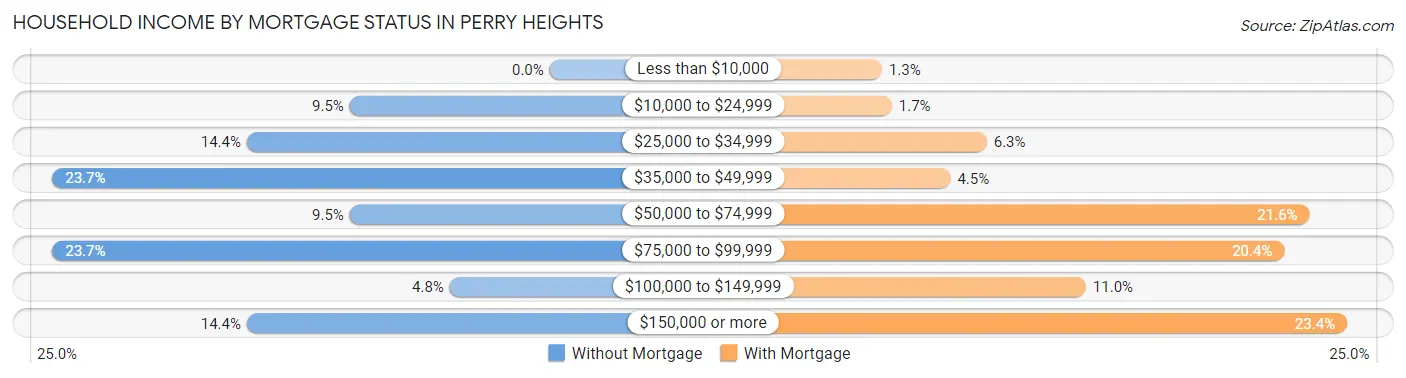
| Household Income | Without Mortgage | With Mortgage |
| Less than $10,000 | 0 (0.0%) | 19 (1.3%) |
| $10,000 to $24,999 | 72 (9.5%) | 26 (1.7%) |
| $25,000 to $34,999 | 109 (14.4%) | 94 (6.2%) |
| $35,000 to $49,999 | 179 (23.7%) | 68 (4.5%) |
| $50,000 to $74,999 | 72 (9.5%) | 325 (21.6%) |
| $75,000 to $99,999 | 179 (23.7%) | 307 (20.4%) |
| $100,000 to $149,999 | 36 (4.8%) | 165 (11.0%) |
| $150,000 or more | 109 (14.4%) | 352 (23.4%) |
| Total | 756 (100.0%) | 1,504 (100.0%) |
Property Value to Household Income Ratio in Perry Heights
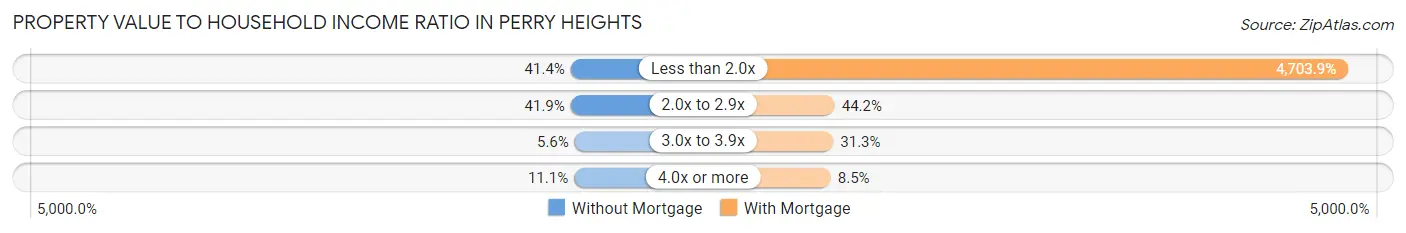
| Value-to-Income Ratio | Without Mortgage | With Mortgage |
| Less than 2.0x | 313 (41.4%) | 70,746 (4,703.9%) |
| 2.0x to 2.9x | 317 (41.9%) | 665 (44.2%) |
| 3.0x to 3.9x | 42 (5.6%) | 471 (31.3%) |
| 4.0x or more | 84 (11.1%) | 128 (8.5%) |
| Total | 756 (100.0%) | 1,504 (100.0%) |
Real Estate Taxes by Mortgage Status in Perry Heights
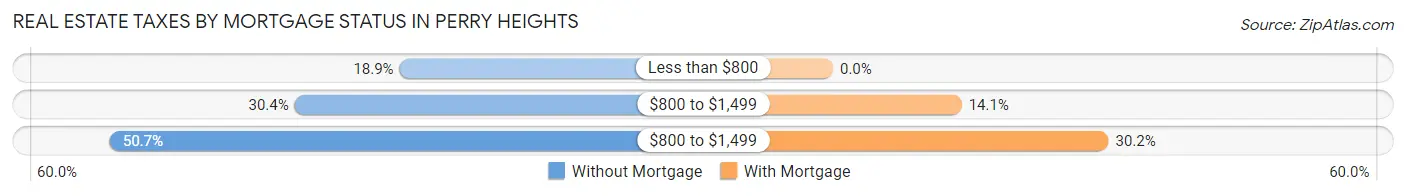
| Property Taxes | Without Mortgage | With Mortgage |
| Less than $800 | 143 (18.9%) | 0 (0.0%) |
| $800 to $1,499 | 230 (30.4%) | 212 (14.1%) |
| $800 to $1,499 | 383 (50.7%) | 454 (30.2%) |
| Total | 756 (100.0%) | 1,504 (100.0%) |
Health & Disability in Perry Heights
Health Insurance Coverage by Age in Perry Heights
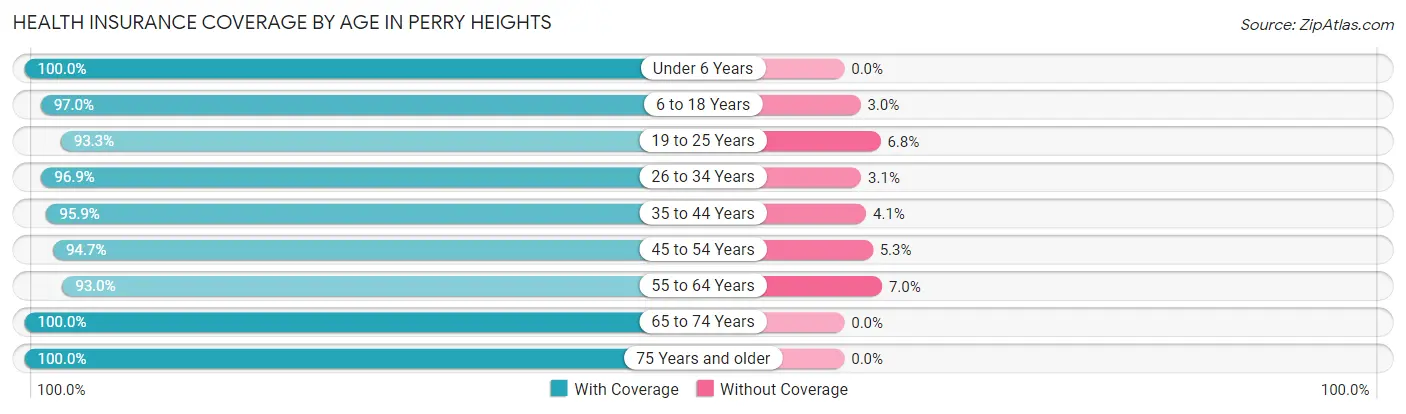
| Age Bracket | With Coverage | Without Coverage |
| Under 6 Years | 510 (100.0%) | 0 (0.0%) |
| 6 to 18 Years | 1,323 (97.0%) | 41 (3.0%) |
| 19 to 25 Years | 704 (93.2%) | 51 (6.8%) |
| 26 to 34 Years | 863 (96.9%) | 28 (3.1%) |
| 35 to 44 Years | 801 (95.9%) | 34 (4.1%) |
| 45 to 54 Years | 1,502 (94.7%) | 84 (5.3%) |
| 55 to 64 Years | 1,018 (93.0%) | 77 (7.0%) |
| 65 to 74 Years | 838 (100.0%) | 0 (0.0%) |
| 75 Years and older | 697 (100.0%) | 0 (0.0%) |
| Total | 8,256 (96.3%) | 315 (3.7%) |
Health Insurance Coverage by Citizenship Status in Perry Heights
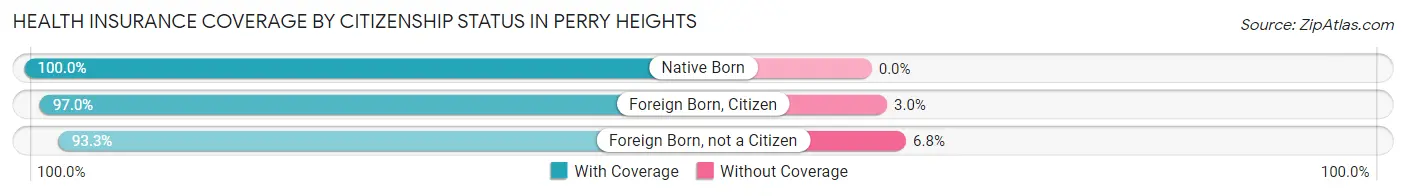
| Citizenship Status | With Coverage | Without Coverage |
| Native Born | 510 (100.0%) | 0 (0.0%) |
| Foreign Born, Citizen | 1,323 (97.0%) | 41 (3.0%) |
| Foreign Born, not a Citizen | 704 (93.2%) | 51 (6.8%) |
Health Insurance Coverage by Household Income in Perry Heights
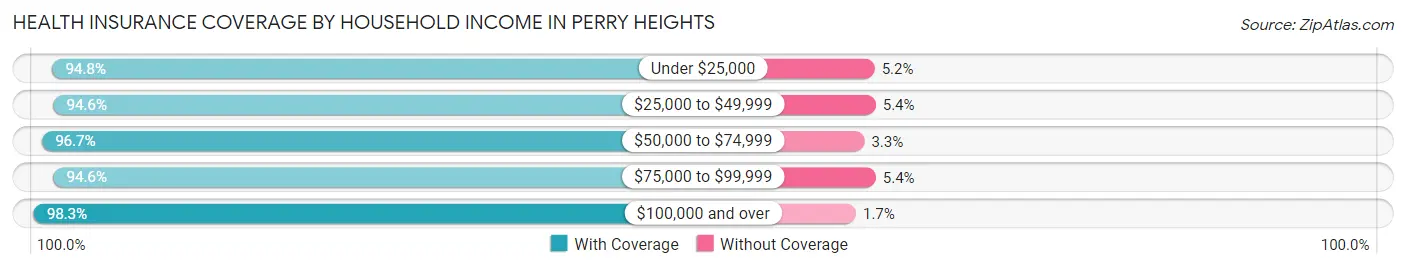
| Household Income | With Coverage | Without Coverage |
| Under $25,000 | 706 (94.8%) | 39 (5.2%) |
| $25,000 to $49,999 | 1,758 (94.6%) | 101 (5.4%) |
| $50,000 to $74,999 | 1,489 (96.7%) | 51 (3.3%) |
| $75,000 to $99,999 | 1,217 (94.6%) | 70 (5.4%) |
| $100,000 and over | 3,072 (98.3%) | 54 (1.7%) |
Public vs Private Health Insurance Coverage by Age in Perry Heights
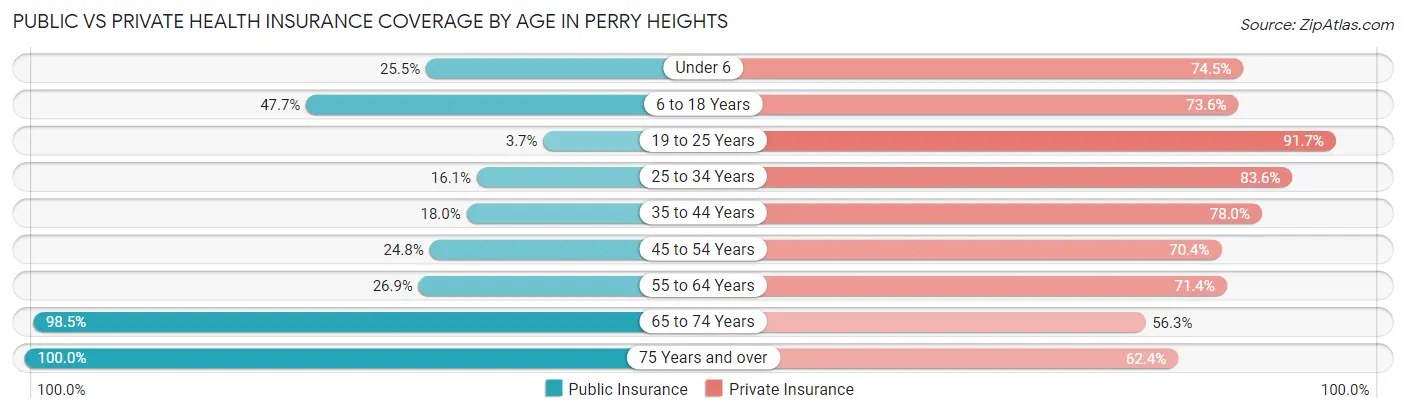
| Age Bracket | Public Insurance | Private Insurance |
| Under 6 | 130 (25.5%) | 380 (74.5%) |
| 6 to 18 Years | 651 (47.7%) | 1,004 (73.6%) |
| 19 to 25 Years | 28 (3.7%) | 692 (91.7%) |
| 25 to 34 Years | 143 (16.1%) | 745 (83.6%) |
| 35 to 44 Years | 150 (18.0%) | 651 (78.0%) |
| 45 to 54 Years | 394 (24.8%) | 1,117 (70.4%) |
| 55 to 64 Years | 294 (26.9%) | 782 (71.4%) |
| 65 to 74 Years | 825 (98.5%) | 472 (56.3%) |
| 75 Years and over | 697 (100.0%) | 435 (62.4%) |
| Total | 3,312 (38.6%) | 6,278 (73.3%) |
Disability Status by Sex by Age in Perry Heights
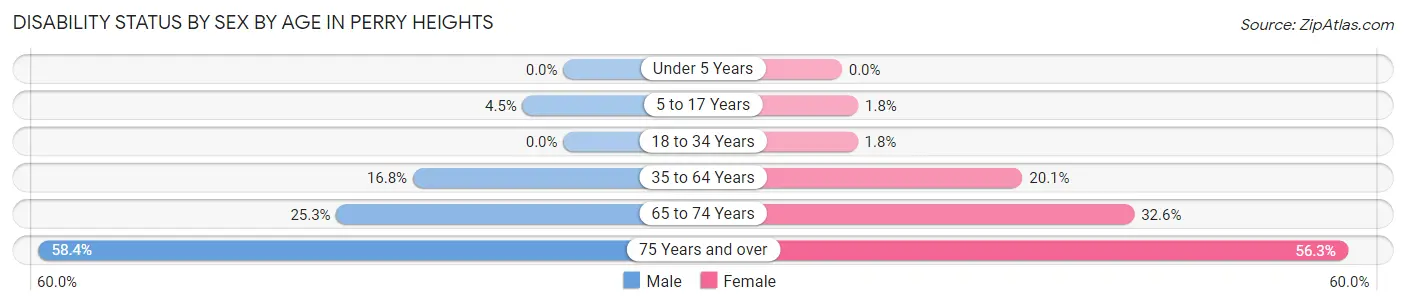
| Age Bracket | Male | Female |
| Under 5 Years | 0 (0.0%) | 0 (0.0%) |
| 5 to 17 Years | 37 (4.5%) | 9 (1.8%) |
| 18 to 34 Years | 0 (0.0%) | 14 (1.8%) |
| 35 to 64 Years | 290 (16.8%) | 359 (20.1%) |
| 65 to 74 Years | 69 (25.3%) | 184 (32.6%) |
| 75 Years and over | 149 (58.4%) | 249 (56.3%) |
Disability Class by Sex by Age in Perry Heights
Disability Class: Hearing Difficulty
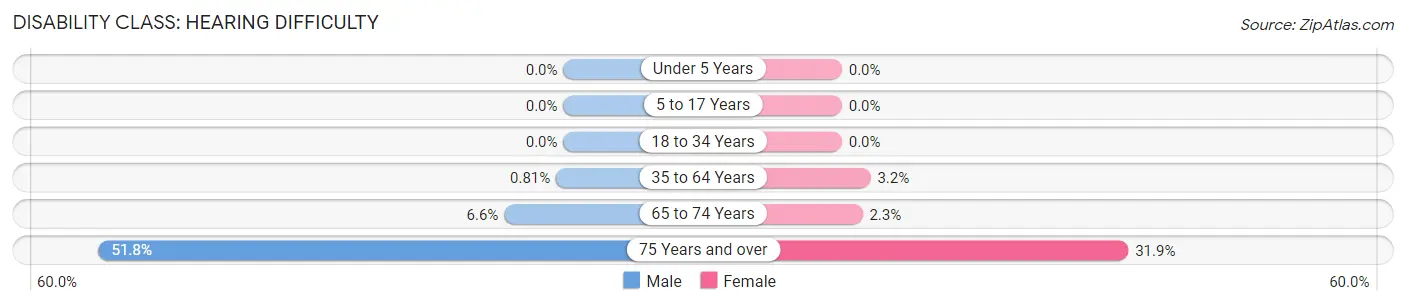
| Age Bracket | Male | Female |
| Under 5 Years | 0 (0.0%) | 0 (0.0%) |
| 5 to 17 Years | 0 (0.0%) | 0 (0.0%) |
| 18 to 34 Years | 0 (0.0%) | 0 (0.0%) |
| 35 to 64 Years | 14 (0.8%) | 57 (3.2%) |
| 65 to 74 Years | 18 (6.6%) | 13 (2.3%) |
| 75 Years and over | 132 (51.8%) | 141 (31.9%) |
Disability Class: Vision Difficulty
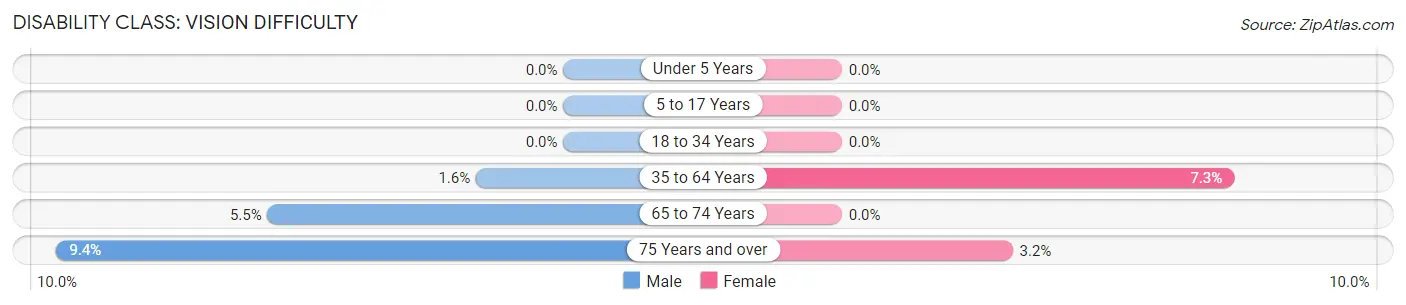
| Age Bracket | Male | Female |
| Under 5 Years | 0 (0.0%) | 0 (0.0%) |
| 5 to 17 Years | 0 (0.0%) | 0 (0.0%) |
| 18 to 34 Years | 0 (0.0%) | 0 (0.0%) |
| 35 to 64 Years | 28 (1.6%) | 130 (7.3%) |
| 65 to 74 Years | 15 (5.5%) | 0 (0.0%) |
| 75 Years and over | 24 (9.4%) | 14 (3.2%) |
Disability Class: Cognitive Difficulty
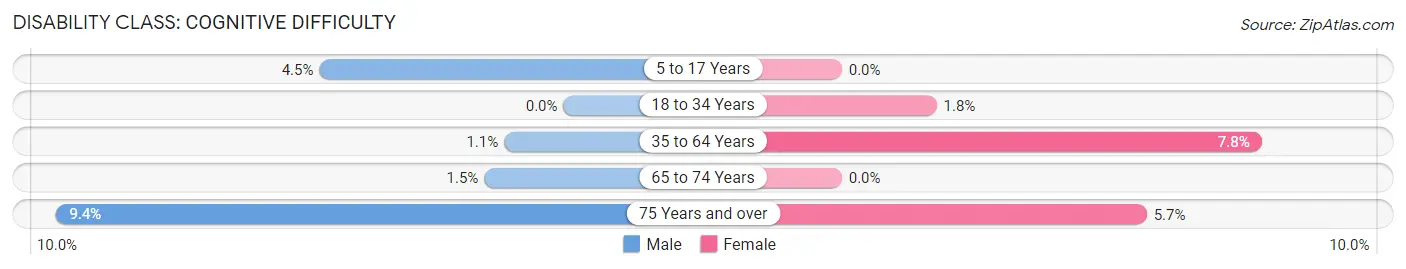
| Age Bracket | Male | Female |
| 5 to 17 Years | 37 (4.5%) | 0 (0.0%) |
| 18 to 34 Years | 0 (0.0%) | 14 (1.8%) |
| 35 to 64 Years | 19 (1.1%) | 139 (7.8%) |
| 65 to 74 Years | 4 (1.5%) | 0 (0.0%) |
| 75 Years and over | 24 (9.4%) | 25 (5.7%) |
Disability Class: Ambulatory Difficulty
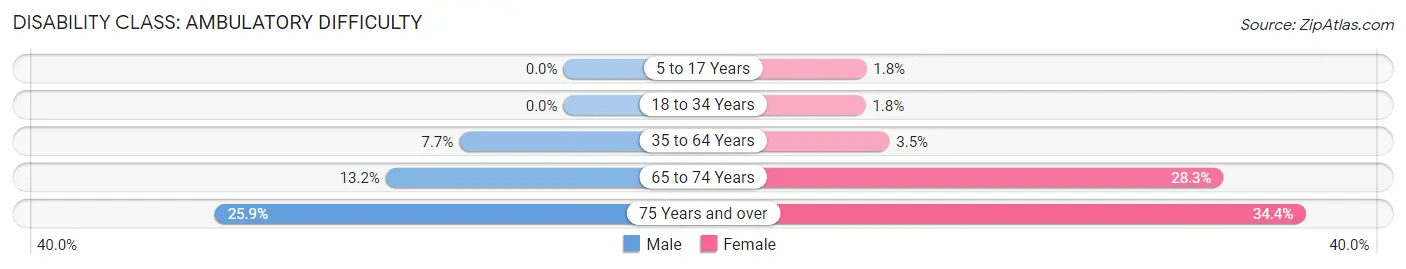
| Age Bracket | Male | Female |
| 5 to 17 Years | 0 (0.0%) | 9 (1.8%) |
| 18 to 34 Years | 0 (0.0%) | 14 (1.8%) |
| 35 to 64 Years | 134 (7.7%) | 63 (3.5%) |
| 65 to 74 Years | 36 (13.2%) | 160 (28.3%) |
| 75 Years and over | 66 (25.9%) | 152 (34.4%) |
Disability Class: Self-Care Difficulty
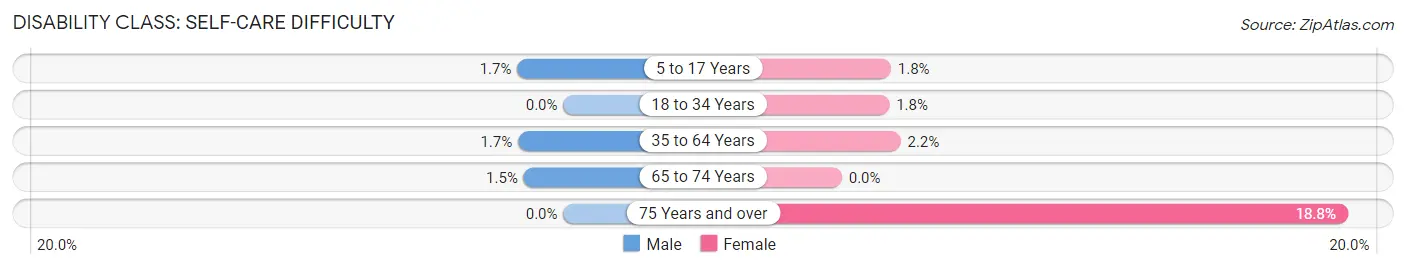
| Age Bracket | Male | Female |
| 5 to 17 Years | 14 (1.7%) | 9 (1.8%) |
| 18 to 34 Years | 0 (0.0%) | 14 (1.8%) |
| 35 to 64 Years | 29 (1.7%) | 39 (2.2%) |
| 65 to 74 Years | 4 (1.5%) | 0 (0.0%) |
| 75 Years and over | 0 (0.0%) | 83 (18.8%) |
Technology Access in Perry Heights
Computing Device Access in Perry Heights
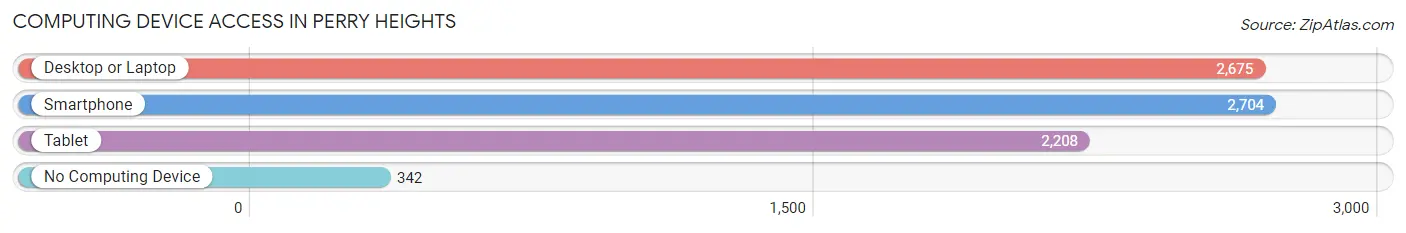
| Device Type | # Households | % Households |
| Desktop or Laptop | 2,675 | 79.0% |
| Smartphone | 2,704 | 79.9% |
| Tablet | 2,208 | 65.2% |
| No Computing Device | 342 | 10.1% |
| Total | 3,384 | 100.0% |
Internet Access in Perry Heights
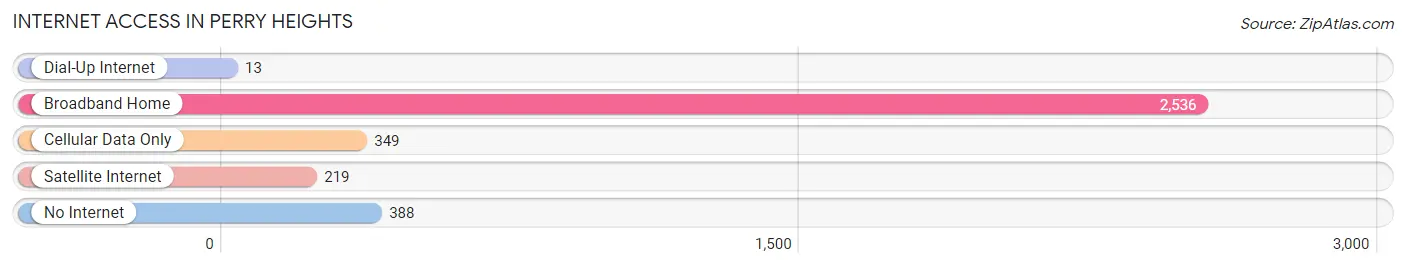
| Internet Type | # Households | % Households |
| Dial-Up Internet | 13 | 0.4% |
| Broadband Home | 2,536 | 74.9% |
| Cellular Data Only | 349 | 10.3% |
| Satellite Internet | 219 | 6.5% |
| No Internet | 388 | 11.5% |
| Total | 3,384 | 100.0% |
Perry Heights Summary
Perry Heights is a small village located in Stark County, Ohio. It is situated in the northeastern part of the state, approximately 20 miles south of Akron and 40 miles south of Cleveland. The village is bordered by the cities of Canton, Massillon, and North Canton. As of the 2010 census, the population of Perry Heights was 1,845.
History
Perry Heights was founded in 1817 by a group of settlers from Pennsylvania. The village was named after Commodore Oliver Hazard Perry, a naval hero of the War of 1812. The village was incorporated in 1867 and was originally a farming community. In the late 19th century, the village began to grow as a result of the industrialization of the area. The village was home to several factories, including a brickyard, a sawmill, and a flour mill.
Geography
Perry Heights is located at 40°48'N 81°25'W (40.80, -81.42). The village has a total area of 1.2 square miles, all of which is land. The village is situated in a hilly area and is surrounded by wooded areas. The village is located in the Tuscarawas River Valley and is part of the Appalachian Plateau.
Economy
Perry Heights is a primarily residential community. The village is home to several small businesses, including a grocery store, a hardware store, and a few restaurants. The village is also home to a few manufacturing companies, including a plastics manufacturer and a metal fabrication company.
Demographics
As of the 2010 census, the population of Perry Heights was 1,845. The racial makeup of the village was 95.3% White, 1.2% African American, 0.3% Native American, 0.7% Asian, 0.1% Pacific Islander, 0.7% from other races, and 1.9% from two or more races. Hispanic or Latino of any race were 2.2% of the population.
The median income for a household in the village was $45,938, and the median income for a family was $51,250. The per capita income for the village was $20,945. About 8.2% of families and 10.2% of the population were below the poverty line, including 14.2% of those under age 18 and 5.2% of those age 65 or over.
Common Questions
What is the Total Population of Perry Heights?
Total Population of Perry Heights is 8,762.
What is the Total Male Population of Perry Heights?
Total Male Population of Perry Heights is 4,375.
What is the Total Female Population of Perry Heights?
Total Female Population of Perry Heights is 4,387.
What is the Ratio of Males per 100 Females in Perry Heights?
There are 99.73 Males per 100 Females in Perry Heights.
What is the Ratio of Females per 100 Males in Perry Heights?
There are 100.27 Females per 100 Males in Perry Heights.
What is the Median Population Age in Perry Heights?
Median Population Age in Perry Heights is 45.4 Years.
What is the Average Family Size in Perry Heights
Average Family Size in Perry Heights is 3.0 People.
What is the Average Household Size in Perry Heights
Average Household Size in Perry Heights is 2.5 People.
What is Per Capita Income in Perry Heights?
Per Capita income in Perry Heights is $28,581.
What is the Median Family Income in Perry Heights?
Median Family Income in Perry Heights is $71,351.
What is the Median Household income in Perry Heights?
Median Household Income in Perry Heights is $62,689.
What is Income or Wage Gap in Perry Heights?
Income or Wage Gap in Perry Heights is 31.6%.
Women in Perry Heights earn 68.4 cents for every dollar earned by a man.
What is Inequality or Gini Index in Perry Heights?
Inequality or Gini Index in Perry Heights is 0.36.
How Large is the Labor Force in Perry Heights?
There are 4,589 People in the Labor Forcein in Perry Heights.
What is the Percentage of People in the Labor Force in Perry Heights?
63.3% of People are in the Labor Force in Perry Heights.
What is the Unemployment Rate in Perry Heights?
Unemployment Rate in Perry Heights is 2.3%.