Cities with the Highest Percentage of Irish Population in Ohio
RELATED REPORTS & OPTIONS
Irish
Ohio
Compare Cities
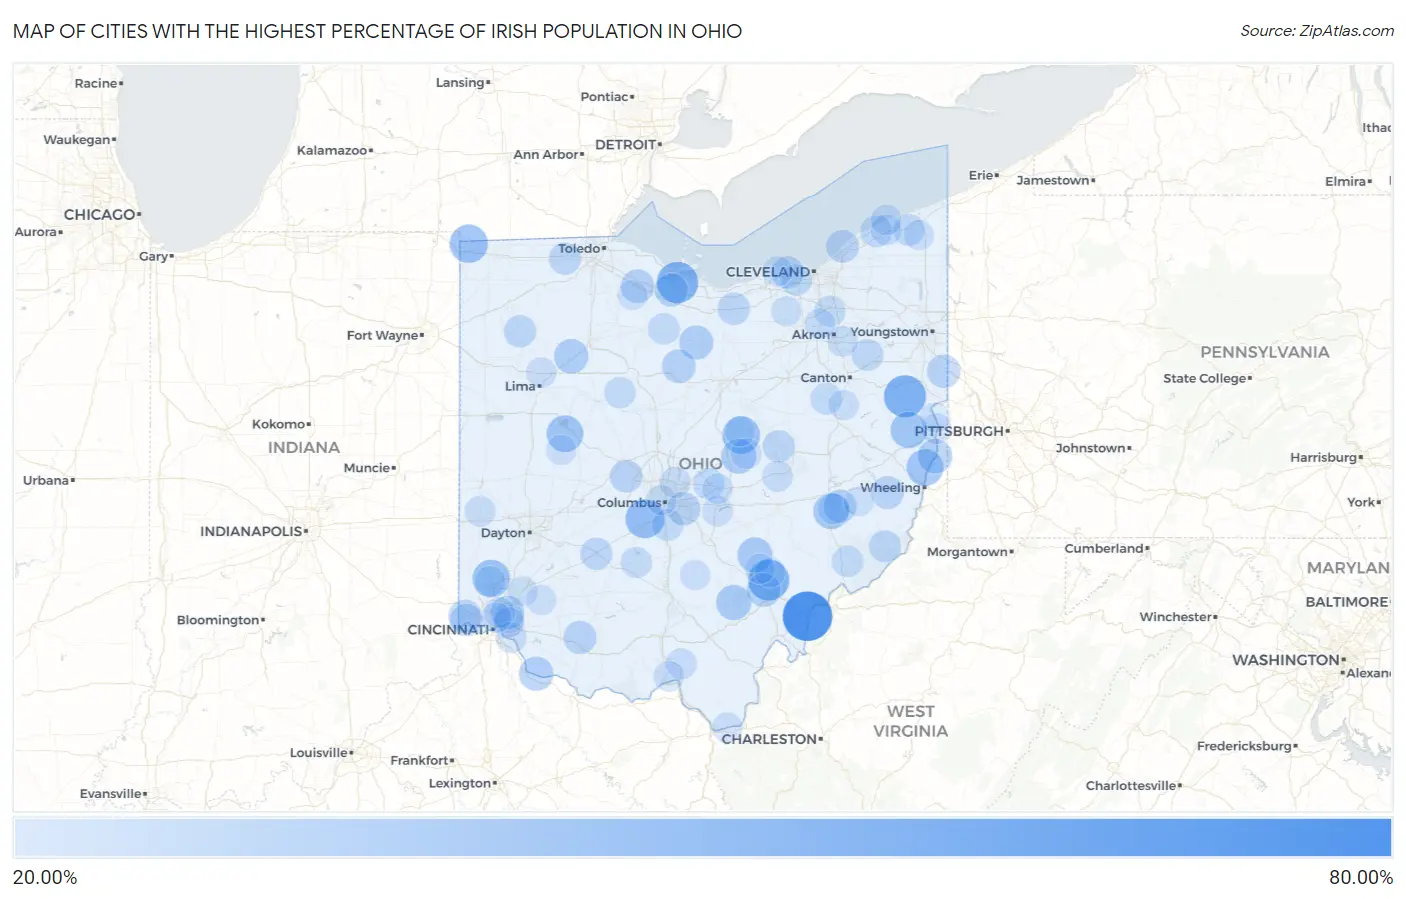
Map of Cities with the Highest Percentage of Irish Population in Ohio
0.00%
80.00%
Cities with the Highest Percentage of Irish Population in Ohio
| City | Irish | vs State | vs National | |
| 1. | Hockingport | 74.07% | 12.49%(+61.6)#1 | 9.46%(+64.6)#46 |
| 2. | Summitville | 54.04% | 12.49%(+41.5)#2 | 9.46%(+44.6)#163 |
| 3. | Whites Landing | 52.08% | 12.49%(+39.6)#3 | 9.46%(+42.6)#186 |
| 4. | Millfield | 51.16% | 12.49%(+38.7)#4 | 9.46%(+41.7)#196 |
| 5. | New Haven Cdp Hamilton County | 49.57% | 12.49%(+37.1)#5 | 9.46%(+40.1)#230 |
| 6. | South Mount Vernon | 45.37% | 12.49%(+32.9)#6 | 9.46%(+35.9)#313 |
| 7. | Darbydale | 45.20% | 12.49%(+32.7)#7 | 9.46%(+35.7)#317 |
| 8. | Nettle Lake | 43.55% | 12.49%(+31.1)#8 | 9.46%(+34.1)#354 |
| 9. | Williamsdale | 42.09% | 12.49%(+29.6)#9 | 9.46%(+32.6)#381 |
| 10. | Howard | 41.90% | 12.49%(+29.4)#10 | 9.46%(+32.4)#390 |
| 11. | Lewistown | 39.86% | 12.49%(+27.4)#11 | 9.46%(+30.4)#465 |
| 12. | Connorville | 39.62% | 12.49%(+27.1)#12 | 9.46%(+30.2)#472 |
| 13. | East Springfield | 38.74% | 12.49%(+26.2)#13 | 9.46%(+29.3)#495 |
| 14. | Pleasant City | 37.17% | 12.49%(+24.7)#14 | 9.46%(+27.7)#567 |
| 15. | Zaleski | 35.65% | 12.49%(+23.2)#15 | 9.46%(+26.2)#642 |
| 16. | Shawnee | 35.52% | 12.49%(+23.0)#16 | 9.46%(+26.1)#647 |
| 17. | Martinsburg | 35.27% | 12.49%(+22.8)#17 | 9.46%(+25.8)#667 |
| 18. | Brilliant | 33.80% | 12.49%(+21.3)#18 | 9.46%(+24.3)#751 |
| 19. | Mount Cory | 33.68% | 12.49%(+21.2)#19 | 9.46%(+24.2)#761 |
| 20. | Chilo | 33.33% | 12.49%(+20.8)#20 | 9.46%(+23.9)#785 |
| 21. | Celeryville | 33.02% | 12.49%(+20.5)#21 | 9.46%(+23.6)#806 |
| 22. | The Plains | 32.09% | 12.49%(+19.6)#22 | 9.46%(+22.6)#891 |
| 23. | Hessville | 31.67% | 12.49%(+19.2)#23 | 9.46%(+22.2)#936 |
| 24. | Sulphur Springs | 31.61% | 12.49%(+19.1)#24 | 9.46%(+22.1)#940 |
| 25. | Rossmoyne | 31.24% | 12.49%(+18.7)#25 | 9.46%(+21.8)#970 |
| 26. | Vickery | 31.09% | 12.49%(+18.6)#26 | 9.46%(+21.6)#993 |
| 27. | East Palestine | 30.85% | 12.49%(+18.4)#27 | 9.46%(+21.4)#1,021 |
| 28. | Mowrystown | 30.59% | 12.49%(+18.1)#28 | 9.46%(+21.1)#1,053 |
| 29. | Brice | 30.54% | 12.49%(+18.0)#29 | 9.46%(+21.1)#1,062 |
| 30. | Senecaville | 30.51% | 12.49%(+18.0)#30 | 9.46%(+21.1)#1,065 |
| 31. | Hooven | 30.34% | 12.49%(+17.8)#31 | 9.46%(+20.9)#1,088 |
| 32. | Belmont | 30.00% | 12.49%(+17.5)#32 | 9.46%(+20.5)#1,124 |
| 33. | Ai | 29.96% | 12.49%(+17.5)#33 | 9.46%(+20.5)#1,131 |
| 34. | Bass Lake | 29.80% | 12.49%(+17.3)#34 | 9.46%(+20.3)#1,153 |
| 35. | Timberlake | 29.62% | 12.49%(+17.1)#35 | 9.46%(+20.2)#1,174 |
| 36. | Unionville Center | 29.60% | 12.49%(+17.1)#36 | 9.46%(+20.1)#1,176 |
| 37. | Brunersburg | 28.74% | 12.49%(+16.3)#37 | 9.46%(+19.3)#1,296 |
| 38. | Wakeman | 28.66% | 12.49%(+16.2)#38 | 9.46%(+19.2)#1,310 |
| 39. | Bay Village | 28.64% | 12.49%(+16.1)#39 | 9.46%(+19.2)#1,314 |
| 40. | Continental | 28.48% | 12.49%(+16.0)#40 | 9.46%(+19.0)#1,335 |
| 41. | Cleves | 28.39% | 12.49%(+15.9)#41 | 9.46%(+18.9)#1,350 |
| 42. | Swanton | 28.36% | 12.49%(+15.9)#42 | 9.46%(+18.9)#1,358 |
| 43. | Warsaw | 28.13% | 12.49%(+15.6)#43 | 9.46%(+18.7)#1,397 |
| 44. | Lawrenceville | 28.12% | 12.49%(+15.6)#44 | 9.46%(+18.7)#1,400 |
| 45. | Octa | 28.00% | 12.49%(+15.5)#45 | 9.46%(+18.5)#1,429 |
| 46. | Antioch | 27.66% | 12.49%(+15.2)#46 | 9.46%(+18.2)#1,483 |
| 47. | Marlboro | 27.57% | 12.49%(+15.1)#47 | 9.46%(+18.1)#1,493 |
| 48. | Perry | 27.44% | 12.49%(+14.9)#48 | 9.46%(+18.0)#1,515 |
| 49. | Austinburg | 26.91% | 12.49%(+14.4)#49 | 9.46%(+17.4)#1,599 |
| 50. | Lower Salem | 26.72% | 12.49%(+14.2)#50 | 9.46%(+17.3)#1,637 |
| 51. | Lockbourne | 26.67% | 12.49%(+14.2)#51 | 9.46%(+17.2)#1,647 |
| 52. | Republic | 26.66% | 12.49%(+14.2)#52 | 9.46%(+17.2)#1,654 |
| 53. | Alexandria | 26.63% | 12.49%(+14.1)#53 | 9.46%(+17.2)#1,661 |
| 54. | Beach City | 26.60% | 12.49%(+14.1)#54 | 9.46%(+17.1)#1,669 |
| 55. | Buffalo | 26.57% | 12.49%(+14.1)#55 | 9.46%(+17.1)#1,675 |
| 56. | Marseilles | 26.44% | 12.49%(+13.9)#56 | 9.46%(+17.0)#1,698 |
| 57. | Fairview Park | 26.19% | 12.49%(+13.7)#57 | 9.46%(+16.7)#1,765 |
| 58. | Peninsula | 25.59% | 12.49%(+13.1)#58 | 9.46%(+16.1)#1,890 |
| 59. | New Holland | 25.30% | 12.49%(+12.8)#59 | 9.46%(+15.8)#1,943 |
| 60. | North Lima | 25.14% | 12.49%(+12.6)#60 | 9.46%(+15.7)#1,980 |
| 61. | West Manchester | 25.07% | 12.49%(+12.6)#61 | 9.46%(+15.6)#1,995 |
| 62. | Huber Ridge | 25.06% | 12.49%(+12.6)#62 | 9.46%(+15.6)#1,997 |
| 63. | Trinway | 25.00% | 12.49%(+12.5)#63 | 9.46%(+15.5)#2,013 |
| 64. | Minford | 24.92% | 12.49%(+12.4)#64 | 9.46%(+15.5)#2,045 |
| 65. | Madison | 24.73% | 12.49%(+12.2)#65 | 9.46%(+15.3)#2,088 |
| 66. | North Madison | 24.52% | 12.49%(+12.0)#66 | 9.46%(+15.1)#2,138 |
| 67. | Madeira | 24.47% | 12.49%(+12.0)#67 | 9.46%(+15.0)#2,151 |
| 68. | Sawyerwood | 24.33% | 12.49%(+11.8)#68 | 9.46%(+14.9)#2,190 |
| 69. | Montrose Ghent | 24.27% | 12.49%(+11.8)#69 | 9.46%(+14.8)#2,204 |
| 70. | New Miami | 24.26% | 12.49%(+11.8)#70 | 9.46%(+14.8)#2,208 |
| 71. | Coldstream | 24.23% | 12.49%(+11.7)#71 | 9.46%(+14.8)#2,216 |
| 72. | Mariemont | 24.19% | 12.49%(+11.7)#72 | 9.46%(+14.7)#2,225 |
| 73. | Millersport | 24.02% | 12.49%(+11.5)#73 | 9.46%(+14.6)#2,268 |
| 74. | Bladensburg | 23.95% | 12.49%(+11.5)#74 | 9.46%(+14.5)#2,287 |
| 75. | New Springfield | 23.94% | 12.49%(+11.5)#75 | 9.46%(+14.5)#2,292 |
| 76. | Arlington Heights | 23.89% | 12.49%(+11.4)#76 | 9.46%(+14.4)#2,308 |
| 77. | Granville South | 23.80% | 12.49%(+11.3)#77 | 9.46%(+14.3)#2,329 |
| 78. | Grandview Heights | 23.80% | 12.49%(+11.3)#78 | 9.46%(+14.3)#2,332 |
| 79. | Zoar | 23.79% | 12.49%(+11.3)#79 | 9.46%(+14.3)#2,334 |
| 80. | Brandt | 23.72% | 12.49%(+11.2)#80 | 9.46%(+14.3)#2,348 |
| 81. | Toronto | 23.71% | 12.49%(+11.2)#81 | 9.46%(+14.2)#2,357 |
| 82. | Elmwood Place | 23.70% | 12.49%(+11.2)#82 | 9.46%(+14.2)#2,358 |
| 83. | Rosemount | 23.70% | 12.49%(+11.2)#83 | 9.46%(+14.2)#2,359 |
| 84. | Cairo | 23.57% | 12.49%(+11.1)#84 | 9.46%(+14.1)#2,398 |
| 85. | Valley City | 23.49% | 12.49%(+11.0)#85 | 9.46%(+14.0)#2,424 |
| 86. | Laurelville | 23.42% | 12.49%(+10.9)#86 | 9.46%(+14.0)#2,450 |
| 87. | Avon Lake | 23.42% | 12.49%(+10.9)#87 | 9.46%(+14.0)#2,451 |
| 88. | Chesapeake | 23.39% | 12.49%(+10.9)#88 | 9.46%(+13.9)#2,467 |
| 89. | Jefferson | 23.29% | 12.49%(+10.8)#89 | 9.46%(+13.8)#2,500 |
| 90. | Trimble | 23.28% | 12.49%(+10.8)#90 | 9.46%(+13.8)#2,503 |
| 91. | Suffield | 23.22% | 12.49%(+10.7)#91 | 9.46%(+13.8)#2,519 |
| 92. | Quaker City | 23.19% | 12.49%(+10.7)#92 | 9.46%(+13.7)#2,530 |
| 93. | Apple Valley | 23.17% | 12.49%(+10.7)#93 | 9.46%(+13.7)#2,539 |
| 94. | De Graff | 23.17% | 12.49%(+10.7)#94 | 9.46%(+13.7)#2,541 |
| 95. | Murray City | 23.06% | 12.49%(+10.6)#95 | 9.46%(+13.6)#2,571 |
| 96. | Kings Mills | 23.04% | 12.49%(+10.5)#96 | 9.46%(+13.6)#2,576 |
| 97. | Butlerville | 23.00% | 12.49%(+10.5)#97 | 9.46%(+13.5)#2,597 |
| 98. | Helena | 22.99% | 12.49%(+10.5)#98 | 9.46%(+13.5)#2,604 |
| 99. | Miller | 22.99% | 12.49%(+10.5)#99 | 9.46%(+13.5)#2,606 |
| 100. | Stratton | 22.96% | 12.49%(+10.5)#100 | 9.46%(+13.5)#2,618 |
Common Questions
What are the Top 10 Cities with the Highest Percentage of Irish Population in Ohio?
Top 10 Cities with the Highest Percentage of Irish Population in Ohio are:
#1
74.07%
#2
54.04%
#3
52.08%
#4
51.16%
#5
45.20%
#6
43.55%
#7
42.09%
#8
41.90%
#9
39.86%
#10
39.62%
What city has the Highest Percentage of Irish Population in Ohio?
Hockingport has the Highest Percentage of Irish Population in Ohio with 74.07%.
What is the Percentage of Irish Population in the State of Ohio?
Percentage of Irish Population in Ohio is 12.49%.
What is the Percentage of Irish Population in the United States?
Percentage of Irish Population in the United States is 9.46%.