Cities with the Largest Chippewa Community in Ohio
RELATED REPORTS & OPTIONS
Chippewa
Ohio
Compare Cities
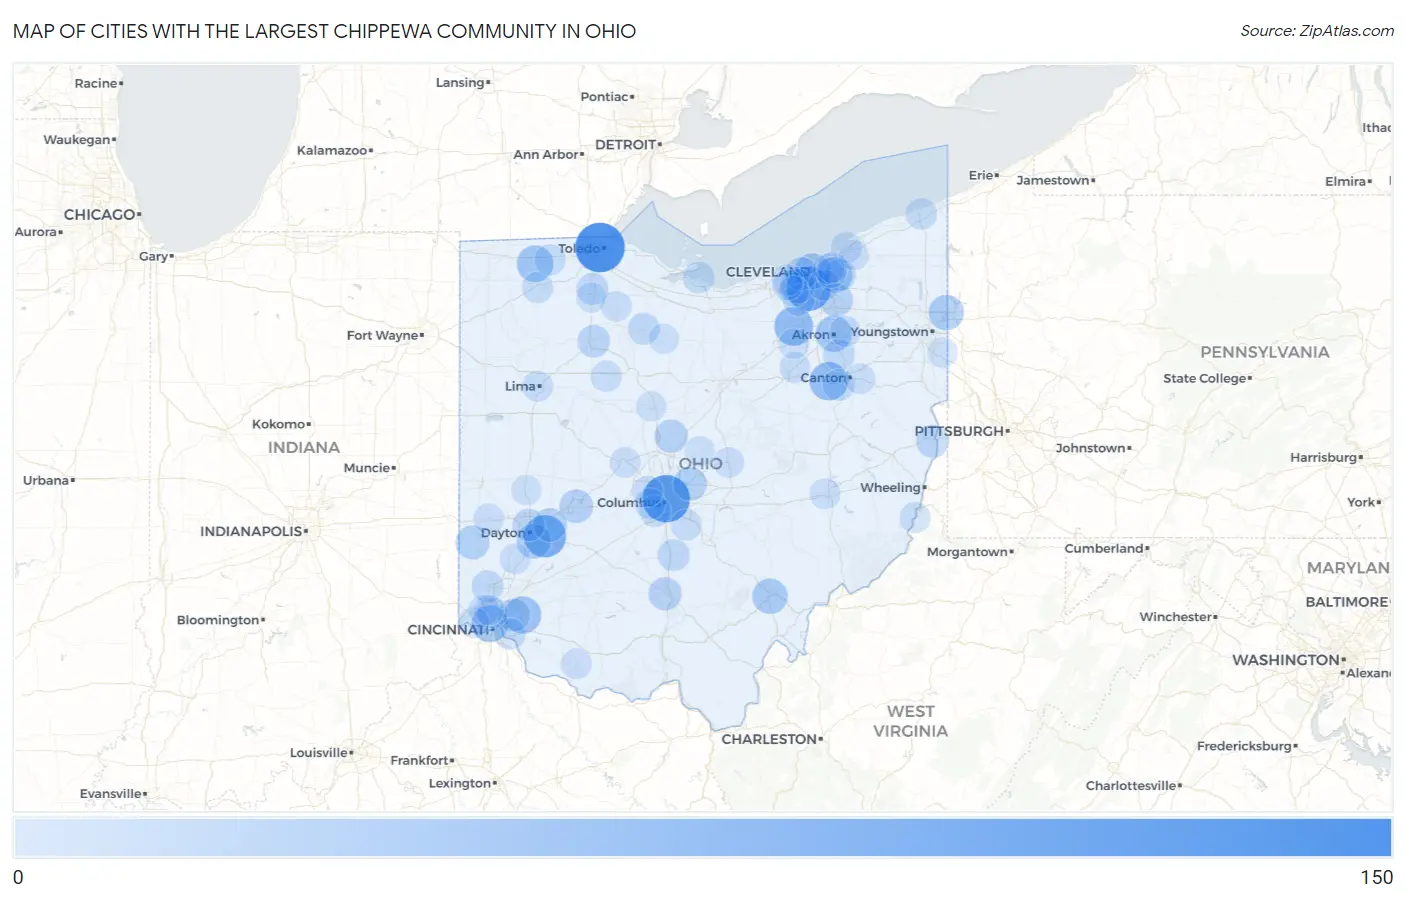
Map of Cities with the Largest Chippewa Community in Ohio
0
150
Cities with the Largest Chippewa Community in Ohio
| City | Chippewa | vs State | vs National | |
| 1. | Toledo | 128 | 1,850(6.92%)#1 | 191,286(0.07%)#189 |
| 2. | Columbus | 113 | 1,850(6.11%)#2 | 191,286(0.06%)#226 |
| 3. | Parma | 93 | 1,850(5.03%)#3 | 191,286(0.05%)#289 |
| 4. | Beavercreek | 79 | 1,850(4.27%)#4 | 191,286(0.04%)#351 |
| 5. | Medina | 56 | 1,850(3.03%)#5 | 191,286(0.03%)#487 |
| 6. | Massillon | 54 | 1,850(2.92%)#6 | 191,286(0.03%)#505 |
| 7. | Mulberry | 46 | 1,850(2.49%)#7 | 191,286(0.02%)#578 |
| 8. | Cincinnati | 43 | 1,850(2.32%)#8 | 191,286(0.02%)#608 |
| 9. | Wauseon | 42 | 1,850(2.27%)#9 | 191,286(0.02%)#625 |
| 10. | Akron | 39 | 1,850(2.11%)#10 | 191,286(0.02%)#652 |
| 11. | Cleveland | 37 | 1,850(2.00%)#11 | 191,286(0.02%)#678 |
| 12. | Athens | 33 | 1,850(1.78%)#12 | 191,286(0.02%)#755 |
| 13. | West Hill | 33 | 1,850(1.78%)#13 | 191,286(0.02%)#769 |
| 14. | Beachwood | 32 | 1,850(1.73%)#14 | 191,286(0.02%)#779 |
| 15. | Kettering | 29 | 1,850(1.57%)#15 | 191,286(0.02%)#831 |
| 16. | Brook Park | 26 | 1,850(1.41%)#16 | 191,286(0.01%)#894 |
| 17. | New Albany | 24 | 1,850(1.30%)#17 | 191,286(0.01%)#951 |
| 18. | Lake Lakengren | 24 | 1,850(1.30%)#18 | 191,286(0.01%)#959 |
| 19. | Springfield | 23 | 1,850(1.24%)#19 | 191,286(0.01%)#970 |
| 20. | Fairborn | 23 | 1,850(1.24%)#20 | 191,286(0.01%)#972 |
| 21. | Macedonia | 21 | 1,850(1.14%)#21 | 191,286(0.01%)#1,036 |
| 22. | Ashley | 21 | 1,850(1.14%)#22 | 191,286(0.01%)#1,046 |
| 23. | Chillicothe | 19 | 1,850(1.03%)#23 | 191,286(0.01%)#1,096 |
| 24. | Lakewood | 18 | 1,850(0.97%)#24 | 191,286(0.01%)#1,141 |
| 25. | Findlay | 16 | 1,850(0.86%)#25 | 191,286(0.01%)#1,238 |
| 26. | Steubenville | 16 | 1,850(0.86%)#26 | 191,286(0.01%)#1,244 |
| 27. | The Village Of Indian Hill | 16 | 1,850(0.86%)#27 | 191,286(0.01%)#1,261 |
| 28. | Dayton | 14 | 1,850(0.76%)#28 | 191,286(0.01%)#1,328 |
| 29. | Bowling Green | 12 | 1,850(0.65%)#29 | 191,286(0.01%)#1,456 |
| 30. | Tiffin | 12 | 1,850(0.65%)#30 | 191,286(0.01%)#1,461 |
| 31. | Circleville | 12 | 1,850(0.65%)#31 | 191,286(0.01%)#1,467 |
| 32. | Hamilton | 11 | 1,850(0.59%)#32 | 191,286(0.01%)#1,517 |
| 33. | Pepper Pike | 11 | 1,850(0.59%)#33 | 191,286(0.01%)#1,553 |
| 34. | Strongsville | 10 | 1,850(0.54%)#34 | 191,286(0.01%)#1,605 |
| 35. | Green | 10 | 1,850(0.54%)#35 | 191,286(0.01%)#1,613 |
| 36. | Sandusky | 10 | 1,850(0.54%)#36 | 191,286(0.01%)#1,616 |
| 37. | Richville | 10 | 1,850(0.54%)#37 | 191,286(0.01%)#1,654 |
| 38. | Urbancrest | 9 | 1,850(0.49%)#38 | 191,286(0.00%)#1,763 |
| 39. | Edgewood | 8 | 1,850(0.43%)#39 | 191,286(0.00%)#1,832 |
| 40. | Fruit Hill | 8 | 1,850(0.43%)#40 | 191,286(0.00%)#1,833 |
| 41. | Westlake | 7 | 1,850(0.38%)#41 | 191,286(0.00%)#1,901 |
| 42. | Napoleon | 7 | 1,850(0.38%)#42 | 191,286(0.00%)#1,930 |
| 43. | Delta | 7 | 1,850(0.38%)#43 | 191,286(0.00%)#1,947 |
| 44. | Garfield Heights | 6 | 1,850(0.32%)#44 | 191,286(0.00%)#2,032 |
| 45. | Willoughby | 6 | 1,850(0.32%)#45 | 191,286(0.00%)#2,035 |
| 46. | Tallmadge | 6 | 1,850(0.32%)#46 | 191,286(0.00%)#2,041 |
| 47. | Lincoln Village | 6 | 1,850(0.32%)#47 | 191,286(0.00%)#2,058 |
| 48. | Lithopolis | 6 | 1,850(0.32%)#48 | 191,286(0.00%)#2,084 |
| 49. | Forest | 6 | 1,850(0.32%)#49 | 191,286(0.00%)#2,096 |
| 50. | Cleveland Heights | 5 | 1,850(0.27%)#50 | 191,286(0.00%)#2,170 |
| 51. | Hilliard | 5 | 1,850(0.27%)#51 | 191,286(0.00%)#2,174 |
| 52. | Lima | 5 | 1,850(0.27%)#52 | 191,286(0.00%)#2,175 |
| 53. | Powhatan Point | 5 | 1,850(0.27%)#53 | 191,286(0.00%)#2,235 |
| 54. | Smithville | 5 | 1,850(0.27%)#54 | 191,286(0.00%)#2,238 |
| 55. | South Euclid | 4 | 1,850(0.22%)#55 | 191,286(0.00%)#2,317 |
| 56. | Berea | 4 | 1,850(0.22%)#56 | 191,286(0.00%)#2,320 |
| 57. | Finneytown | 4 | 1,850(0.22%)#57 | 191,286(0.00%)#2,327 |
| 58. | Mack | 4 | 1,850(0.22%)#58 | 191,286(0.00%)#2,331 |
| 59. | Cambridge | 4 | 1,850(0.22%)#59 | 191,286(0.00%)#2,334 |
| 60. | Groesbeck | 4 | 1,850(0.22%)#60 | 191,286(0.00%)#2,339 |
| 61. | Carlisle | 4 | 1,850(0.22%)#61 | 191,286(0.00%)#2,345 |
| 62. | Lewisburg | 4 | 1,850(0.22%)#62 | 191,286(0.00%)#2,368 |
| 63. | Russellville | 4 | 1,850(0.22%)#63 | 191,286(0.00%)#2,399 |
| 64. | Risingsun | 4 | 1,850(0.22%)#64 | 191,286(0.00%)#2,411 |
| 65. | Marysville | 3 | 1,850(0.16%)#65 | 191,286(0.00%)#2,461 |
| 66. | University Heights | 3 | 1,850(0.16%)#66 | 191,286(0.00%)#2,469 |
| 67. | Utica | 3 | 1,850(0.16%)#67 | 191,286(0.00%)#2,504 |
| 68. | East Canton | 3 | 1,850(0.16%)#68 | 191,286(0.00%)#2,523 |
| 69. | North Olmsted | 2 | 1,850(0.11%)#69 | 191,286(0.00%)#2,612 |
| 70. | Seville | 2 | 1,850(0.11%)#70 | 191,286(0.00%)#2,650 |
| 71. | Centerburg | 2 | 1,850(0.11%)#71 | 191,286(0.00%)#2,654 |
| 72. | New Middletown | 2 | 1,850(0.11%)#72 | 191,286(0.00%)#2,664 |
| 73. | Marion | 1 | 1,850(0.05%)#73 | 191,286(0.00%)#2,808 |
| 74. | Troy | 1 | 1,850(0.05%)#74 | 191,286(0.00%)#2,809 |
| 75. | Mount Healthy | 1 | 1,850(0.05%)#75 | 191,286(0.00%)#2,830 |
| 76. | Kirtland | 1 | 1,850(0.05%)#76 | 191,286(0.00%)#2,831 |
| 77. | Bloomville | 1 | 1,850(0.05%)#77 | 191,286(0.00%)#2,896 |
| 78. | Portage | 1 | 1,850(0.05%)#78 | 191,286(0.00%)#2,942 |
Common Questions
What are the Top 10 Cities with the Largest Chippewa Community in Ohio?
Top 10 Cities with the Largest Chippewa Community in Ohio are:
#1
128
#2
113
#3
93
#4
79
#5
56
#6
54
#7
46
#8
43
#9
42
#10
39
What city has the Largest Chippewa Community in Ohio?
Toledo has the Largest Chippewa Community in Ohio with 128.
What is the Total Chippewa Population in the State of Ohio?
Total Chippewa Population in Ohio is 1,850.
What is the Total Chippewa Population in the United States?
Total Chippewa Population in the United States is 191,286.