Youngstown, OH
Youngstown Map
Youngstown Overview
60,048
TOTAL POPULATION
29,898
MALE POPULATION
30,150
FEMALE POPULATION
99.16
MALES / 100 FEMALES
100.84
FEMALES / 100 MALES
38.3
MEDIAN AGE
3.0
AVG FAMILY SIZE
2.2
AVG HOUSEHOLD SIZE
$20,466
PER CAPITA INCOME
$41,785
AVG FAMILY INCOME
$34,295
AVG HOUSEHOLD INCOME
11.3%
WAGE / INCOME GAP [ % ]
88.7¢/ $1
WAGE / INCOME GAP [ $ ]
$10,941
FAMILY INCOME DEFICIT
0.47
INEQUALITY / GINI INDEX
25,711
LABOR FORCE [ PEOPLE ]
53.2%
PERCENT IN LABOR FORCE
13.2%
UNEMPLOYMENT RATE
Youngstown Zip Codes
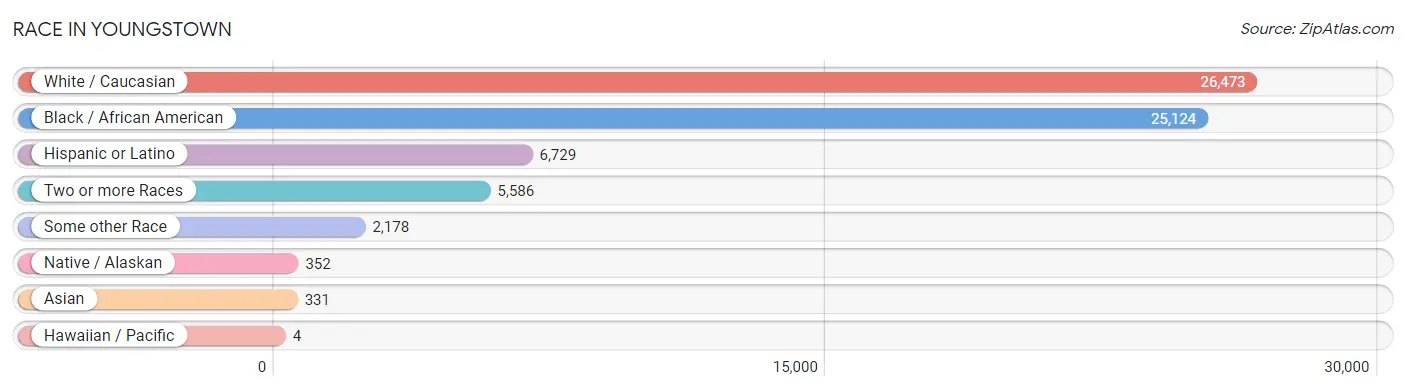
Race in Youngstown
The most populous races in Youngstown are White / Caucasian (26,473 | 44.1%), Black / African American (25,124 | 41.8%), and Hispanic or Latino (6,729 | 11.2%).
| Race | # Population | % Population |
| Asian | 331 | 0.5% |
| Black / African American | 25,124 | 41.8% |
| Hawaiian / Pacific | 4 | 0.0% |
| Hispanic or Latino | 6,729 | 11.2% |
| Native / Alaskan | 352 | 0.6% |
| White / Caucasian | 26,473 | 44.1% |
| Two or more Races | 5,586 | 9.3% |
| Some other Race | 2,178 | 3.6% |
| Total | 60,048 | 100.0% |
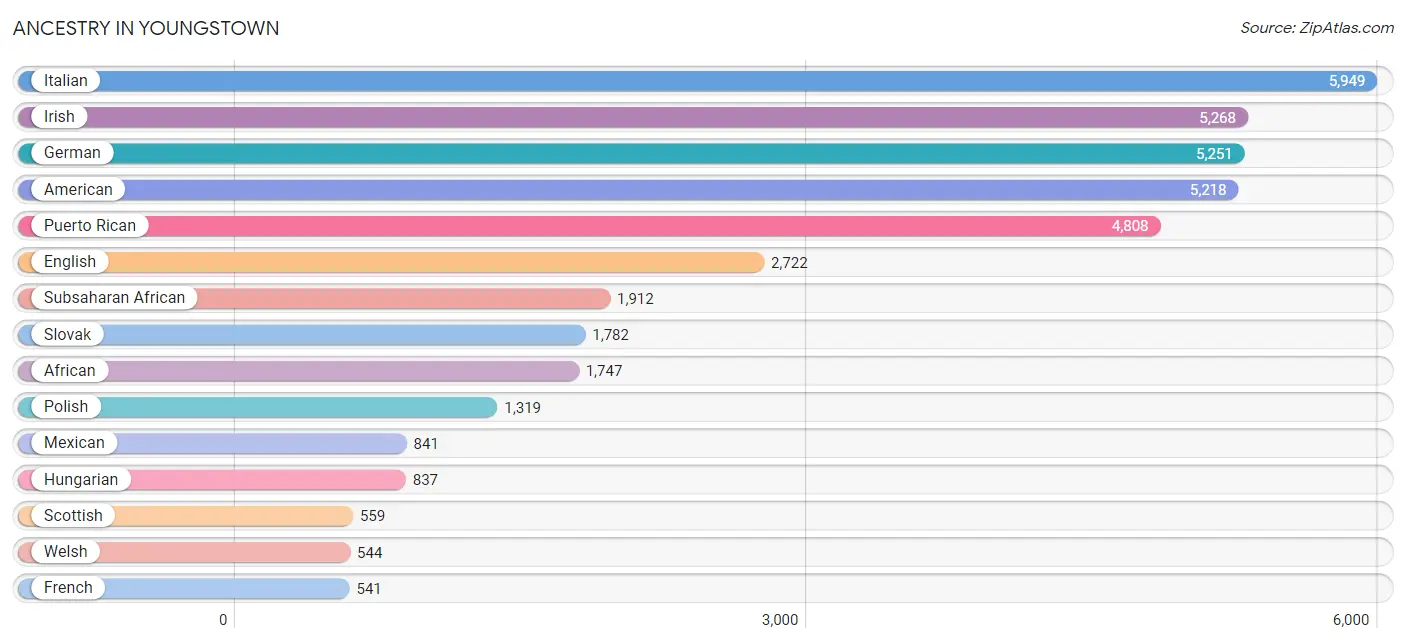
Ancestry in Youngstown
The most populous ancestries reported in Youngstown are Italian (5,949 | 9.9%), Irish (5,268 | 8.8%), German (5,251 | 8.7%), American (5,218 | 8.7%), and Puerto Rican (4,808 | 8.0%), together accounting for 44.1% of all Youngstown residents.
| Ancestry | # Population | % Population |
| African | 1,747 | 2.9% |
| Albanian | 8 | 0.0% |
| American | 5,218 | 8.7% |
| Apache | 15 | 0.0% |
| Arab | 175 | 0.3% |
| Armenian | 55 | 0.1% |
| Australian | 9 | 0.0% |
| Austrian | 72 | 0.1% |
| Bahamian | 20 | 0.0% |
| Barbadian | 14 | 0.0% |
| Bhutanese | 40 | 0.1% |
| Blackfeet | 158 | 0.3% |
| Brazilian | 46 | 0.1% |
| British | 270 | 0.4% |
| British West Indian | 6 | 0.0% |
| Burmese | 62 | 0.1% |
| Canadian | 40 | 0.1% |
| Carpatho Rusyn | 5 | 0.0% |
| Celtic | 4 | 0.0% |
| Central American | 517 | 0.9% |
| Central American Indian | 62 | 0.1% |
| Cherokee | 172 | 0.3% |
| Colombian | 40 | 0.1% |
| Cree | 4 | 0.0% |
| Creek | 26 | 0.0% |
| Croatian | 529 | 0.9% |
| Cuban | 115 | 0.2% |
| Czech | 187 | 0.3% |
| Czechoslovakian | 109 | 0.2% |
| Danish | 44 | 0.1% |
| Dominican | 64 | 0.1% |
| Dutch | 227 | 0.4% |
| Dutch West Indian | 4 | 0.0% |
| Eastern European | 29 | 0.1% |
| English | 2,722 | 4.5% |
| European | 246 | 0.4% |
| Finnish | 32 | 0.1% |
| French | 541 | 0.9% |
| French Canadian | 23 | 0.0% |
| German | 5,251 | 8.7% |
| Ghanaian | 24 | 0.0% |
| Greek | 149 | 0.3% |
| Guatemalan | 116 | 0.2% |
| Haitian | 203 | 0.3% |
| Honduran | 401 | 0.7% |
| Hungarian | 837 | 1.4% |
| Indian (Asian) | 11 | 0.0% |
| Irish | 5,268 | 8.8% |
| Iroquois | 26 | 0.0% |
| Israeli | 4 | 0.0% |
| Italian | 5,949 | 9.9% |
| Jamaican | 250 | 0.4% |
| Jordanian | 51 | 0.1% |
| Kenyan | 40 | 0.1% |
| Korean | 160 | 0.3% |
| Lebanese | 44 | 0.1% |
| Lithuanian | 24 | 0.0% |
| Mexican | 841 | 1.4% |
| Mexican American Indian | 1 | 0.0% |
| Moroccan | 4 | 0.0% |
| Native Hawaiian | 4 | 0.0% |
| Navajo | 3 | 0.0% |
| New Zealander | 30 | 0.1% |
| Nigerian | 50 | 0.1% |
| Norwegian | 57 | 0.1% |
| Osage | 4 | 0.0% |
| Pakistani | 4 | 0.0% |
| Palestinian | 64 | 0.1% |
| Pennsylvania German | 128 | 0.2% |
| Peruvian | 35 | 0.1% |
| Polish | 1,319 | 2.2% |
| Portuguese | 75 | 0.1% |
| Pueblo | 8 | 0.0% |
| Puerto Rican | 4,808 | 8.0% |
| Romanian | 170 | 0.3% |
| Russian | 210 | 0.4% |
| Scandinavian | 7 | 0.0% |
| Scotch-Irish | 336 | 0.6% |
| Scottish | 559 | 0.9% |
| Seminole | 9 | 0.0% |
| Serbian | 68 | 0.1% |
| Sierra Leonean | 12 | 0.0% |
| Sioux | 85 | 0.1% |
| Slavic | 14 | 0.0% |
| Slovak | 1,782 | 3.0% |
| Slovene | 19 | 0.0% |
| South American | 108 | 0.2% |
| Spaniard | 49 | 0.1% |
| Spanish | 8 | 0.0% |
| Sri Lankan | 18 | 0.0% |
| Subsaharan African | 1,912 | 3.2% |
| Swedish | 193 | 0.3% |
| Swiss | 13 | 0.0% |
| Thai | 94 | 0.2% |
| Trinidadian and Tobagonian | 32 | 0.1% |
| U.S. Virgin Islander | 9 | 0.0% |
| Ukrainian | 351 | 0.6% |
| Venezuelan | 33 | 0.1% |
| Welsh | 544 | 0.9% |
| West Indian | 70 | 0.1% |
| Yugoslavian | 16 | 0.0% | View All 101 Rows |
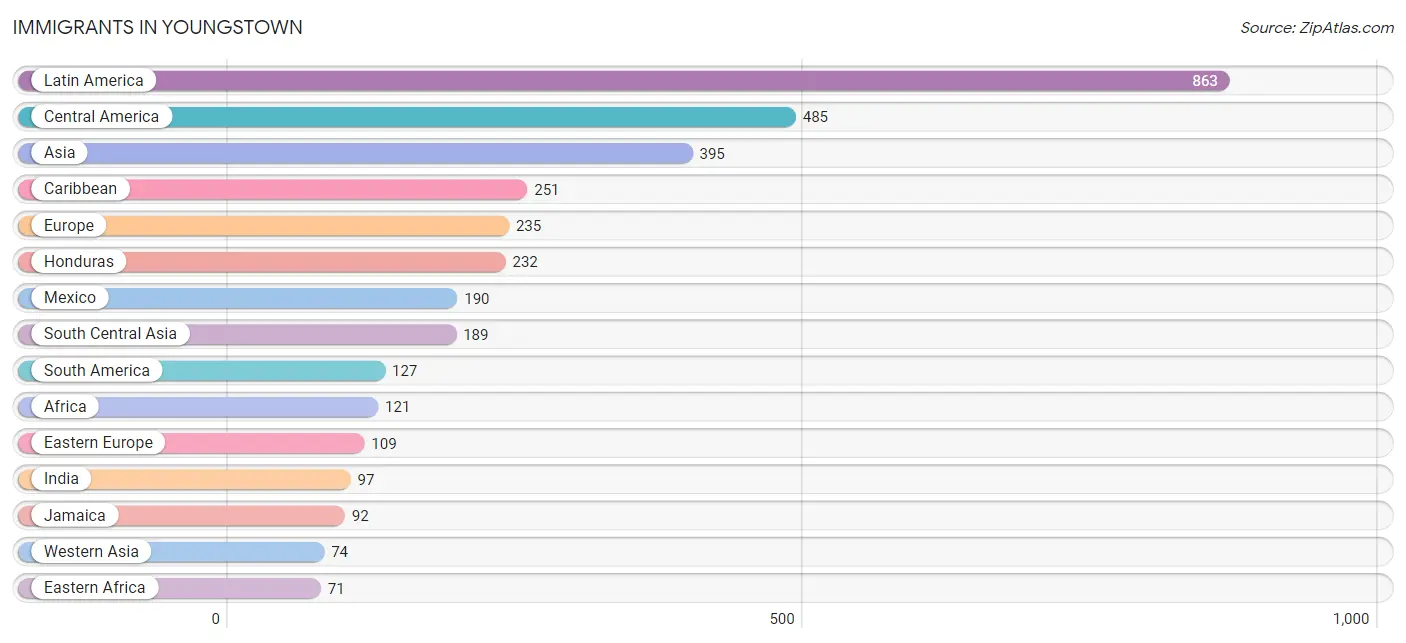
Immigrants in Youngstown
The most numerous immigrant groups reported in Youngstown came from Latin America (863 | 1.4%), Central America (485 | 0.8%), Asia (395 | 0.7%), Caribbean (251 | 0.4%), and Europe (235 | 0.4%), together accounting for 3.7% of all Youngstown residents.
| Immigration Origin | # Population | % Population |
| Africa | 121 | 0.2% |
| Argentina | 23 | 0.0% |
| Asia | 395 | 0.7% |
| Austria | 12 | 0.0% |
| Bahamas | 29 | 0.1% |
| Brazil | 11 | 0.0% |
| Canada | 11 | 0.0% |
| Caribbean | 251 | 0.4% |
| Central America | 485 | 0.8% |
| China | 14 | 0.0% |
| Colombia | 40 | 0.1% |
| Croatia | 10 | 0.0% |
| Czechoslovakia | 8 | 0.0% |
| Dominican Republic | 53 | 0.1% |
| Eastern Africa | 71 | 0.1% |
| Eastern Asia | 40 | 0.1% |
| Eastern Europe | 109 | 0.2% |
| Ecuador | 18 | 0.0% |
| England | 4 | 0.0% |
| Europe | 235 | 0.4% |
| Germany | 37 | 0.1% |
| Ghana | 14 | 0.0% |
| Guatemala | 63 | 0.1% |
| Haiti | 13 | 0.0% |
| Honduras | 232 | 0.4% |
| India | 97 | 0.2% |
| Israel | 19 | 0.0% |
| Italy | 24 | 0.0% |
| Jamaica | 92 | 0.2% |
| Japan | 4 | 0.0% |
| Jordan | 55 | 0.1% |
| Kenya | 55 | 0.1% |
| Korea | 22 | 0.0% |
| Latin America | 863 | 1.4% |
| Liberia | 8 | 0.0% |
| Mexico | 190 | 0.3% |
| Nepal | 63 | 0.1% |
| Netherlands | 9 | 0.0% |
| Nigeria | 23 | 0.0% |
| Northern Africa | 5 | 0.0% |
| Northern Europe | 33 | 0.1% |
| Oceania | 30 | 0.1% |
| Pakistan | 16 | 0.0% |
| Peru | 17 | 0.0% |
| Philippines | 53 | 0.1% |
| Portugal | 11 | 0.0% |
| Romania | 26 | 0.0% |
| Russia | 32 | 0.1% |
| Scotland | 10 | 0.0% |
| South America | 127 | 0.2% |
| South Central Asia | 189 | 0.3% |
| South Eastern Asia | 53 | 0.1% |
| Southern Europe | 35 | 0.1% |
| Sweden | 8 | 0.0% |
| Trinidad and Tobago | 32 | 0.1% |
| Ukraine | 17 | 0.0% |
| Venezuela | 18 | 0.0% |
| Western Africa | 45 | 0.1% |
| Western Asia | 74 | 0.1% |
| Western Europe | 58 | 0.1% | View All 60 Rows |
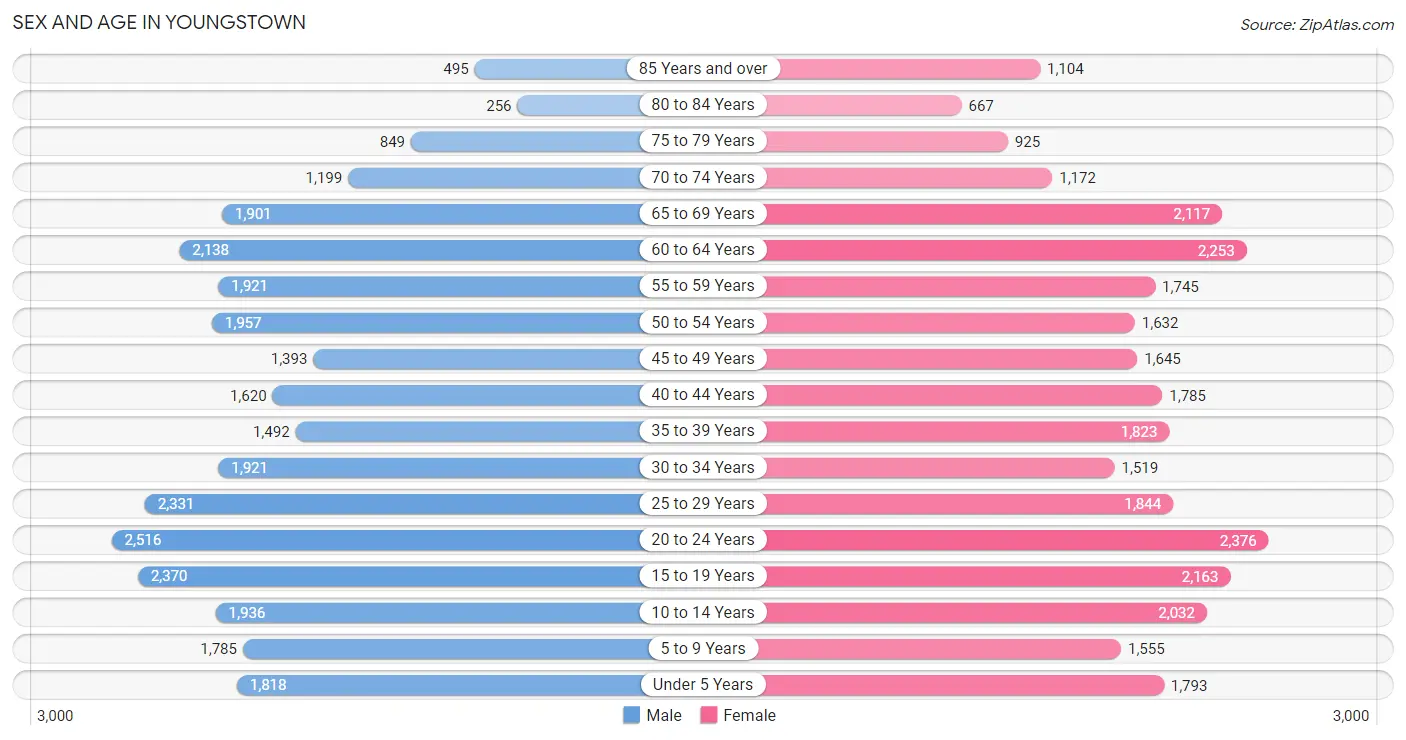
Sex and Age in Youngstown
Sex and Age in Youngstown
The most populous age groups in Youngstown are 20 to 24 Years (2,516 | 8.4%) for men and 20 to 24 Years (2,376 | 7.9%) for women.
| Age Bracket | Male | Female |
| Under 5 Years | 1,818 (6.1%) | 1,793 (5.9%) |
| 5 to 9 Years | 1,785 (6.0%) | 1,555 (5.2%) |
| 10 to 14 Years | 1,936 (6.5%) | 2,032 (6.7%) |
| 15 to 19 Years | 2,370 (7.9%) | 2,163 (7.2%) |
| 20 to 24 Years | 2,516 (8.4%) | 2,376 (7.9%) |
| 25 to 29 Years | 2,331 (7.8%) | 1,844 (6.1%) |
| 30 to 34 Years | 1,921 (6.4%) | 1,519 (5.0%) |
| 35 to 39 Years | 1,492 (5.0%) | 1,823 (6.0%) |
| 40 to 44 Years | 1,620 (5.4%) | 1,785 (5.9%) |
| 45 to 49 Years | 1,393 (4.7%) | 1,645 (5.5%) |
| 50 to 54 Years | 1,957 (6.6%) | 1,632 (5.4%) |
| 55 to 59 Years | 1,921 (6.4%) | 1,745 (5.8%) |
| 60 to 64 Years | 2,138 (7.1%) | 2,253 (7.5%) |
| 65 to 69 Years | 1,901 (6.4%) | 2,117 (7.0%) |
| 70 to 74 Years | 1,199 (4.0%) | 1,172 (3.9%) |
| 75 to 79 Years | 849 (2.8%) | 925 (3.1%) |
| 80 to 84 Years | 256 (0.9%) | 667 (2.2%) |
| 85 Years and over | 495 (1.7%) | 1,104 (3.7%) |
| Total | 29,898 (100.0%) | 30,150 (100.0%) |
Families and Households in Youngstown
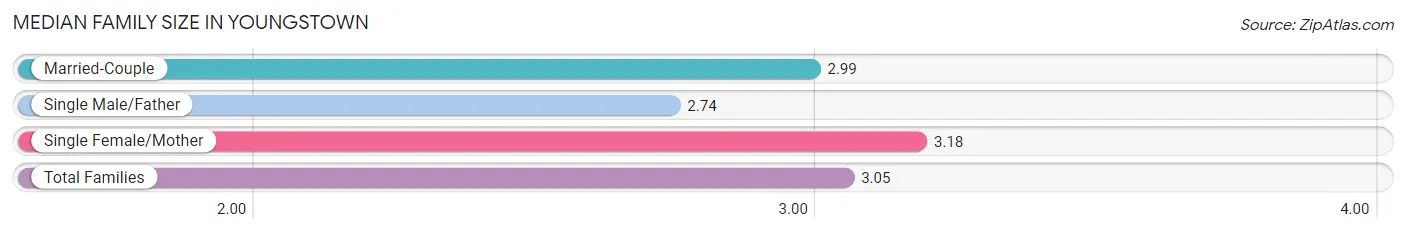
Median Family Size in Youngstown
The median family size in Youngstown is 3.05 persons per family, with single female/mother families (5,955 | 45.7%) accounting for the largest median family size of 3.18 persons per family. On the other hand, single male/father families (1,359 | 10.4%) represent the smallest median family size with 2.74 persons per family.
| Family Type | # Families | Family Size |
| Married-Couple | 5,721 (43.9%) | 2.99 |
| Single Male/Father | 1,359 (10.4%) | 2.74 |
| Single Female/Mother | 5,955 (45.7%) | 3.18 |
| Total Families | 13,035 (100.0%) | 3.05 |
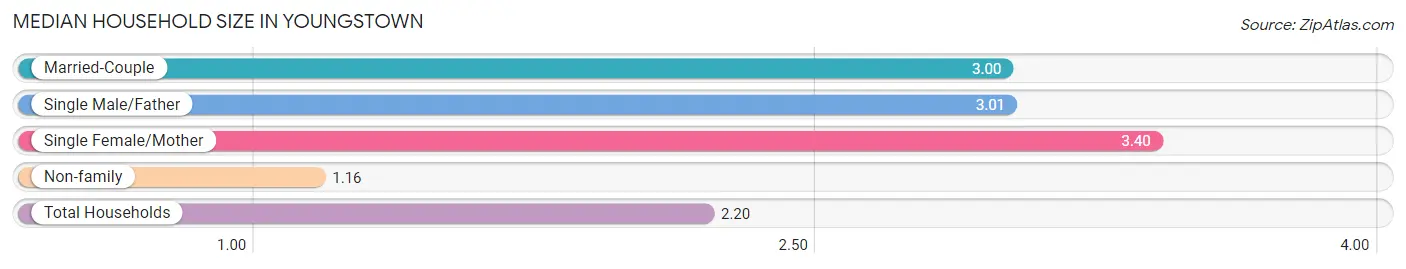
Median Household Size in Youngstown
The median household size in Youngstown is 2.20 persons per household, with single female/mother households (5,955 | 23.4%) accounting for the largest median household size of 3.4 persons per household. non-family households (12,414 | 48.8%) represent the smallest median household size with 1.16 persons per household.
| Household Type | # Households | Household Size |
| Married-Couple | 5,721 (22.5%) | 3.00 |
| Single Male/Father | 1,359 (5.3%) | 3.01 |
| Single Female/Mother | 5,955 (23.4%) | 3.40 |
| Non-family | 12,414 (48.8%) | 1.16 |
| Total Households | 25,449 (100.0%) | 2.20 |
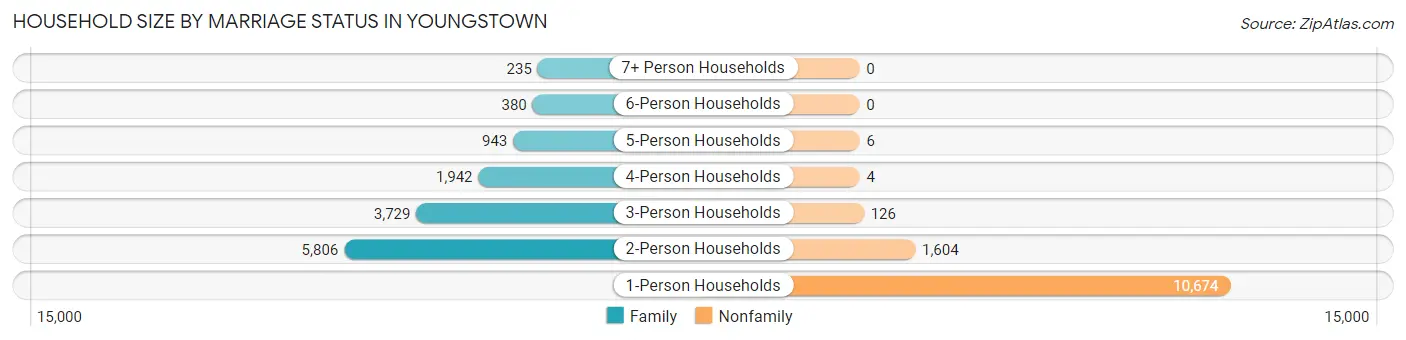
Household Size by Marriage Status in Youngstown
Out of a total of 25,449 households in Youngstown, 13,035 (51.2%) are family households, while 12,414 (48.8%) are nonfamily households. The most numerous type of family households are 2-person households, comprising 5,806, and the most common type of nonfamily households are 1-person households, comprising 10,674.
| Household Size | Family Households | Nonfamily Households |
| 1-Person Households | - | 10,674 (41.9%) |
| 2-Person Households | 5,806 (22.8%) | 1,604 (6.3%) |
| 3-Person Households | 3,729 (14.6%) | 126 (0.5%) |
| 4-Person Households | 1,942 (7.6%) | 4 (0.0%) |
| 5-Person Households | 943 (3.7%) | 6 (0.0%) |
| 6-Person Households | 380 (1.5%) | 0 (0.0%) |
| 7+ Person Households | 235 (0.9%) | 0 (0.0%) |
| Total | 13,035 (51.2%) | 12,414 (48.8%) |
Female Fertility in Youngstown
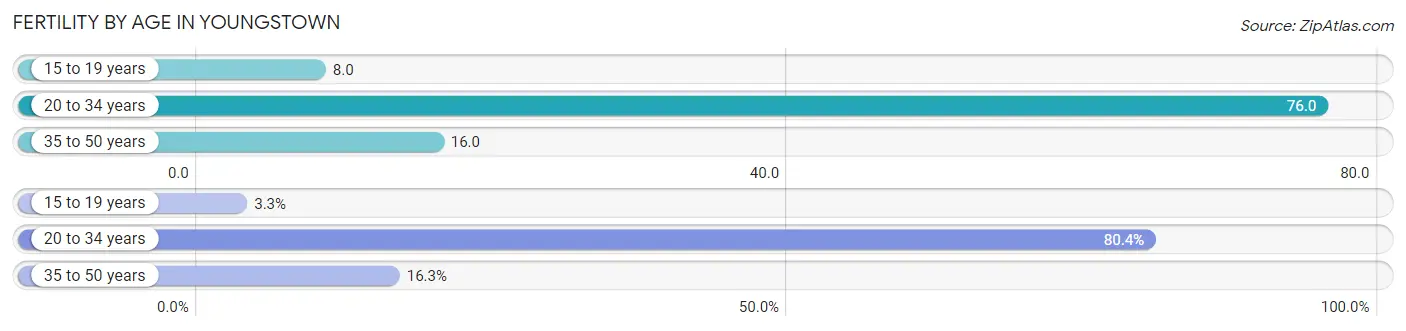
Fertility by Age in Youngstown
Average fertility rate in Youngstown is 40.0 births per 1,000 women. Women in the age bracket of 20 to 34 years have the highest fertility rate with 76.0 births per 1,000 women. Women in the age bracket of 20 to 34 years acount for 80.4% of all women with births.
| Age Bracket | Women with Births | Births / 1,000 Women |
| 15 to 19 years | 18 (3.3%) | 8.0 |
| 20 to 34 years | 435 (80.4%) | 76.0 |
| 35 to 50 years | 88 (16.3%) | 16.0 |
| Total | 541 (100.0%) | 40.0 |
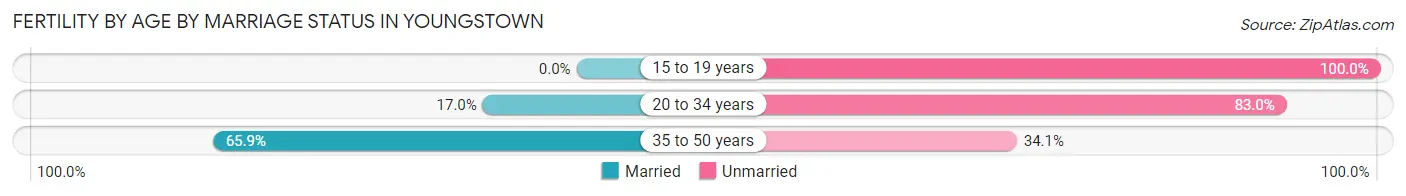
Fertility by Age by Marriage Status in Youngstown
24.4% of women with births (541) in Youngstown are married. The highest percentage of unmarried women with births falls into 15 to 19 years age bracket with 100.0% of them unmarried at the time of birth, while the lowest percentage of unmarried women with births belong to 35 to 50 years age bracket with 34.1% of them unmarried.
| Age Bracket | Married | Unmarried |
| 15 to 19 years | 0 (0.0%) | 18 (100.0%) |
| 20 to 34 years | 74 (17.0%) | 361 (83.0%) |
| 35 to 50 years | 58 (65.9%) | 30 (34.1%) |
| Total | 132 (24.4%) | 409 (75.6%) |
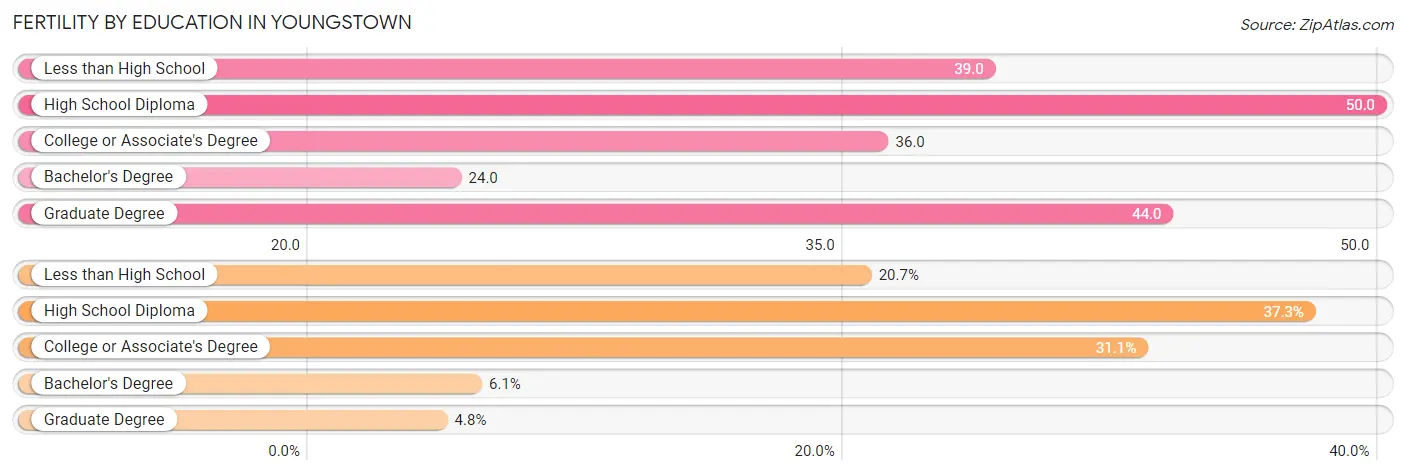
Fertility by Education in Youngstown
Average fertility rate in Youngstown is 40.0 births per 1,000 women. Women with the education attainment of high school diploma have the highest fertility rate of 50.0 births per 1,000 women, while women with the education attainment of bachelor's degree have the lowest fertility at 24.0 births per 1,000 women. Women with the education attainment of high school diploma represent 37.3% of all women with births.
| Educational Attainment | Women with Births | Births / 1,000 Women |
| Less than High School | 112 (20.7%) | 39.0 |
| High School Diploma | 202 (37.3%) | 50.0 |
| College or Associate's Degree | 168 (31.0%) | 36.0 |
| Bachelor's Degree | 33 (6.1%) | 24.0 |
| Graduate Degree | 26 (4.8%) | 44.0 |
| Total | 541 (100.0%) | 40.0 |
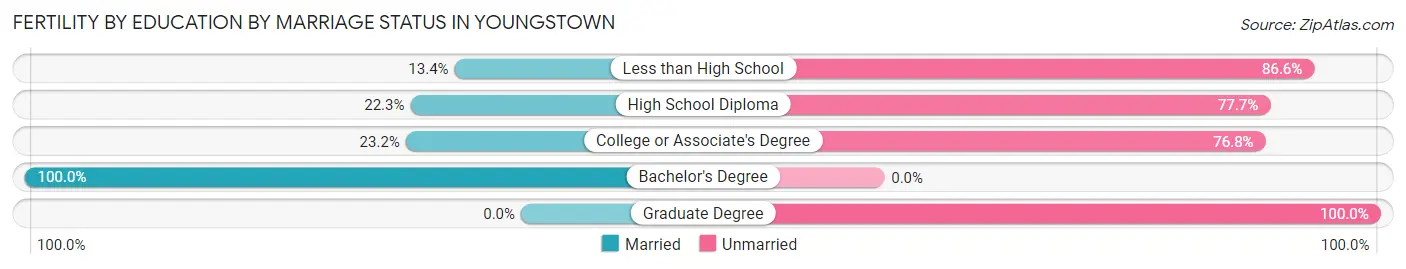
Fertility by Education by Marriage Status in Youngstown
75.6% of women with births in Youngstown are unmarried. Women with the educational attainment of bachelor's degree are most likely to be married with 100.0% of them married at childbirth, while women with the educational attainment of graduate degree are least likely to be married with 100.0% of them unmarried at childbirth.
| Educational Attainment | Married | Unmarried |
| Less than High School | 15 (13.4%) | 97 (86.6%) |
| High School Diploma | 45 (22.3%) | 157 (77.7%) |
| College or Associate's Degree | 39 (23.2%) | 129 (76.8%) |
| Bachelor's Degree | 33 (100.0%) | 0 (0.0%) |
| Graduate Degree | 0 (0.0%) | 26 (100.0%) |
| Total | 132 (24.4%) | 409 (75.6%) |
Income in Youngstown
Income Overview in Youngstown
Per Capita Income in Youngstown is $20,466, while median incomes of families and households are $41,785 and $34,295 respectively.
| Characteristic | Number | Measure |
| Per Capita Income | 60,048 | $20,466 |
| Median Family Income | 13,035 | $41,785 |
| Mean Family Income | 13,035 | $53,341 |
| Median Household Income | 25,449 | $34,295 |
| Mean Household Income | 25,449 | $46,244 |
| Income Deficit | 13,035 | $10,941 |
| Wage / Income Gap (%) | 60,048 | 11.25% |
| Wage / Income Gap ($) | 60,048 | 88.75¢ per $1 |
| Gini / Inequality Index | 60,048 | 0.47 |
Earnings by Sex in Youngstown
Average Earnings in Youngstown are $23,333, $24,782 for men and $21,994 for women, a difference of 11.3%.
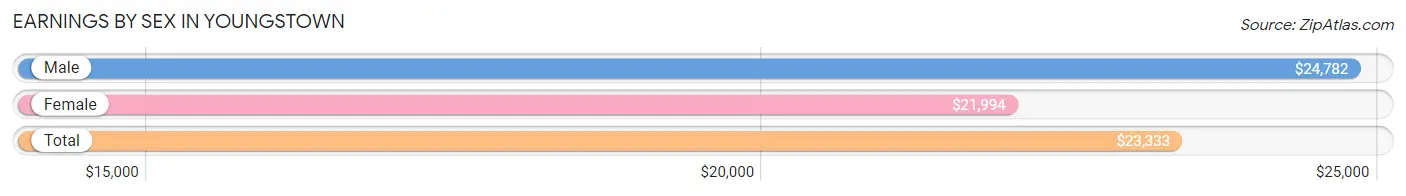
| Sex | Number | Average Earnings |
| Male | 13,488 (49.7%) | $24,782 |
| Female | 13,660 (50.3%) | $21,994 |
| Total | 27,148 (100.0%) | $23,333 |
Earnings by Sex by Income Bracket in Youngstown
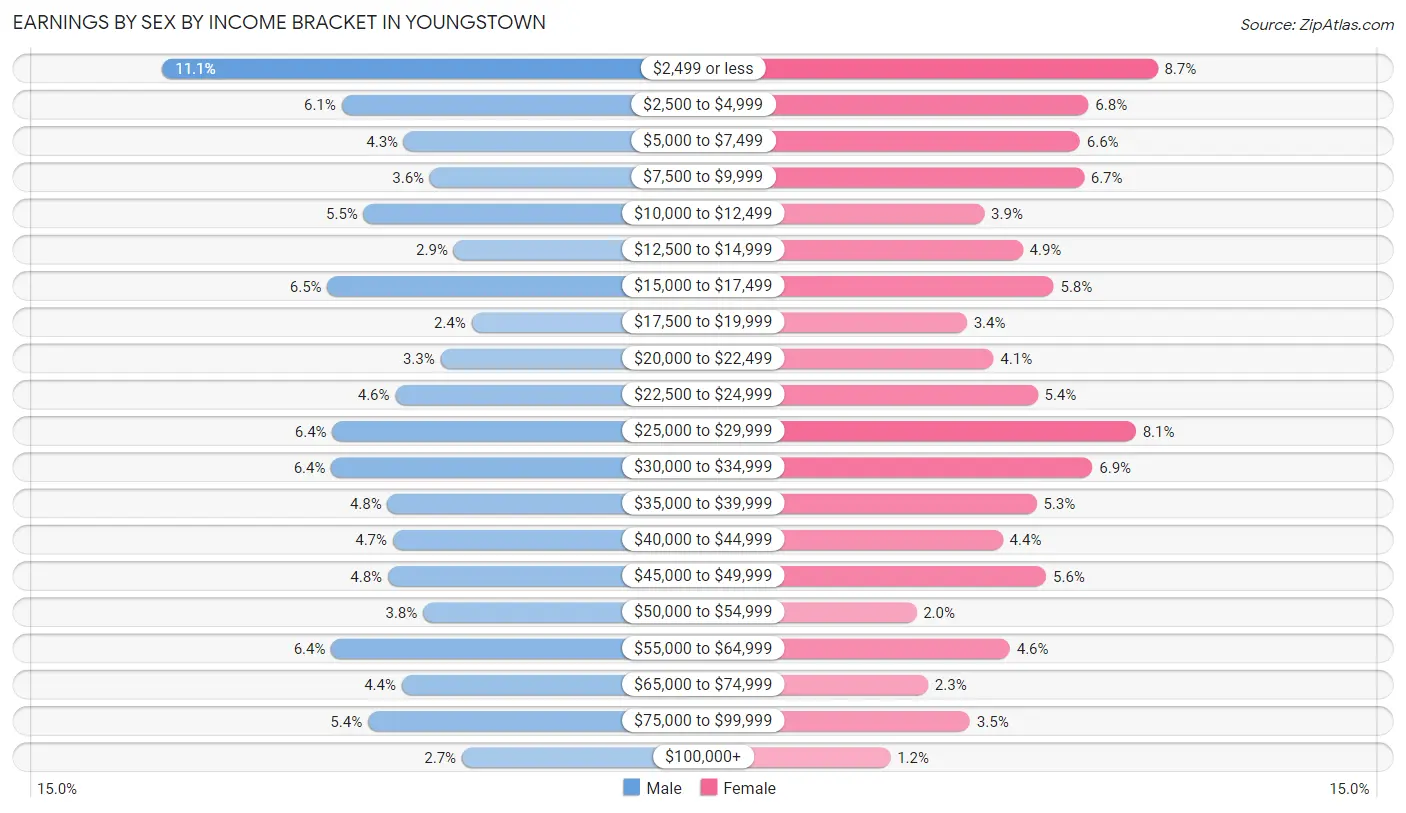
The most common earnings brackets in Youngstown are $2,499 or less for men (1,501 | 11.1%) and $2,499 or less for women (1,193 | 8.7%).
| Income | Male | Female |
| $2,499 or less | 1,501 (11.1%) | 1,193 (8.7%) |
| $2,500 to $4,999 | 822 (6.1%) | 927 (6.8%) |
| $5,000 to $7,499 | 585 (4.3%) | 895 (6.6%) |
| $7,500 to $9,999 | 487 (3.6%) | 910 (6.7%) |
| $10,000 to $12,499 | 738 (5.5%) | 527 (3.9%) |
| $12,500 to $14,999 | 396 (2.9%) | 675 (4.9%) |
| $15,000 to $17,499 | 876 (6.5%) | 793 (5.8%) |
| $17,500 to $19,999 | 329 (2.4%) | 461 (3.4%) |
| $20,000 to $22,499 | 446 (3.3%) | 563 (4.1%) |
| $22,500 to $24,999 | 618 (4.6%) | 732 (5.4%) |
| $25,000 to $29,999 | 857 (6.4%) | 1,109 (8.1%) |
| $30,000 to $34,999 | 860 (6.4%) | 942 (6.9%) |
| $35,000 to $39,999 | 648 (4.8%) | 728 (5.3%) |
| $40,000 to $44,999 | 627 (4.6%) | 598 (4.4%) |
| $45,000 to $49,999 | 646 (4.8%) | 765 (5.6%) |
| $50,000 to $54,999 | 512 (3.8%) | 267 (1.9%) |
| $55,000 to $64,999 | 860 (6.4%) | 625 (4.6%) |
| $65,000 to $74,999 | 593 (4.4%) | 312 (2.3%) |
| $75,000 to $99,999 | 722 (5.3%) | 472 (3.5%) |
| $100,000+ | 365 (2.7%) | 166 (1.2%) |
| Total | 13,488 (100.0%) | 13,660 (100.0%) |
Earnings by Sex by Educational Attainment in Youngstown
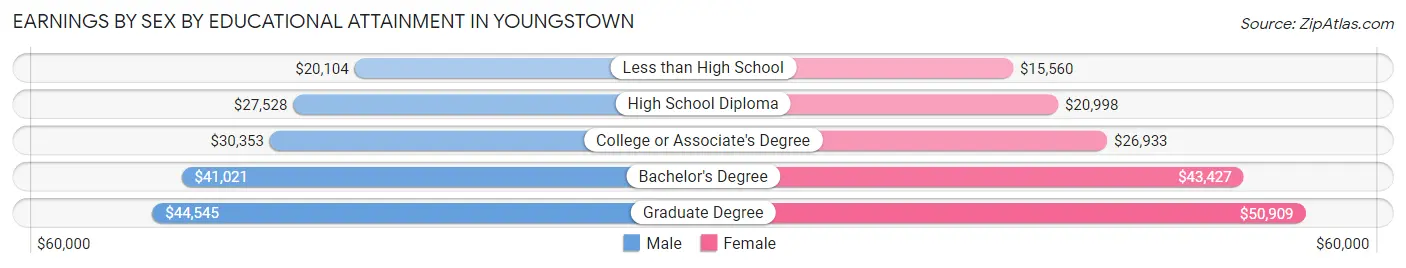
Average earnings in Youngstown are $30,308 for men and $25,685 for women, a difference of 15.2%. Men with an educational attainment of graduate degree enjoy the highest average annual earnings of $44,545, while those with less than high school education earn the least with $20,104. Women with an educational attainment of graduate degree earn the most with the average annual earnings of $50,909, while those with less than high school education have the smallest earnings of $15,560.
| Educational Attainment | Male Income | Female Income |
| Less than High School | $20,104 | $15,560 |
| High School Diploma | $27,528 | $20,998 |
| College or Associate's Degree | $30,353 | $26,933 |
| Bachelor's Degree | $41,021 | $43,427 |
| Graduate Degree | $44,545 | $50,909 |
| Total | $30,308 | $25,685 |
Family Income in Youngstown
Family Income Brackets in Youngstown
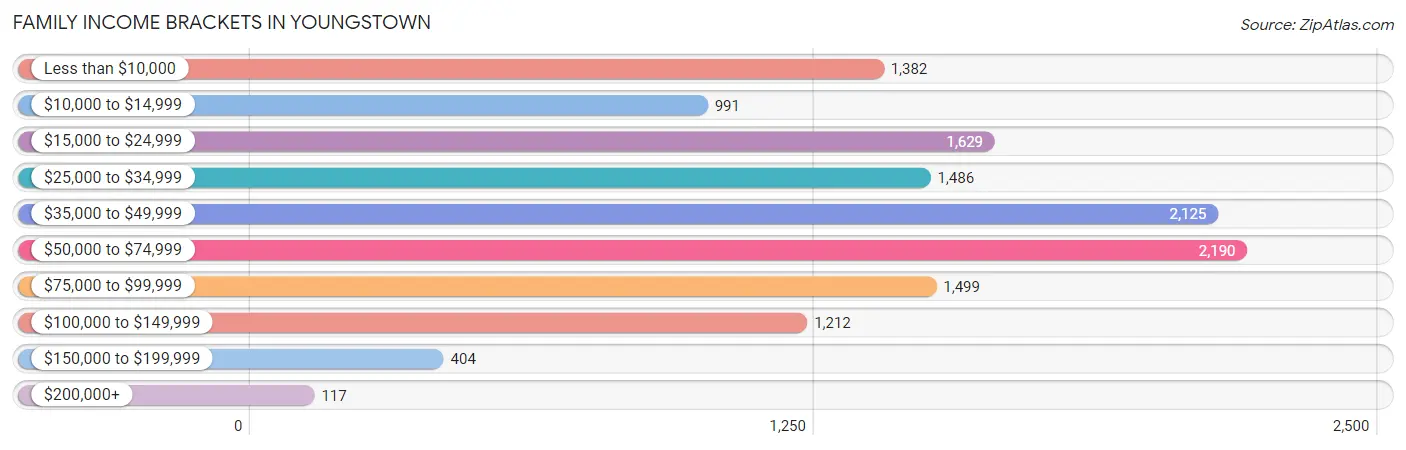
According to the Youngstown family income data, there are 2,190 families falling into the $50,000 to $74,999 income range, which is the most common income bracket and makes up 16.8% of all families. Conversely, the $200,000+ income bracket is the least frequent group with only 117 families (0.9%) belonging to this category.
| Income Bracket | # Families | % Families |
| Less than $10,000 | 1,382 | 10.6% |
| $10,000 to $14,999 | 991 | 7.6% |
| $15,000 to $24,999 | 1,629 | 12.5% |
| $25,000 to $34,999 | 1,486 | 11.4% |
| $35,000 to $49,999 | 2,125 | 16.3% |
| $50,000 to $74,999 | 2,190 | 16.8% |
| $75,000 to $99,999 | 1,499 | 11.5% |
| $100,000 to $149,999 | 1,212 | 9.3% |
| $150,000 to $199,999 | 404 | 3.1% |
| $200,000+ | 117 | 0.9% |
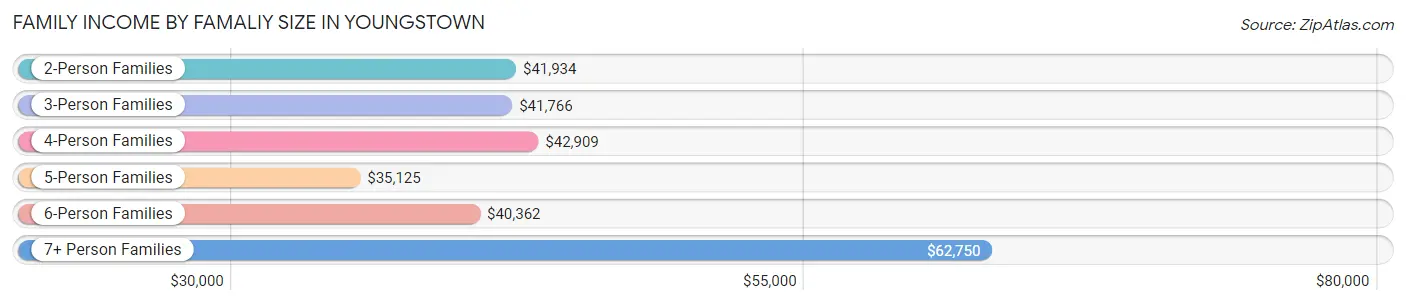
Family Income by Famaliy Size in Youngstown
7+ person families (227 | 1.7%) account for the highest median family income in Youngstown with $62,750 per family, while 2-person families (6,383 | 49.0%) have the highest median income of $20,967 per family member.
| Income Bracket | # Families | Median Income |
| 2-Person Families | 6,383 (49.0%) | $41,934 |
| 3-Person Families | 3,682 (28.2%) | $41,766 |
| 4-Person Families | 1,717 (13.2%) | $42,909 |
| 5-Person Families | 721 (5.5%) | $35,125 |
| 6-Person Families | 305 (2.3%) | $40,362 |
| 7+ Person Families | 227 (1.7%) | $62,750 |
| Total | 13,035 (100.0%) | $41,785 |
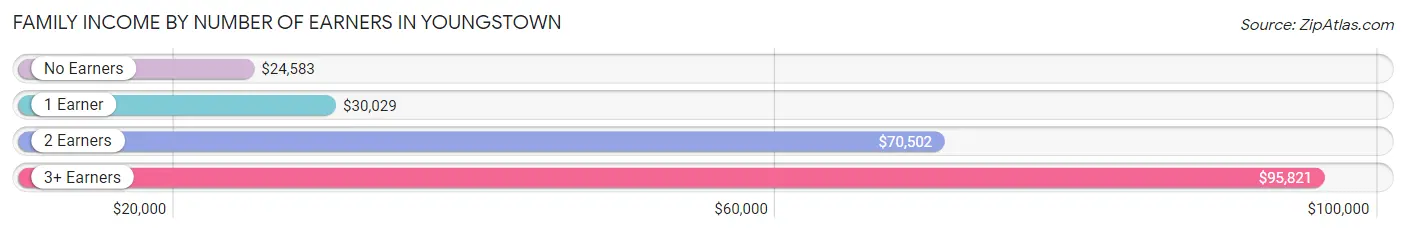
Family Income by Number of Earners in Youngstown
The median family income in Youngstown is $41,785, with families comprising 3+ earners (985) having the highest median family income of $95,821, while families with no earners (2,725) have the lowest median family income of $24,583, accounting for 7.6% and 20.9% of families, respectively.
| Number of Earners | # Families | Median Income |
| No Earners | 2,725 (20.9%) | $24,583 |
| 1 Earner | 5,676 (43.5%) | $30,029 |
| 2 Earners | 3,649 (28.0%) | $70,502 |
| 3+ Earners | 985 (7.6%) | $95,821 |
| Total | 13,035 (100.0%) | $41,785 |
Household Income in Youngstown
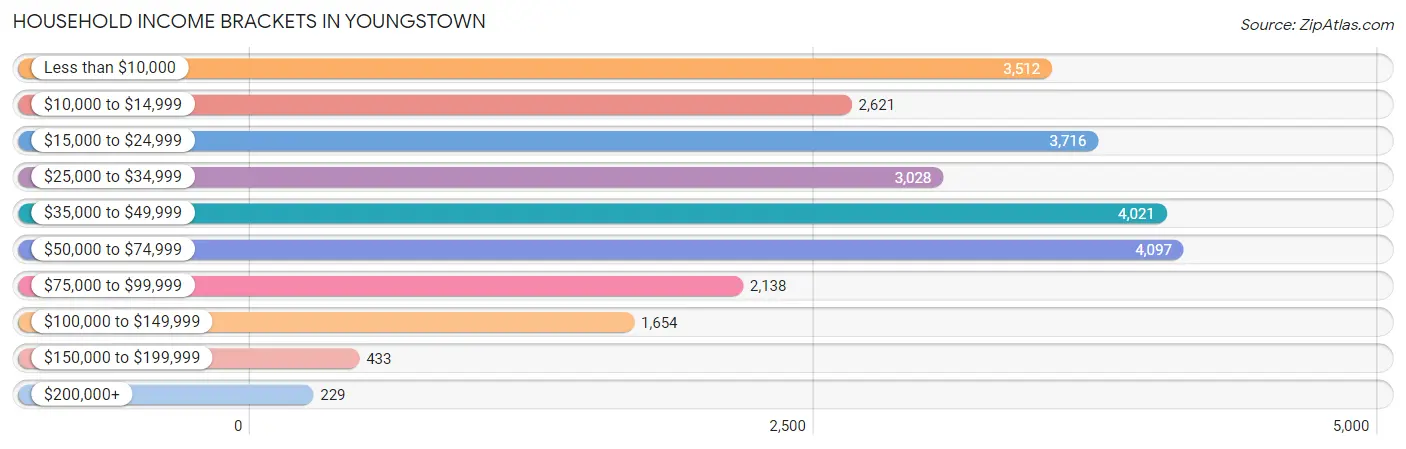
Household Income Brackets in Youngstown
With 4,097 households falling in the category, the $50,000 to $74,999 income range is the most frequent in Youngstown, accounting for 16.1% of all households. In contrast, only 229 households (0.9%) fall into the $200,000+ income bracket, making it the least populous group.
| Income Bracket | # Households | % Households |
| Less than $10,000 | 3,512 | 13.8% |
| $10,000 to $14,999 | 2,621 | 10.3% |
| $15,000 to $24,999 | 3,716 | 14.6% |
| $25,000 to $34,999 | 3,028 | 11.9% |
| $35,000 to $49,999 | 4,021 | 15.8% |
| $50,000 to $74,999 | 4,097 | 16.1% |
| $75,000 to $99,999 | 2,138 | 8.4% |
| $100,000 to $149,999 | 1,654 | 6.5% |
| $150,000 to $199,999 | 433 | 1.7% |
| $200,000+ | 229 | 0.9% |
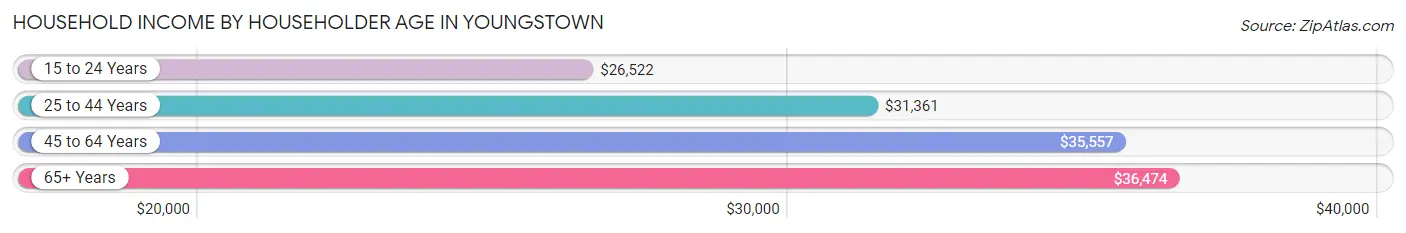
Household Income by Householder Age in Youngstown
The median household income in Youngstown is $34,295, with the highest median household income of $36,474 found in the 65+ years age bracket for the primary householder. A total of 7,269 households (28.6%) fall into this category. Meanwhile, the 15 to 24 years age bracket for the primary householder has the lowest median household income of $26,522, with 1,388 households (5.4%) in this group.
| Income Bracket | # Households | Median Income |
| 15 to 24 Years | 1,388 (5.4%) | $26,522 |
| 25 to 44 Years | 7,015 (27.6%) | $31,361 |
| 45 to 64 Years | 9,777 (38.4%) | $35,557 |
| 65+ Years | 7,269 (28.6%) | $36,474 |
| Total | 25,449 (100.0%) | $34,295 |
Poverty in Youngstown
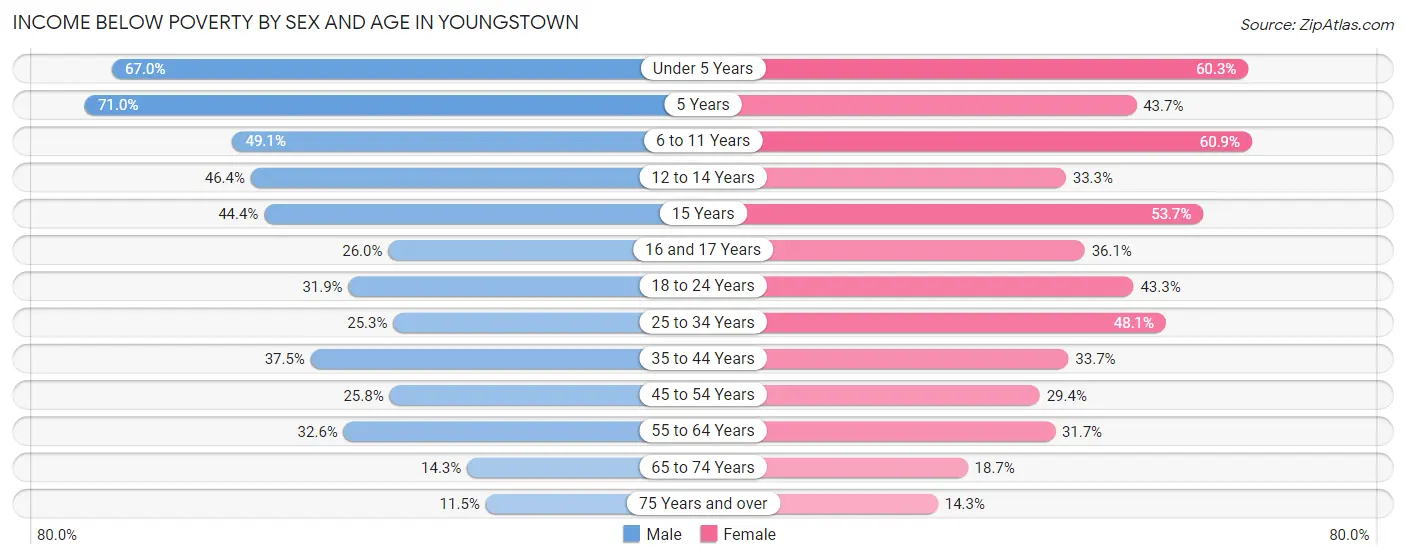
Income Below Poverty by Sex and Age in Youngstown
With 32.8% poverty level for males and 36.1% for females among the residents of Youngstown, 5 year old males and 6 to 11 year old females are the most vulnerable to poverty, with 255 males (71.0%) and 1,266 females (60.9%) in their respective age groups living below the poverty level.
| Age Bracket | Male | Female |
| Under 5 Years | 1,207 (67.0%) | 1,071 (60.3%) |
| 5 Years | 255 (71.0%) | 80 (43.7%) |
| 6 to 11 Years | 995 (49.1%) | 1,266 (60.9%) |
| 12 to 14 Years | 608 (46.4%) | 435 (33.3%) |
| 15 Years | 175 (44.4%) | 212 (53.7%) |
| 16 and 17 Years | 243 (26.0%) | 255 (36.1%) |
| 18 to 24 Years | 889 (31.9%) | 1,187 (43.3%) |
| 25 to 34 Years | 880 (25.3%) | 1,609 (48.1%) |
| 35 to 44 Years | 986 (37.5%) | 1,208 (33.7%) |
| 45 to 54 Years | 827 (25.8%) | 957 (29.4%) |
| 55 to 64 Years | 1,273 (32.6%) | 1,256 (31.7%) |
| 65 to 74 Years | 426 (14.3%) | 609 (18.7%) |
| 75 Years and over | 169 (11.5%) | 346 (14.3%) |
| Total | 8,933 (32.8%) | 10,491 (36.1%) |
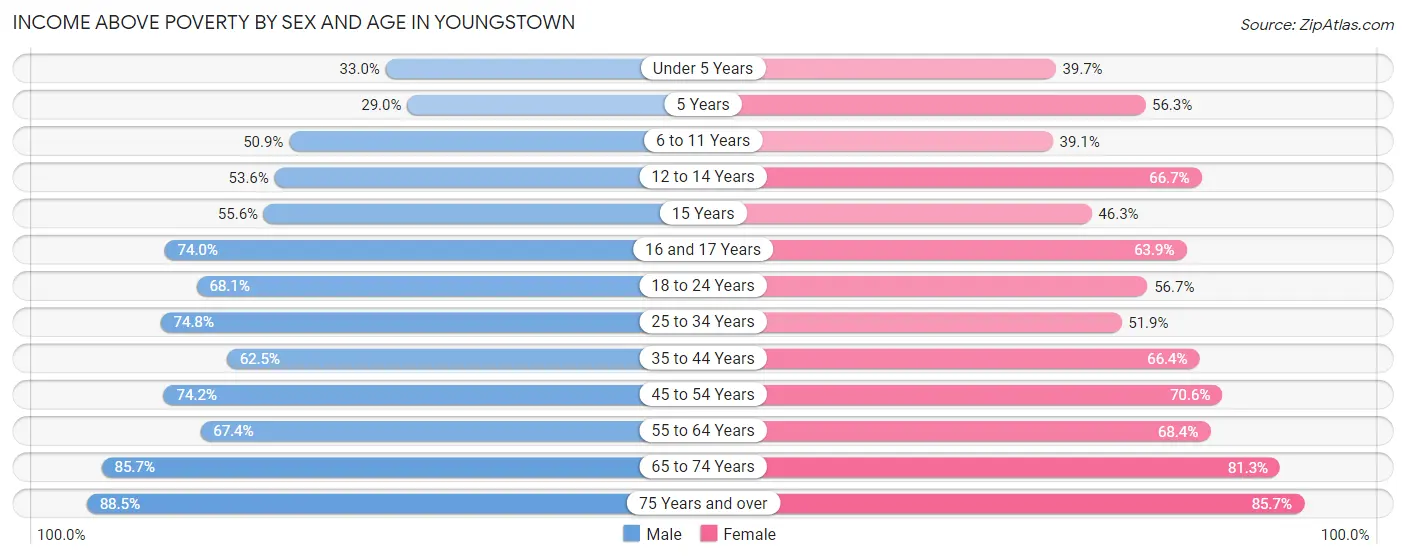
Income Above Poverty by Sex and Age in Youngstown
According to the poverty statistics in Youngstown, males aged 75 years and over and females aged 75 years and over are the age groups that are most secure financially, with 88.5% of males and 85.7% of females in these age groups living above the poverty line.
| Age Bracket | Male | Female |
| Under 5 Years | 594 (33.0%) | 704 (39.7%) |
| 5 Years | 104 (29.0%) | 103 (56.3%) |
| 6 to 11 Years | 1,031 (50.9%) | 813 (39.1%) |
| 12 to 14 Years | 702 (53.6%) | 873 (66.7%) |
| 15 Years | 219 (55.6%) | 183 (46.3%) |
| 16 and 17 Years | 692 (74.0%) | 452 (63.9%) |
| 18 to 24 Years | 1,897 (68.1%) | 1,554 (56.7%) |
| 25 to 34 Years | 2,605 (74.8%) | 1,735 (51.9%) |
| 35 to 44 Years | 1,642 (62.5%) | 2,382 (66.3%) |
| 45 to 54 Years | 2,376 (74.2%) | 2,299 (70.6%) |
| 55 to 64 Years | 2,630 (67.4%) | 2,713 (68.3%) |
| 65 to 74 Years | 2,556 (85.7%) | 2,652 (81.3%) |
| 75 Years and over | 1,295 (88.5%) | 2,081 (85.7%) |
| Total | 18,343 (67.2%) | 18,544 (63.9%) |
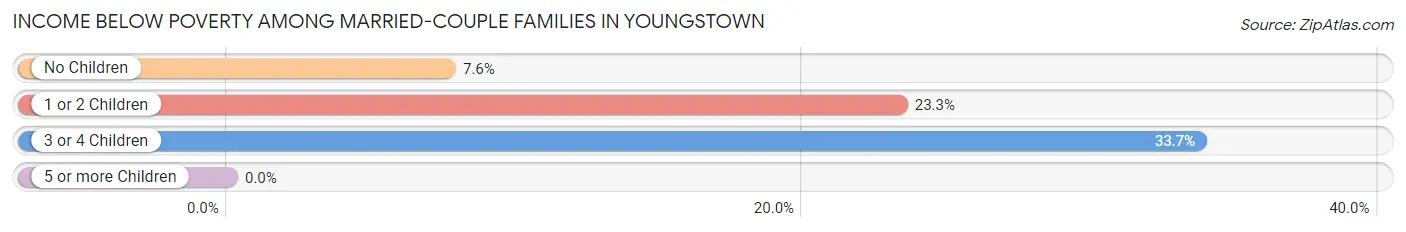
Income Below Poverty Among Married-Couple Families in Youngstown
The poverty statistics for married-couple families in Youngstown show that 13.2% or 757 of the total 5,721 families live below the poverty line. Families with 3 or 4 children have the highest poverty rate of 33.7%, comprising of 141 families. On the other hand, families with 5 or more children have the lowest poverty rate of 0.0%, which includes 0 families.
| Children | Above Poverty | Below Poverty |
| No Children | 3,618 (92.4%) | 297 (7.6%) |
| 1 or 2 Children | 1,049 (76.7%) | 319 (23.3%) |
| 3 or 4 Children | 277 (66.3%) | 141 (33.7%) |
| 5 or more Children | 20 (100.0%) | 0 (0.0%) |
| Total | 4,964 (86.8%) | 757 (13.2%) |
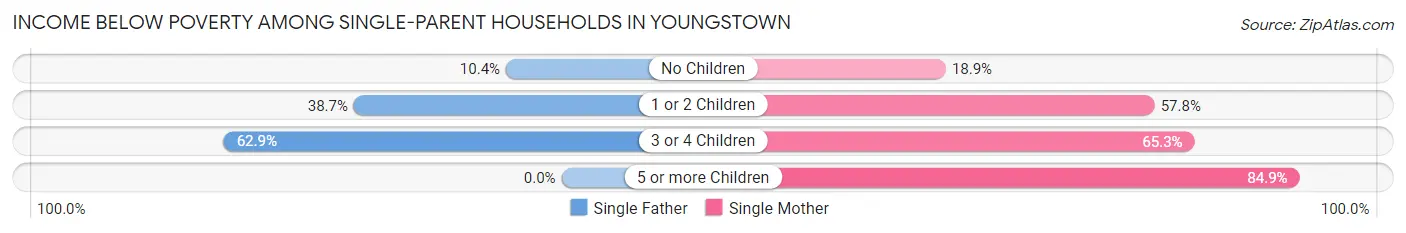
Income Below Poverty Among Single-Parent Households in Youngstown
According to the poverty data in Youngstown, 25.1% or 341 single-father households and 48.8% or 2,906 single-mother households are living below the poverty line. Among single-father households, those with 3 or 4 children have the highest poverty rate, with 39 households (62.9%) experiencing poverty. Likewise, among single-mother households, those with 5 or more children have the highest poverty rate, with 118 households (84.9%) falling below the poverty line.
| Children | Single Father | Single Mother |
| No Children | 73 (10.3%) | 307 (18.9%) |
| 1 or 2 Children | 229 (38.7%) | 1,942 (57.8%) |
| 3 or 4 Children | 39 (62.9%) | 539 (65.3%) |
| 5 or more Children | 0 (0.0%) | 118 (84.9%) |
| Total | 341 (25.1%) | 2,906 (48.8%) |
Income Below Poverty Among Married-Couple vs Single-Parent Households in Youngstown
The poverty data for Youngstown shows that 757 of the married-couple family households (13.2%) and 3,247 of the single-parent households (44.4%) are living below the poverty level. Within the married-couple family households, those with 3 or 4 children have the highest poverty rate, with 141 households (33.7%) falling below the poverty line. Among the single-parent households, those with 5 or more children have the highest poverty rate, with 118 household (84.9%) living below poverty.
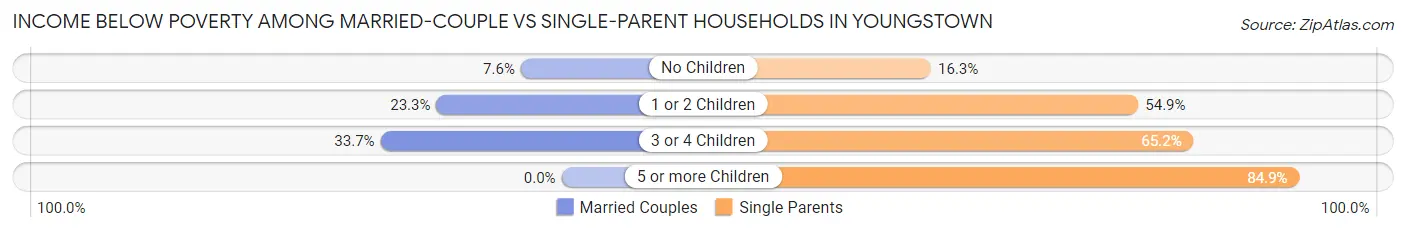
| Children | Married-Couple Families | Single-Parent Households |
| No Children | 297 (7.6%) | 380 (16.3%) |
| 1 or 2 Children | 319 (23.3%) | 2,171 (54.9%) |
| 3 or 4 Children | 141 (33.7%) | 578 (65.2%) |
| 5 or more Children | 0 (0.0%) | 118 (84.9%) |
| Total | 757 (13.2%) | 3,247 (44.4%) |
Employment Characteristics in Youngstown
Employment by Class of Employer in Youngstown
Among the 21,382 employed individuals in Youngstown, private company employees (15,300 | 71.6%), not-for-profit organizations (2,332 | 10.9%), and local government employees (1,543 | 7.2%) make up the most common classes of employment.
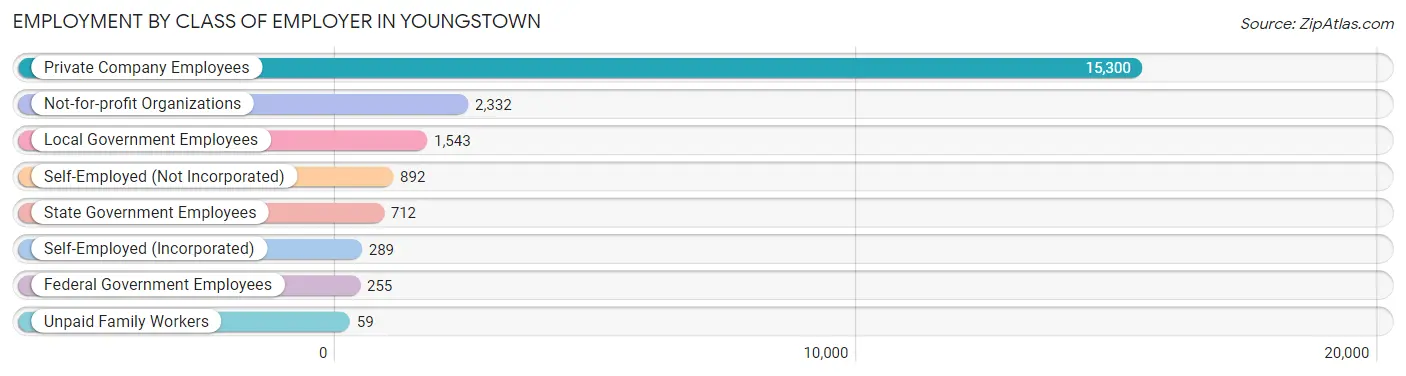
| Employer Class | # Employees | % Employees |
| Private Company Employees | 15,300 | 71.6% |
| Self-Employed (Incorporated) | 289 | 1.3% |
| Self-Employed (Not Incorporated) | 892 | 4.2% |
| Not-for-profit Organizations | 2,332 | 10.9% |
| Local Government Employees | 1,543 | 7.2% |
| State Government Employees | 712 | 3.3% |
| Federal Government Employees | 255 | 1.2% |
| Unpaid Family Workers | 59 | 0.3% |
| Total | 21,382 | 100.0% |
Employment Status by Age in Youngstown
According to the labor force statistics for Youngstown, out of the total population over 16 years of age (48,329), 53.2% or 25,711 individuals are in the labor force, with 13.2% or 3,394 of them unemployed. The age group with the highest labor force participation rate is 25 to 29 years, with 73.5% or 3,069 individuals in the labor force. Within the labor force, the 16 to 19 years age range has the highest percentage of unemployed individuals, with 31.1% or 510 of them being unemployed.
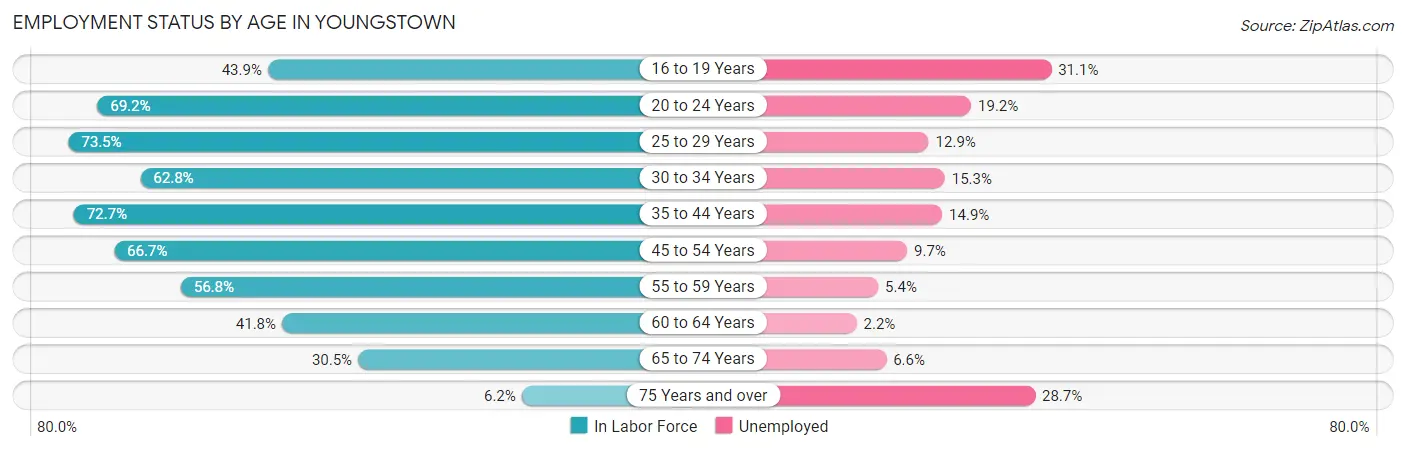
| Age Bracket | In Labor Force | Unemployed |
| 16 to 19 Years | 1,639 (43.9%) | 510 (31.1%) |
| 20 to 24 Years | 3,385 (69.2%) | 650 (19.2%) |
| 25 to 29 Years | 3,069 (73.5%) | 396 (12.9%) |
| 30 to 34 Years | 2,160 (62.8%) | 330 (15.3%) |
| 35 to 44 Years | 4,885 (72.7%) | 728 (14.9%) |
| 45 to 54 Years | 4,420 (66.7%) | 429 (9.7%) |
| 55 to 59 Years | 2,082 (56.8%) | 112 (5.4%) |
| 60 to 64 Years | 1,835 (41.8%) | 40 (2.2%) |
| 65 to 74 Years | 1,949 (30.5%) | 129 (6.6%) |
| 75 Years and over | 266 (6.2%) | 76 (28.7%) |
| Total | 25,711 (53.2%) | 3,394 (13.2%) |
Employment Status by Educational Attainment in Youngstown
According to labor force statistics for Youngstown, 63.6% of individuals (18,456) out of the total population between 25 and 64 years of age (29,019) are in the labor force, with 11.0% or 2,030 of them being unemployed. The group with the highest labor force participation rate are those with the educational attainment of bachelor's degree or higher, with 82.6% or 3,615 individuals in the labor force. Within the labor force, individuals with less than high school education have the highest percentage of unemployment, with 19.3% or 424 of them being unemployed.
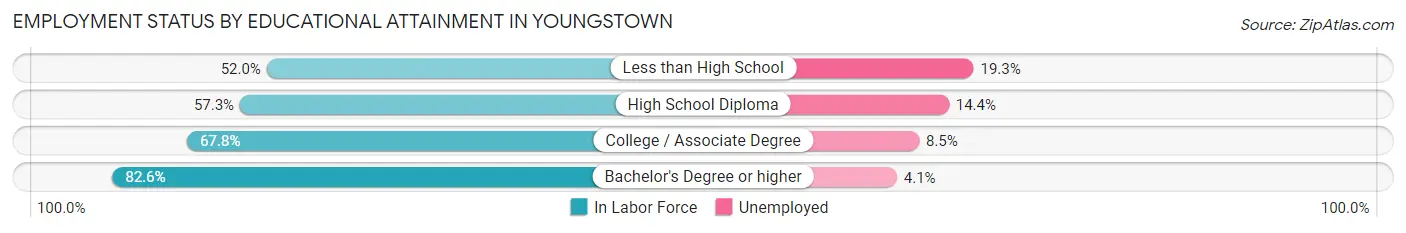
| Educational Attainment | In Labor Force | Unemployed |
| Less than High School | 2,199 (52.0%) | 816 (19.3%) |
| High School Diploma | 6,530 (57.3%) | 1,641 (14.4%) |
| College / Associate Degree | 6,113 (67.8%) | 766 (8.5%) |
| Bachelor's Degree or higher | 3,615 (82.6%) | 179 (4.1%) |
| Total | 18,456 (63.6%) | 3,192 (11.0%) |
Employment Occupations by Sex in Youngstown
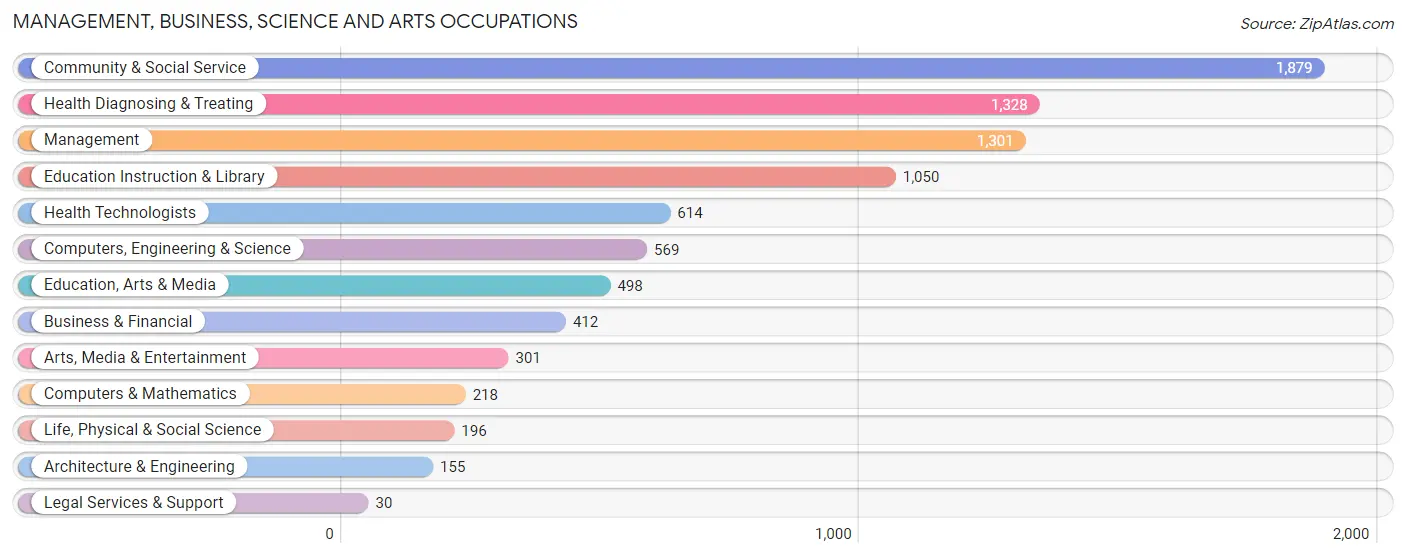
Management, Business, Science and Arts Occupations
The most common Management, Business, Science and Arts occupations in Youngstown are Community & Social Service (1,879 | 8.4%), Health Diagnosing & Treating (1,328 | 6.0%), Management (1,301 | 5.8%), Education Instruction & Library (1,050 | 4.7%), and Health Technologists (614 | 2.8%).
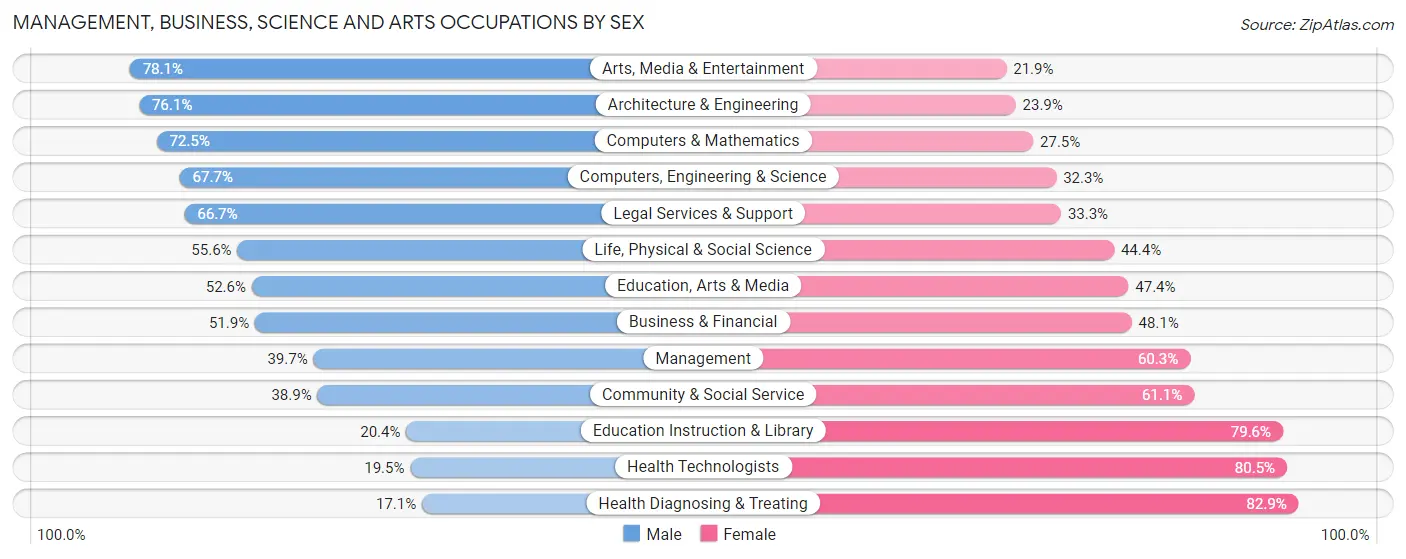
Management, Business, Science and Arts Occupations by Sex
Within the Management, Business, Science and Arts occupations in Youngstown, the most male-oriented occupations are Arts, Media & Entertainment (78.1%), Architecture & Engineering (76.1%), and Computers & Mathematics (72.5%), while the most female-oriented occupations are Health Diagnosing & Treating (82.9%), Health Technologists (80.5%), and Education Instruction & Library (79.6%).
| Occupation | Male | Female |
| Management | 517 (39.7%) | 784 (60.3%) |
| Business & Financial | 214 (51.9%) | 198 (48.1%) |
| Computers, Engineering & Science | 385 (67.7%) | 184 (32.3%) |
| Computers & Mathematics | 158 (72.5%) | 60 (27.5%) |
| Architecture & Engineering | 118 (76.1%) | 37 (23.9%) |
| Life, Physical & Social Science | 109 (55.6%) | 87 (44.4%) |
| Community & Social Service | 731 (38.9%) | 1,148 (61.1%) |
| Education, Arts & Media | 262 (52.6%) | 236 (47.4%) |
| Legal Services & Support | 20 (66.7%) | 10 (33.3%) |
| Education Instruction & Library | 214 (20.4%) | 836 (79.6%) |
| Arts, Media & Entertainment | 235 (78.1%) | 66 (21.9%) |
| Health Diagnosing & Treating | 227 (17.1%) | 1,101 (82.9%) |
| Health Technologists | 120 (19.5%) | 494 (80.5%) |
| Total (Category) | 2,074 (37.8%) | 3,415 (62.2%) |
| Total (Overall) | 10,608 (47.6%) | 11,657 (52.4%) |
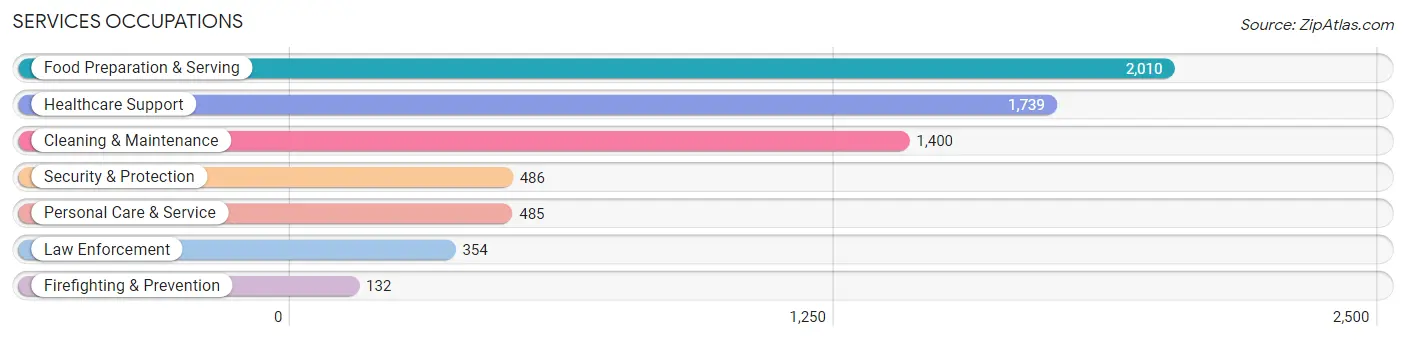
Services Occupations
The most common Services occupations in Youngstown are Food Preparation & Serving (2,010 | 9.0%), Healthcare Support (1,739 | 7.8%), Cleaning & Maintenance (1,400 | 6.3%), Security & Protection (486 | 2.2%), and Personal Care & Service (485 | 2.2%).
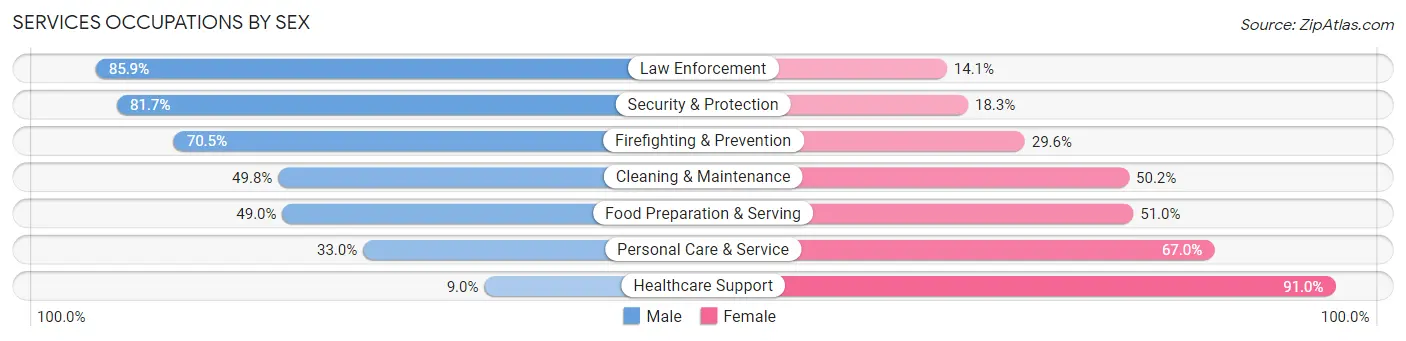
Services Occupations by Sex
Within the Services occupations in Youngstown, the most male-oriented occupations are Law Enforcement (85.9%), Security & Protection (81.7%), and Firefighting & Prevention (70.5%), while the most female-oriented occupations are Healthcare Support (91.0%), Personal Care & Service (67.0%), and Food Preparation & Serving (51.0%).
| Occupation | Male | Female |
| Healthcare Support | 156 (9.0%) | 1,583 (91.0%) |
| Security & Protection | 397 (81.7%) | 89 (18.3%) |
| Firefighting & Prevention | 93 (70.5%) | 39 (29.5%) |
| Law Enforcement | 304 (85.9%) | 50 (14.1%) |
| Food Preparation & Serving | 984 (49.0%) | 1,026 (51.0%) |
| Cleaning & Maintenance | 697 (49.8%) | 703 (50.2%) |
| Personal Care & Service | 160 (33.0%) | 325 (67.0%) |
| Total (Category) | 2,394 (39.1%) | 3,726 (60.9%) |
| Total (Overall) | 10,608 (47.6%) | 11,657 (52.4%) |
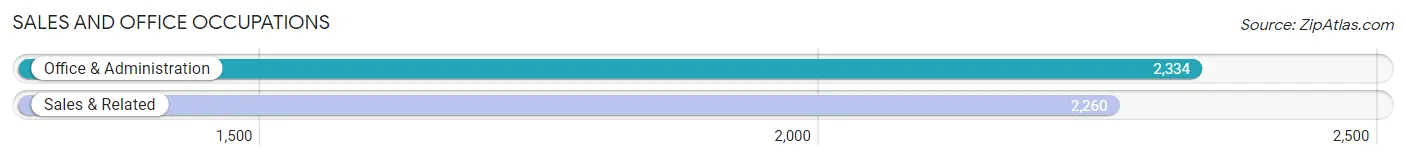
Sales and Office Occupations
The most common Sales and Office occupations in Youngstown are Office & Administration (2,334 | 10.5%), and Sales & Related (2,260 | 10.2%).
Sales and Office Occupations by Sex
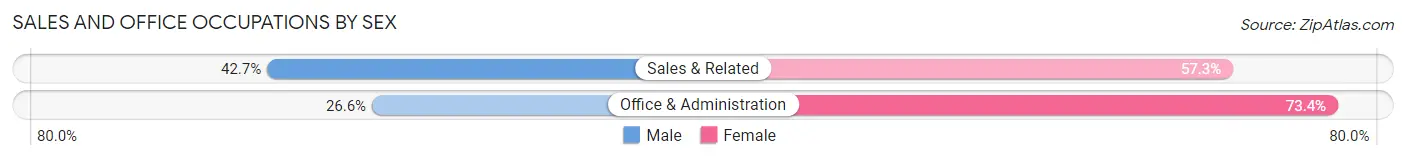
| Occupation | Male | Female |
| Sales & Related | 965 (42.7%) | 1,295 (57.3%) |
| Office & Administration | 620 (26.6%) | 1,714 (73.4%) |
| Total (Category) | 1,585 (34.5%) | 3,009 (65.5%) |
| Total (Overall) | 10,608 (47.6%) | 11,657 (52.4%) |
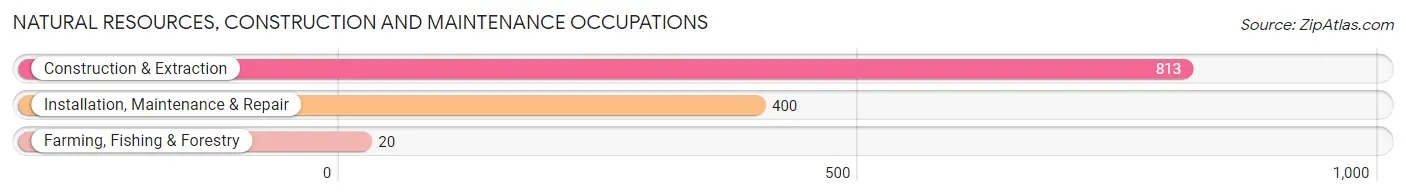
Natural Resources, Construction and Maintenance Occupations
The most common Natural Resources, Construction and Maintenance occupations in Youngstown are Construction & Extraction (813 | 3.6%), Installation, Maintenance & Repair (400 | 1.8%), and Farming, Fishing & Forestry (20 | 0.1%).
Natural Resources, Construction and Maintenance Occupations by Sex
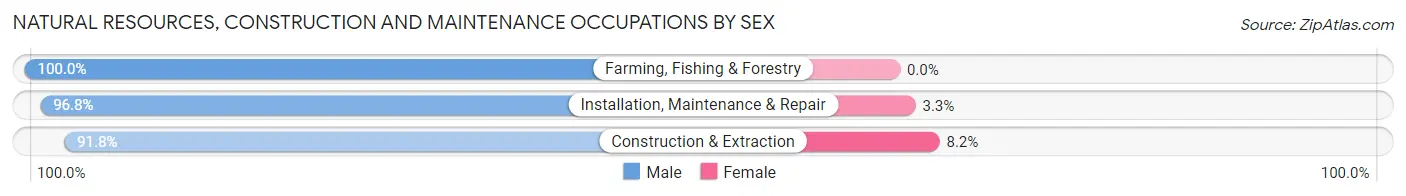
| Occupation | Male | Female |
| Farming, Fishing & Forestry | 20 (100.0%) | 0 (0.0%) |
| Construction & Extraction | 746 (91.8%) | 67 (8.2%) |
| Installation, Maintenance & Repair | 387 (96.8%) | 13 (3.3%) |
| Total (Category) | 1,153 (93.5%) | 80 (6.5%) |
| Total (Overall) | 10,608 (47.6%) | 11,657 (52.4%) |
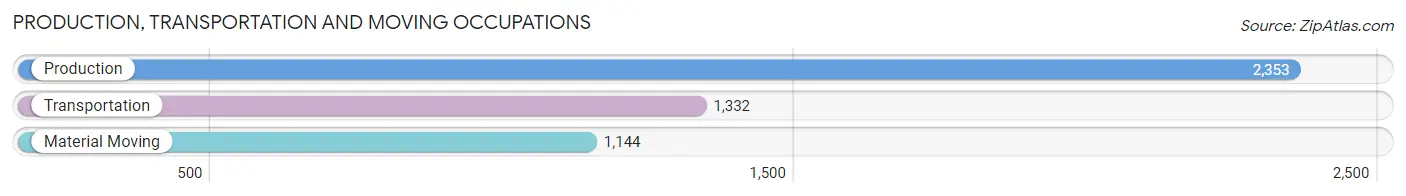
Production, Transportation and Moving Occupations
The most common Production, Transportation and Moving occupations in Youngstown are Production (2,353 | 10.6%), Transportation (1,332 | 6.0%), and Material Moving (1,144 | 5.1%).
Production, Transportation and Moving Occupations by Sex
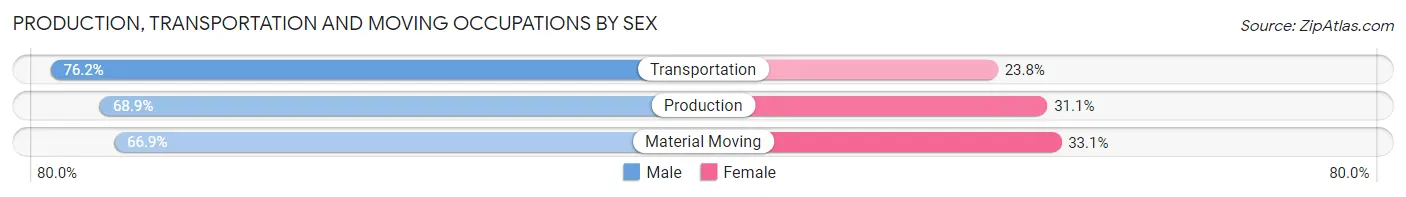
| Occupation | Male | Female |
| Production | 1,622 (68.9%) | 731 (31.1%) |
| Transportation | 1,015 (76.2%) | 317 (23.8%) |
| Material Moving | 765 (66.9%) | 379 (33.1%) |
| Total (Category) | 3,402 (70.5%) | 1,427 (29.5%) |
| Total (Overall) | 10,608 (47.6%) | 11,657 (52.4%) |
Employment Industries by Sex in Youngstown
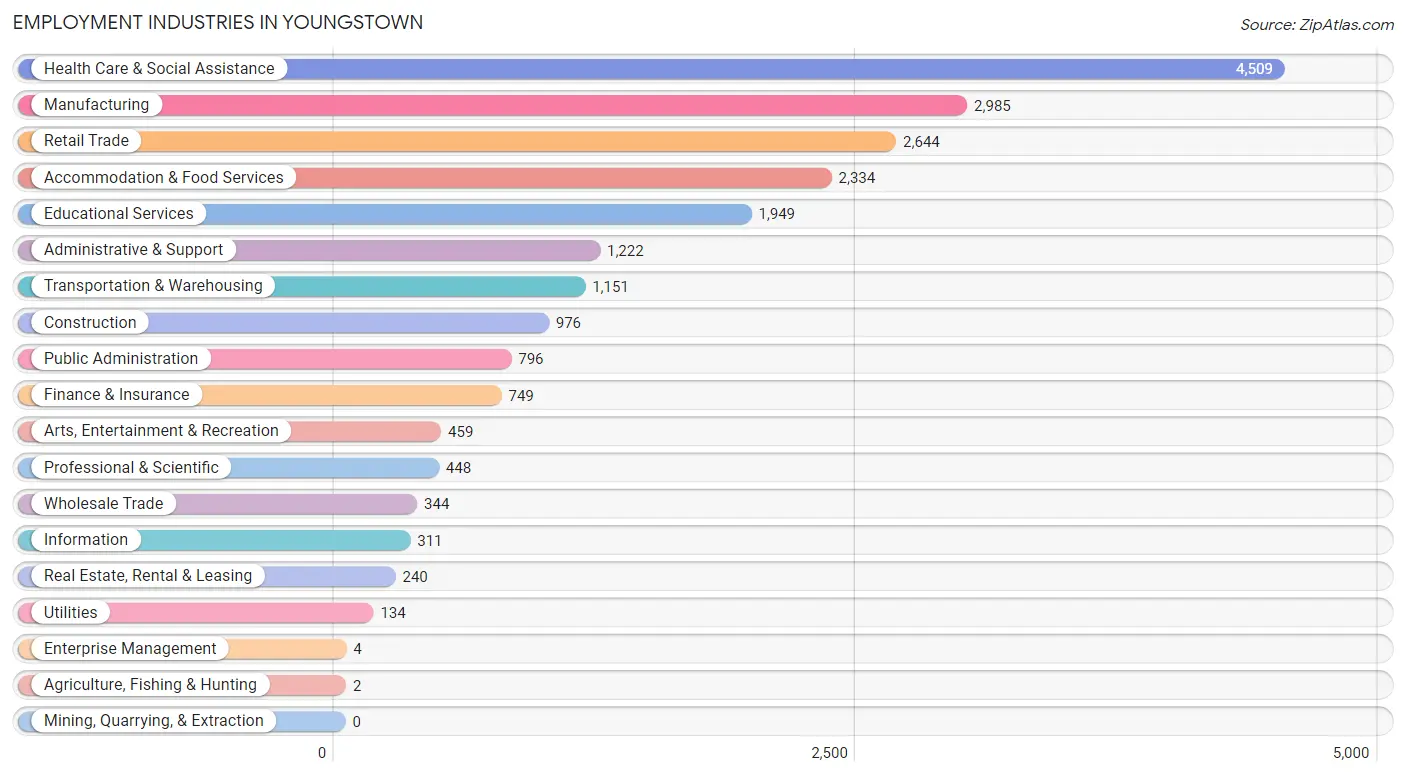
Employment Industries in Youngstown
The major employment industries in Youngstown include Health Care & Social Assistance (4,509 | 20.3%), Manufacturing (2,985 | 13.4%), Retail Trade (2,644 | 11.9%), Accommodation & Food Services (2,334 | 10.5%), and Educational Services (1,949 | 8.7%).
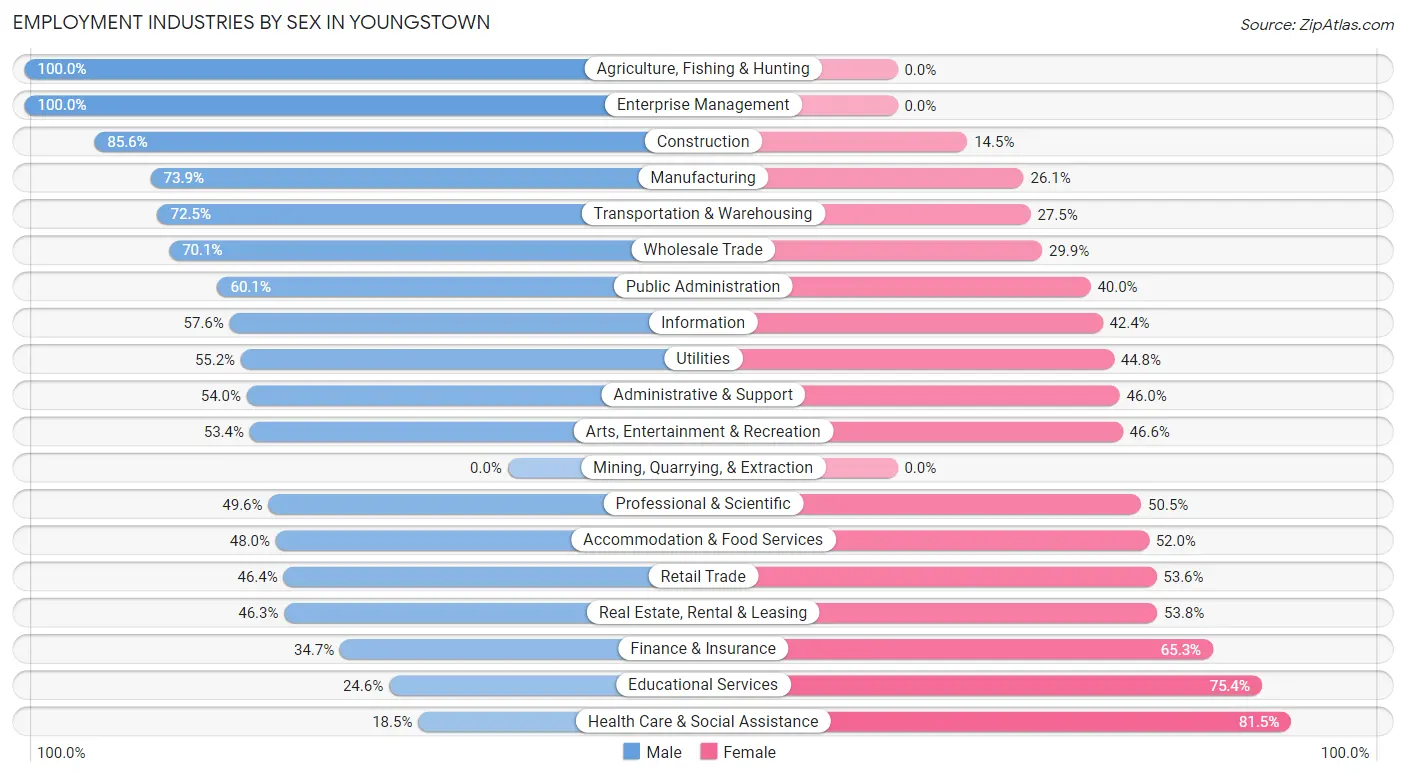
Employment Industries by Sex in Youngstown
The Youngstown industries that see more men than women are Agriculture, Fishing & Hunting (100.0%), Enterprise Management (100.0%), and Construction (85.6%), whereas the industries that tend to have a higher number of women are Health Care & Social Assistance (81.5%), Educational Services (75.4%), and Finance & Insurance (65.3%).
| Industry | Male | Female |
| Agriculture, Fishing & Hunting | 2 (100.0%) | 0 (0.0%) |
| Mining, Quarrying, & Extraction | 0 (0.0%) | 0 (0.0%) |
| Construction | 835 (85.6%) | 141 (14.4%) |
| Manufacturing | 2,206 (73.9%) | 779 (26.1%) |
| Wholesale Trade | 241 (70.1%) | 103 (29.9%) |
| Retail Trade | 1,227 (46.4%) | 1,417 (53.6%) |
| Transportation & Warehousing | 834 (72.5%) | 317 (27.5%) |
| Utilities | 74 (55.2%) | 60 (44.8%) |
| Information | 179 (57.6%) | 132 (42.4%) |
| Finance & Insurance | 260 (34.7%) | 489 (65.3%) |
| Real Estate, Rental & Leasing | 111 (46.3%) | 129 (53.7%) |
| Professional & Scientific | 222 (49.5%) | 226 (50.4%) |
| Enterprise Management | 4 (100.0%) | 0 (0.0%) |
| Administrative & Support | 660 (54.0%) | 562 (46.0%) |
| Educational Services | 479 (24.6%) | 1,470 (75.4%) |
| Health Care & Social Assistance | 835 (18.5%) | 3,674 (81.5%) |
| Arts, Entertainment & Recreation | 245 (53.4%) | 214 (46.6%) |
| Accommodation & Food Services | 1,120 (48.0%) | 1,214 (52.0%) |
| Public Administration | 478 (60.1%) | 318 (40.0%) |
| Total | 10,608 (47.6%) | 11,657 (52.4%) |
Education in Youngstown
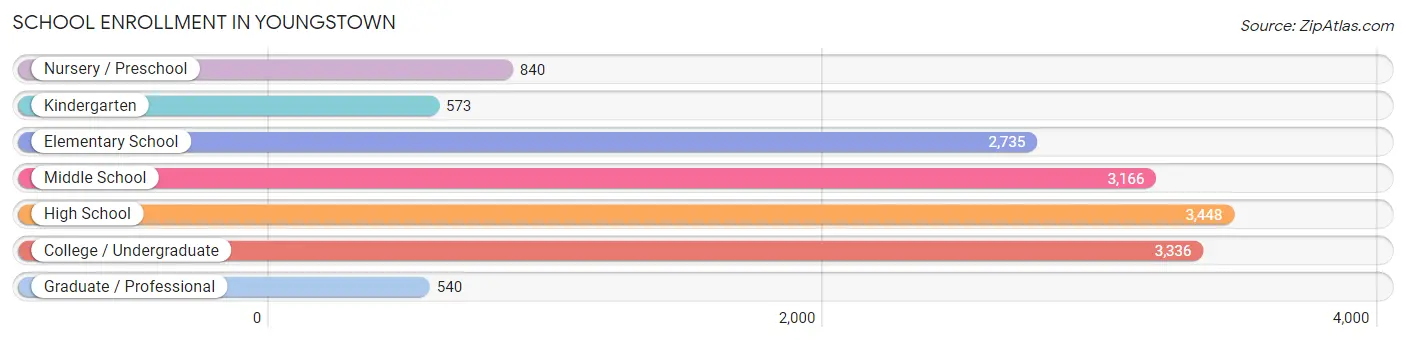
School Enrollment in Youngstown
The most common levels of schooling among the 14,638 students in Youngstown are high school (3,448 | 23.6%), college / undergraduate (3,336 | 22.8%), and middle school (3,166 | 21.6%).
| School Level | # Students | % Students |
| Nursery / Preschool | 840 | 5.7% |
| Kindergarten | 573 | 3.9% |
| Elementary School | 2,735 | 18.7% |
| Middle School | 3,166 | 21.6% |
| High School | 3,448 | 23.6% |
| College / Undergraduate | 3,336 | 22.8% |
| Graduate / Professional | 540 | 3.7% |
| Total | 14,638 | 100.0% |
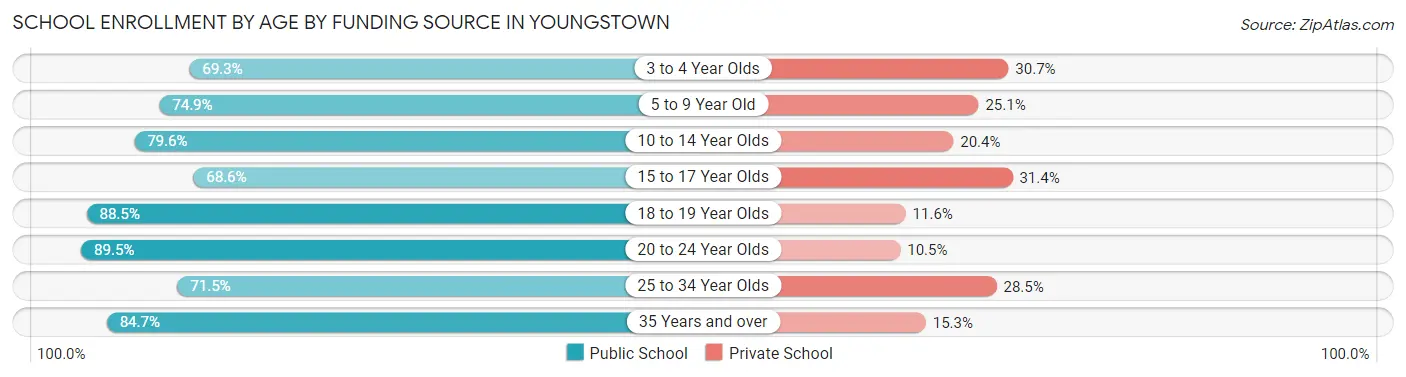
School Enrollment by Age by Funding Source in Youngstown
Out of a total of 14,638 students who are enrolled in schools in Youngstown, 3,162 (21.6%) attend a private institution, while the remaining 11,476 (78.4%) are enrolled in public schools. The age group of 15 to 17 year olds has the highest likelihood of being enrolled in private schools, with 732 (31.4% in the age bracket) enrolled. Conversely, the age group of 20 to 24 year olds has the lowest likelihood of being enrolled in a private school, with 1,469 (89.5% in the age bracket) attending a public institution.
| Age Bracket | Public School | Private School |
| 3 to 4 Year Olds | 436 (69.3%) | 193 (30.7%) |
| 5 to 9 Year Old | 2,359 (74.9%) | 791 (25.1%) |
| 10 to 14 Year Olds | 3,141 (79.6%) | 806 (20.4%) |
| 15 to 17 Year Olds | 1,596 (68.6%) | 732 (31.4%) |
| 18 to 19 Year Olds | 1,294 (88.4%) | 169 (11.6%) |
| 20 to 24 Year Olds | 1,469 (89.5%) | 173 (10.5%) |
| 25 to 34 Year Olds | 422 (71.5%) | 168 (28.5%) |
| 35 Years and over | 753 (84.7%) | 136 (15.3%) |
| Total | 11,476 (78.4%) | 3,162 (21.6%) |
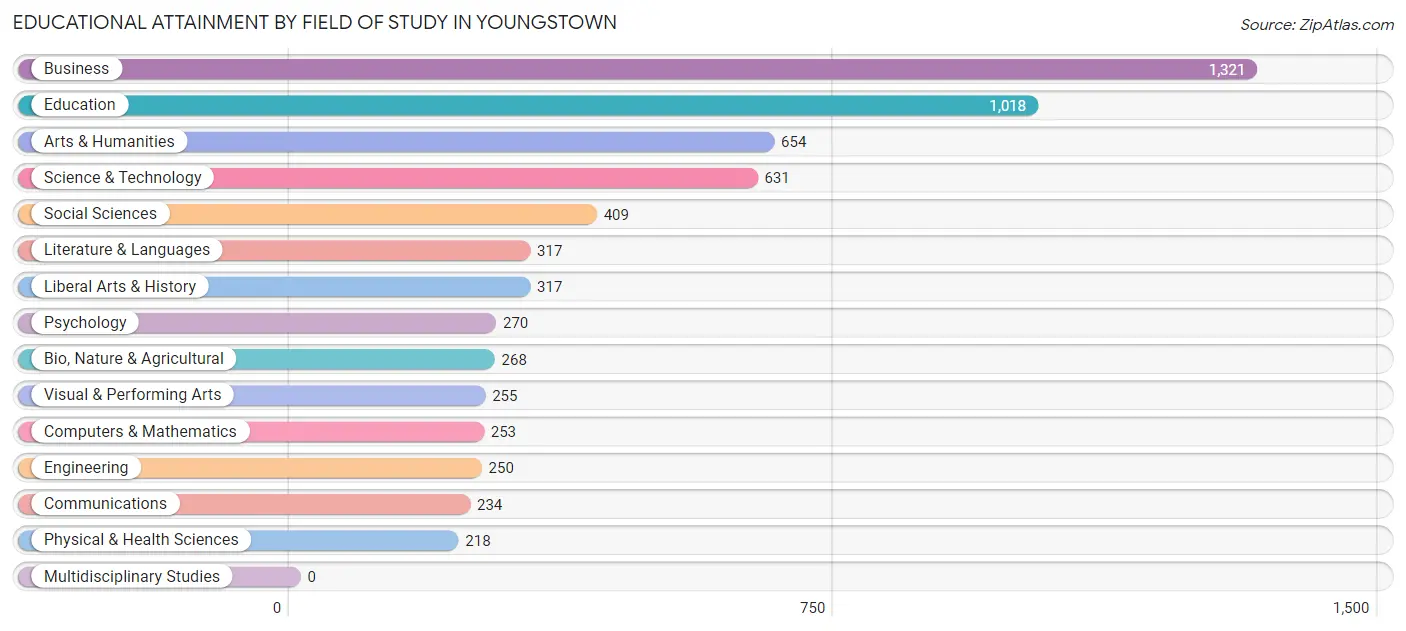
Educational Attainment by Field of Study in Youngstown
Business (1,321 | 20.6%), education (1,018 | 15.9%), arts & humanities (654 | 10.2%), science & technology (631 | 9.8%), and social sciences (409 | 6.4%) are the most common fields of study among 6,415 individuals in Youngstown who have obtained a bachelor's degree or higher.
| Field of Study | # Graduates | % Graduates |
| Computers & Mathematics | 253 | 3.9% |
| Bio, Nature & Agricultural | 268 | 4.2% |
| Physical & Health Sciences | 218 | 3.4% |
| Psychology | 270 | 4.2% |
| Social Sciences | 409 | 6.4% |
| Engineering | 250 | 3.9% |
| Multidisciplinary Studies | 0 | 0.0% |
| Science & Technology | 631 | 9.8% |
| Business | 1,321 | 20.6% |
| Education | 1,018 | 15.9% |
| Literature & Languages | 317 | 4.9% |
| Liberal Arts & History | 317 | 4.9% |
| Visual & Performing Arts | 255 | 4.0% |
| Communications | 234 | 3.6% |
| Arts & Humanities | 654 | 10.2% |
| Total | 6,415 | 100.0% |
Transportation & Commute in Youngstown
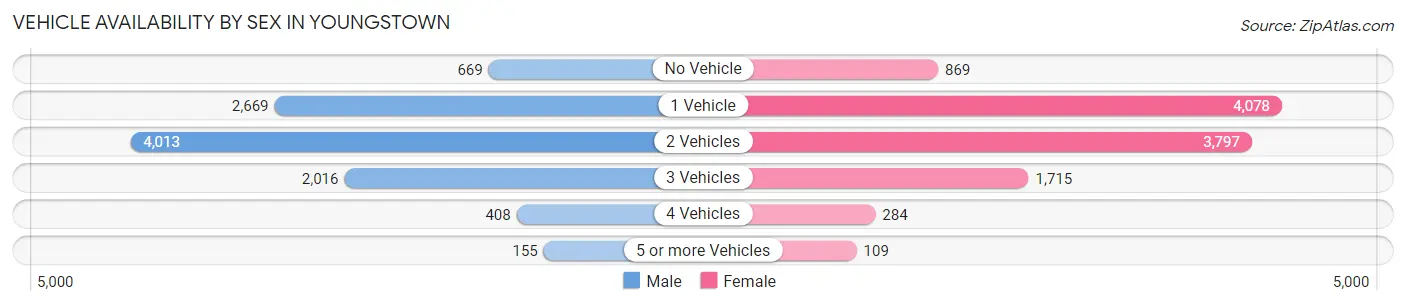
Vehicle Availability by Sex in Youngstown
The most prevalent vehicle ownership categories in Youngstown are males with 2 vehicles (4,013, accounting for 40.4%) and females with 2 vehicles (3,797, making up 37.0%).
| Vehicles Available | Male | Female |
| No Vehicle | 669 (6.7%) | 869 (8.0%) |
| 1 Vehicle | 2,669 (26.9%) | 4,078 (37.6%) |
| 2 Vehicles | 4,013 (40.4%) | 3,797 (35.0%) |
| 3 Vehicles | 2,016 (20.3%) | 1,715 (15.8%) |
| 4 Vehicles | 408 (4.1%) | 284 (2.6%) |
| 5 or more Vehicles | 155 (1.6%) | 109 (1.0%) |
| Total | 9,930 (100.0%) | 10,852 (100.0%) |
Commute Time in Youngstown
The most frequently occuring commute durations in Youngstown are 15 to 19 minutes (4,711 commuters, 23.3%), 10 to 14 minutes (4,534 commuters, 22.5%), and 20 to 24 minutes (3,006 commuters, 14.9%).
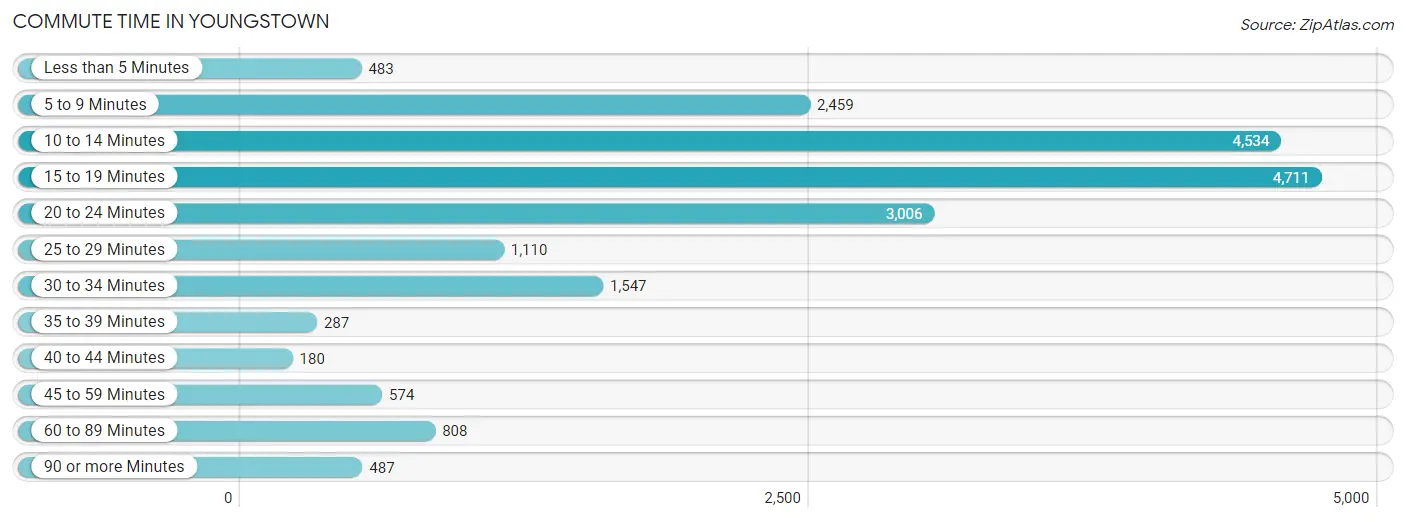
| Commute Time | # Commuters | % Commuters |
| Less than 5 Minutes | 483 | 2.4% |
| 5 to 9 Minutes | 2,459 | 12.2% |
| 10 to 14 Minutes | 4,534 | 22.5% |
| 15 to 19 Minutes | 4,711 | 23.3% |
| 20 to 24 Minutes | 3,006 | 14.9% |
| 25 to 29 Minutes | 1,110 | 5.5% |
| 30 to 34 Minutes | 1,547 | 7.7% |
| 35 to 39 Minutes | 287 | 1.4% |
| 40 to 44 Minutes | 180 | 0.9% |
| 45 to 59 Minutes | 574 | 2.8% |
| 60 to 89 Minutes | 808 | 4.0% |
| 90 or more Minutes | 487 | 2.4% |
Commute Time by Sex in Youngstown
The most common commute times in Youngstown are 10 to 14 minutes (2,281 commuters, 23.3%) for males and 15 to 19 minutes (2,525 commuters, 24.3%) for females.
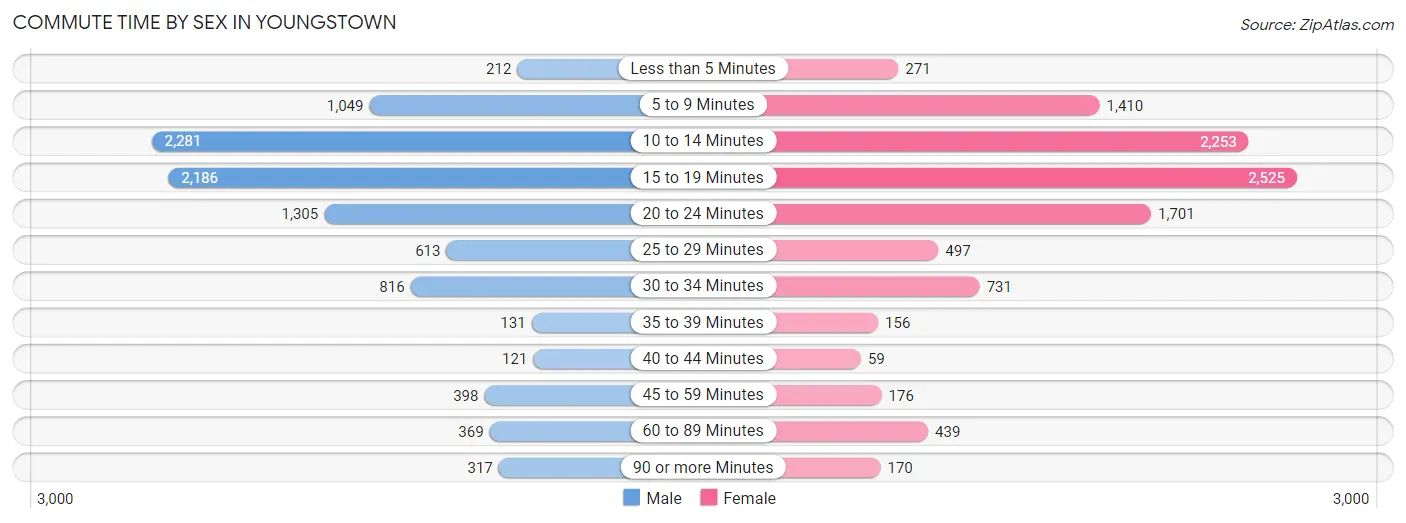
| Commute Time | Male | Female |
| Less than 5 Minutes | 212 (2.2%) | 271 (2.6%) |
| 5 to 9 Minutes | 1,049 (10.7%) | 1,410 (13.6%) |
| 10 to 14 Minutes | 2,281 (23.3%) | 2,253 (21.7%) |
| 15 to 19 Minutes | 2,186 (22.3%) | 2,525 (24.3%) |
| 20 to 24 Minutes | 1,305 (13.3%) | 1,701 (16.4%) |
| 25 to 29 Minutes | 613 (6.3%) | 497 (4.8%) |
| 30 to 34 Minutes | 816 (8.3%) | 731 (7.0%) |
| 35 to 39 Minutes | 131 (1.3%) | 156 (1.5%) |
| 40 to 44 Minutes | 121 (1.2%) | 59 (0.6%) |
| 45 to 59 Minutes | 398 (4.1%) | 176 (1.7%) |
| 60 to 89 Minutes | 369 (3.8%) | 439 (4.2%) |
| 90 or more Minutes | 317 (3.2%) | 170 (1.6%) |
Time of Departure to Work by Sex in Youngstown
The most frequent times of departure to work in Youngstown are 12:00 PM to 3:59 PM (1,427, 14.6%) for males and 4:00 PM to 11:59 PM (1,296, 12.5%) for females.
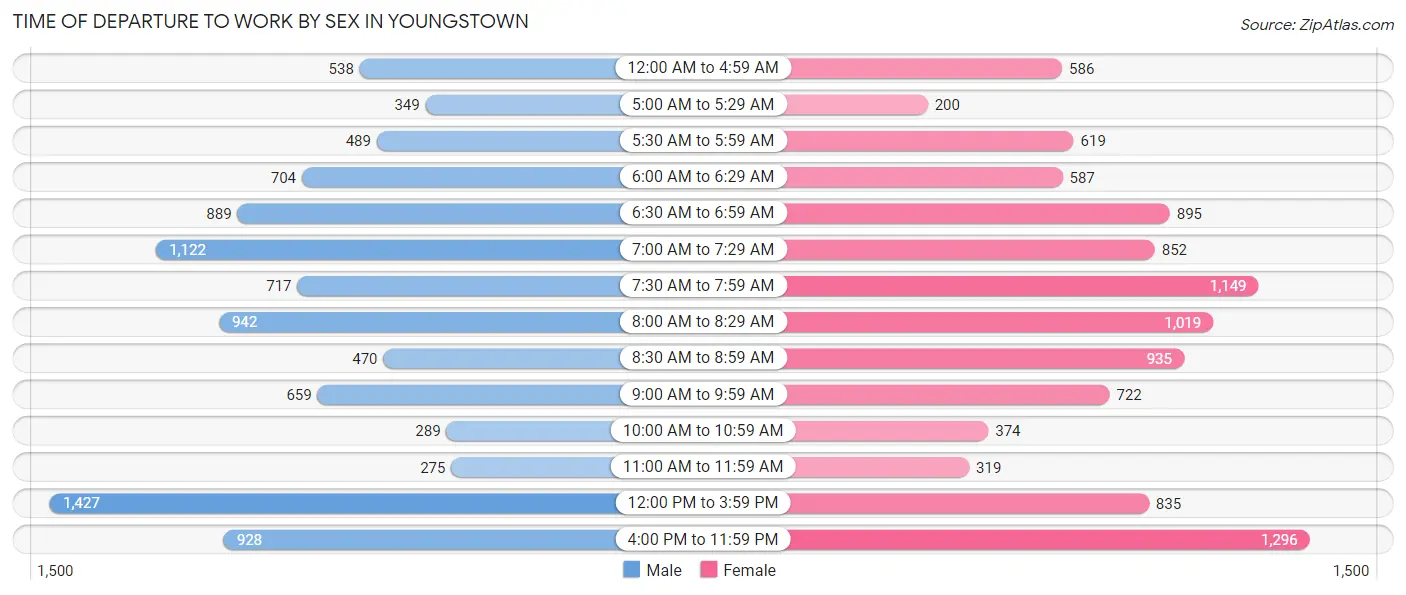
| Time of Departure | Male | Female |
| 12:00 AM to 4:59 AM | 538 (5.5%) | 586 (5.6%) |
| 5:00 AM to 5:29 AM | 349 (3.6%) | 200 (1.9%) |
| 5:30 AM to 5:59 AM | 489 (5.0%) | 619 (6.0%) |
| 6:00 AM to 6:29 AM | 704 (7.2%) | 587 (5.7%) |
| 6:30 AM to 6:59 AM | 889 (9.1%) | 895 (8.6%) |
| 7:00 AM to 7:29 AM | 1,122 (11.5%) | 852 (8.2%) |
| 7:30 AM to 7:59 AM | 717 (7.3%) | 1,149 (11.1%) |
| 8:00 AM to 8:29 AM | 942 (9.6%) | 1,019 (9.8%) |
| 8:30 AM to 8:59 AM | 470 (4.8%) | 935 (9.0%) |
| 9:00 AM to 9:59 AM | 659 (6.7%) | 722 (7.0%) |
| 10:00 AM to 10:59 AM | 289 (2.9%) | 374 (3.6%) |
| 11:00 AM to 11:59 AM | 275 (2.8%) | 319 (3.1%) |
| 12:00 PM to 3:59 PM | 1,427 (14.6%) | 835 (8.0%) |
| 4:00 PM to 11:59 PM | 928 (9.5%) | 1,296 (12.5%) |
| Total | 9,798 (100.0%) | 10,388 (100.0%) |
Housing Occupancy in Youngstown
Occupancy by Ownership in Youngstown
Of the total 25,449 dwellings in Youngstown, owner-occupied units account for 14,289 (56.1%), while renter-occupied units make up 11,160 (43.9%).
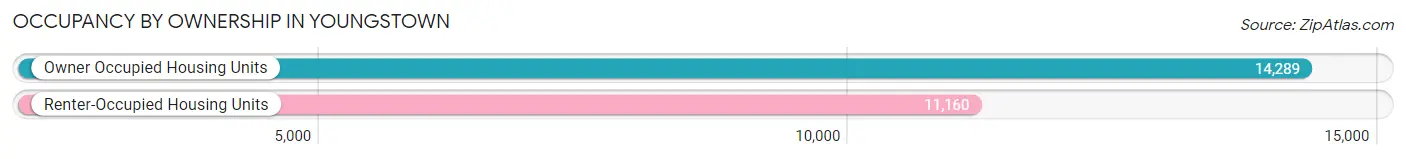
| Occupancy | # Housing Units | % Housing Units |
| Owner Occupied Housing Units | 14,289 | 56.1% |
| Renter-Occupied Housing Units | 11,160 | 43.9% |
| Total Occupied Housing Units | 25,449 | 100.0% |
Occupancy by Household Size in Youngstown
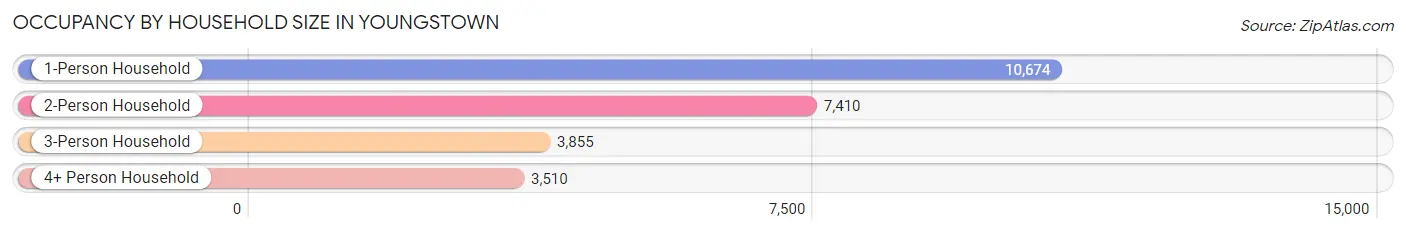
| Household Size | # Housing Units | % Housing Units |
| 1-Person Household | 10,674 | 41.9% |
| 2-Person Household | 7,410 | 29.1% |
| 3-Person Household | 3,855 | 15.1% |
| 4+ Person Household | 3,510 | 13.8% |
| Total Housing Units | 25,449 | 100.0% |
Occupancy by Ownership by Household Size in Youngstown
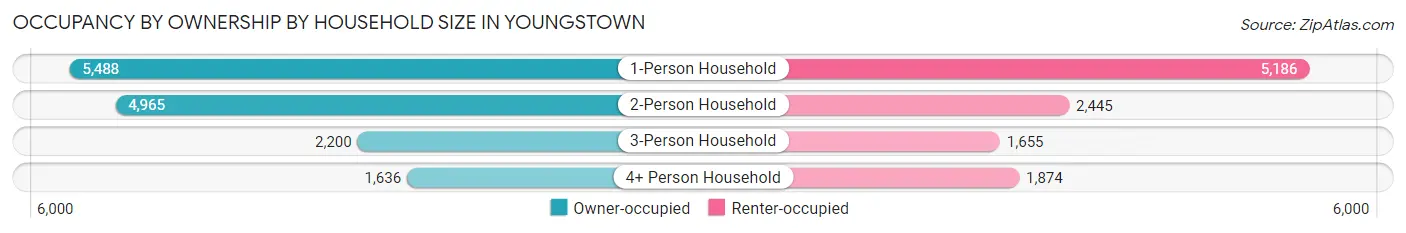
| Household Size | Owner-occupied | Renter-occupied |
| 1-Person Household | 5,488 (51.4%) | 5,186 (48.6%) |
| 2-Person Household | 4,965 (67.0%) | 2,445 (33.0%) |
| 3-Person Household | 2,200 (57.1%) | 1,655 (42.9%) |
| 4+ Person Household | 1,636 (46.6%) | 1,874 (53.4%) |
| Total Housing Units | 14,289 (56.1%) | 11,160 (43.9%) |
Occupancy by Educational Attainment in Youngstown
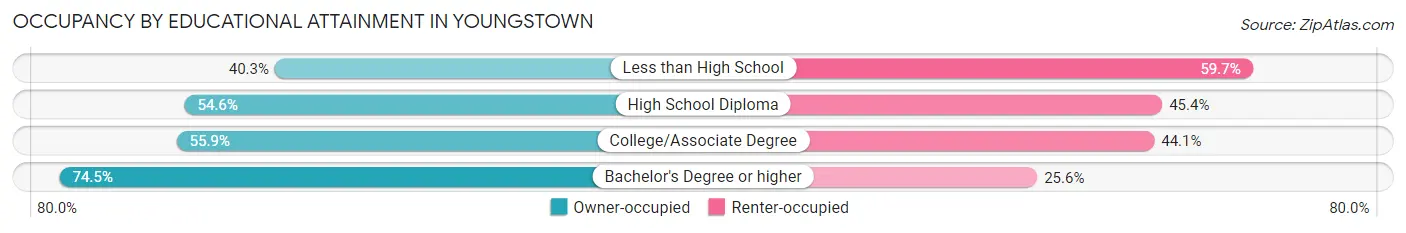
| Household Size | Owner-occupied | Renter-occupied |
| Less than High School | 1,369 (40.3%) | 2,026 (59.7%) |
| High School Diploma | 5,160 (54.6%) | 4,285 (45.4%) |
| College/Associate Degree | 4,896 (55.9%) | 3,866 (44.1%) |
| Bachelor's Degree or higher | 2,864 (74.5%) | 983 (25.6%) |
Occupancy by Age of Householder in Youngstown
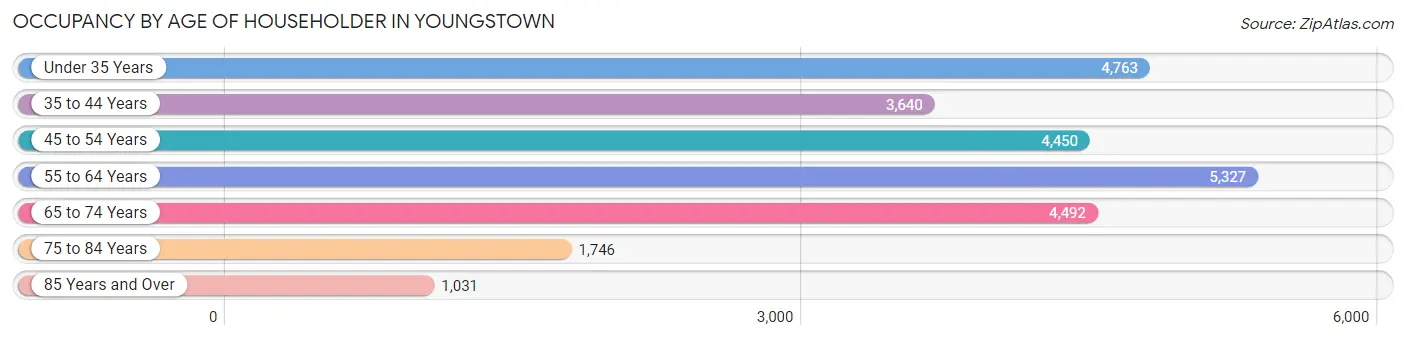
| Age Bracket | # Households | % Households |
| Under 35 Years | 4,763 | 18.7% |
| 35 to 44 Years | 3,640 | 14.3% |
| 45 to 54 Years | 4,450 | 17.5% |
| 55 to 64 Years | 5,327 | 20.9% |
| 65 to 74 Years | 4,492 | 17.6% |
| 75 to 84 Years | 1,746 | 6.9% |
| 85 Years and Over | 1,031 | 4.1% |
| Total | 25,449 | 100.0% |
Housing Finances in Youngstown
Median Income by Occupancy in Youngstown
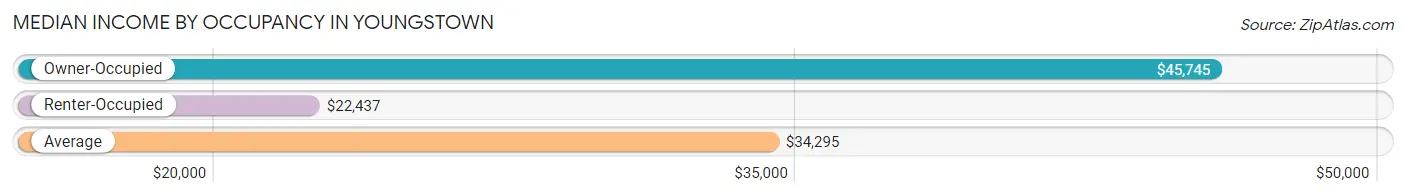
| Occupancy Type | # Households | Median Income |
| Owner-Occupied | 14,289 (56.1%) | $45,745 |
| Renter-Occupied | 11,160 (43.9%) | $22,437 |
| Average | 25,449 (100.0%) | $34,295 |
Occupancy by Householder Income Bracket in Youngstown
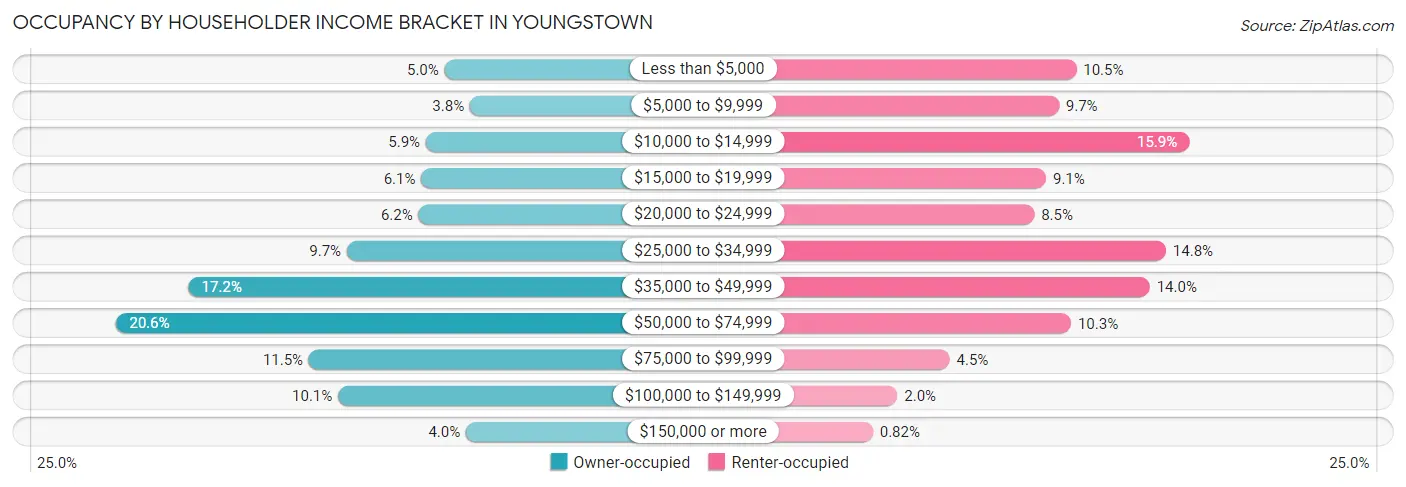
| Income Bracket | Owner-occupied | Renter-occupied |
| Less than $5,000 | 714 (5.0%) | 1,173 (10.5%) |
| $5,000 to $9,999 | 542 (3.8%) | 1,080 (9.7%) |
| $10,000 to $14,999 | 842 (5.9%) | 1,772 (15.9%) |
| $15,000 to $19,999 | 873 (6.1%) | 1,012 (9.1%) |
| $20,000 to $24,999 | 891 (6.2%) | 950 (8.5%) |
| $25,000 to $34,999 | 1,379 (9.7%) | 1,650 (14.8%) |
| $35,000 to $49,999 | 2,456 (17.2%) | 1,564 (14.0%) |
| $50,000 to $74,999 | 2,948 (20.6%) | 1,145 (10.3%) |
| $75,000 to $99,999 | 1,637 (11.5%) | 500 (4.5%) |
| $100,000 to $149,999 | 1,439 (10.1%) | 222 (2.0%) |
| $150,000 or more | 568 (4.0%) | 92 (0.8%) |
| Total | 14,289 (100.0%) | 11,160 (100.0%) |
Monthly Housing Cost Tiers in Youngstown
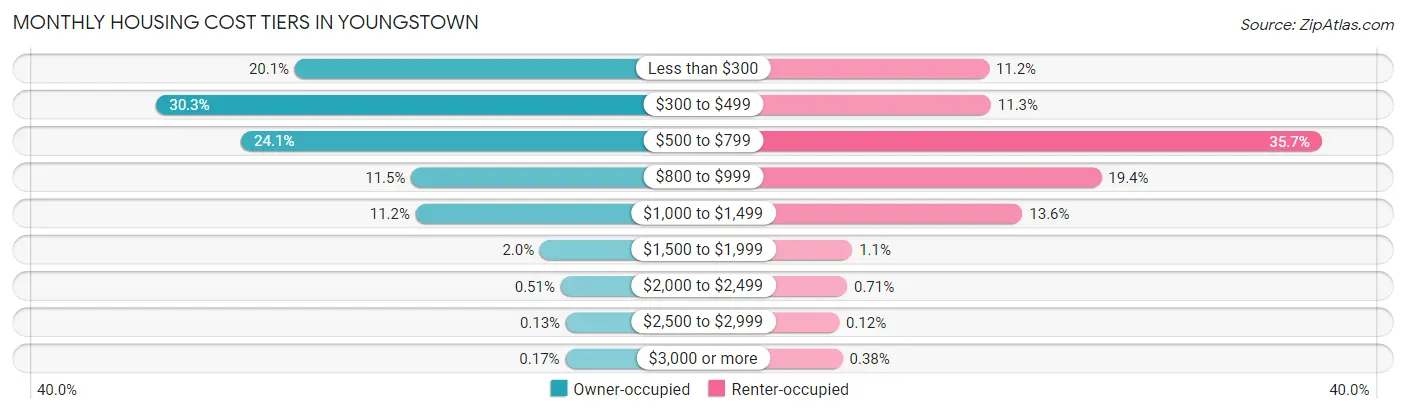
| Monthly Cost | Owner-occupied | Renter-occupied |
| Less than $300 | 2,871 (20.1%) | 1,246 (11.2%) |
| $300 to $499 | 4,329 (30.3%) | 1,261 (11.3%) |
| $500 to $799 | 3,436 (24.0%) | 3,979 (35.6%) |
| $800 to $999 | 1,646 (11.5%) | 2,170 (19.4%) |
| $1,000 to $1,499 | 1,599 (11.2%) | 1,520 (13.6%) |
| $1,500 to $1,999 | 291 (2.0%) | 122 (1.1%) |
| $2,000 to $2,499 | 73 (0.5%) | 79 (0.7%) |
| $2,500 to $2,999 | 19 (0.1%) | 13 (0.1%) |
| $3,000 or more | 25 (0.2%) | 42 (0.4%) |
| Total | 14,289 (100.0%) | 11,160 (100.0%) |
Physical Housing Characteristics in Youngstown
Housing Structures in Youngstown
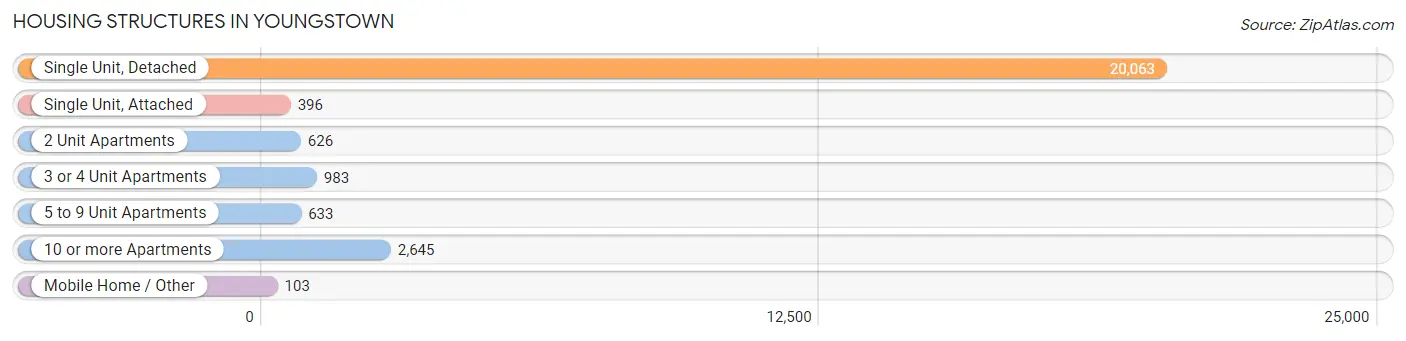
| Structure Type | # Housing Units | % Housing Units |
| Single Unit, Detached | 20,063 | 78.8% |
| Single Unit, Attached | 396 | 1.6% |
| 2 Unit Apartments | 626 | 2.5% |
| 3 or 4 Unit Apartments | 983 | 3.9% |
| 5 to 9 Unit Apartments | 633 | 2.5% |
| 10 or more Apartments | 2,645 | 10.4% |
| Mobile Home / Other | 103 | 0.4% |
| Total | 25,449 | 100.0% |
Housing Structures by Occupancy in Youngstown
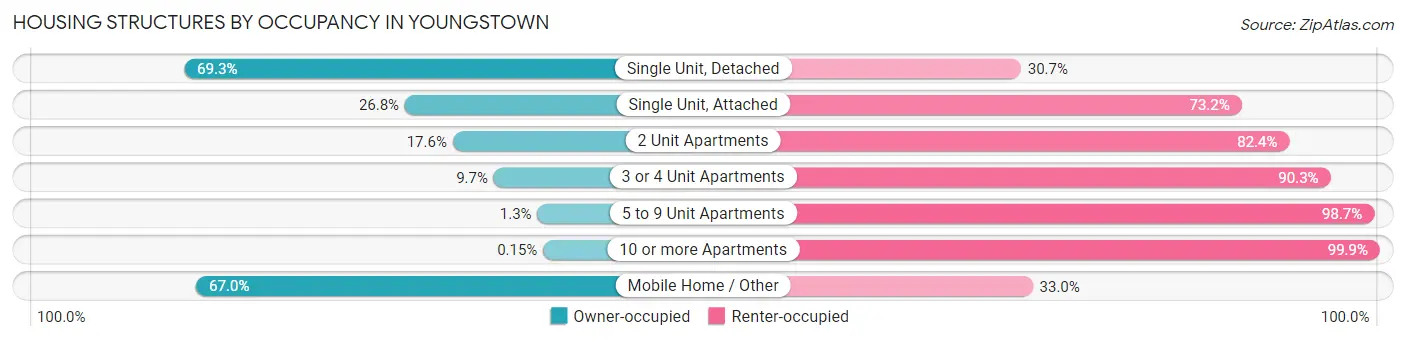
| Structure Type | Owner-occupied | Renter-occupied |
| Single Unit, Detached | 13,897 (69.3%) | 6,166 (30.7%) |
| Single Unit, Attached | 106 (26.8%) | 290 (73.2%) |
| 2 Unit Apartments | 110 (17.6%) | 516 (82.4%) |
| 3 or 4 Unit Apartments | 95 (9.7%) | 888 (90.3%) |
| 5 to 9 Unit Apartments | 8 (1.3%) | 625 (98.7%) |
| 10 or more Apartments | 4 (0.2%) | 2,641 (99.9%) |
| Mobile Home / Other | 69 (67.0%) | 34 (33.0%) |
| Total | 14,289 (56.1%) | 11,160 (43.9%) |
Housing Structures by Number of Rooms in Youngstown
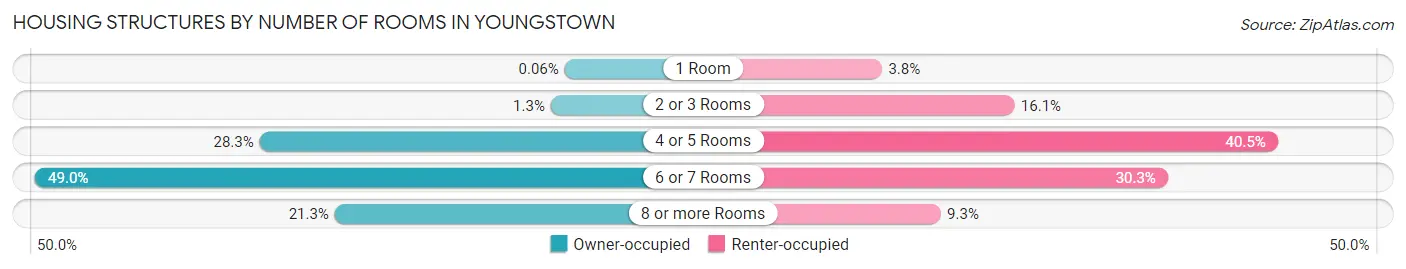
| Number of Rooms | Owner-occupied | Renter-occupied |
| 1 Room | 8 (0.1%) | 429 (3.8%) |
| 2 or 3 Rooms | 191 (1.3%) | 1,796 (16.1%) |
| 4 or 5 Rooms | 4,039 (28.3%) | 4,518 (40.5%) |
| 6 or 7 Rooms | 7,005 (49.0%) | 3,383 (30.3%) |
| 8 or more Rooms | 3,046 (21.3%) | 1,034 (9.3%) |
| Total | 14,289 (100.0%) | 11,160 (100.0%) |
Housing Structure by Heating Type in Youngstown
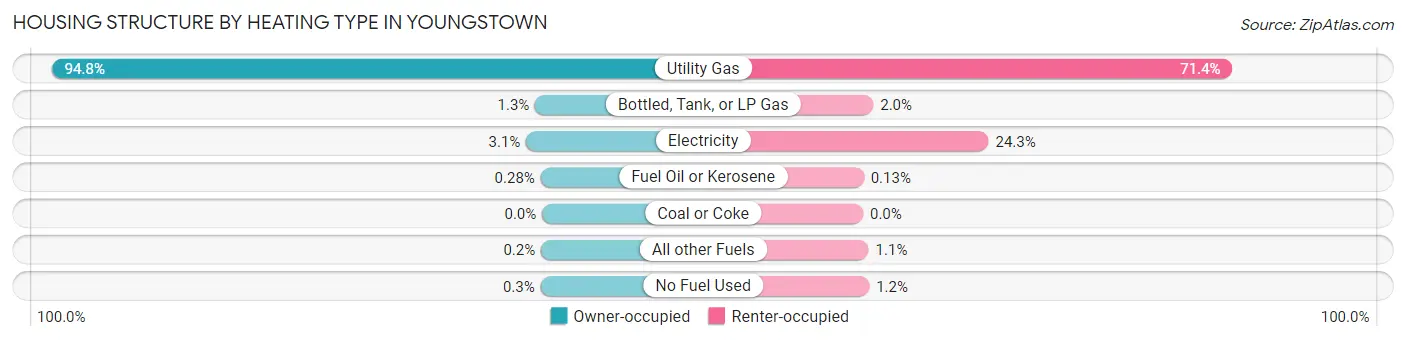
| Heating Type | Owner-occupied | Renter-occupied |
| Utility Gas | 13,545 (94.8%) | 7,965 (71.4%) |
| Bottled, Tank, or LP Gas | 192 (1.3%) | 221 (2.0%) |
| Electricity | 440 (3.1%) | 2,706 (24.2%) |
| Fuel Oil or Kerosene | 40 (0.3%) | 14 (0.1%) |
| Coal or Coke | 0 (0.0%) | 0 (0.0%) |
| All other Fuels | 29 (0.2%) | 120 (1.1%) |
| No Fuel Used | 43 (0.3%) | 134 (1.2%) |
| Total | 14,289 (100.0%) | 11,160 (100.0%) |
Household Vehicle Usage in Youngstown
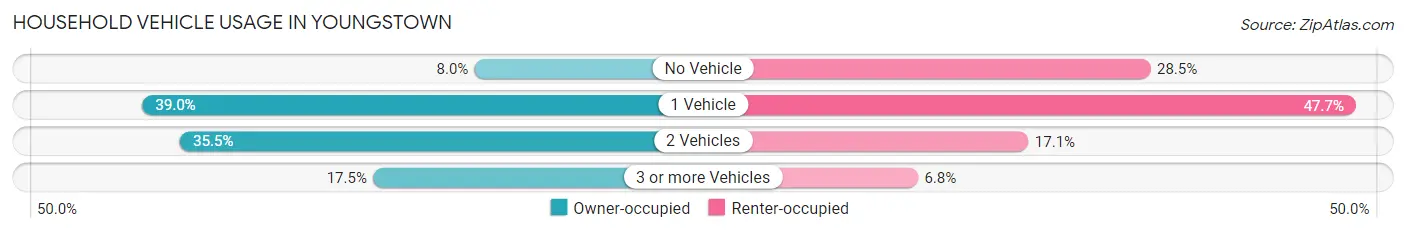
| Vehicles per Household | Owner-occupied | Renter-occupied |
| No Vehicle | 1,147 (8.0%) | 3,178 (28.5%) |
| 1 Vehicle | 5,572 (39.0%) | 5,321 (47.7%) |
| 2 Vehicles | 5,070 (35.5%) | 1,906 (17.1%) |
| 3 or more Vehicles | 2,500 (17.5%) | 755 (6.8%) |
| Total | 14,289 (100.0%) | 11,160 (100.0%) |
Real Estate & Mortgages in Youngstown
Real Estate and Mortgage Overview in Youngstown
| Characteristic | Without Mortgage | With Mortgage |
| Housing Units | 8,620 | 5,669 |
| Median Property Value | $44,200 | $73,200 |
| Median Household Income | $38,368 | $352 |
| Monthly Housing Costs | $366 | $0 |
| Real Estate Taxes | $560 | $244 |
Property Value by Mortgage Status in Youngstown
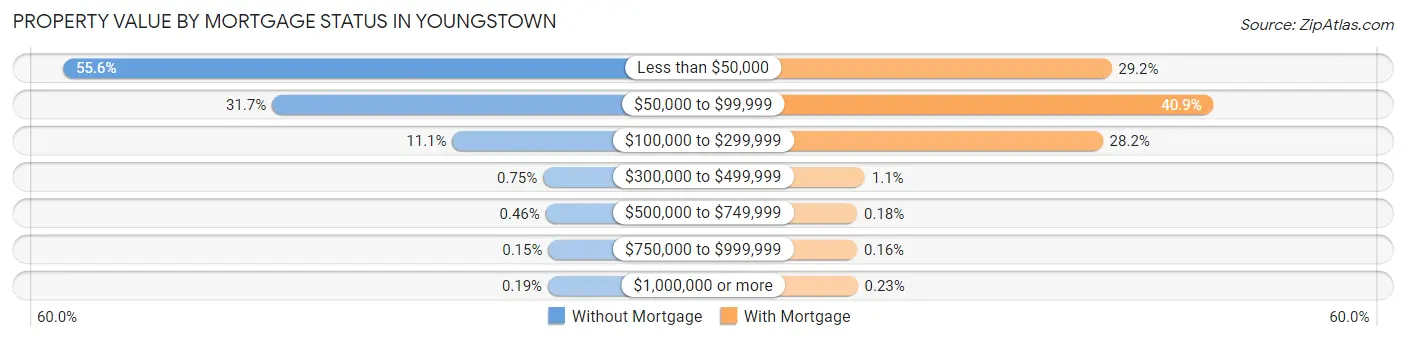
| Property Value | Without Mortgage | With Mortgage |
| Less than $50,000 | 4,794 (55.6%) | 1,657 (29.2%) |
| $50,000 to $99,999 | 2,734 (31.7%) | 2,319 (40.9%) |
| $100,000 to $299,999 | 958 (11.1%) | 1,601 (28.2%) |
| $300,000 to $499,999 | 65 (0.7%) | 60 (1.1%) |
| $500,000 to $749,999 | 40 (0.5%) | 10 (0.2%) |
| $750,000 to $999,999 | 13 (0.2%) | 9 (0.2%) |
| $1,000,000 or more | 16 (0.2%) | 13 (0.2%) |
| Total | 8,620 (100.0%) | 5,669 (100.0%) |
Household Income by Mortgage Status in Youngstown
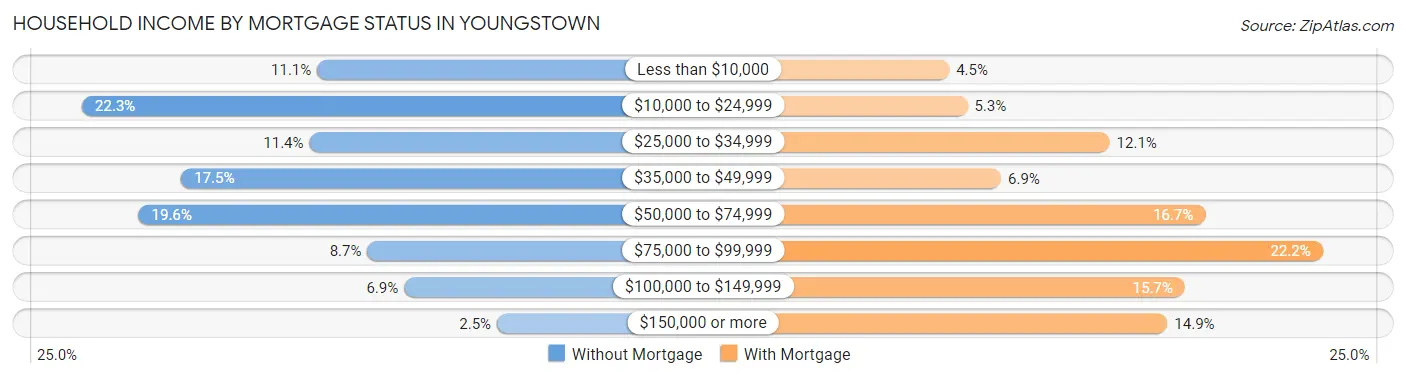
| Household Income | Without Mortgage | With Mortgage |
| Less than $10,000 | 954 (11.1%) | 253 (4.5%) |
| $10,000 to $24,999 | 1,920 (22.3%) | 302 (5.3%) |
| $25,000 to $34,999 | 986 (11.4%) | 686 (12.1%) |
| $35,000 to $49,999 | 1,512 (17.5%) | 393 (6.9%) |
| $50,000 to $74,999 | 1,687 (19.6%) | 944 (16.7%) |
| $75,000 to $99,999 | 748 (8.7%) | 1,261 (22.2%) |
| $100,000 to $149,999 | 597 (6.9%) | 889 (15.7%) |
| $150,000 or more | 216 (2.5%) | 842 (14.8%) |
| Total | 8,620 (100.0%) | 5,669 (100.0%) |
Property Value to Household Income Ratio in Youngstown
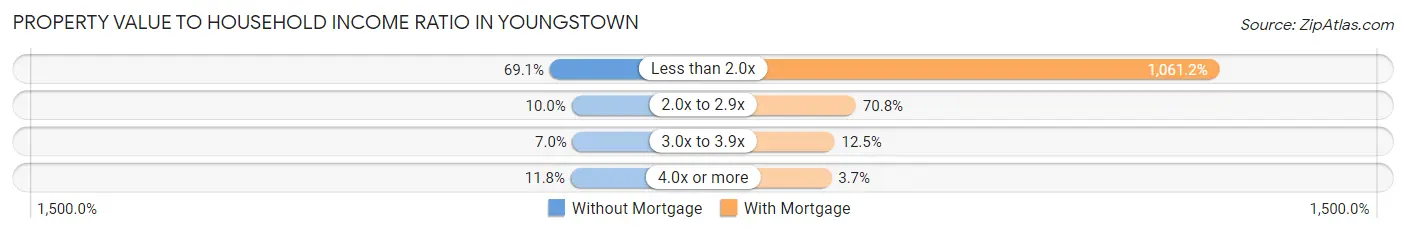
| Value-to-Income Ratio | Without Mortgage | With Mortgage |
| Less than 2.0x | 5,960 (69.1%) | 60,160 (1,061.2%) |
| 2.0x to 2.9x | 862 (10.0%) | 4,014 (70.8%) |
| 3.0x to 3.9x | 604 (7.0%) | 711 (12.5%) |
| 4.0x or more | 1,019 (11.8%) | 211 (3.7%) |
| Total | 8,620 (100.0%) | 5,669 (100.0%) |
Real Estate Taxes by Mortgage Status in Youngstown
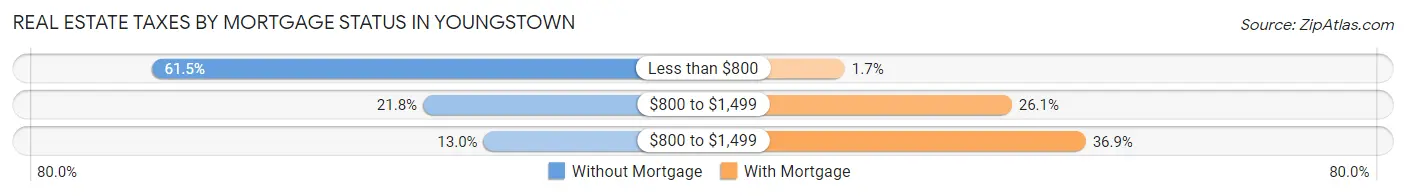
| Property Taxes | Without Mortgage | With Mortgage |
| Less than $800 | 5,297 (61.5%) | 98 (1.7%) |
| $800 to $1,499 | 1,879 (21.8%) | 1,481 (26.1%) |
| $800 to $1,499 | 1,117 (13.0%) | 2,093 (36.9%) |
| Total | 8,620 (100.0%) | 5,669 (100.0%) |
Health & Disability in Youngstown
Health Insurance Coverage by Age in Youngstown
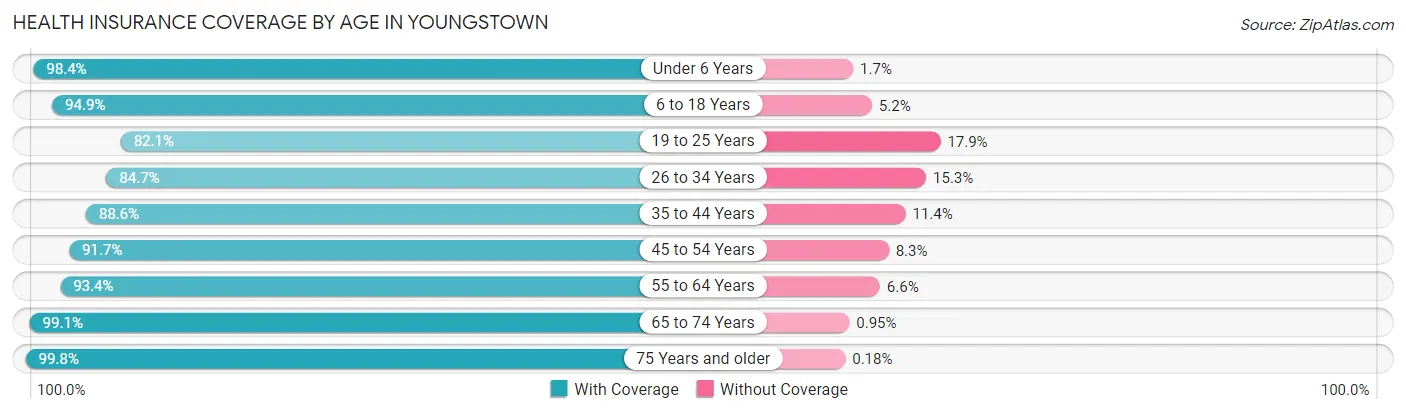
| Age Bracket | With Coverage | Without Coverage |
| Under 6 Years | 4,103 (98.4%) | 69 (1.7%) |
| 6 to 18 Years | 9,740 (94.9%) | 529 (5.1%) |
| 19 to 25 Years | 4,971 (82.1%) | 1,086 (17.9%) |
| 26 to 34 Years | 5,402 (84.7%) | 973 (15.3%) |
| 35 to 44 Years | 5,508 (88.6%) | 710 (11.4%) |
| 45 to 54 Years | 5,907 (91.7%) | 533 (8.3%) |
| 55 to 64 Years | 7,349 (93.4%) | 523 (6.6%) |
| 65 to 74 Years | 6,184 (99.1%) | 59 (0.9%) |
| 75 Years and older | 3,884 (99.8%) | 7 (0.2%) |
| Total | 53,048 (92.2%) | 4,489 (7.8%) |
Health Insurance Coverage by Citizenship Status in Youngstown
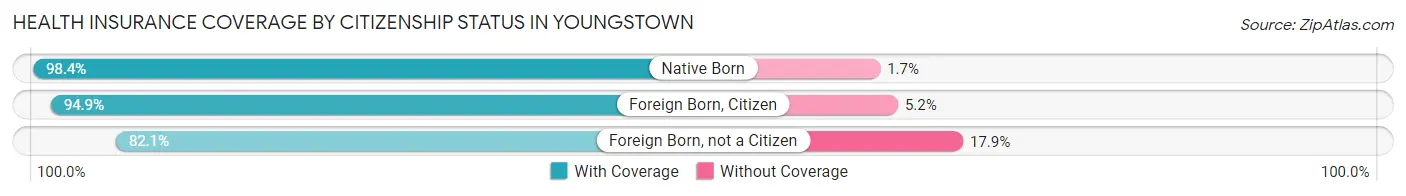
| Citizenship Status | With Coverage | Without Coverage |
| Native Born | 4,103 (98.4%) | 69 (1.7%) |
| Foreign Born, Citizen | 9,740 (94.9%) | 529 (5.1%) |
| Foreign Born, not a Citizen | 4,971 (82.1%) | 1,086 (17.9%) |
Health Insurance Coverage by Household Income in Youngstown
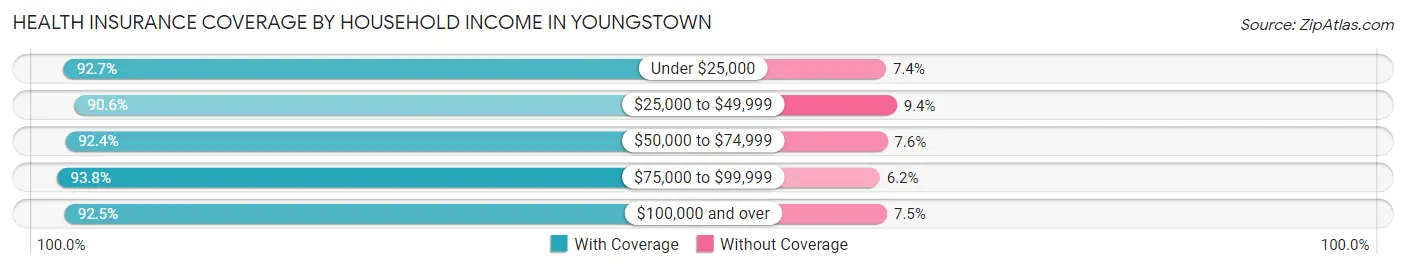
| Household Income | With Coverage | Without Coverage |
| Under $25,000 | 16,460 (92.6%) | 1,306 (7.3%) |
| $25,000 to $49,999 | 13,965 (90.6%) | 1,444 (9.4%) |
| $50,000 to $74,999 | 8,858 (92.4%) | 731 (7.6%) |
| $75,000 to $99,999 | 5,527 (93.8%) | 364 (6.2%) |
| $100,000 and over | 6,672 (92.5%) | 544 (7.5%) |
Public vs Private Health Insurance Coverage by Age in Youngstown
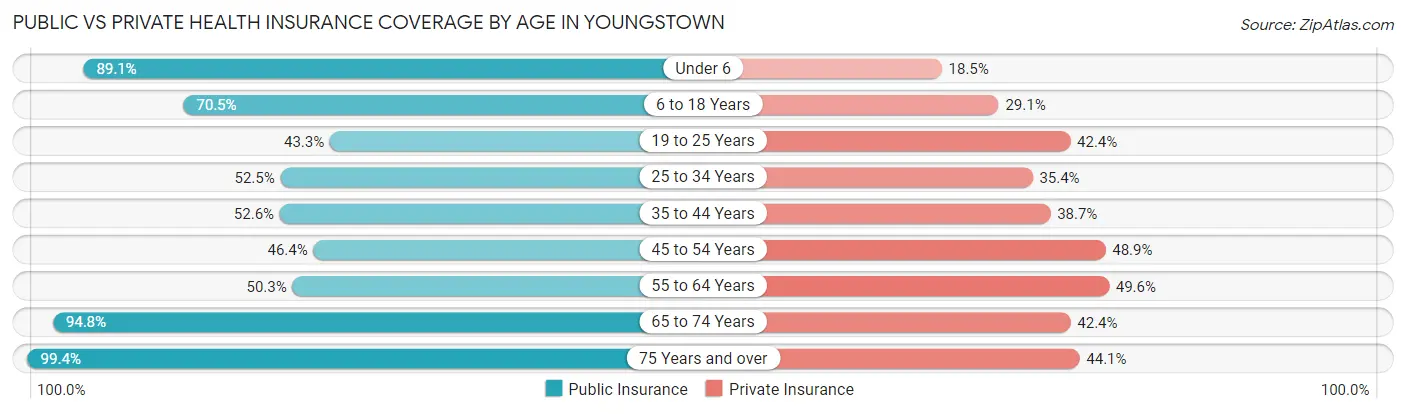
| Age Bracket | Public Insurance | Private Insurance |
| Under 6 | 3,716 (89.1%) | 773 (18.5%) |
| 6 to 18 Years | 7,243 (70.5%) | 2,986 (29.1%) |
| 19 to 25 Years | 2,623 (43.3%) | 2,567 (42.4%) |
| 25 to 34 Years | 3,346 (52.5%) | 2,256 (35.4%) |
| 35 to 44 Years | 3,271 (52.6%) | 2,405 (38.7%) |
| 45 to 54 Years | 2,986 (46.4%) | 3,150 (48.9%) |
| 55 to 64 Years | 3,957 (50.3%) | 3,901 (49.6%) |
| 65 to 74 Years | 5,915 (94.8%) | 2,649 (42.4%) |
| 75 Years and over | 3,869 (99.4%) | 1,716 (44.1%) |
| Total | 36,926 (64.2%) | 22,403 (38.9%) |
Disability Status by Sex by Age in Youngstown
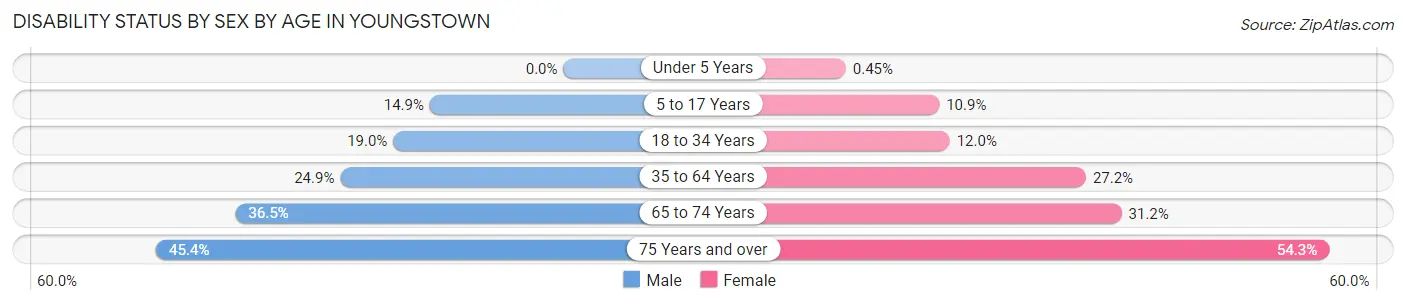
| Age Bracket | Male | Female |
| Under 5 Years | 0 (0.0%) | 8 (0.4%) |
| 5 to 17 Years | 750 (14.9%) | 508 (10.8%) |
| 18 to 34 Years | 1,289 (19.0%) | 809 (12.0%) |
| 35 to 64 Years | 2,419 (24.8%) | 2,935 (27.2%) |
| 65 to 74 Years | 1,089 (36.5%) | 1,016 (31.2%) |
| 75 Years and over | 664 (45.4%) | 1,317 (54.3%) |
Disability Class by Sex by Age in Youngstown
Disability Class: Hearing Difficulty
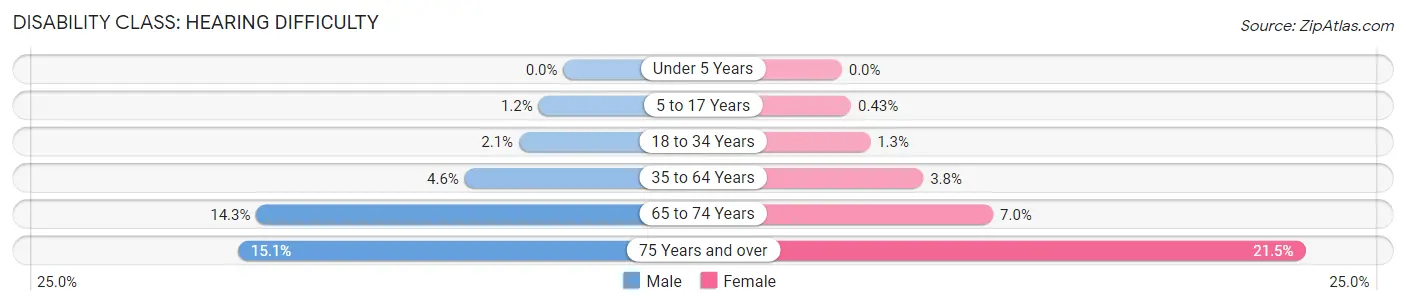
| Age Bracket | Male | Female |
| Under 5 Years | 0 (0.0%) | 0 (0.0%) |
| 5 to 17 Years | 58 (1.1%) | 20 (0.4%) |
| 18 to 34 Years | 140 (2.1%) | 89 (1.3%) |
| 35 to 64 Years | 446 (4.6%) | 408 (3.8%) |
| 65 to 74 Years | 425 (14.2%) | 229 (7.0%) |
| 75 Years and over | 221 (15.1%) | 522 (21.5%) |
Disability Class: Vision Difficulty
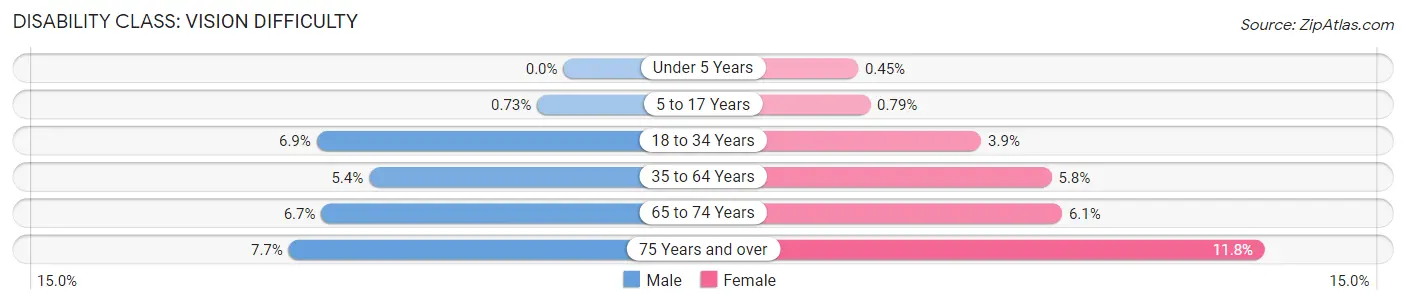
| Age Bracket | Male | Female |
| Under 5 Years | 0 (0.0%) | 8 (0.4%) |
| 5 to 17 Years | 37 (0.7%) | 37 (0.8%) |
| 18 to 34 Years | 467 (6.9%) | 261 (3.9%) |
| 35 to 64 Years | 527 (5.4%) | 630 (5.8%) |
| 65 to 74 Years | 201 (6.7%) | 200 (6.1%) |
| 75 Years and over | 112 (7.6%) | 286 (11.8%) |
Disability Class: Cognitive Difficulty
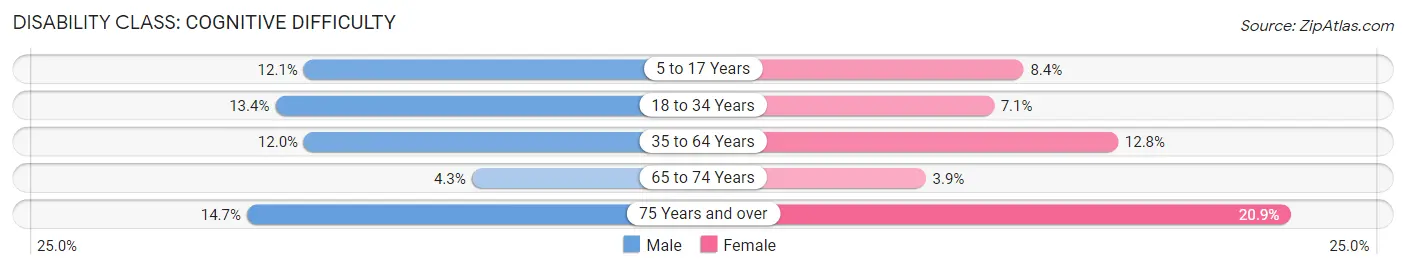
| Age Bracket | Male | Female |
| 5 to 17 Years | 608 (12.0%) | 395 (8.4%) |
| 18 to 34 Years | 909 (13.4%) | 475 (7.0%) |
| 35 to 64 Years | 1,172 (12.0%) | 1,383 (12.8%) |
| 65 to 74 Years | 127 (4.3%) | 127 (3.9%) |
| 75 Years and over | 215 (14.7%) | 506 (20.8%) |
Disability Class: Ambulatory Difficulty
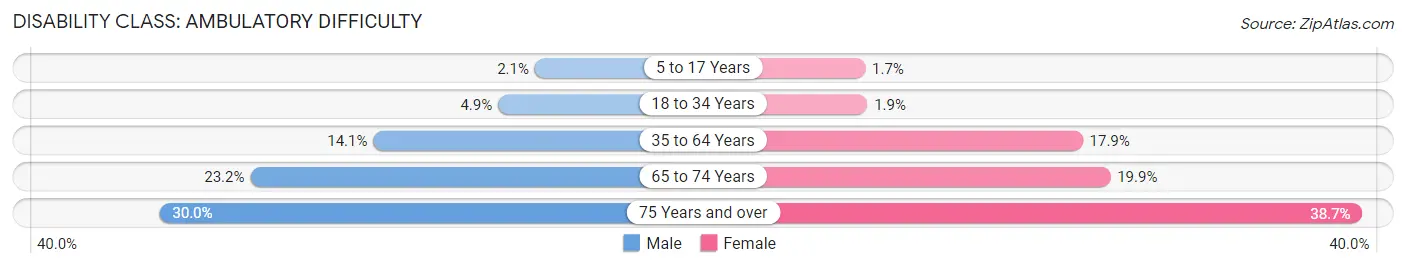
| Age Bracket | Male | Female |
| 5 to 17 Years | 107 (2.1%) | 81 (1.7%) |
| 18 to 34 Years | 330 (4.9%) | 127 (1.9%) |
| 35 to 64 Years | 1,373 (14.1%) | 1,930 (17.9%) |
| 65 to 74 Years | 693 (23.2%) | 650 (19.9%) |
| 75 Years and over | 439 (30.0%) | 938 (38.7%) |
Disability Class: Self-Care Difficulty
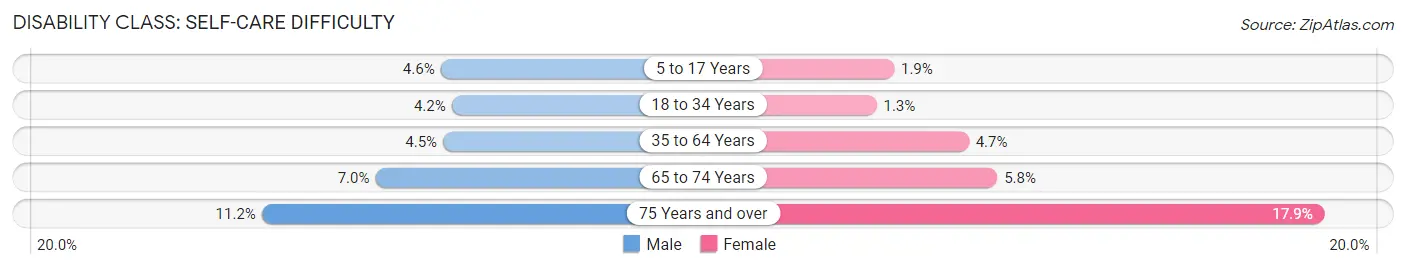
| Age Bracket | Male | Female |
| 5 to 17 Years | 230 (4.6%) | 91 (1.9%) |
| 18 to 34 Years | 282 (4.2%) | 87 (1.3%) |
| 35 to 64 Years | 435 (4.5%) | 509 (4.7%) |
| 65 to 74 Years | 208 (7.0%) | 188 (5.8%) |
| 75 Years and over | 164 (11.2%) | 435 (17.9%) |
Technology Access in Youngstown
Computing Device Access in Youngstown
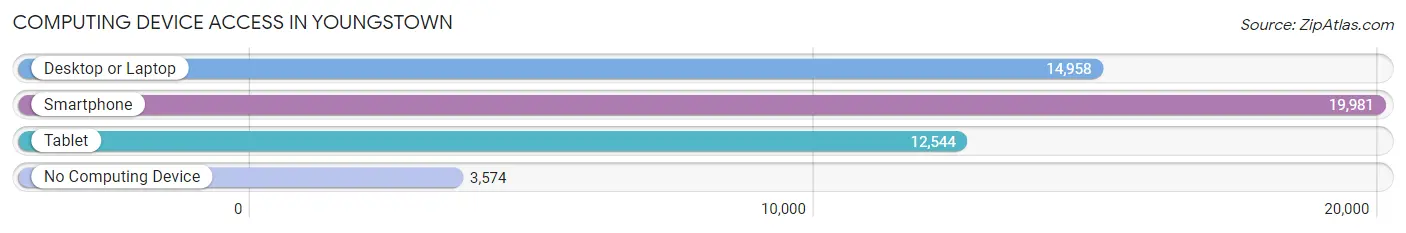
| Device Type | # Households | % Households |
| Desktop or Laptop | 14,958 | 58.8% |
| Smartphone | 19,981 | 78.5% |
| Tablet | 12,544 | 49.3% |
| No Computing Device | 3,574 | 14.0% |
| Total | 25,449 | 100.0% |
Internet Access in Youngstown
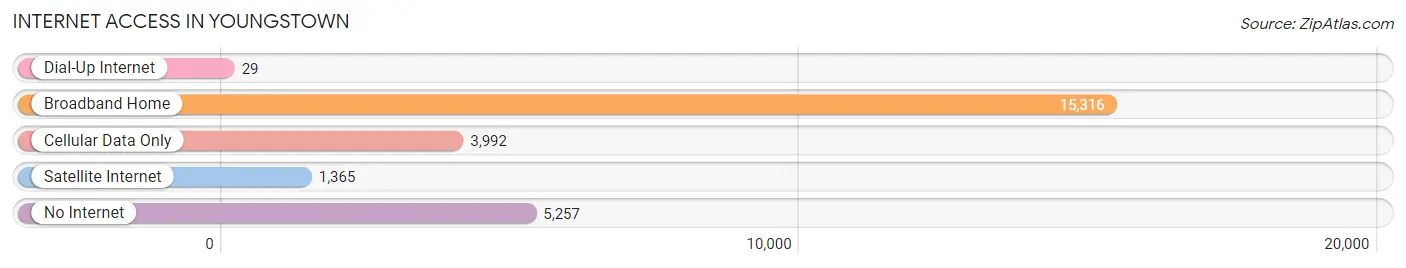
| Internet Type | # Households | % Households |
| Dial-Up Internet | 29 | 0.1% |
| Broadband Home | 15,316 | 60.2% |
| Cellular Data Only | 3,992 | 15.7% |
| Satellite Internet | 1,365 | 5.4% |
| No Internet | 5,257 | 20.7% |
| Total | 25,449 | 100.0% |
Youngstown Summary
Youngstown, Ohio is a city located in Mahoning County in the northeastern part of the state. It is the county seat and the largest city in the county. The city is situated on the Mahoning River, approximately 65 miles southeast of Cleveland and 60 miles northwest of Pittsburgh. The city has a population of 64,958 according to the 2010 census, making it the ninth largest city in the state.
History
The area that is now Youngstown was first settled in 1797 by John Young, a Quaker from Pennsylvania. He established a trading post and a gristmill on the Mahoning River. The settlement was known as Youngstown in 1802, and the village was incorporated in 1848. The city was officially chartered in 1867.
Youngstown experienced rapid growth in the late 19th and early 20th centuries due to the steel industry. The city was home to several steel mills, including Republic Steel, which was the largest steel mill in the world at the time. The steel industry provided jobs for thousands of people and helped to make Youngstown one of the most prosperous cities in the country.
The steel industry began to decline in the 1970s and 1980s, leading to a period of economic decline in the city. The city's population decreased from a peak of 170,002 in 1930 to 64,958 in 2010.
Geography
Youngstown is located in northeastern Ohio, approximately 65 miles southeast of Cleveland and 60 miles northwest of Pittsburgh. The city is situated on the Mahoning River, which flows through the city from north to south. The city is located in the Appalachian Plateau region of Ohio, and the terrain is generally flat.
The city has a total area of 21.3 square miles, of which 21.2 square miles is land and 0.1 square miles is water. The city is located in the humid continental climate zone, with hot, humid summers and cold, snowy winters.
Economy
Youngstown's economy is largely based on manufacturing and healthcare. The city is home to several large manufacturing companies, including General Motors, Delphi Automotive, and V&M Star Steel. The city is also home to several healthcare providers, including Mercy Health, Humility of Mary Health Partners, and ValleyCare Health System.
The city also has a growing technology sector, with several startups and incubators located in the city. The city is also home to several higher education institutions, including Youngstown State University, Eastern Gateway Community College, and the Mahoning Valley Historical Society.
Demographics
According to the 2010 census, the population of Youngstown was 64,958. The racial makeup of the city was 63.2% White, 28.3% African American, 0.3% Native American, 0.7% Asian, 0.1% Pacific Islander, and 5.4% from other races. Hispanic or Latino of any race were 4.2% of the population.
The median household income in the city was $26,845, and the median family income was $32,917. The per capita income was $15,945. About 24.2% of the population was below the poverty line.
Youngstown is a diverse city, with a variety of cultures and backgrounds represented. The city is home to a large Italian-American population, as well as a growing Hispanic population. The city also has a large African-American population, with many of the city's neighborhoods being predominantly African-American.
Common Questions
What is the Total Population of Youngstown?
Total Population of Youngstown is 60,048.
What is the Total Male Population of Youngstown?
Total Male Population of Youngstown is 29,898.
What is the Total Female Population of Youngstown?
Total Female Population of Youngstown is 30,150.
What is the Ratio of Males per 100 Females in Youngstown?
There are 99.16 Males per 100 Females in Youngstown.
What is the Ratio of Females per 100 Males in Youngstown?
There are 100.84 Females per 100 Males in Youngstown.
What is the Median Population Age in Youngstown?
Median Population Age in Youngstown is 38.3 Years.
What is the Average Family Size in Youngstown
Average Family Size in Youngstown is 3.0 People.
What is the Average Household Size in Youngstown
Average Household Size in Youngstown is 2.2 People.
What is Per Capita Income in Youngstown?
Per Capita income in Youngstown is $20,466.
What is the Median Family Income in Youngstown?
Median Family Income in Youngstown is $41,785.
What is the Median Household income in Youngstown?
Median Household Income in Youngstown is $34,295.
What is Income or Wage Gap in Youngstown?
Income or Wage Gap in Youngstown is 11.3%.
Women in Youngstown earn 88.7 cents for every dollar earned by a man.
What is Family Income Deficit in Youngstown?
Family Income Deficit in Youngstown is $10,941.
Families that are below poverty line in Youngstown earn $10,941 less on average than the poverty threshold level.
What is Inequality or Gini Index in Youngstown?
Inequality or Gini Index in Youngstown is 0.47.
How Large is the Labor Force in Youngstown?
There are 25,711 People in the Labor Forcein in Youngstown.
What is the Percentage of People in the Labor Force in Youngstown?
53.2% of People are in the Labor Force in Youngstown.
What is the Unemployment Rate in Youngstown?
Unemployment Rate in Youngstown is 13.2%.