Reynoldsburg, OH
Reynoldsburg Map
Reynoldsburg Overview
40,926
TOTAL POPULATION
19,811
MALE POPULATION
21,115
FEMALE POPULATION
93.82
MALES / 100 FEMALES
106.58
FEMALES / 100 MALES
37.6
MEDIAN AGE
3.1
AVG FAMILY SIZE
2.5
AVG HOUSEHOLD SIZE
$35,735
PER CAPITA INCOME
$87,719
AVG FAMILY INCOME
$68,778
AVG HOUSEHOLD INCOME
12.4%
WAGE / INCOME GAP [ % ]
87.6¢/ $1
WAGE / INCOME GAP [ $ ]
$10,144
FAMILY INCOME DEFICIT
0.41
INEQUALITY / GINI INDEX
21,606
LABOR FORCE [ PEOPLE ]
67.7%
PERCENT IN LABOR FORCE
5.4%
UNEMPLOYMENT RATE
Reynoldsburg Zip Codes
Reynoldsburg Area Codes
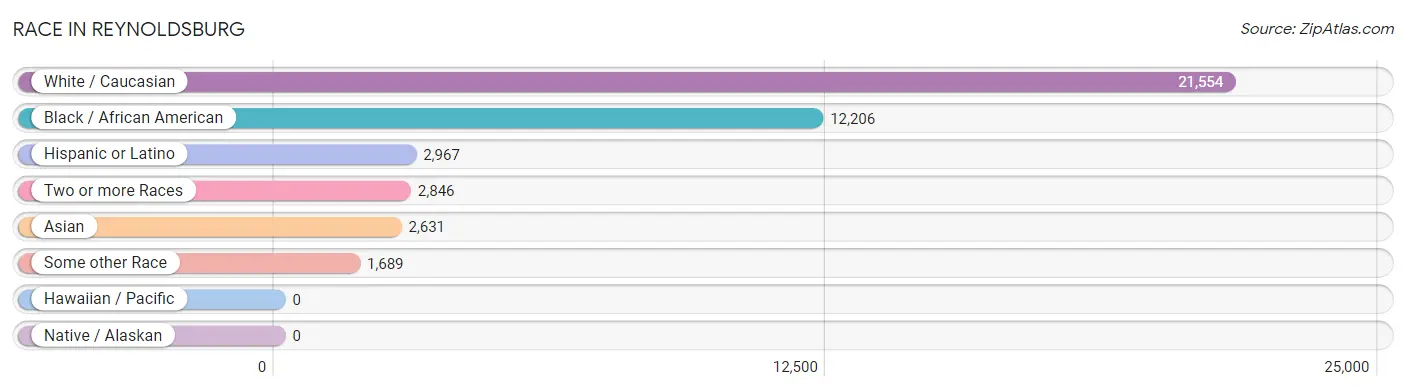
Race in Reynoldsburg
The most populous races in Reynoldsburg are White / Caucasian (21,554 | 52.7%), Black / African American (12,206 | 29.8%), and Hispanic or Latino (2,967 | 7.2%).
| Race | # Population | % Population |
| Asian | 2,631 | 6.4% |
| Black / African American | 12,206 | 29.8% |
| Hawaiian / Pacific | 0 | 0.0% |
| Hispanic or Latino | 2,967 | 7.2% |
| Native / Alaskan | 0 | 0.0% |
| White / Caucasian | 21,554 | 52.7% |
| Two or more Races | 2,846 | 7.0% |
| Some other Race | 1,689 | 4.1% |
| Total | 40,926 | 100.0% |
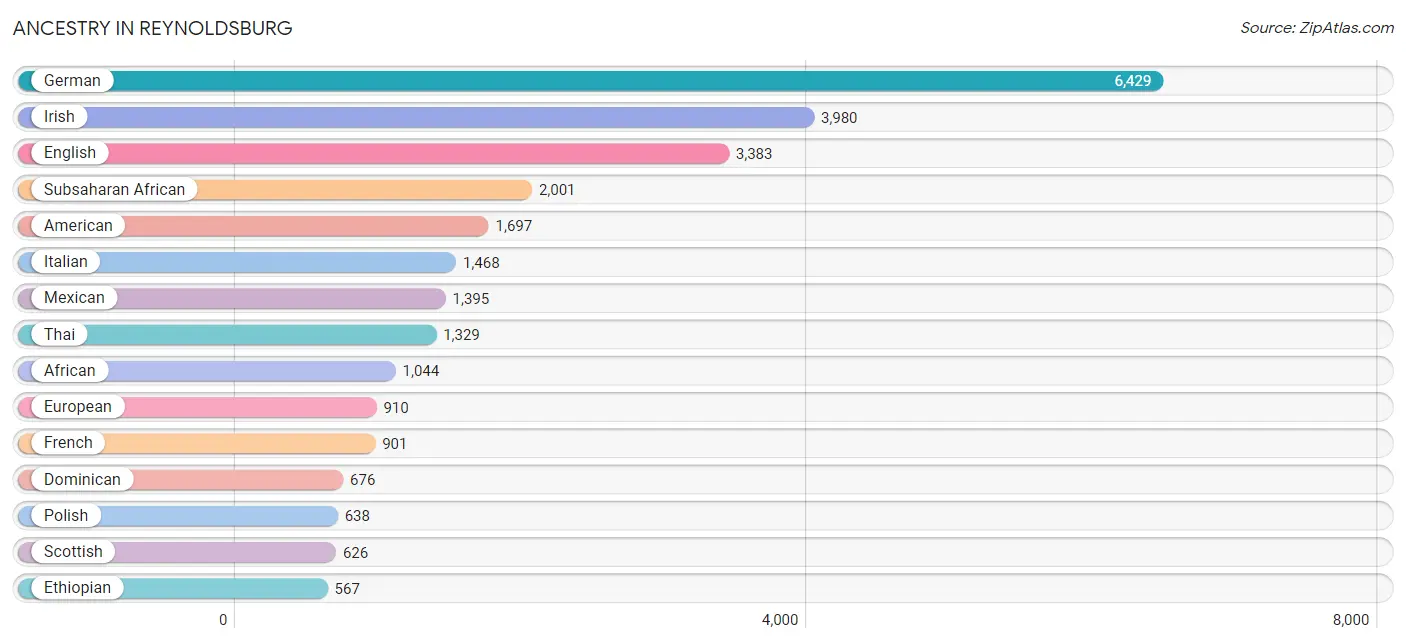
Ancestry in Reynoldsburg
The most populous ancestries reported in Reynoldsburg are German (6,429 | 15.7%), Irish (3,980 | 9.7%), English (3,383 | 8.3%), Subsaharan African (2,001 | 4.9%), and American (1,697 | 4.2%), together accounting for 42.7% of all Reynoldsburg residents.
| Ancestry | # Population | % Population |
| African | 1,044 | 2.5% |
| American | 1,697 | 4.2% |
| Arab | 112 | 0.3% |
| Belgian | 74 | 0.2% |
| Bhutanese | 11 | 0.0% |
| Blackfeet | 35 | 0.1% |
| British | 213 | 0.5% |
| Burmese | 134 | 0.3% |
| Canadian | 70 | 0.2% |
| Central American | 223 | 0.5% |
| Cherokee | 132 | 0.3% |
| Chilean | 70 | 0.2% |
| Choctaw | 30 | 0.1% |
| Colombian | 94 | 0.2% |
| Croatian | 13 | 0.0% |
| Cuban | 3 | 0.0% |
| Czech | 414 | 1.0% |
| Czechoslovakian | 14 | 0.0% |
| Danish | 56 | 0.1% |
| Dominican | 676 | 1.7% |
| Dutch | 248 | 0.6% |
| Eastern European | 133 | 0.3% |
| English | 3,383 | 8.3% |
| Ethiopian | 567 | 1.4% |
| European | 910 | 2.2% |
| Filipino | 25 | 0.1% |
| Finnish | 40 | 0.1% |
| French | 901 | 2.2% |
| German | 6,429 | 15.7% |
| Ghanaian | 191 | 0.5% |
| Greek | 54 | 0.1% |
| Guamanian / Chamorro | 19 | 0.1% |
| Guatemalan | 59 | 0.1% |
| Haitian | 115 | 0.3% |
| Hungarian | 324 | 0.8% |
| Indian (Asian) | 190 | 0.5% |
| Iranian | 72 | 0.2% |
| Irish | 3,980 | 9.7% |
| Italian | 1,468 | 3.6% |
| Jamaican | 169 | 0.4% |
| Japanese | 31 | 0.1% |
| Jordanian | 102 | 0.3% |
| Kenyan | 59 | 0.1% |
| Korean | 191 | 0.5% |
| Latvian | 7 | 0.0% |
| Lithuanian | 18 | 0.0% |
| Malaysian | 67 | 0.2% |
| Mexican | 1,395 | 3.4% |
| Native Hawaiian | 70 | 0.2% |
| Navajo | 99 | 0.2% |
| Nigerian | 42 | 0.1% |
| Northern European | 9 | 0.0% |
| Norwegian | 208 | 0.5% |
| Pakistani | 197 | 0.5% |
| Pennsylvania German | 39 | 0.1% |
| Polish | 638 | 1.6% |
| Portuguese | 75 | 0.2% |
| Puerto Rican | 385 | 0.9% |
| Romanian | 149 | 0.4% |
| Russian | 34 | 0.1% |
| Salvadoran | 164 | 0.4% |
| Scandinavian | 97 | 0.2% |
| Scotch-Irish | 397 | 1.0% |
| Scottish | 626 | 1.5% |
| Serbian | 19 | 0.1% |
| Slavic | 9 | 0.0% |
| Slovak | 67 | 0.2% |
| Slovene | 14 | 0.0% |
| South American | 164 | 0.4% |
| Spanish | 82 | 0.2% |
| Sri Lankan | 10 | 0.0% |
| Subsaharan African | 2,001 | 4.9% |
| Swedish | 280 | 0.7% |
| Swiss | 78 | 0.2% |
| Thai | 1,329 | 3.3% |
| Trinidadian and Tobagonian | 13 | 0.0% |
| Turkish | 68 | 0.2% |
| Ukrainian | 45 | 0.1% |
| Vietnamese | 4 | 0.0% |
| Welsh | 384 | 0.9% |
| West Indian | 23 | 0.1% | View All 81 Rows |
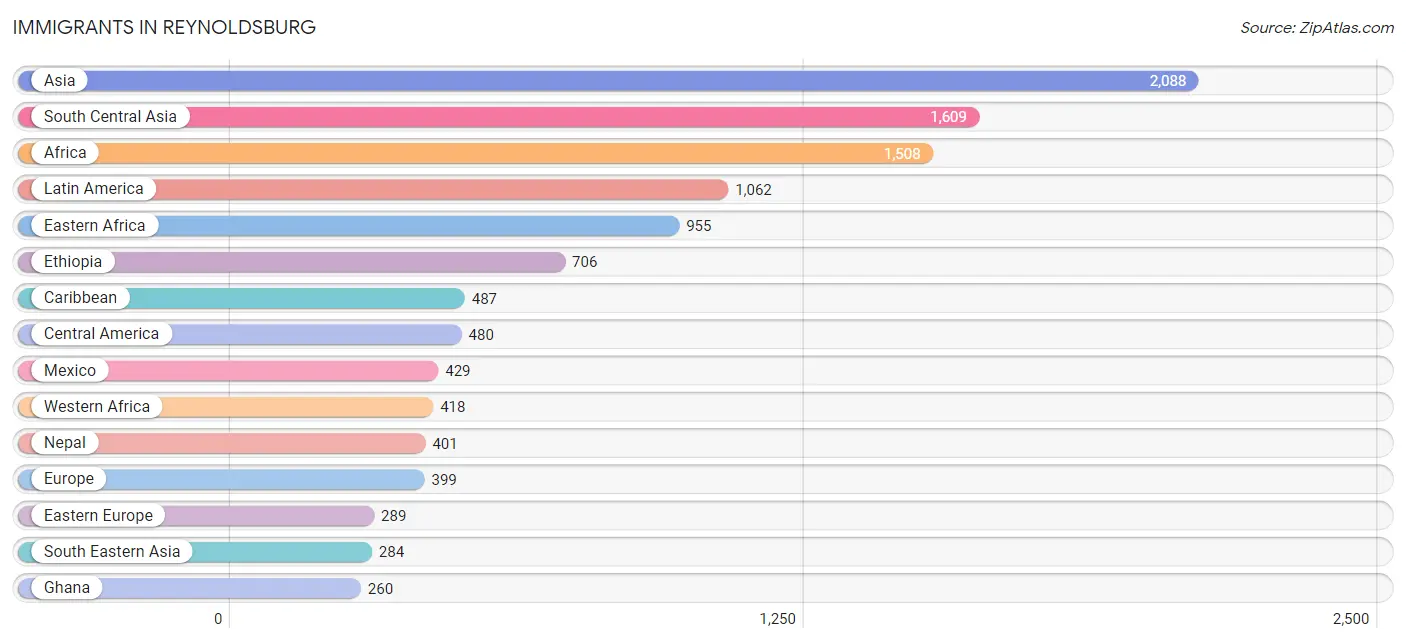
Immigrants in Reynoldsburg
The most numerous immigrant groups reported in Reynoldsburg came from Asia (2,088 | 5.1%), South Central Asia (1,609 | 3.9%), Africa (1,508 | 3.7%), Latin America (1,062 | 2.6%), and Eastern Africa (955 | 2.3%), together accounting for 17.6% of all Reynoldsburg residents.
| Immigration Origin | # Population | % Population |
| Africa | 1,508 | 3.7% |
| Asia | 2,088 | 5.1% |
| Australia | 10 | 0.0% |
| Bahamas | 60 | 0.2% |
| Bangladesh | 4 | 0.0% |
| Belarus | 24 | 0.1% |
| Cambodia | 10 | 0.0% |
| Cameroon | 36 | 0.1% |
| Canada | 70 | 0.2% |
| Caribbean | 487 | 1.2% |
| Central America | 480 | 1.2% |
| China | 95 | 0.2% |
| Colombia | 69 | 0.2% |
| Cuba | 3 | 0.0% |
| Czechoslovakia | 152 | 0.4% |
| Denmark | 5 | 0.0% |
| Dominican Republic | 218 | 0.5% |
| Eastern Africa | 955 | 2.3% |
| Eastern Asia | 152 | 0.4% |
| Eastern Europe | 289 | 0.7% |
| El Salvador | 51 | 0.1% |
| England | 12 | 0.0% |
| Eritrea | 121 | 0.3% |
| Ethiopia | 706 | 1.7% |
| Europe | 399 | 1.0% |
| Germany | 44 | 0.1% |
| Ghana | 260 | 0.6% |
| Guyana | 26 | 0.1% |
| Haiti | 51 | 0.1% |
| India | 236 | 0.6% |
| Iran | 30 | 0.1% |
| Ireland | 2 | 0.0% |
| Italy | 24 | 0.1% |
| Jamaica | 98 | 0.2% |
| Kenya | 128 | 0.3% |
| Korea | 57 | 0.1% |
| Laos | 9 | 0.0% |
| Latin America | 1,062 | 2.6% |
| Latvia | 7 | 0.0% |
| Liberia | 29 | 0.1% |
| Mexico | 429 | 1.1% |
| Middle Africa | 135 | 0.3% |
| Nepal | 401 | 1.0% |
| Northern Europe | 42 | 0.1% |
| Oceania | 10 | 0.0% |
| Pakistan | 30 | 0.1% |
| Philippines | 187 | 0.5% |
| Russia | 23 | 0.1% |
| South America | 95 | 0.2% |
| South Central Asia | 1,609 | 3.9% |
| South Eastern Asia | 284 | 0.7% |
| Southern Europe | 24 | 0.1% |
| Taiwan | 25 | 0.1% |
| Thailand | 78 | 0.2% |
| Turkey | 35 | 0.1% |
| Ukraine | 60 | 0.2% |
| Uzbekistan | 112 | 0.3% |
| Western Africa | 418 | 1.0% |
| Western Asia | 35 | 0.1% |
| Western Europe | 44 | 0.1% |
| Zaire | 99 | 0.2% | View All 61 Rows |
Sex and Age in Reynoldsburg
Sex and Age in Reynoldsburg
The most populous age groups in Reynoldsburg are 55 to 59 Years (1,619 | 8.2%) for men and 30 to 34 Years (1,641 | 7.8%) for women.
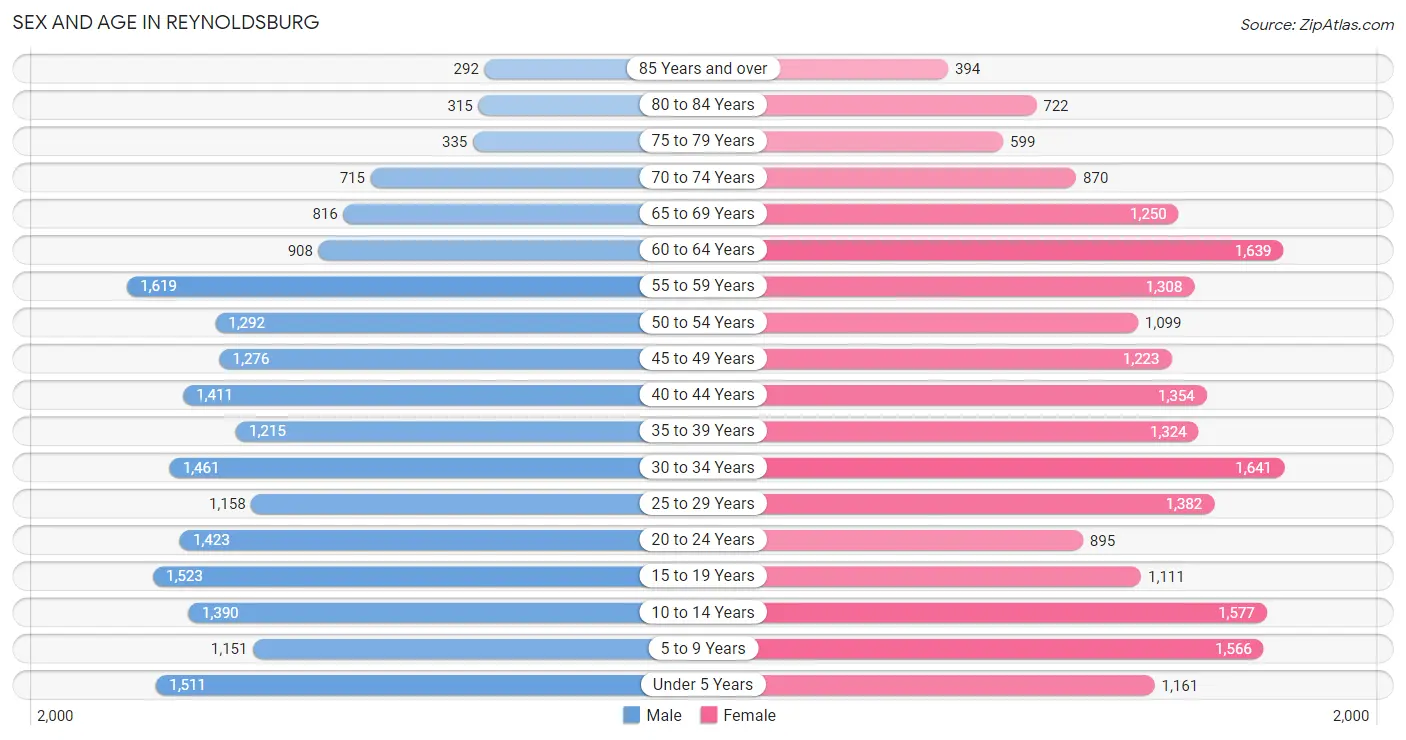
| Age Bracket | Male | Female |
| Under 5 Years | 1,511 (7.6%) | 1,161 (5.5%) |
| 5 to 9 Years | 1,151 (5.8%) | 1,566 (7.4%) |
| 10 to 14 Years | 1,390 (7.0%) | 1,577 (7.5%) |
| 15 to 19 Years | 1,523 (7.7%) | 1,111 (5.3%) |
| 20 to 24 Years | 1,423 (7.2%) | 895 (4.2%) |
| 25 to 29 Years | 1,158 (5.9%) | 1,382 (6.6%) |
| 30 to 34 Years | 1,461 (7.4%) | 1,641 (7.8%) |
| 35 to 39 Years | 1,215 (6.1%) | 1,324 (6.3%) |
| 40 to 44 Years | 1,411 (7.1%) | 1,354 (6.4%) |
| 45 to 49 Years | 1,276 (6.4%) | 1,223 (5.8%) |
| 50 to 54 Years | 1,292 (6.5%) | 1,099 (5.2%) |
| 55 to 59 Years | 1,619 (8.2%) | 1,308 (6.2%) |
| 60 to 64 Years | 908 (4.6%) | 1,639 (7.8%) |
| 65 to 69 Years | 816 (4.1%) | 1,250 (5.9%) |
| 70 to 74 Years | 715 (3.6%) | 870 (4.1%) |
| 75 to 79 Years | 335 (1.7%) | 599 (2.8%) |
| 80 to 84 Years | 315 (1.6%) | 722 (3.4%) |
| 85 Years and over | 292 (1.5%) | 394 (1.9%) |
| Total | 19,811 (100.0%) | 21,115 (100.0%) |
Families and Households in Reynoldsburg
Median Family Size in Reynoldsburg
The median family size in Reynoldsburg is 3.10 persons per family, with married-couple families (6,940 | 67.4%) accounting for the largest median family size of 3.19 persons per family. On the other hand, single female/mother families (2,481 | 24.1%) represent the smallest median family size with 2.90 persons per family.
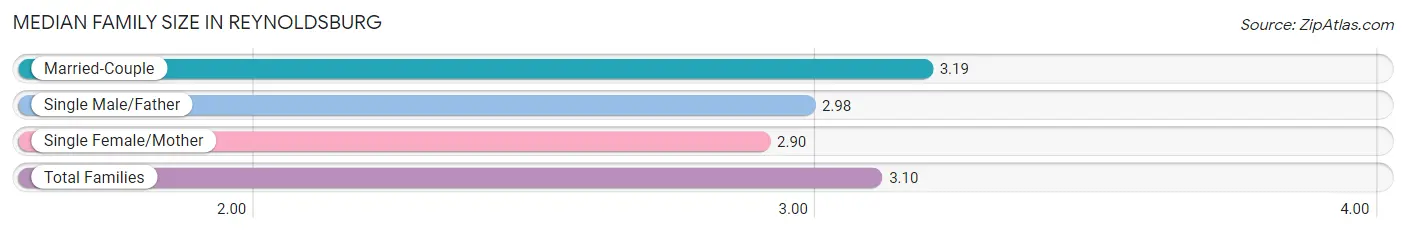
| Family Type | # Families | Family Size |
| Married-Couple | 6,940 (67.4%) | 3.19 |
| Single Male/Father | 877 (8.5%) | 2.98 |
| Single Female/Mother | 2,481 (24.1%) | 2.90 |
| Total Families | 10,298 (100.0%) | 3.10 |
Median Household Size in Reynoldsburg
The median household size in Reynoldsburg is 2.46 persons per household, with single male/father households (877 | 5.3%) accounting for the largest median household size of 3.58 persons per household. non-family households (6,279 | 37.9%) represent the smallest median household size with 1.23 persons per household.
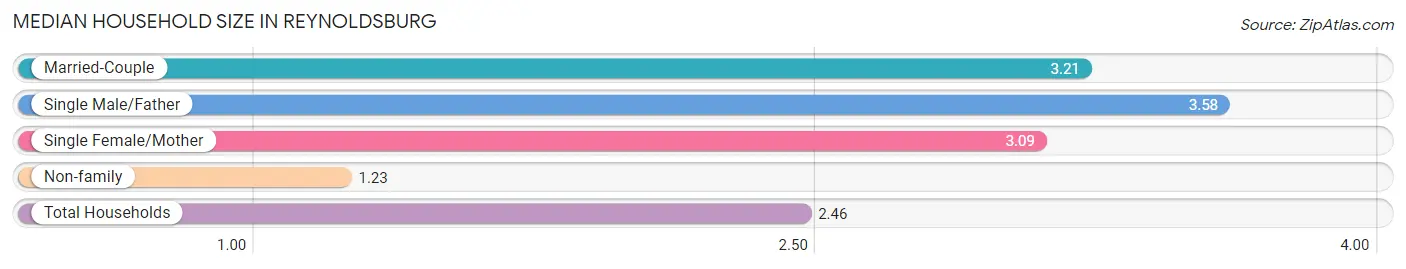
| Household Type | # Households | Household Size |
| Married-Couple | 6,940 (41.9%) | 3.21 |
| Single Male/Father | 877 (5.3%) | 3.58 |
| Single Female/Mother | 2,481 (15.0%) | 3.09 |
| Non-family | 6,279 (37.9%) | 1.23 |
| Total Households | 16,577 (100.0%) | 2.46 |
Household Size by Marriage Status in Reynoldsburg
Out of a total of 16,577 households in Reynoldsburg, 10,298 (62.1%) are family households, while 6,279 (37.9%) are nonfamily households. The most numerous type of family households are 2-person households, comprising 4,037, and the most common type of nonfamily households are 1-person households, comprising 5,248.
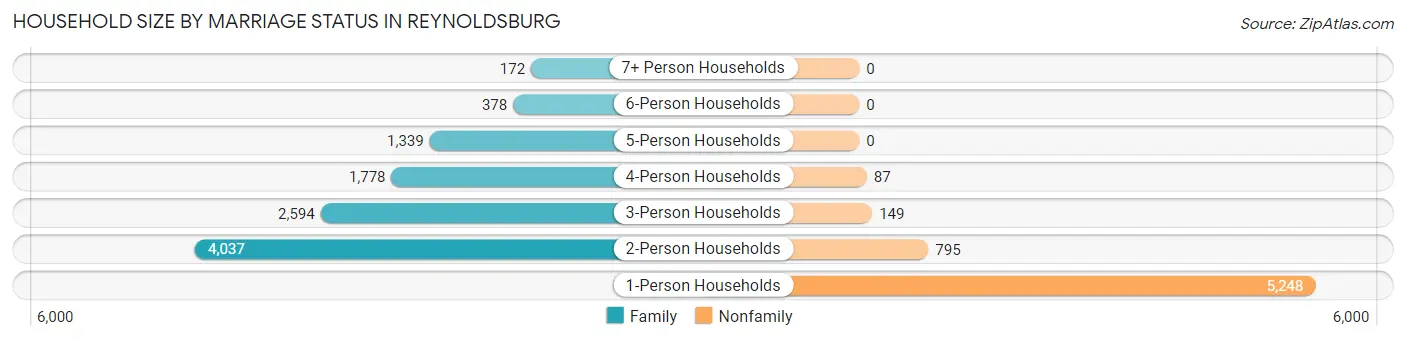
| Household Size | Family Households | Nonfamily Households |
| 1-Person Households | - | 5,248 (31.7%) |
| 2-Person Households | 4,037 (24.3%) | 795 (4.8%) |
| 3-Person Households | 2,594 (15.7%) | 149 (0.9%) |
| 4-Person Households | 1,778 (10.7%) | 87 (0.5%) |
| 5-Person Households | 1,339 (8.1%) | 0 (0.0%) |
| 6-Person Households | 378 (2.3%) | 0 (0.0%) |
| 7+ Person Households | 172 (1.0%) | 0 (0.0%) |
| Total | 10,298 (62.1%) | 6,279 (37.9%) |
Female Fertility in Reynoldsburg
Fertility by Age in Reynoldsburg
Average fertility rate in Reynoldsburg is 63.0 births per 1,000 women. Women in the age bracket of 20 to 34 years have the highest fertility rate with 97.0 births per 1,000 women. Women in the age bracket of 20 to 34 years acount for 66.3% of all women with births.
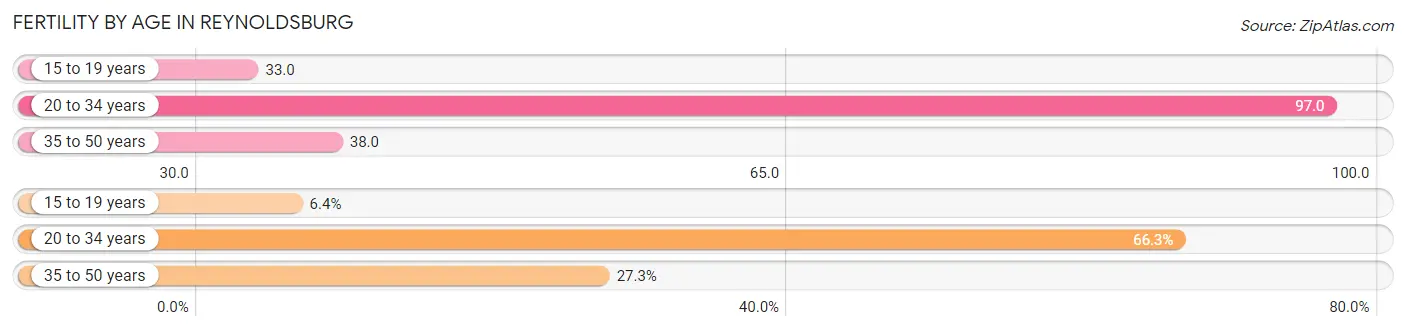
| Age Bracket | Women with Births | Births / 1,000 Women |
| 15 to 19 years | 37 (6.4%) | 33.0 |
| 20 to 34 years | 382 (66.3%) | 97.0 |
| 35 to 50 years | 157 (27.3%) | 38.0 |
| Total | 576 (100.0%) | 63.0 |
Fertility by Age by Marriage Status in Reynoldsburg
46.9% of women with births (576) in Reynoldsburg are married. The highest percentage of unmarried women with births falls into 15 to 19 years age bracket with 100.0% of them unmarried at the time of birth, while the lowest percentage of unmarried women with births belong to 35 to 50 years age bracket with 40.8% of them unmarried.
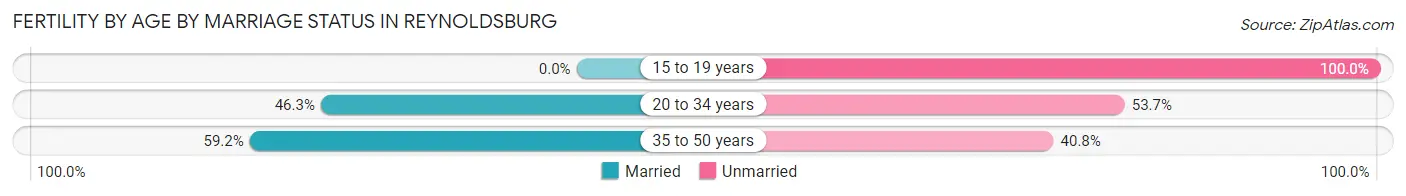
| Age Bracket | Married | Unmarried |
| 15 to 19 years | 0 (0.0%) | 37 (100.0%) |
| 20 to 34 years | 177 (46.3%) | 205 (53.7%) |
| 35 to 50 years | 93 (59.2%) | 64 (40.8%) |
| Total | 270 (46.9%) | 306 (53.1%) |
Fertility by Education in Reynoldsburg
Average fertility rate in Reynoldsburg is 63.0 births per 1,000 women. Women with the education attainment of high school diploma have the highest fertility rate of 148.0 births per 1,000 women, while women with the education attainment of bachelor's degree have the lowest fertility at 24.0 births per 1,000 women. Women with the education attainment of high school diploma represent 47.4% of all women with births.
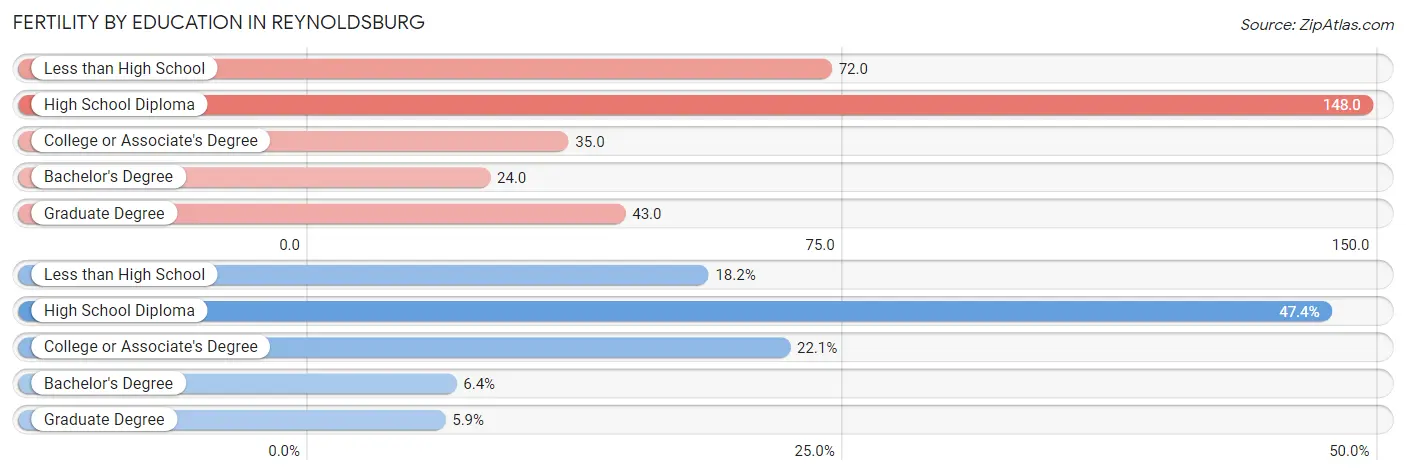
| Educational Attainment | Women with Births | Births / 1,000 Women |
| Less than High School | 105 (18.2%) | 72.0 |
| High School Diploma | 273 (47.4%) | 148.0 |
| College or Associate's Degree | 127 (22.1%) | 35.0 |
| Bachelor's Degree | 37 (6.4%) | 24.0 |
| Graduate Degree | 34 (5.9%) | 43.0 |
| Total | 576 (100.0%) | 63.0 |
Fertility by Education by Marriage Status in Reynoldsburg
53.1% of women with births in Reynoldsburg are unmarried. Women with the educational attainment of bachelor's degree are most likely to be married with 73.0% of them married at childbirth, while women with the educational attainment of college or associate's degree are least likely to be married with 76.4% of them unmarried at childbirth.
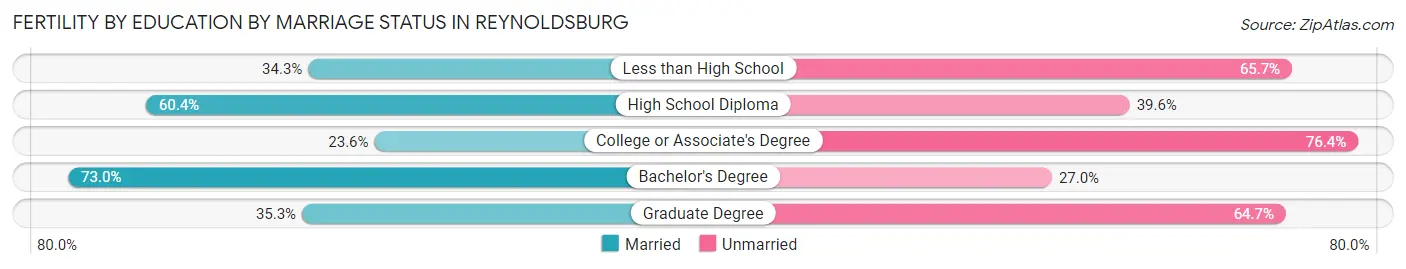
| Educational Attainment | Married | Unmarried |
| Less than High School | 36 (34.3%) | 69 (65.7%) |
| High School Diploma | 165 (60.4%) | 108 (39.6%) |
| College or Associate's Degree | 30 (23.6%) | 97 (76.4%) |
| Bachelor's Degree | 27 (73.0%) | 10 (27.0%) |
| Graduate Degree | 12 (35.3%) | 22 (64.7%) |
| Total | 270 (46.9%) | 306 (53.1%) |
Income in Reynoldsburg
Income Overview in Reynoldsburg
Per Capita Income in Reynoldsburg is $35,735, while median incomes of families and households are $87,719 and $68,778 respectively.
| Characteristic | Number | Measure |
| Per Capita Income | 40,926 | $35,735 |
| Median Family Income | 10,298 | $87,719 |
| Mean Family Income | 10,298 | $104,995 |
| Median Household Income | 16,577 | $68,778 |
| Mean Household Income | 16,577 | $87,325 |
| Income Deficit | 10,298 | $10,144 |
| Wage / Income Gap (%) | 40,926 | 12.44% |
| Wage / Income Gap ($) | 40,926 | 87.56¢ per $1 |
| Gini / Inequality Index | 40,926 | 0.41 |
Earnings by Sex in Reynoldsburg
Average Earnings in Reynoldsburg are $41,638, $44,574 for men and $39,030 for women, a difference of 12.4%.
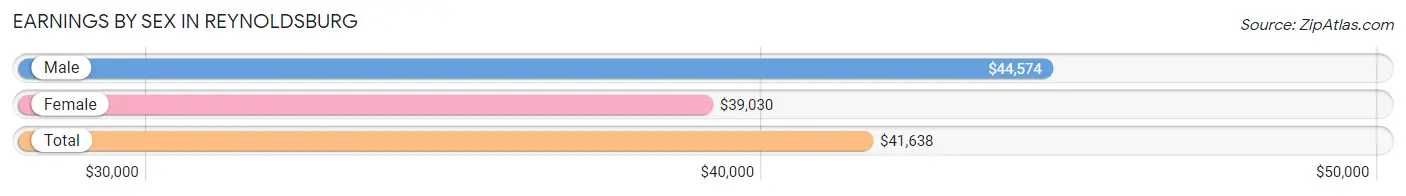
| Sex | Number | Average Earnings |
| Male | 11,606 (51.9%) | $44,574 |
| Female | 10,772 (48.1%) | $39,030 |
| Total | 22,378 (100.0%) | $41,638 |
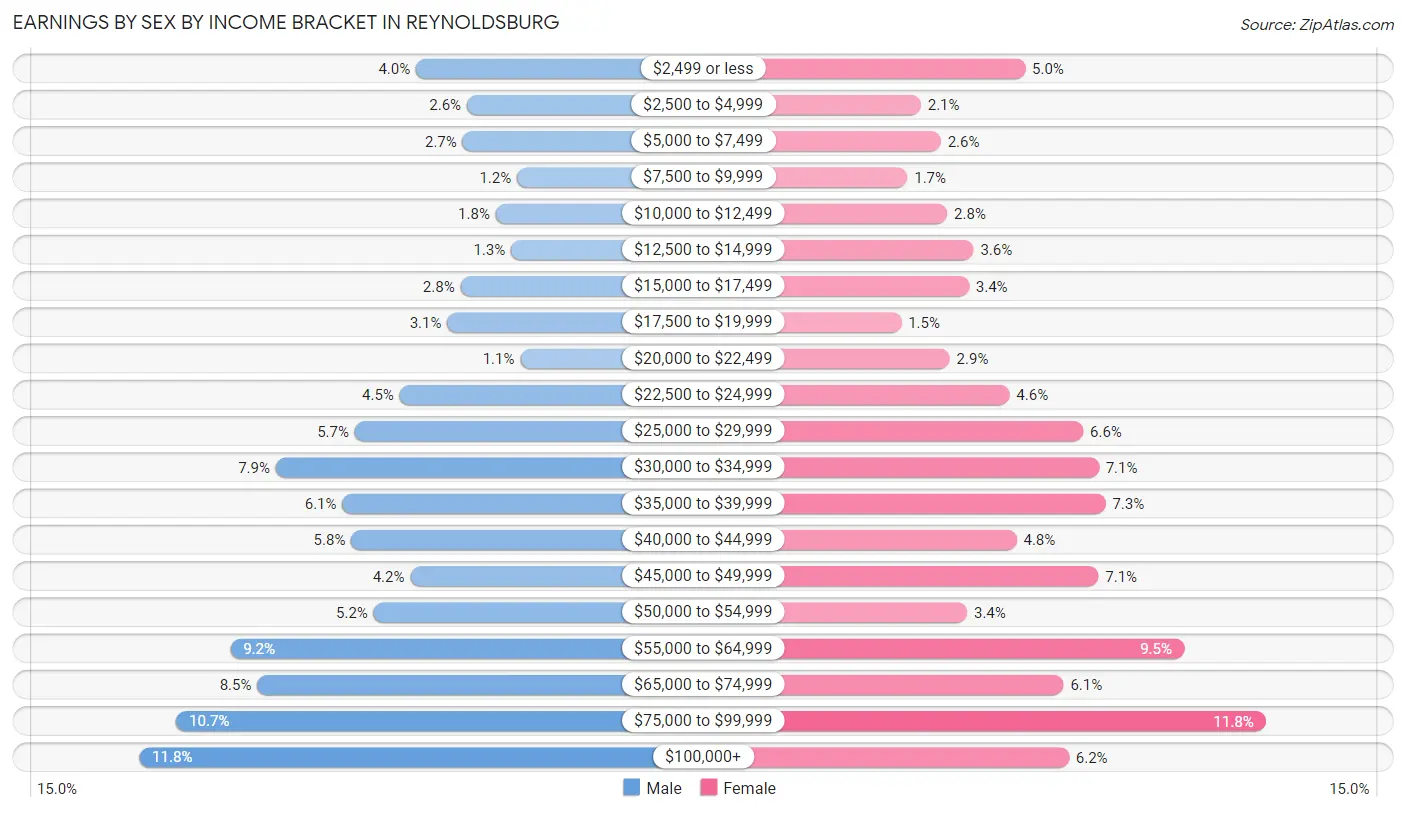
Earnings by Sex by Income Bracket in Reynoldsburg
The most common earnings brackets in Reynoldsburg are $100,000+ for men (1,367 | 11.8%) and $75,000 to $99,999 for women (1,268 | 11.8%).
| Income | Male | Female |
| $2,499 or less | 464 (4.0%) | 540 (5.0%) |
| $2,500 to $4,999 | 298 (2.6%) | 224 (2.1%) |
| $5,000 to $7,499 | 312 (2.7%) | 284 (2.6%) |
| $7,500 to $9,999 | 135 (1.2%) | 183 (1.7%) |
| $10,000 to $12,499 | 204 (1.8%) | 304 (2.8%) |
| $12,500 to $14,999 | 154 (1.3%) | 383 (3.6%) |
| $15,000 to $17,499 | 319 (2.8%) | 369 (3.4%) |
| $17,500 to $19,999 | 362 (3.1%) | 165 (1.5%) |
| $20,000 to $22,499 | 124 (1.1%) | 311 (2.9%) |
| $22,500 to $24,999 | 518 (4.5%) | 492 (4.6%) |
| $25,000 to $29,999 | 664 (5.7%) | 715 (6.6%) |
| $30,000 to $34,999 | 922 (7.9%) | 763 (7.1%) |
| $35,000 to $39,999 | 705 (6.1%) | 783 (7.3%) |
| $40,000 to $44,999 | 675 (5.8%) | 514 (4.8%) |
| $45,000 to $49,999 | 483 (4.2%) | 762 (7.1%) |
| $50,000 to $54,999 | 602 (5.2%) | 364 (3.4%) |
| $55,000 to $64,999 | 1,070 (9.2%) | 1,020 (9.5%) |
| $65,000 to $74,999 | 982 (8.5%) | 656 (6.1%) |
| $75,000 to $99,999 | 1,246 (10.7%) | 1,268 (11.8%) |
| $100,000+ | 1,367 (11.8%) | 672 (6.2%) |
| Total | 11,606 (100.0%) | 10,772 (100.0%) |
Earnings by Sex by Educational Attainment in Reynoldsburg
Average earnings in Reynoldsburg are $51,840 for men and $43,445 for women, a difference of 16.2%. Men with an educational attainment of graduate degree enjoy the highest average annual earnings of $75,938, while those with high school diploma education earn the least with $33,542. Women with an educational attainment of graduate degree earn the most with the average annual earnings of $79,322, while those with less than high school education have the smallest earnings of $23,397.
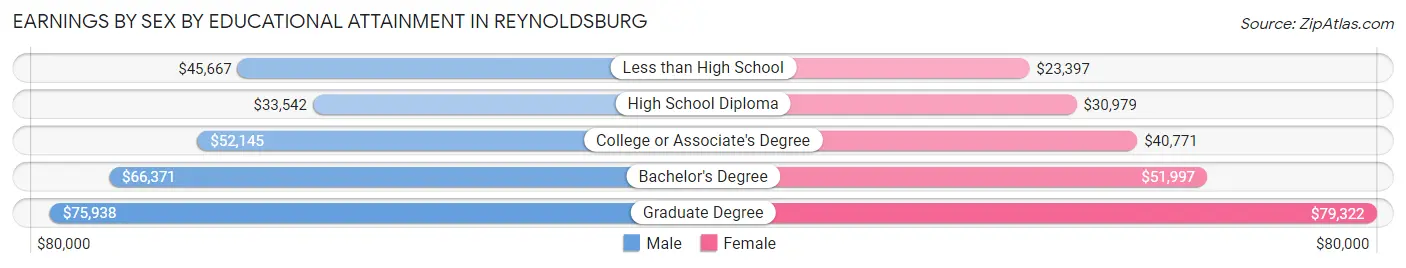
| Educational Attainment | Male Income | Female Income |
| Less than High School | $45,667 | $23,397 |
| High School Diploma | $33,542 | $30,979 |
| College or Associate's Degree | $52,145 | $40,771 |
| Bachelor's Degree | $66,371 | $51,997 |
| Graduate Degree | $75,938 | $79,322 |
| Total | $51,840 | $43,445 |
Family Income in Reynoldsburg
Family Income Brackets in Reynoldsburg
According to the Reynoldsburg family income data, there are 2,163 families falling into the $100,000 to $149,999 income range, which is the most common income bracket and makes up 21.0% of all families. Conversely, the $10,000 to $14,999 income bracket is the least frequent group with only 103 families (1.0%) belonging to this category.
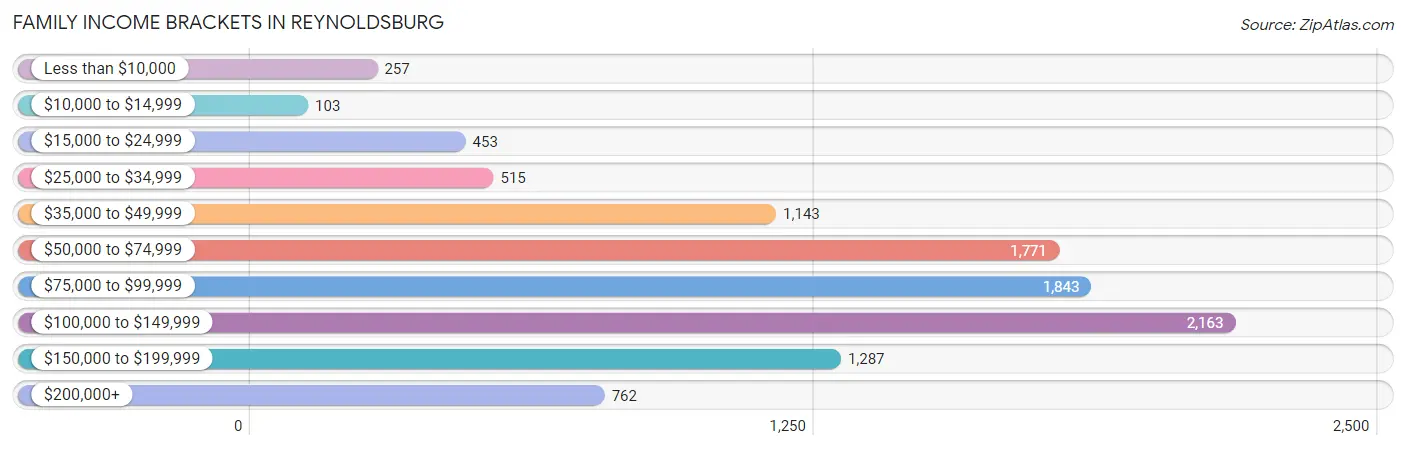
| Income Bracket | # Families | % Families |
| Less than $10,000 | 257 | 2.5% |
| $10,000 to $14,999 | 103 | 1.0% |
| $15,000 to $24,999 | 453 | 4.4% |
| $25,000 to $34,999 | 515 | 5.0% |
| $35,000 to $49,999 | 1,143 | 11.1% |
| $50,000 to $74,999 | 1,771 | 17.2% |
| $75,000 to $99,999 | 1,843 | 17.9% |
| $100,000 to $149,999 | 2,163 | 21.0% |
| $150,000 to $199,999 | 1,287 | 12.5% |
| $200,000+ | 762 | 7.4% |
Family Income by Famaliy Size in Reynoldsburg
4-person families (1,620 | 15.7%) account for the highest median family income in Reynoldsburg with $110,037 per family, while 2-person families (4,273 | 41.5%) have the highest median income of $42,378 per family member.
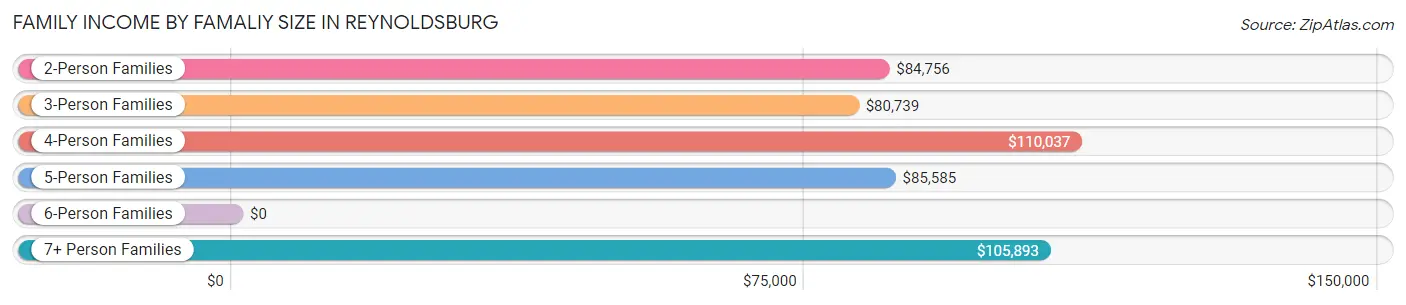
| Income Bracket | # Families | Median Income |
| 2-Person Families | 4,273 (41.5%) | $84,756 |
| 3-Person Families | 2,788 (27.1%) | $80,739 |
| 4-Person Families | 1,620 (15.7%) | $110,037 |
| 5-Person Families | 1,108 (10.8%) | $85,585 |
| 6-Person Families | 337 (3.3%) | $0 |
| 7+ Person Families | 172 (1.7%) | $105,893 |
| Total | 10,298 (100.0%) | $87,719 |
Family Income by Number of Earners in Reynoldsburg
The median family income in Reynoldsburg is $87,719, with families comprising 3+ earners (1,401) having the highest median family income of $141,469, while families with no earners (1,207) have the lowest median family income of $55,699, accounting for 13.6% and 11.7% of families, respectively.
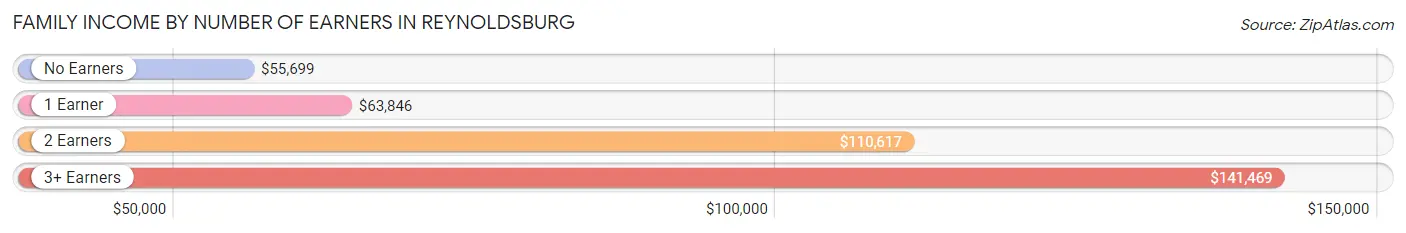
| Number of Earners | # Families | Median Income |
| No Earners | 1,207 (11.7%) | $55,699 |
| 1 Earner | 3,258 (31.6%) | $63,846 |
| 2 Earners | 4,432 (43.0%) | $110,617 |
| 3+ Earners | 1,401 (13.6%) | $141,469 |
| Total | 10,298 (100.0%) | $87,719 |
Household Income in Reynoldsburg
Household Income Brackets in Reynoldsburg
With 3,034 households falling in the category, the $50,000 to $74,999 income range is the most frequent in Reynoldsburg, accounting for 18.3% of all households. In contrast, only 398 households (2.4%) fall into the $10,000 to $14,999 income bracket, making it the least populous group.
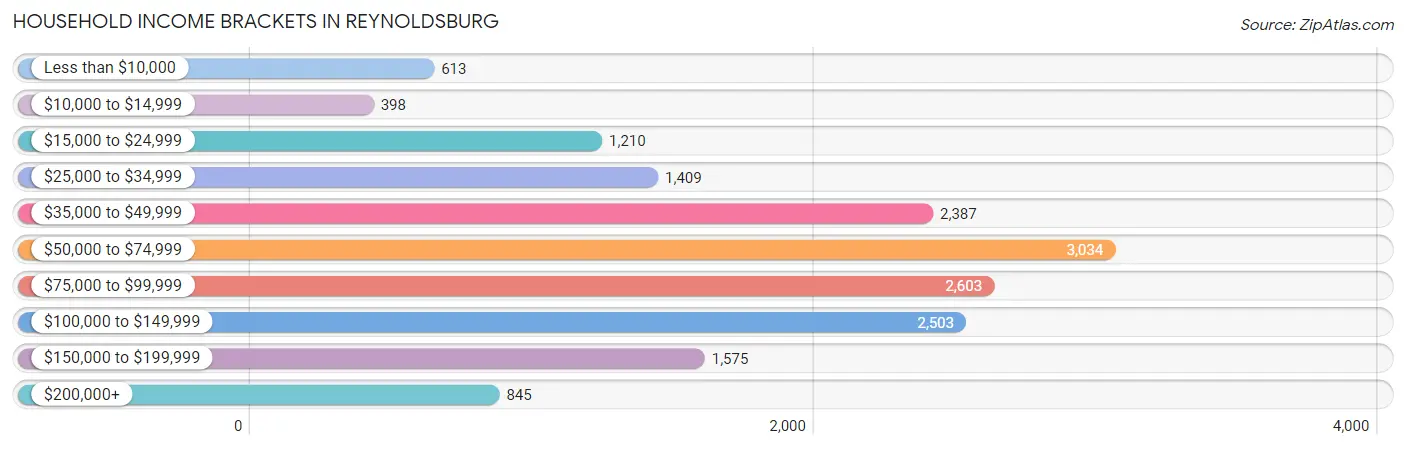
| Income Bracket | # Households | % Households |
| Less than $10,000 | 613 | 3.7% |
| $10,000 to $14,999 | 398 | 2.4% |
| $15,000 to $24,999 | 1,210 | 7.3% |
| $25,000 to $34,999 | 1,409 | 8.5% |
| $35,000 to $49,999 | 2,387 | 14.4% |
| $50,000 to $74,999 | 3,034 | 18.3% |
| $75,000 to $99,999 | 2,603 | 15.7% |
| $100,000 to $149,999 | 2,503 | 15.1% |
| $150,000 to $199,999 | 1,575 | 9.5% |
| $200,000+ | 845 | 5.1% |
Household Income by Householder Age in Reynoldsburg
The median household income in Reynoldsburg is $68,778, with the highest median household income of $76,204 found in the 45 to 64 years age bracket for the primary householder. A total of 6,478 households (39.1%) fall into this category. Meanwhile, the 15 to 24 years age bracket for the primary householder has the lowest median household income of $36,500, with 358 households (2.2%) in this group.
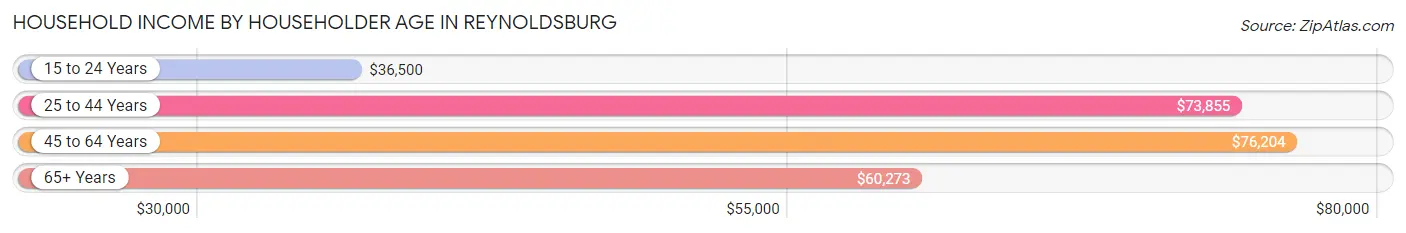
| Income Bracket | # Households | Median Income |
| 15 to 24 Years | 358 (2.2%) | $36,500 |
| 25 to 44 Years | 5,772 (34.8%) | $73,855 |
| 45 to 64 Years | 6,478 (39.1%) | $76,204 |
| 65+ Years | 3,969 (23.9%) | $60,273 |
| Total | 16,577 (100.0%) | $68,778 |
Poverty in Reynoldsburg
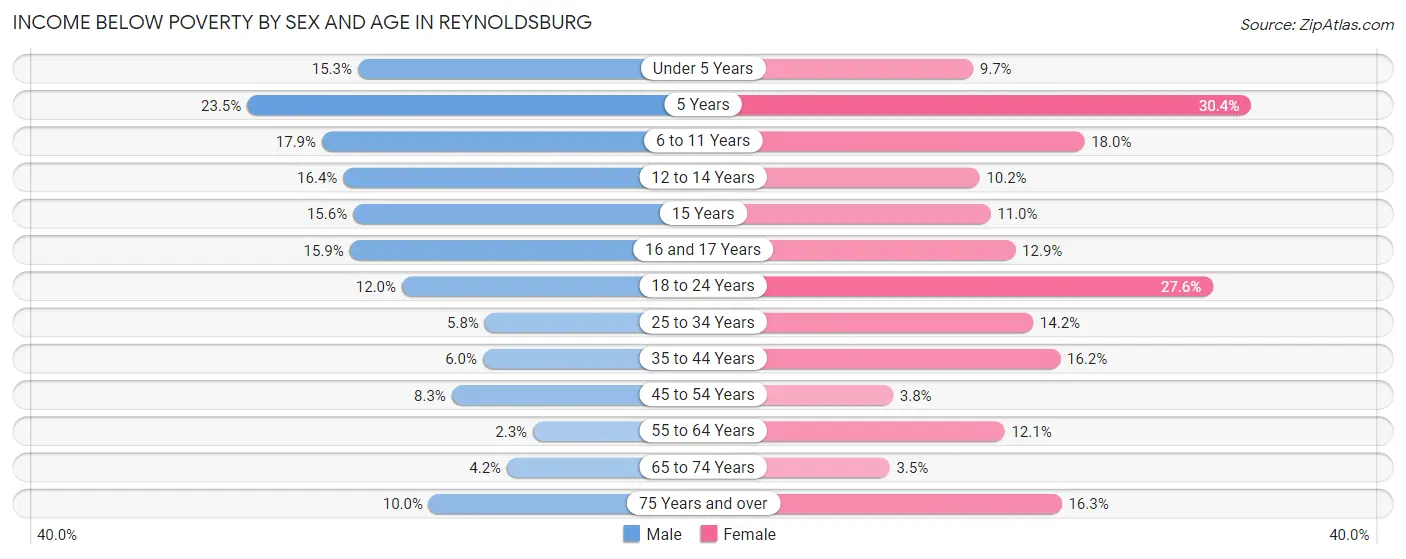
Income Below Poverty by Sex and Age in Reynoldsburg
With 9.1% poverty level for males and 13.0% for females among the residents of Reynoldsburg, 5 year old males and 5 year old females are the most vulnerable to poverty, with 58 males (23.5%) and 96 females (30.4%) in their respective age groups living below the poverty level.
| Age Bracket | Male | Female |
| Under 5 Years | 221 (15.3%) | 113 (9.7%) |
| 5 Years | 58 (23.5%) | 96 (30.4%) |
| 6 to 11 Years | 208 (17.9%) | 309 (18.0%) |
| 12 to 14 Years | 162 (16.4%) | 110 (10.2%) |
| 15 Years | 57 (15.6%) | 32 (11.0%) |
| 16 and 17 Years | 113 (15.9%) | 56 (12.9%) |
| 18 to 24 Years | 224 (12.0%) | 353 (27.6%) |
| 25 to 34 Years | 153 (5.8%) | 429 (14.2%) |
| 35 to 44 Years | 157 (6.0%) | 434 (16.2%) |
| 45 to 54 Years | 213 (8.3%) | 88 (3.8%) |
| 55 to 64 Years | 57 (2.3%) | 356 (12.1%) |
| 65 to 74 Years | 64 (4.2%) | 75 (3.5%) |
| 75 Years and over | 91 (10.0%) | 273 (16.3%) |
| Total | 1,778 (9.1%) | 2,724 (13.0%) |
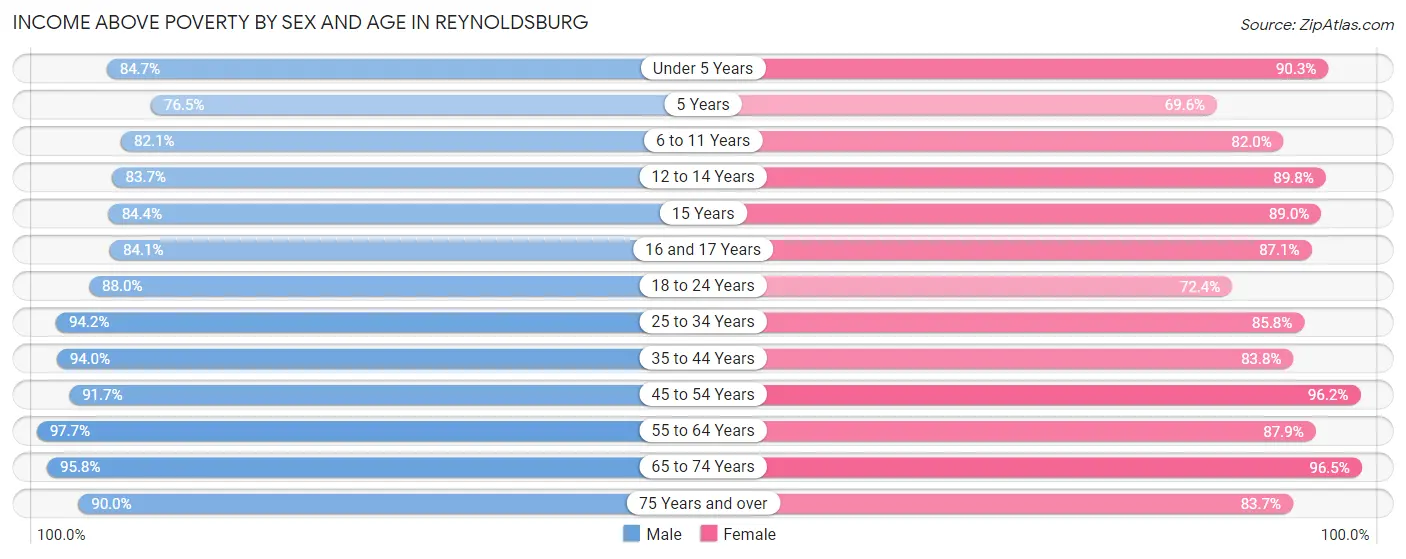
Income Above Poverty by Sex and Age in Reynoldsburg
According to the poverty statistics in Reynoldsburg, males aged 55 to 64 years and females aged 65 to 74 years are the age groups that are most secure financially, with 97.7% of males and 96.5% of females in these age groups living above the poverty line.
| Age Bracket | Male | Female |
| Under 5 Years | 1,227 (84.7%) | 1,048 (90.3%) |
| 5 Years | 189 (76.5%) | 220 (69.6%) |
| 6 to 11 Years | 952 (82.1%) | 1,408 (82.0%) |
| 12 to 14 Years | 829 (83.7%) | 966 (89.8%) |
| 15 Years | 308 (84.4%) | 258 (89.0%) |
| 16 and 17 Years | 599 (84.1%) | 379 (87.1%) |
| 18 to 24 Years | 1,645 (88.0%) | 928 (72.4%) |
| 25 to 34 Years | 2,466 (94.2%) | 2,594 (85.8%) |
| 35 to 44 Years | 2,469 (94.0%) | 2,244 (83.8%) |
| 45 to 54 Years | 2,355 (91.7%) | 2,234 (96.2%) |
| 55 to 64 Years | 2,470 (97.7%) | 2,591 (87.9%) |
| 65 to 74 Years | 1,464 (95.8%) | 2,045 (96.5%) |
| 75 Years and over | 820 (90.0%) | 1,401 (83.7%) |
| Total | 17,793 (90.9%) | 18,316 (87.1%) |
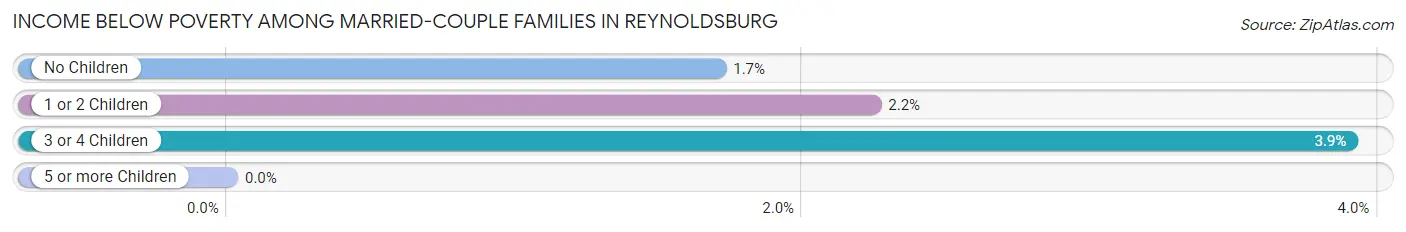
Income Below Poverty Among Married-Couple Families in Reynoldsburg
The poverty statistics for married-couple families in Reynoldsburg show that 2.1% or 146 of the total 6,940 families live below the poverty line. Families with 3 or 4 children have the highest poverty rate of 3.9%, comprising of 34 families. On the other hand, families with 5 or more children have the lowest poverty rate of 0.0%, which includes 0 families.
| Children | Above Poverty | Below Poverty |
| No Children | 3,983 (98.3%) | 69 (1.7%) |
| 1 or 2 Children | 1,874 (97.8%) | 43 (2.2%) |
| 3 or 4 Children | 837 (96.1%) | 34 (3.9%) |
| 5 or more Children | 100 (100.0%) | 0 (0.0%) |
| Total | 6,794 (97.9%) | 146 (2.1%) |
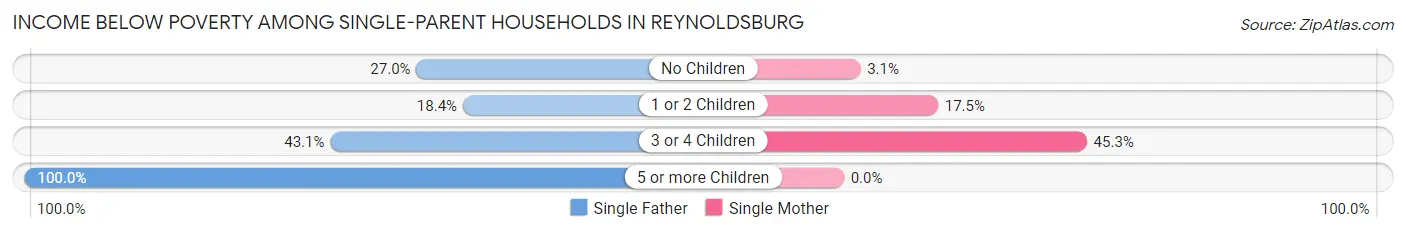
Income Below Poverty Among Single-Parent Households in Reynoldsburg
According to the poverty data in Reynoldsburg, 26.5% or 232 single-father households and 17.7% or 439 single-mother households are living below the poverty line. Among single-father households, those with 5 or more children have the highest poverty rate, with 31 households (100.0%) experiencing poverty. Likewise, among single-mother households, those with 3 or 4 children have the highest poverty rate, with 129 households (45.3%) falling below the poverty line.
| Children | Single Father | Single Mother |
| No Children | 87 (27.0%) | 16 (3.1%) |
| 1 or 2 Children | 83 (18.4%) | 294 (17.5%) |
| 3 or 4 Children | 31 (43.1%) | 129 (45.3%) |
| 5 or more Children | 31 (100.0%) | 0 (0.0%) |
| Total | 232 (26.5%) | 439 (17.7%) |
Income Below Poverty Among Married-Couple vs Single-Parent Households in Reynoldsburg
The poverty data for Reynoldsburg shows that 146 of the married-couple family households (2.1%) and 671 of the single-parent households (20.0%) are living below the poverty level. Within the married-couple family households, those with 3 or 4 children have the highest poverty rate, with 34 households (3.9%) falling below the poverty line. Among the single-parent households, those with 5 or more children have the highest poverty rate, with 31 household (100.0%) living below poverty.
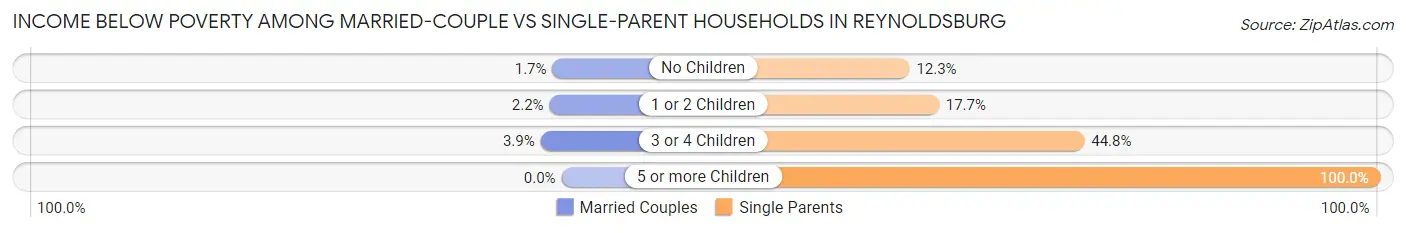
| Children | Married-Couple Families | Single-Parent Households |
| No Children | 69 (1.7%) | 103 (12.2%) |
| 1 or 2 Children | 43 (2.2%) | 377 (17.7%) |
| 3 or 4 Children | 34 (3.9%) | 160 (44.8%) |
| 5 or more Children | 0 (0.0%) | 31 (100.0%) |
| Total | 146 (2.1%) | 671 (20.0%) |
Employment Characteristics in Reynoldsburg
Employment by Class of Employer in Reynoldsburg
Among the 20,229 employed individuals in Reynoldsburg, private company employees (14,043 | 69.4%), not-for-profit organizations (1,798 | 8.9%), and local government employees (1,332 | 6.6%) make up the most common classes of employment.
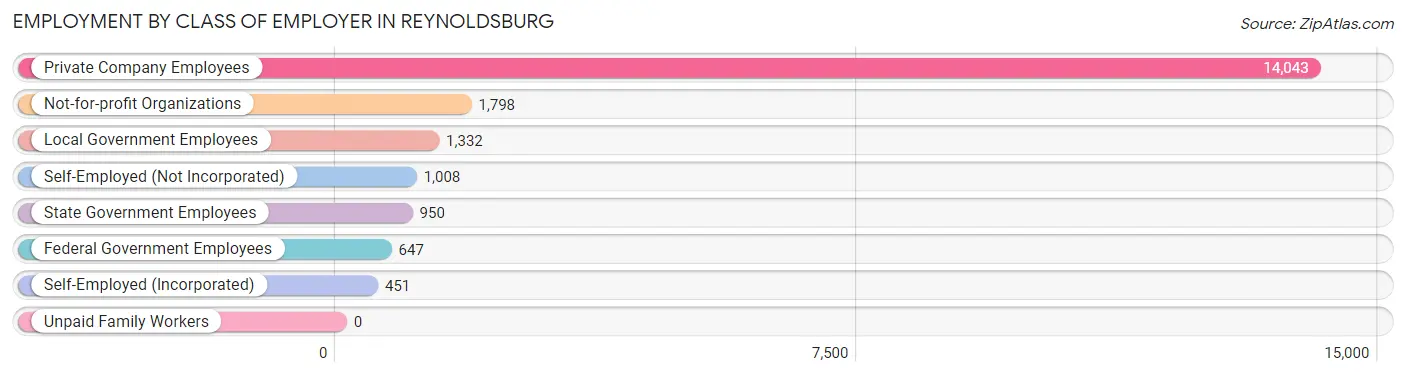
| Employer Class | # Employees | % Employees |
| Private Company Employees | 14,043 | 69.4% |
| Self-Employed (Incorporated) | 451 | 2.2% |
| Self-Employed (Not Incorporated) | 1,008 | 5.0% |
| Not-for-profit Organizations | 1,798 | 8.9% |
| Local Government Employees | 1,332 | 6.6% |
| State Government Employees | 950 | 4.7% |
| Federal Government Employees | 647 | 3.2% |
| Unpaid Family Workers | 0 | 0.0% |
| Total | 20,229 | 100.0% |
Employment Status by Age in Reynoldsburg
According to the labor force statistics for Reynoldsburg, out of the total population over 16 years of age (31,915), 67.7% or 21,606 individuals are in the labor force, with 5.4% or 1,167 of them unemployed. The age group with the highest labor force participation rate is 45 to 54 years, with 91.6% or 4,479 individuals in the labor force. Within the labor force, the 16 to 19 years age range has the highest percentage of unemployed individuals, with 16.5% or 150 of them being unemployed.
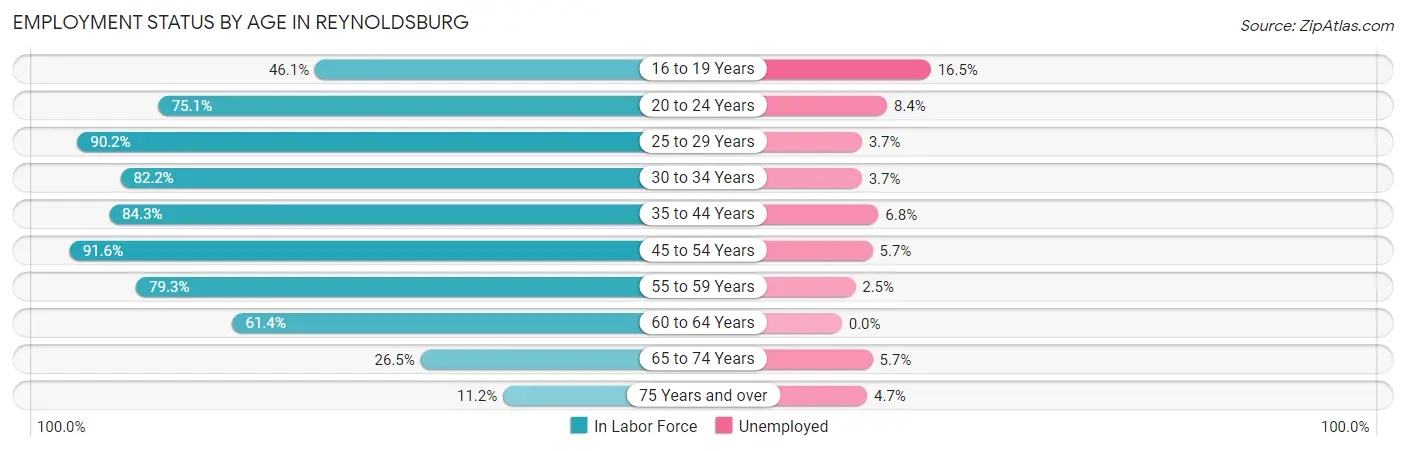
| Age Bracket | In Labor Force | Unemployed |
| 16 to 19 Years | 912 (46.1%) | 150 (16.5%) |
| 20 to 24 Years | 1,741 (75.1%) | 146 (8.4%) |
| 25 to 29 Years | 2,291 (90.2%) | 85 (3.7%) |
| 30 to 34 Years | 2,550 (82.2%) | 94 (3.7%) |
| 35 to 44 Years | 4,471 (84.3%) | 304 (6.8%) |
| 45 to 54 Years | 4,479 (91.6%) | 255 (5.7%) |
| 55 to 59 Years | 2,321 (79.3%) | 58 (2.5%) |
| 60 to 64 Years | 1,564 (61.4%) | 0 (0.0%) |
| 65 to 74 Years | 968 (26.5%) | 55 (5.7%) |
| 75 Years and over | 298 (11.2%) | 14 (4.7%) |
| Total | 21,606 (67.7%) | 1,167 (5.4%) |
Employment Status by Educational Attainment in Reynoldsburg
According to labor force statistics for Reynoldsburg, 82.9% of individuals (17,666) out of the total population between 25 and 64 years of age (21,310) are in the labor force, with 4.5% or 795 of them being unemployed. The group with the highest labor force participation rate are those with the educational attainment of bachelor's degree or higher, with 89.6% or 5,924 individuals in the labor force. Within the labor force, individuals with less than high school education have the highest percentage of unemployment, with 13.0% or 136 of them being unemployed.
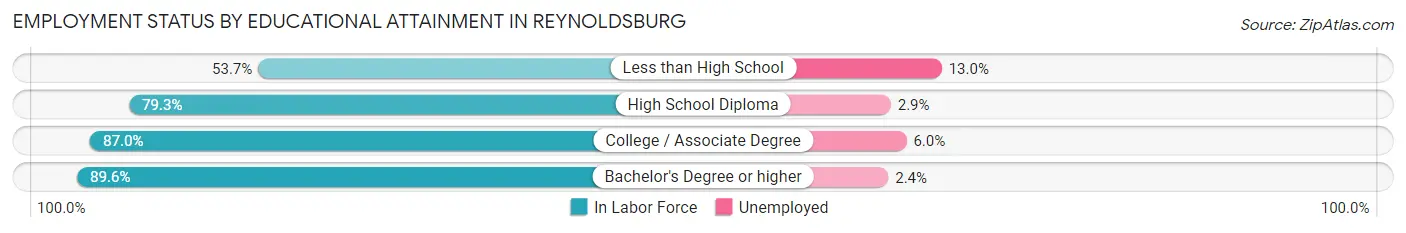
| Educational Attainment | In Labor Force | Unemployed |
| Less than High School | 1,050 (53.7%) | 254 (13.0%) |
| High School Diploma | 3,938 (79.3%) | 144 (2.9%) |
| College / Associate Degree | 6,766 (87.0%) | 467 (6.0%) |
| Bachelor's Degree or higher | 5,924 (89.6%) | 159 (2.4%) |
| Total | 17,666 (82.9%) | 959 (4.5%) |
Employment Occupations by Sex in Reynoldsburg
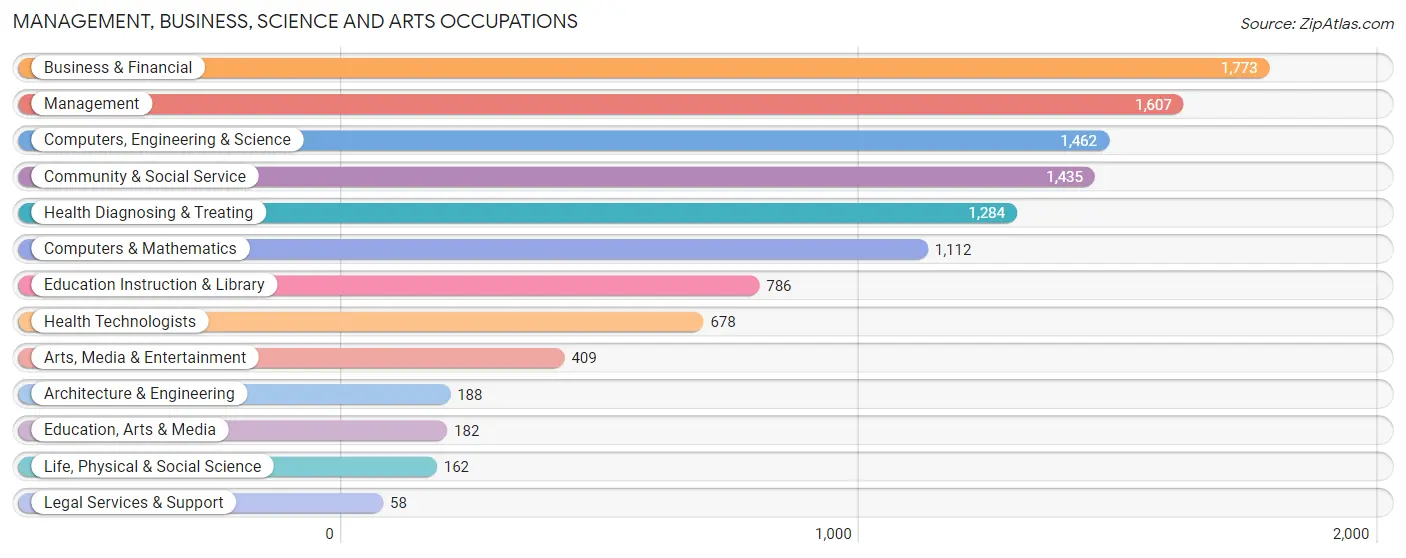
Management, Business, Science and Arts Occupations
The most common Management, Business, Science and Arts occupations in Reynoldsburg are Business & Financial (1,773 | 8.7%), Management (1,607 | 7.9%), Computers, Engineering & Science (1,462 | 7.2%), Community & Social Service (1,435 | 7.0%), and Health Diagnosing & Treating (1,284 | 6.3%).
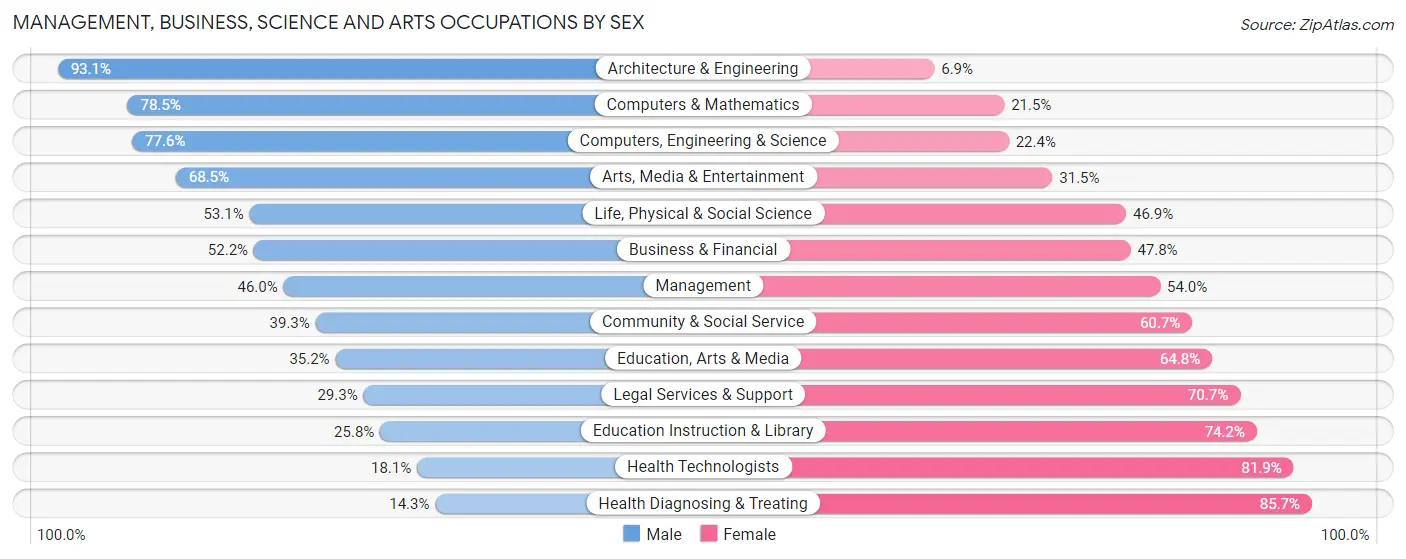
Management, Business, Science and Arts Occupations by Sex
Within the Management, Business, Science and Arts occupations in Reynoldsburg, the most male-oriented occupations are Architecture & Engineering (93.1%), Computers & Mathematics (78.5%), and Computers, Engineering & Science (77.6%), while the most female-oriented occupations are Health Diagnosing & Treating (85.7%), Health Technologists (81.9%), and Education Instruction & Library (74.2%).
| Occupation | Male | Female |
| Management | 739 (46.0%) | 868 (54.0%) |
| Business & Financial | 925 (52.2%) | 848 (47.8%) |
| Computers, Engineering & Science | 1,134 (77.6%) | 328 (22.4%) |
| Computers & Mathematics | 873 (78.5%) | 239 (21.5%) |
| Architecture & Engineering | 175 (93.1%) | 13 (6.9%) |
| Life, Physical & Social Science | 86 (53.1%) | 76 (46.9%) |
| Community & Social Service | 564 (39.3%) | 871 (60.7%) |
| Education, Arts & Media | 64 (35.2%) | 118 (64.8%) |
| Legal Services & Support | 17 (29.3%) | 41 (70.7%) |
| Education Instruction & Library | 203 (25.8%) | 583 (74.2%) |
| Arts, Media & Entertainment | 280 (68.5%) | 129 (31.5%) |
| Health Diagnosing & Treating | 184 (14.3%) | 1,100 (85.7%) |
| Health Technologists | 123 (18.1%) | 555 (81.9%) |
| Total (Category) | 3,546 (46.9%) | 4,015 (53.1%) |
| Total (Overall) | 10,646 (52.2%) | 9,764 (47.8%) |
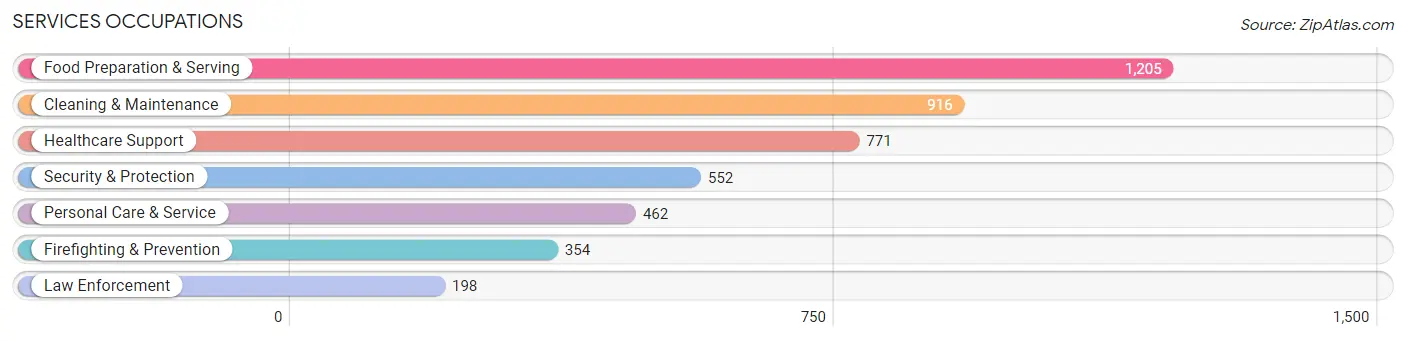
Services Occupations
The most common Services occupations in Reynoldsburg are Food Preparation & Serving (1,205 | 5.9%), Cleaning & Maintenance (916 | 4.5%), Healthcare Support (771 | 3.8%), Security & Protection (552 | 2.7%), and Personal Care & Service (462 | 2.3%).
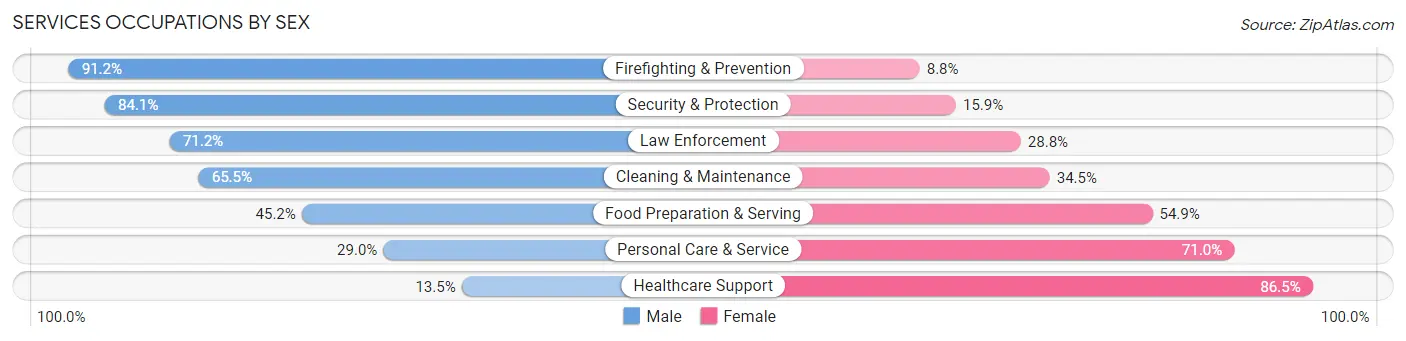
Services Occupations by Sex
Within the Services occupations in Reynoldsburg, the most male-oriented occupations are Firefighting & Prevention (91.2%), Security & Protection (84.1%), and Law Enforcement (71.2%), while the most female-oriented occupations are Healthcare Support (86.5%), Personal Care & Service (71.0%), and Food Preparation & Serving (54.8%).
| Occupation | Male | Female |
| Healthcare Support | 104 (13.5%) | 667 (86.5%) |
| Security & Protection | 464 (84.1%) | 88 (15.9%) |
| Firefighting & Prevention | 323 (91.2%) | 31 (8.8%) |
| Law Enforcement | 141 (71.2%) | 57 (28.8%) |
| Food Preparation & Serving | 544 (45.2%) | 661 (54.8%) |
| Cleaning & Maintenance | 600 (65.5%) | 316 (34.5%) |
| Personal Care & Service | 134 (29.0%) | 328 (71.0%) |
| Total (Category) | 1,846 (47.3%) | 2,060 (52.7%) |
| Total (Overall) | 10,646 (52.2%) | 9,764 (47.8%) |
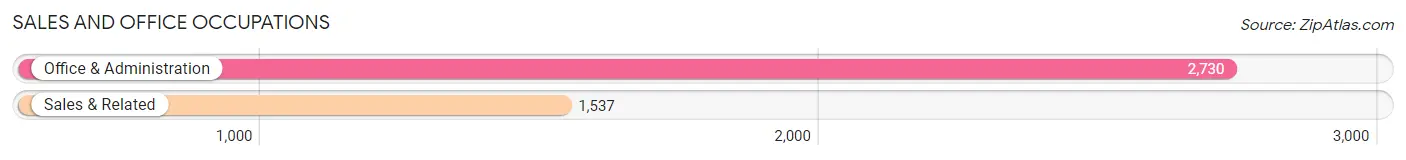
Sales and Office Occupations
The most common Sales and Office occupations in Reynoldsburg are Office & Administration (2,730 | 13.4%), and Sales & Related (1,537 | 7.5%).
Sales and Office Occupations by Sex
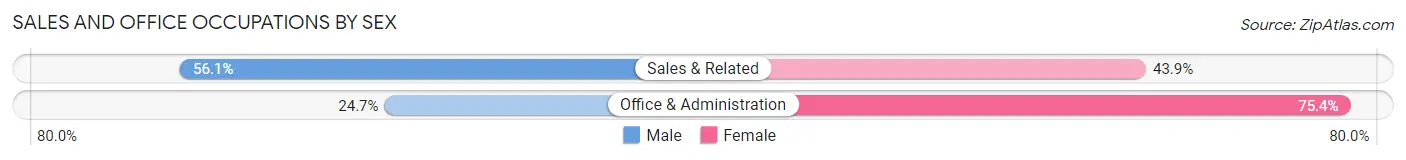
| Occupation | Male | Female |
| Sales & Related | 862 (56.1%) | 675 (43.9%) |
| Office & Administration | 673 (24.6%) | 2,057 (75.3%) |
| Total (Category) | 1,535 (36.0%) | 2,732 (64.0%) |
| Total (Overall) | 10,646 (52.2%) | 9,764 (47.8%) |
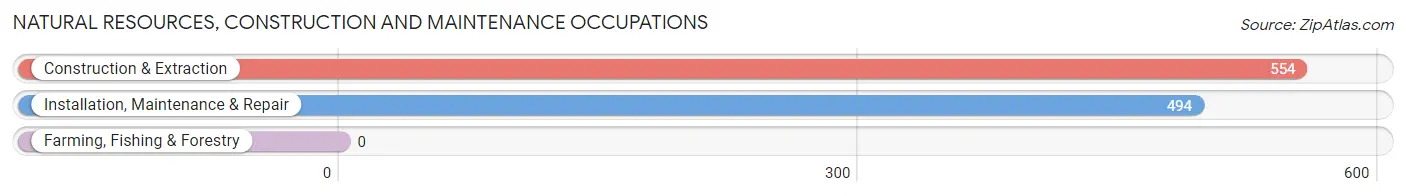
Natural Resources, Construction and Maintenance Occupations
The most common Natural Resources, Construction and Maintenance occupations in Reynoldsburg are Construction & Extraction (554 | 2.7%), and Installation, Maintenance & Repair (494 | 2.4%).
Natural Resources, Construction and Maintenance Occupations by Sex
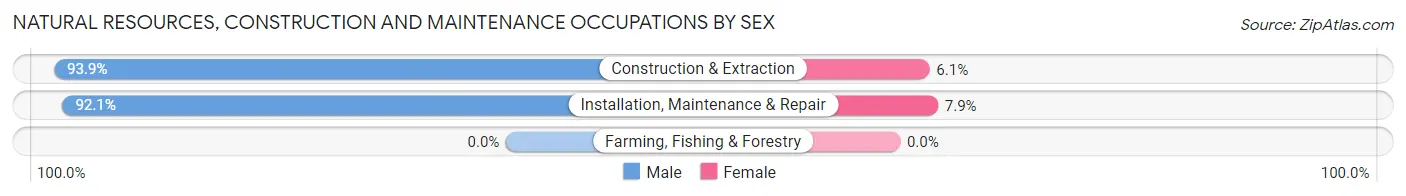
| Occupation | Male | Female |
| Farming, Fishing & Forestry | 0 (0.0%) | 0 (0.0%) |
| Construction & Extraction | 520 (93.9%) | 34 (6.1%) |
| Installation, Maintenance & Repair | 455 (92.1%) | 39 (7.9%) |
| Total (Category) | 975 (93.0%) | 73 (7.0%) |
| Total (Overall) | 10,646 (52.2%) | 9,764 (47.8%) |
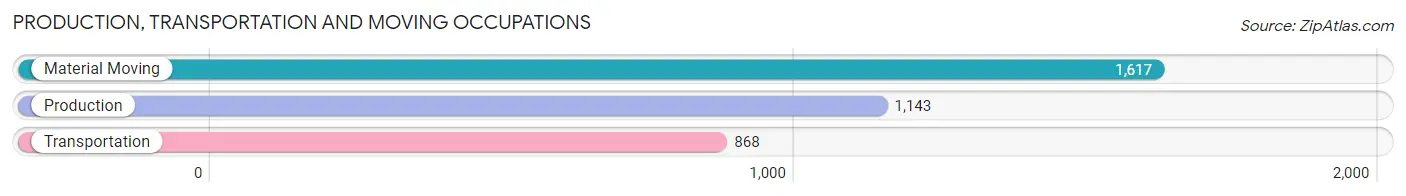
Production, Transportation and Moving Occupations
The most common Production, Transportation and Moving occupations in Reynoldsburg are Material Moving (1,617 | 7.9%), Production (1,143 | 5.6%), and Transportation (868 | 4.3%).
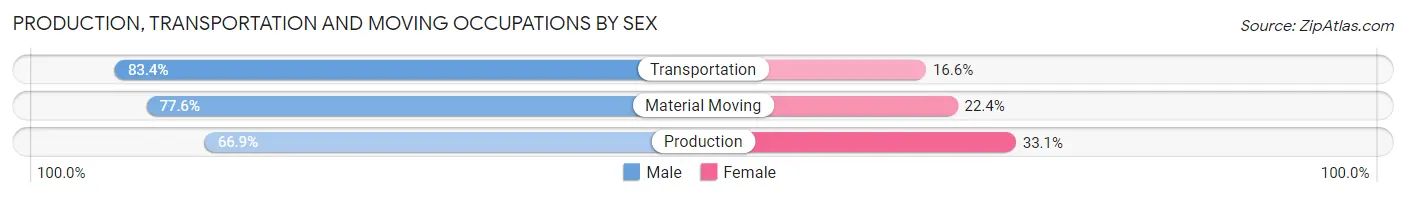
Production, Transportation and Moving Occupations by Sex
| Occupation | Male | Female |
| Production | 765 (66.9%) | 378 (33.1%) |
| Transportation | 724 (83.4%) | 144 (16.6%) |
| Material Moving | 1,255 (77.6%) | 362 (22.4%) |
| Total (Category) | 2,744 (75.6%) | 884 (24.4%) |
| Total (Overall) | 10,646 (52.2%) | 9,764 (47.8%) |
Employment Industries by Sex in Reynoldsburg
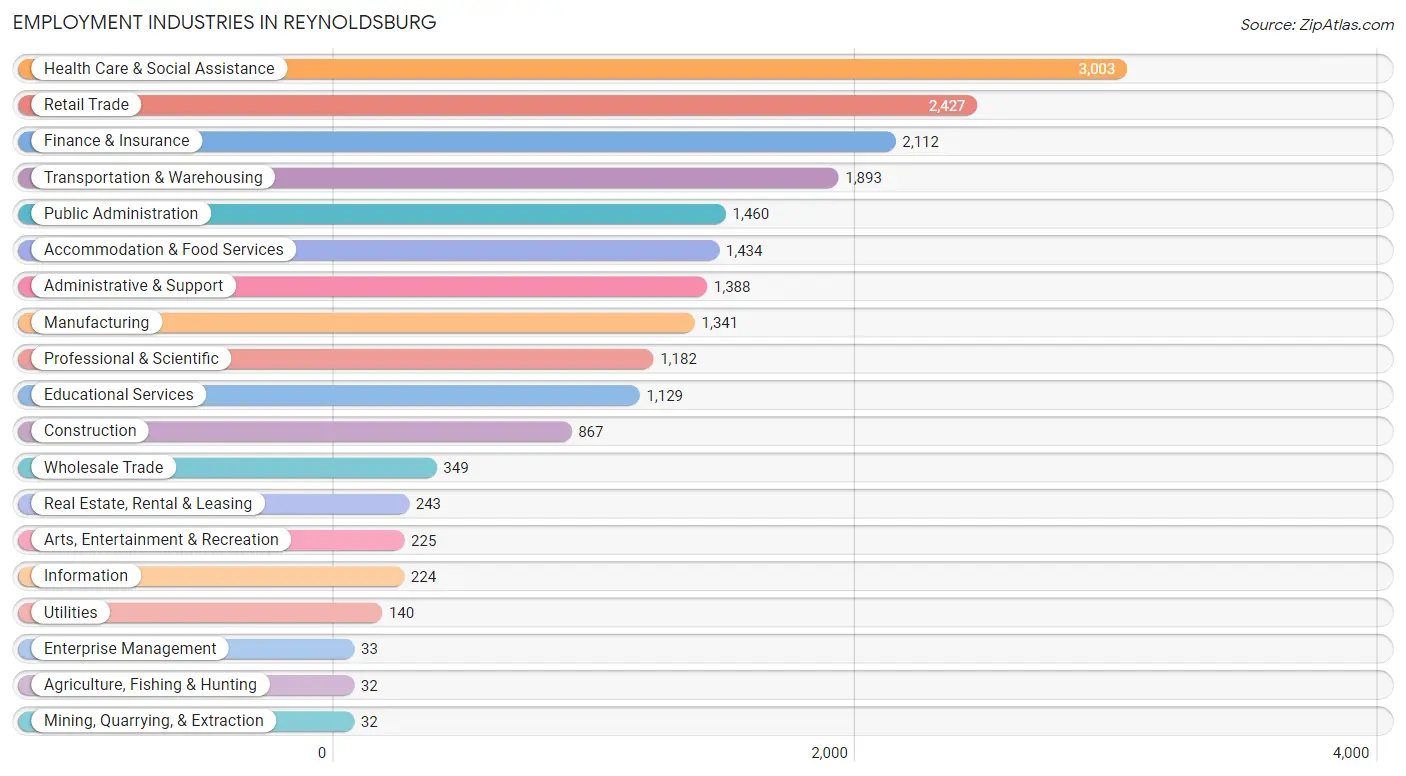
Employment Industries in Reynoldsburg
The major employment industries in Reynoldsburg include Health Care & Social Assistance (3,003 | 14.7%), Retail Trade (2,427 | 11.9%), Finance & Insurance (2,112 | 10.3%), Transportation & Warehousing (1,893 | 9.3%), and Public Administration (1,460 | 7.1%).
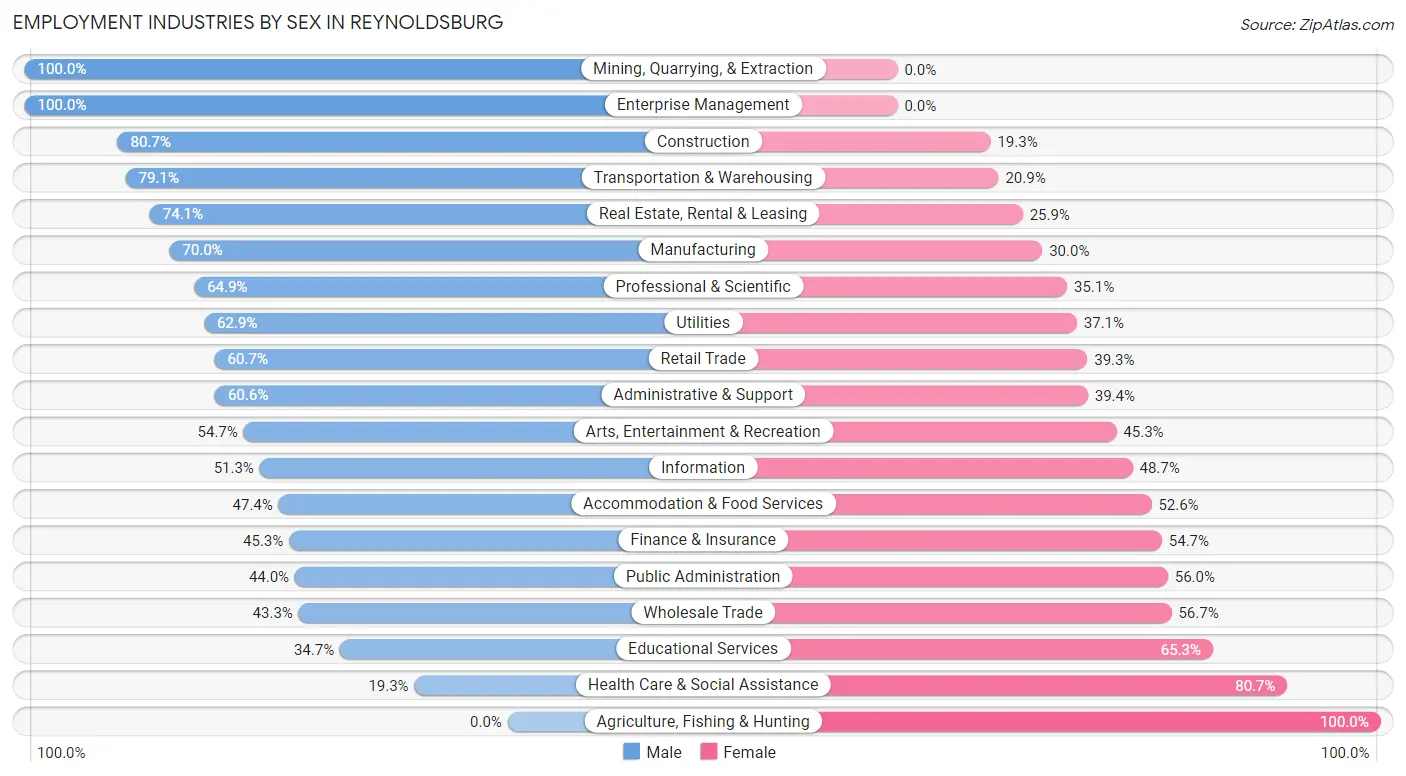
Employment Industries by Sex in Reynoldsburg
The Reynoldsburg industries that see more men than women are Mining, Quarrying, & Extraction (100.0%), Enterprise Management (100.0%), and Construction (80.7%), whereas the industries that tend to have a higher number of women are Agriculture, Fishing & Hunting (100.0%), Health Care & Social Assistance (80.7%), and Educational Services (65.3%).
| Industry | Male | Female |
| Agriculture, Fishing & Hunting | 0 (0.0%) | 32 (100.0%) |
| Mining, Quarrying, & Extraction | 32 (100.0%) | 0 (0.0%) |
| Construction | 700 (80.7%) | 167 (19.3%) |
| Manufacturing | 939 (70.0%) | 402 (30.0%) |
| Wholesale Trade | 151 (43.3%) | 198 (56.7%) |
| Retail Trade | 1,473 (60.7%) | 954 (39.3%) |
| Transportation & Warehousing | 1,497 (79.1%) | 396 (20.9%) |
| Utilities | 88 (62.9%) | 52 (37.1%) |
| Information | 115 (51.3%) | 109 (48.7%) |
| Finance & Insurance | 956 (45.3%) | 1,156 (54.7%) |
| Real Estate, Rental & Leasing | 180 (74.1%) | 63 (25.9%) |
| Professional & Scientific | 767 (64.9%) | 415 (35.1%) |
| Enterprise Management | 33 (100.0%) | 0 (0.0%) |
| Administrative & Support | 841 (60.6%) | 547 (39.4%) |
| Educational Services | 392 (34.7%) | 737 (65.3%) |
| Health Care & Social Assistance | 580 (19.3%) | 2,423 (80.7%) |
| Arts, Entertainment & Recreation | 123 (54.7%) | 102 (45.3%) |
| Accommodation & Food Services | 680 (47.4%) | 754 (52.6%) |
| Public Administration | 643 (44.0%) | 817 (56.0%) |
| Total | 10,646 (52.2%) | 9,764 (47.8%) |
Education in Reynoldsburg
School Enrollment in Reynoldsburg
The most common levels of schooling among the 9,505 students in Reynoldsburg are middle school (2,442 | 25.7%), high school (2,392 | 25.2%), and elementary school (1,997 | 21.0%).
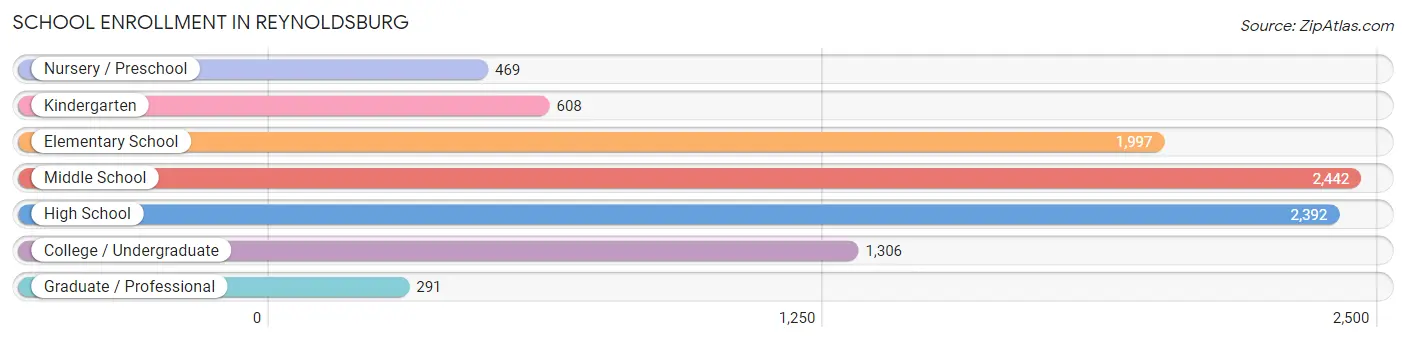
| School Level | # Students | % Students |
| Nursery / Preschool | 469 | 4.9% |
| Kindergarten | 608 | 6.4% |
| Elementary School | 1,997 | 21.0% |
| Middle School | 2,442 | 25.7% |
| High School | 2,392 | 25.2% |
| College / Undergraduate | 1,306 | 13.7% |
| Graduate / Professional | 291 | 3.1% |
| Total | 9,505 | 100.0% |
School Enrollment by Age by Funding Source in Reynoldsburg
Out of a total of 9,505 students who are enrolled in schools in Reynoldsburg, 912 (9.6%) attend a private institution, while the remaining 8,593 (90.4%) are enrolled in public schools. The age group of 3 to 4 year olds has the highest likelihood of being enrolled in private schools, with 215 (51.2% in the age bracket) enrolled. Conversely, the age group of 5 to 9 year old has the lowest likelihood of being enrolled in a private school, with 2,361 (94.1% in the age bracket) attending a public institution.
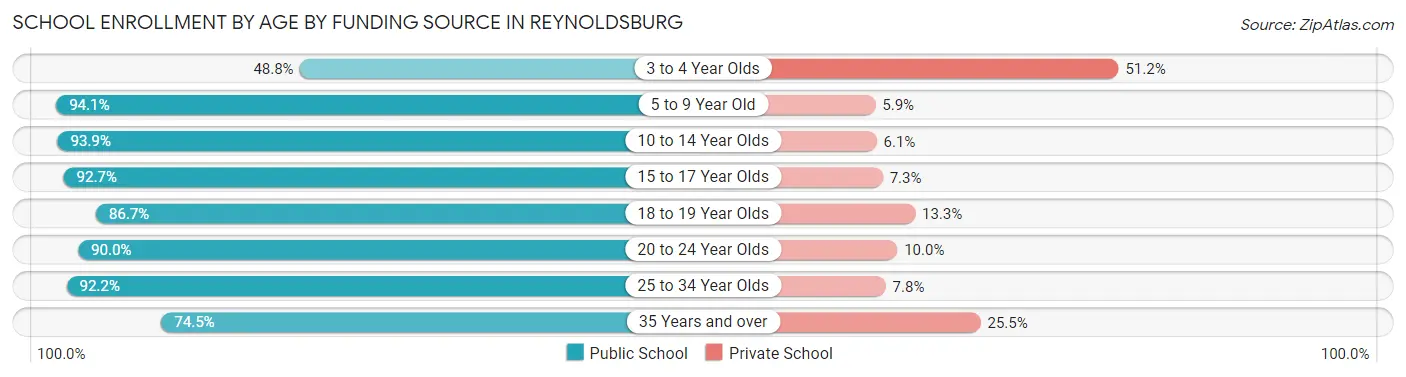
| Age Bracket | Public School | Private School |
| 3 to 4 Year Olds | 205 (48.8%) | 215 (51.2%) |
| 5 to 9 Year Old | 2,361 (94.1%) | 148 (5.9%) |
| 10 to 14 Year Olds | 2,726 (93.9%) | 178 (6.1%) |
| 15 to 17 Year Olds | 1,594 (92.7%) | 125 (7.3%) |
| 18 to 19 Year Olds | 450 (86.7%) | 69 (13.3%) |
| 20 to 24 Year Olds | 532 (90.0%) | 59 (10.0%) |
| 25 to 34 Year Olds | 495 (92.2%) | 42 (7.8%) |
| 35 Years and over | 228 (74.5%) | 78 (25.5%) |
| Total | 8,593 (90.4%) | 912 (9.6%) |
Educational Attainment by Field of Study in Reynoldsburg
Business (2,049 | 23.0%), science & technology (1,135 | 12.8%), education (985 | 11.1%), computers & mathematics (726 | 8.2%), and bio, nature & agricultural (479 | 5.4%) are the most common fields of study among 8,898 individuals in Reynoldsburg who have obtained a bachelor's degree or higher.
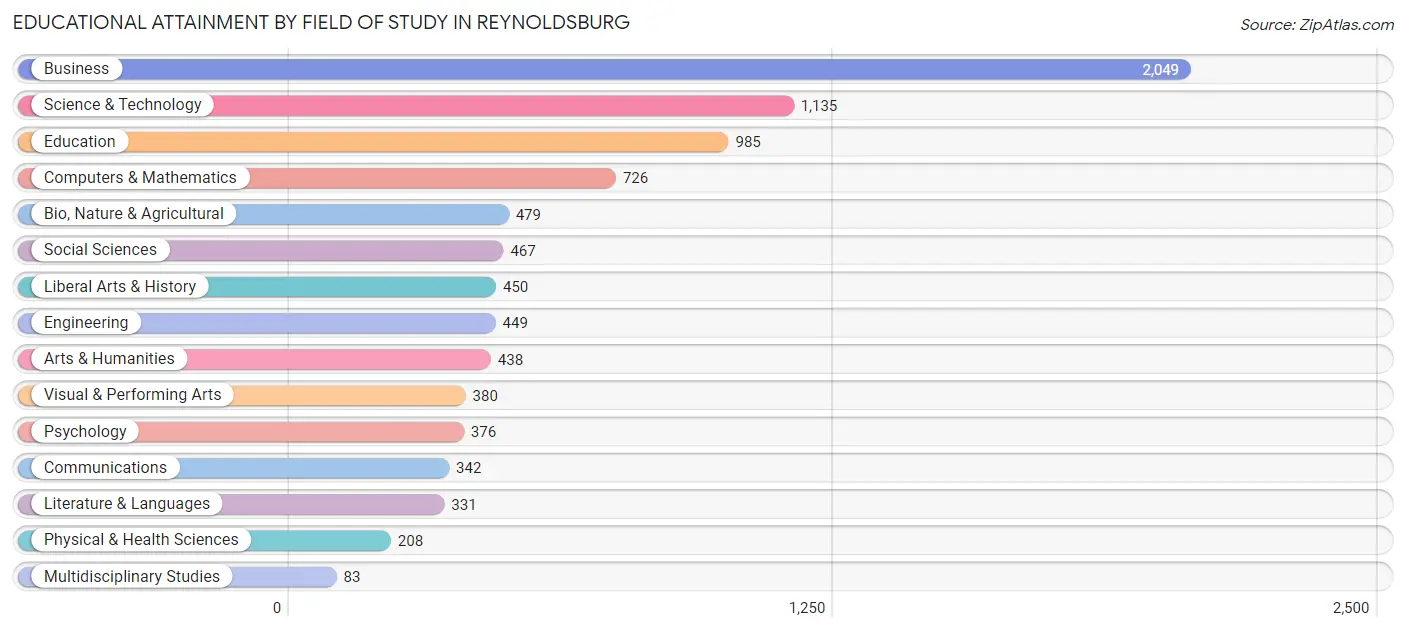
| Field of Study | # Graduates | % Graduates |
| Computers & Mathematics | 726 | 8.2% |
| Bio, Nature & Agricultural | 479 | 5.4% |
| Physical & Health Sciences | 208 | 2.3% |
| Psychology | 376 | 4.2% |
| Social Sciences | 467 | 5.2% |
| Engineering | 449 | 5.1% |
| Multidisciplinary Studies | 83 | 0.9% |
| Science & Technology | 1,135 | 12.8% |
| Business | 2,049 | 23.0% |
| Education | 985 | 11.1% |
| Literature & Languages | 331 | 3.7% |
| Liberal Arts & History | 450 | 5.1% |
| Visual & Performing Arts | 380 | 4.3% |
| Communications | 342 | 3.8% |
| Arts & Humanities | 438 | 4.9% |
| Total | 8,898 | 100.0% |
Transportation & Commute in Reynoldsburg
Vehicle Availability by Sex in Reynoldsburg
The most prevalent vehicle ownership categories in Reynoldsburg are males with 2 vehicles (4,045, accounting for 38.1%) and females with 2 vehicles (3,729, making up 42.1%).
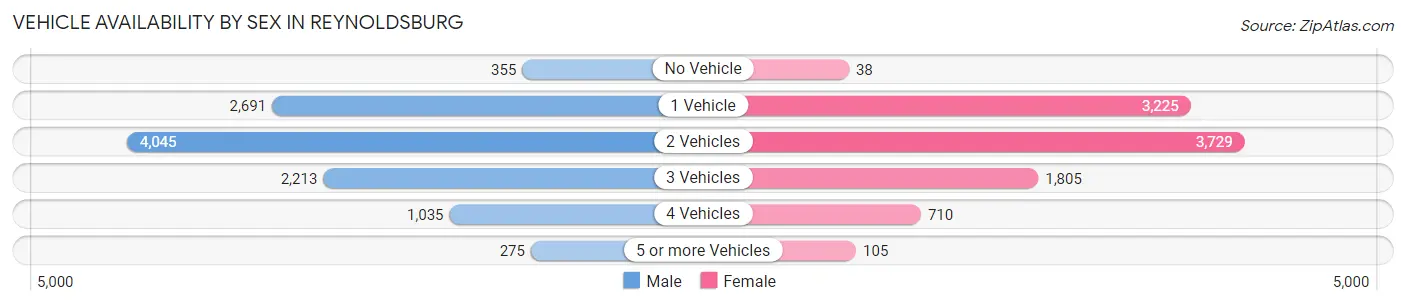
| Vehicles Available | Male | Female |
| No Vehicle | 355 (3.3%) | 38 (0.4%) |
| 1 Vehicle | 2,691 (25.4%) | 3,225 (33.6%) |
| 2 Vehicles | 4,045 (38.1%) | 3,729 (38.8%) |
| 3 Vehicles | 2,213 (20.8%) | 1,805 (18.8%) |
| 4 Vehicles | 1,035 (9.8%) | 710 (7.4%) |
| 5 or more Vehicles | 275 (2.6%) | 105 (1.1%) |
| Total | 10,614 (100.0%) | 9,612 (100.0%) |
Commute Time in Reynoldsburg
The most frequently occuring commute durations in Reynoldsburg are 30 to 34 minutes (3,283 commuters, 19.0%), 20 to 24 minutes (3,002 commuters, 17.4%), and 15 to 19 minutes (2,219 commuters, 12.9%).
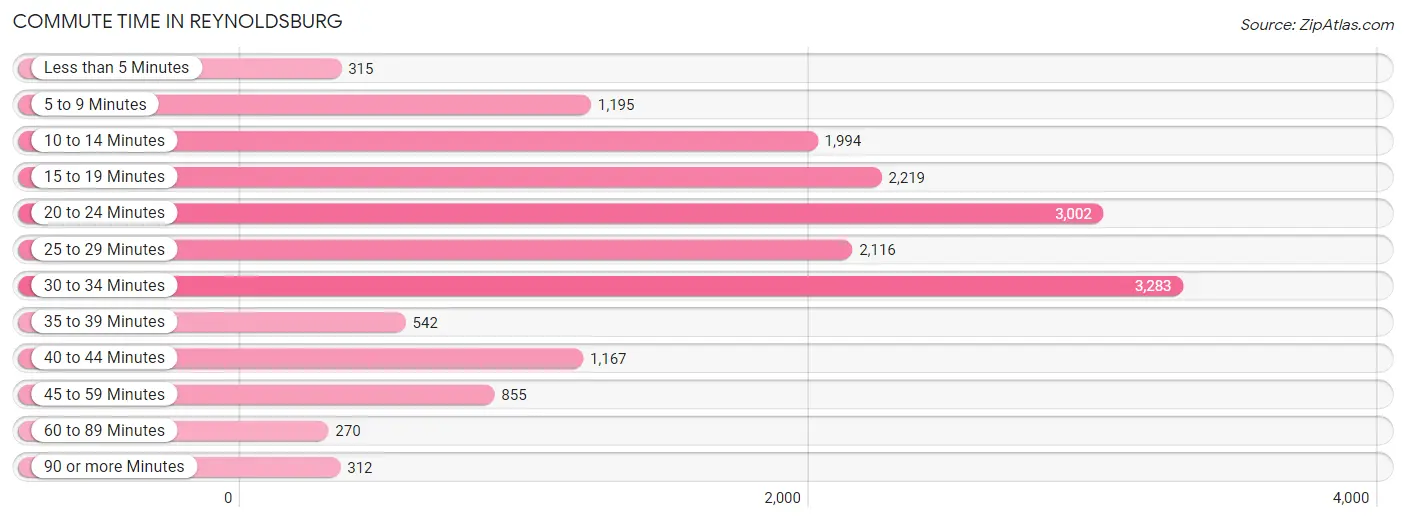
| Commute Time | # Commuters | % Commuters |
| Less than 5 Minutes | 315 | 1.8% |
| 5 to 9 Minutes | 1,195 | 6.9% |
| 10 to 14 Minutes | 1,994 | 11.6% |
| 15 to 19 Minutes | 2,219 | 12.9% |
| 20 to 24 Minutes | 3,002 | 17.4% |
| 25 to 29 Minutes | 2,116 | 12.2% |
| 30 to 34 Minutes | 3,283 | 19.0% |
| 35 to 39 Minutes | 542 | 3.1% |
| 40 to 44 Minutes | 1,167 | 6.8% |
| 45 to 59 Minutes | 855 | 5.0% |
| 60 to 89 Minutes | 270 | 1.6% |
| 90 or more Minutes | 312 | 1.8% |
Commute Time by Sex in Reynoldsburg
The most common commute times in Reynoldsburg are 30 to 34 minutes (2,319 commuters, 24.8%) for males and 20 to 24 minutes (1,700 commuters, 21.4%) for females.
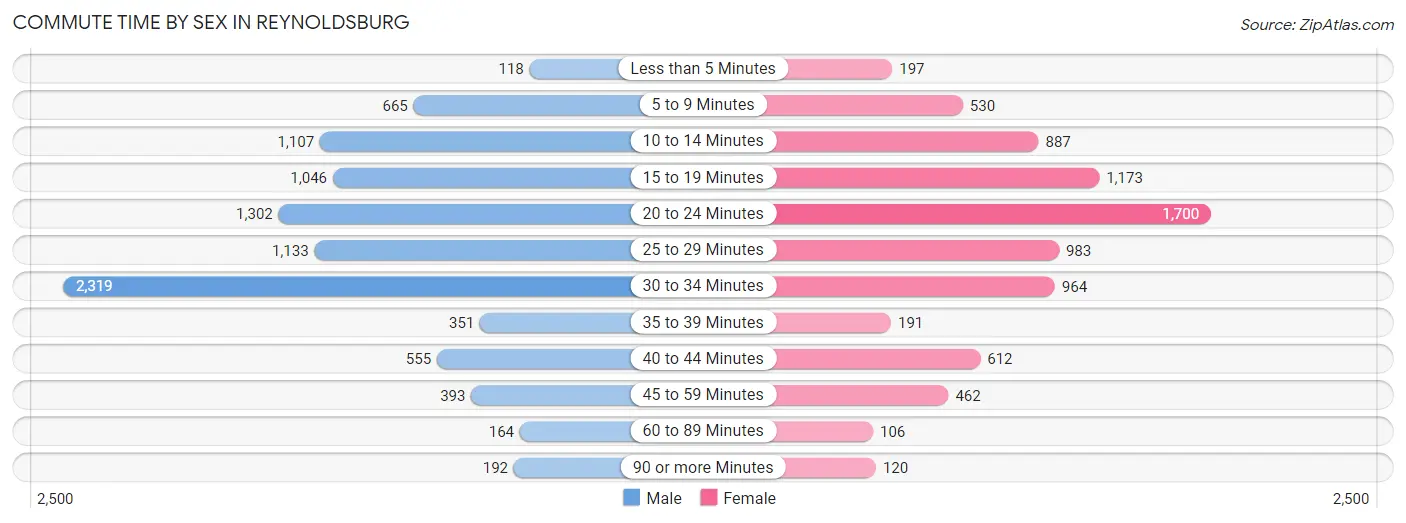
| Commute Time | Male | Female |
| Less than 5 Minutes | 118 (1.3%) | 197 (2.5%) |
| 5 to 9 Minutes | 665 (7.1%) | 530 (6.7%) |
| 10 to 14 Minutes | 1,107 (11.8%) | 887 (11.2%) |
| 15 to 19 Minutes | 1,046 (11.2%) | 1,173 (14.8%) |
| 20 to 24 Minutes | 1,302 (13.9%) | 1,700 (21.4%) |
| 25 to 29 Minutes | 1,133 (12.1%) | 983 (12.4%) |
| 30 to 34 Minutes | 2,319 (24.8%) | 964 (12.2%) |
| 35 to 39 Minutes | 351 (3.8%) | 191 (2.4%) |
| 40 to 44 Minutes | 555 (5.9%) | 612 (7.7%) |
| 45 to 59 Minutes | 393 (4.2%) | 462 (5.8%) |
| 60 to 89 Minutes | 164 (1.8%) | 106 (1.3%) |
| 90 or more Minutes | 192 (2.1%) | 120 (1.5%) |
Time of Departure to Work by Sex in Reynoldsburg
The most frequent times of departure to work in Reynoldsburg are 7:00 AM to 7:29 AM (1,315, 14.1%) for males and 7:00 AM to 7:29 AM (1,282, 16.2%) for females.
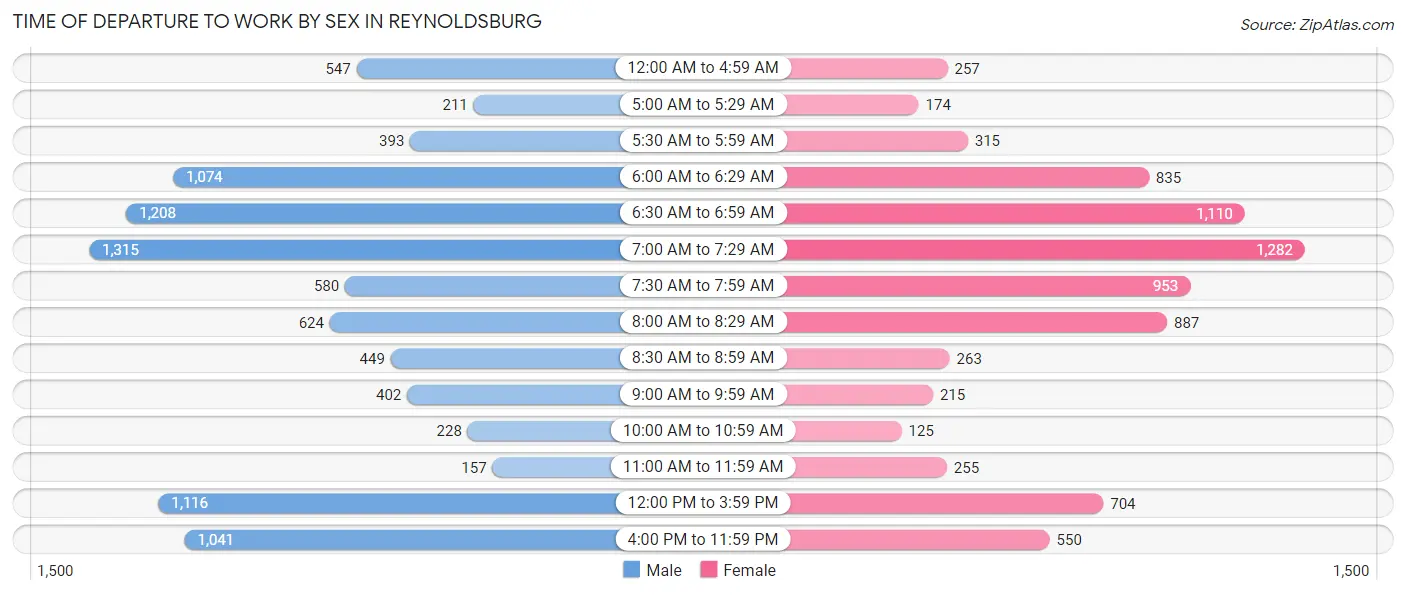
| Time of Departure | Male | Female |
| 12:00 AM to 4:59 AM | 547 (5.9%) | 257 (3.2%) |
| 5:00 AM to 5:29 AM | 211 (2.3%) | 174 (2.2%) |
| 5:30 AM to 5:59 AM | 393 (4.2%) | 315 (4.0%) |
| 6:00 AM to 6:29 AM | 1,074 (11.5%) | 835 (10.5%) |
| 6:30 AM to 6:59 AM | 1,208 (12.9%) | 1,110 (14.0%) |
| 7:00 AM to 7:29 AM | 1,315 (14.1%) | 1,282 (16.2%) |
| 7:30 AM to 7:59 AM | 580 (6.2%) | 953 (12.0%) |
| 8:00 AM to 8:29 AM | 624 (6.7%) | 887 (11.2%) |
| 8:30 AM to 8:59 AM | 449 (4.8%) | 263 (3.3%) |
| 9:00 AM to 9:59 AM | 402 (4.3%) | 215 (2.7%) |
| 10:00 AM to 10:59 AM | 228 (2.4%) | 125 (1.6%) |
| 11:00 AM to 11:59 AM | 157 (1.7%) | 255 (3.2%) |
| 12:00 PM to 3:59 PM | 1,116 (11.9%) | 704 (8.9%) |
| 4:00 PM to 11:59 PM | 1,041 (11.1%) | 550 (6.9%) |
| Total | 9,345 (100.0%) | 7,925 (100.0%) |
Housing Occupancy in Reynoldsburg
Occupancy by Ownership in Reynoldsburg
Of the total 16,577 dwellings in Reynoldsburg, owner-occupied units account for 10,439 (63.0%), while renter-occupied units make up 6,138 (37.0%).
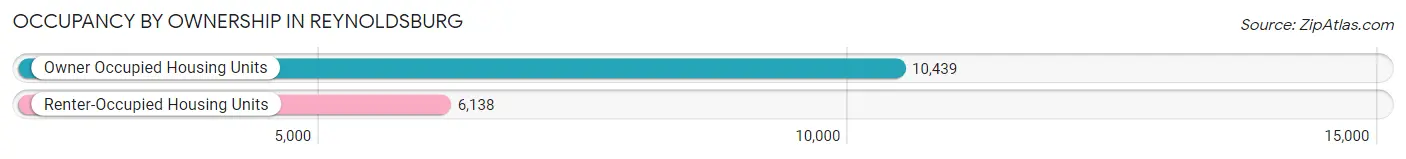
| Occupancy | # Housing Units | % Housing Units |
| Owner Occupied Housing Units | 10,439 | 63.0% |
| Renter-Occupied Housing Units | 6,138 | 37.0% |
| Total Occupied Housing Units | 16,577 | 100.0% |
Occupancy by Household Size in Reynoldsburg
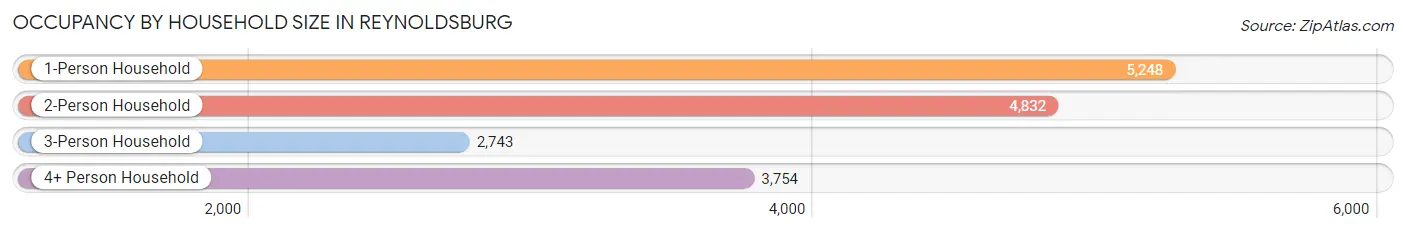
| Household Size | # Housing Units | % Housing Units |
| 1-Person Household | 5,248 | 31.7% |
| 2-Person Household | 4,832 | 29.1% |
| 3-Person Household | 2,743 | 16.6% |
| 4+ Person Household | 3,754 | 22.7% |
| Total Housing Units | 16,577 | 100.0% |
Occupancy by Ownership by Household Size in Reynoldsburg
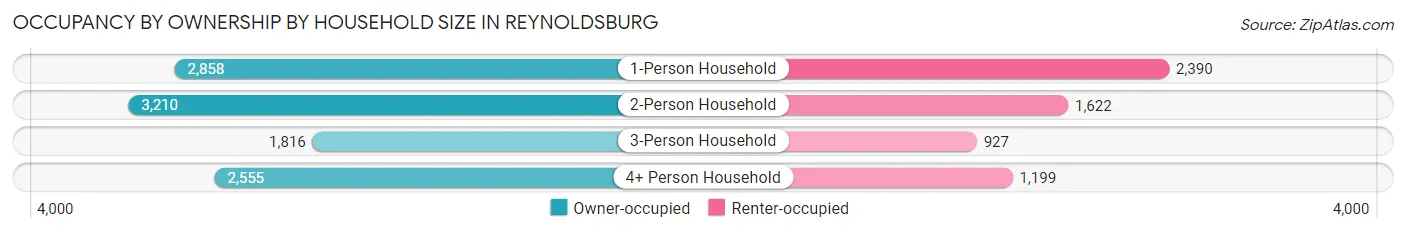
| Household Size | Owner-occupied | Renter-occupied |
| 1-Person Household | 2,858 (54.5%) | 2,390 (45.5%) |
| 2-Person Household | 3,210 (66.4%) | 1,622 (33.6%) |
| 3-Person Household | 1,816 (66.2%) | 927 (33.8%) |
| 4+ Person Household | 2,555 (68.1%) | 1,199 (31.9%) |
| Total Housing Units | 10,439 (63.0%) | 6,138 (37.0%) |
Occupancy by Educational Attainment in Reynoldsburg
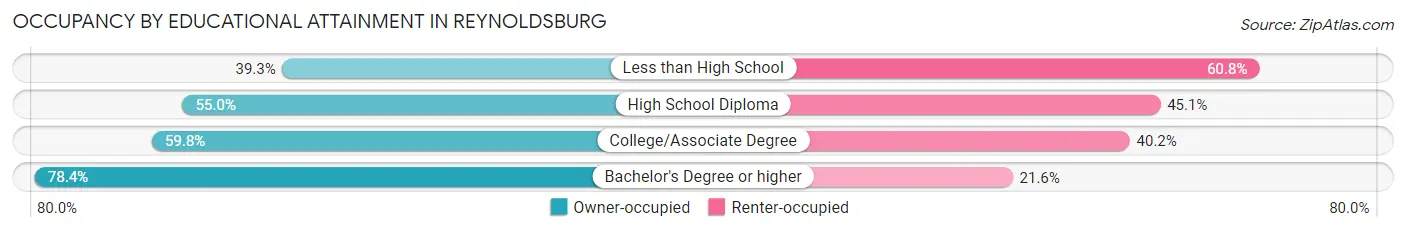
| Household Size | Owner-occupied | Renter-occupied |
| Less than High School | 524 (39.3%) | 811 (60.8%) |
| High School Diploma | 1,925 (54.9%) | 1,578 (45.1%) |
| College/Associate Degree | 3,894 (59.8%) | 2,618 (40.2%) |
| Bachelor's Degree or higher | 4,096 (78.4%) | 1,131 (21.6%) |
Occupancy by Age of Householder in Reynoldsburg
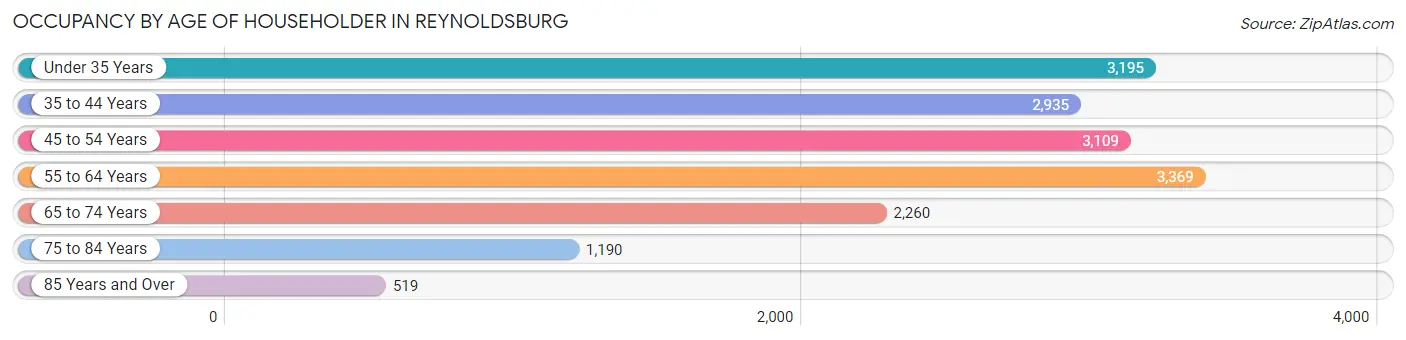
| Age Bracket | # Households | % Households |
| Under 35 Years | 3,195 | 19.3% |
| 35 to 44 Years | 2,935 | 17.7% |
| 45 to 54 Years | 3,109 | 18.8% |
| 55 to 64 Years | 3,369 | 20.3% |
| 65 to 74 Years | 2,260 | 13.6% |
| 75 to 84 Years | 1,190 | 7.2% |
| 85 Years and Over | 519 | 3.1% |
| Total | 16,577 | 100.0% |
Housing Finances in Reynoldsburg
Median Income by Occupancy in Reynoldsburg
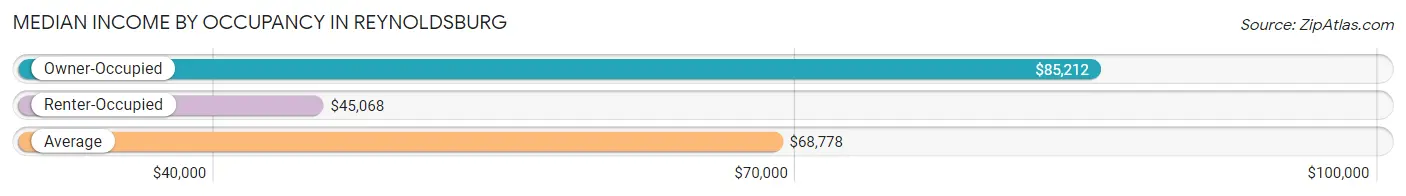
| Occupancy Type | # Households | Median Income |
| Owner-Occupied | 10,439 (63.0%) | $85,212 |
| Renter-Occupied | 6,138 (37.0%) | $45,068 |
| Average | 16,577 (100.0%) | $68,778 |
Occupancy by Householder Income Bracket in Reynoldsburg
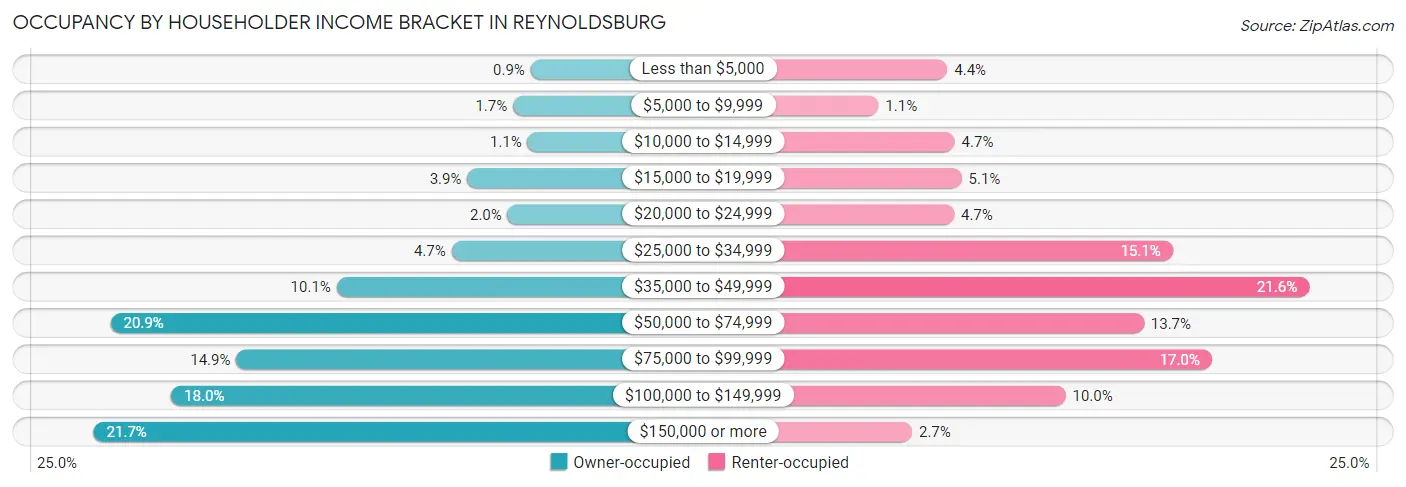
| Income Bracket | Owner-occupied | Renter-occupied |
| Less than $5,000 | 94 (0.9%) | 268 (4.4%) |
| $5,000 to $9,999 | 182 (1.7%) | 67 (1.1%) |
| $10,000 to $14,999 | 110 (1.1%) | 290 (4.7%) |
| $15,000 to $19,999 | 409 (3.9%) | 310 (5.1%) |
| $20,000 to $24,999 | 209 (2.0%) | 288 (4.7%) |
| $25,000 to $34,999 | 487 (4.7%) | 927 (15.1%) |
| $35,000 to $49,999 | 1,059 (10.1%) | 1,325 (21.6%) |
| $50,000 to $74,999 | 2,183 (20.9%) | 843 (13.7%) |
| $75,000 to $99,999 | 1,558 (14.9%) | 1,041 (17.0%) |
| $100,000 to $149,999 | 1,881 (18.0%) | 614 (10.0%) |
| $150,000 or more | 2,267 (21.7%) | 165 (2.7%) |
| Total | 10,439 (100.0%) | 6,138 (100.0%) |
Monthly Housing Cost Tiers in Reynoldsburg
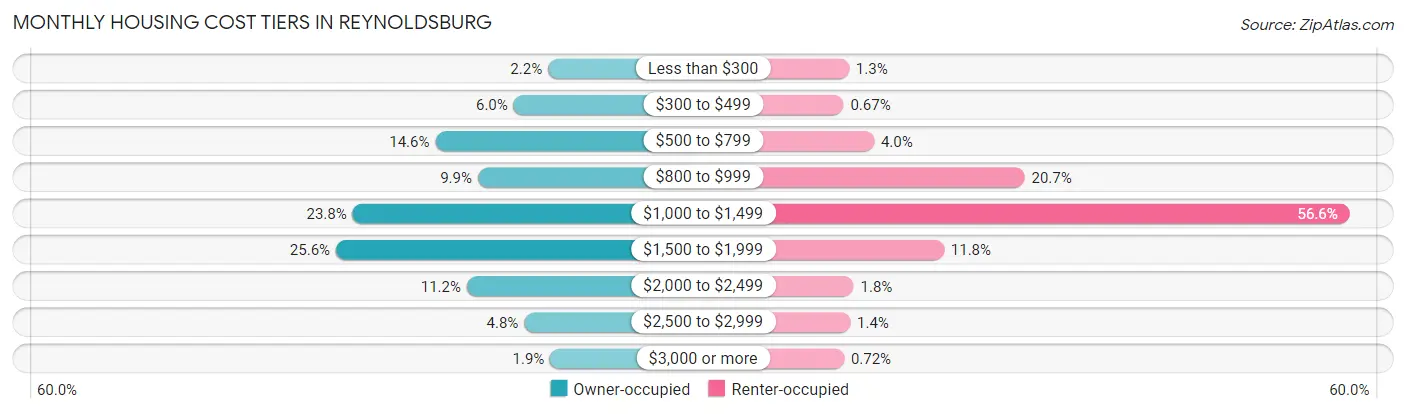
| Monthly Cost | Owner-occupied | Renter-occupied |
| Less than $300 | 228 (2.2%) | 78 (1.3%) |
| $300 to $499 | 624 (6.0%) | 41 (0.7%) |
| $500 to $799 | 1,527 (14.6%) | 248 (4.0%) |
| $800 to $999 | 1,037 (9.9%) | 1,269 (20.7%) |
| $1,000 to $1,499 | 2,481 (23.8%) | 3,473 (56.6%) |
| $1,500 to $1,999 | 2,673 (25.6%) | 722 (11.8%) |
| $2,000 to $2,499 | 1,164 (11.2%) | 110 (1.8%) |
| $2,500 to $2,999 | 502 (4.8%) | 86 (1.4%) |
| $3,000 or more | 203 (1.9%) | 44 (0.7%) |
| Total | 10,439 (100.0%) | 6,138 (100.0%) |
Physical Housing Characteristics in Reynoldsburg
Housing Structures in Reynoldsburg
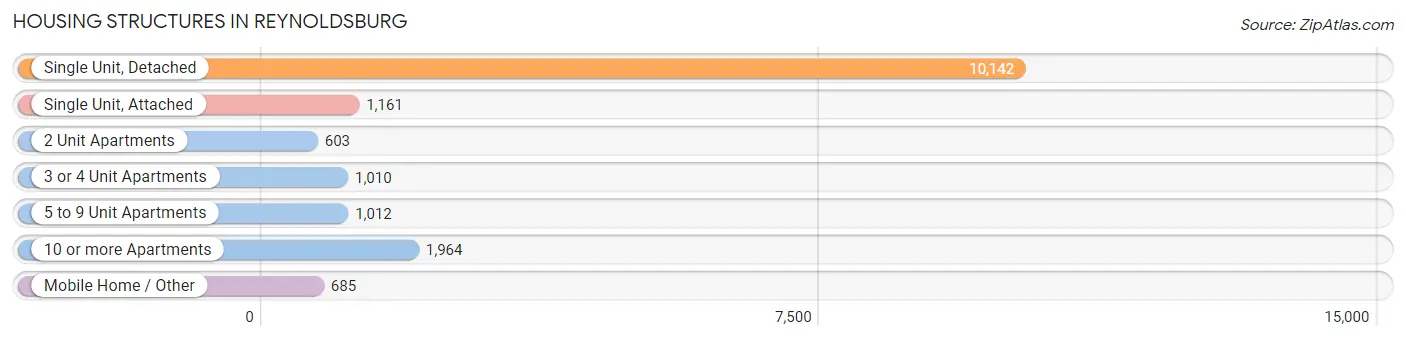
| Structure Type | # Housing Units | % Housing Units |
| Single Unit, Detached | 10,142 | 61.2% |
| Single Unit, Attached | 1,161 | 7.0% |
| 2 Unit Apartments | 603 | 3.6% |
| 3 or 4 Unit Apartments | 1,010 | 6.1% |
| 5 to 9 Unit Apartments | 1,012 | 6.1% |
| 10 or more Apartments | 1,964 | 11.8% |
| Mobile Home / Other | 685 | 4.1% |
| Total | 16,577 | 100.0% |
Housing Structures by Occupancy in Reynoldsburg
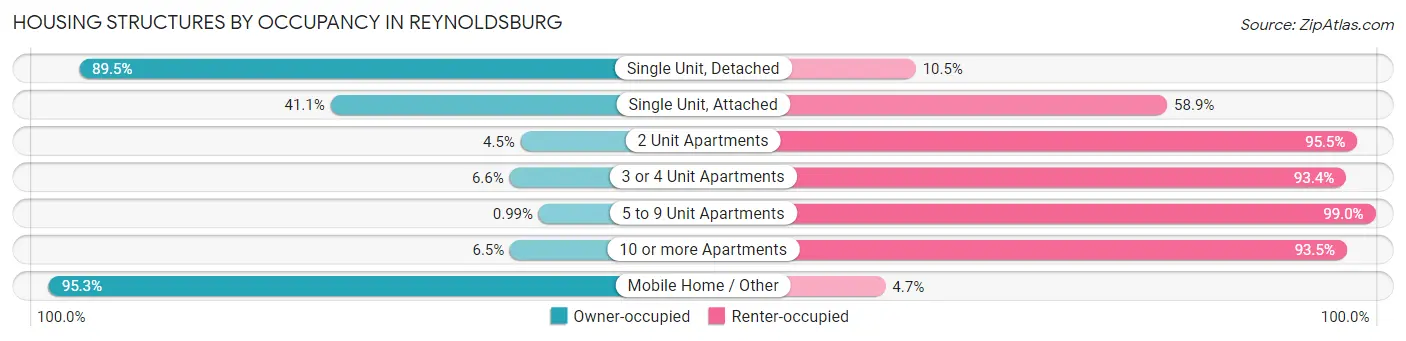
| Structure Type | Owner-occupied | Renter-occupied |
| Single Unit, Detached | 9,077 (89.5%) | 1,065 (10.5%) |
| Single Unit, Attached | 477 (41.1%) | 684 (58.9%) |
| 2 Unit Apartments | 27 (4.5%) | 576 (95.5%) |
| 3 or 4 Unit Apartments | 67 (6.6%) | 943 (93.4%) |
| 5 to 9 Unit Apartments | 10 (1.0%) | 1,002 (99.0%) |
| 10 or more Apartments | 128 (6.5%) | 1,836 (93.5%) |
| Mobile Home / Other | 653 (95.3%) | 32 (4.7%) |
| Total | 10,439 (63.0%) | 6,138 (37.0%) |
Housing Structures by Number of Rooms in Reynoldsburg
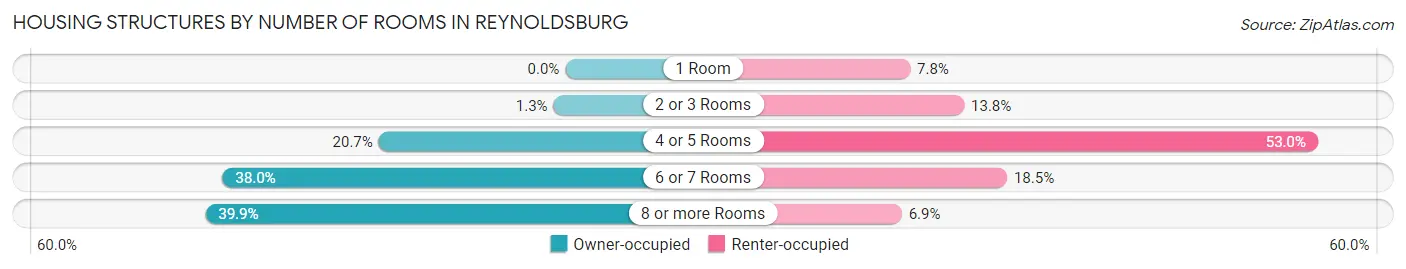
| Number of Rooms | Owner-occupied | Renter-occupied |
| 1 Room | 0 (0.0%) | 478 (7.8%) |
| 2 or 3 Rooms | 137 (1.3%) | 846 (13.8%) |
| 4 or 5 Rooms | 2,162 (20.7%) | 3,255 (53.0%) |
| 6 or 7 Rooms | 3,971 (38.0%) | 1,138 (18.5%) |
| 8 or more Rooms | 4,169 (39.9%) | 421 (6.9%) |
| Total | 10,439 (100.0%) | 6,138 (100.0%) |
Housing Structure by Heating Type in Reynoldsburg
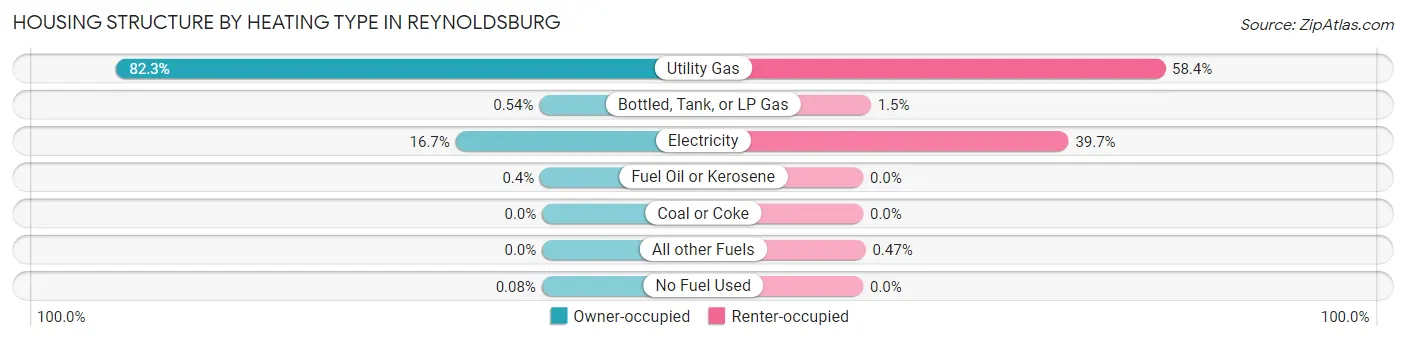
| Heating Type | Owner-occupied | Renter-occupied |
| Utility Gas | 8,587 (82.3%) | 3,582 (58.4%) |
| Bottled, Tank, or LP Gas | 56 (0.5%) | 91 (1.5%) |
| Electricity | 1,746 (16.7%) | 2,436 (39.7%) |
| Fuel Oil or Kerosene | 42 (0.4%) | 0 (0.0%) |
| Coal or Coke | 0 (0.0%) | 0 (0.0%) |
| All other Fuels | 0 (0.0%) | 29 (0.5%) |
| No Fuel Used | 8 (0.1%) | 0 (0.0%) |
| Total | 10,439 (100.0%) | 6,138 (100.0%) |
Household Vehicle Usage in Reynoldsburg
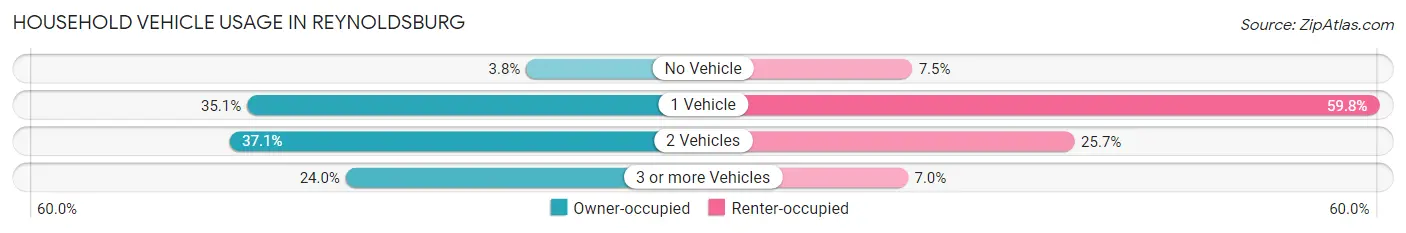
| Vehicles per Household | Owner-occupied | Renter-occupied |
| No Vehicle | 398 (3.8%) | 459 (7.5%) |
| 1 Vehicle | 3,662 (35.1%) | 3,673 (59.8%) |
| 2 Vehicles | 3,871 (37.1%) | 1,576 (25.7%) |
| 3 or more Vehicles | 2,508 (24.0%) | 430 (7.0%) |
| Total | 10,439 (100.0%) | 6,138 (100.0%) |
Real Estate & Mortgages in Reynoldsburg
Real Estate and Mortgage Overview in Reynoldsburg
| Characteristic | Without Mortgage | With Mortgage |
| Housing Units | 2,854 | 7,585 |
| Median Property Value | $198,100 | $222,000 |
| Median Household Income | $66,799 | $1,758 |
| Monthly Housing Costs | $633 | $203 |
| Real Estate Taxes | $3,488 | $133 |
Property Value by Mortgage Status in Reynoldsburg
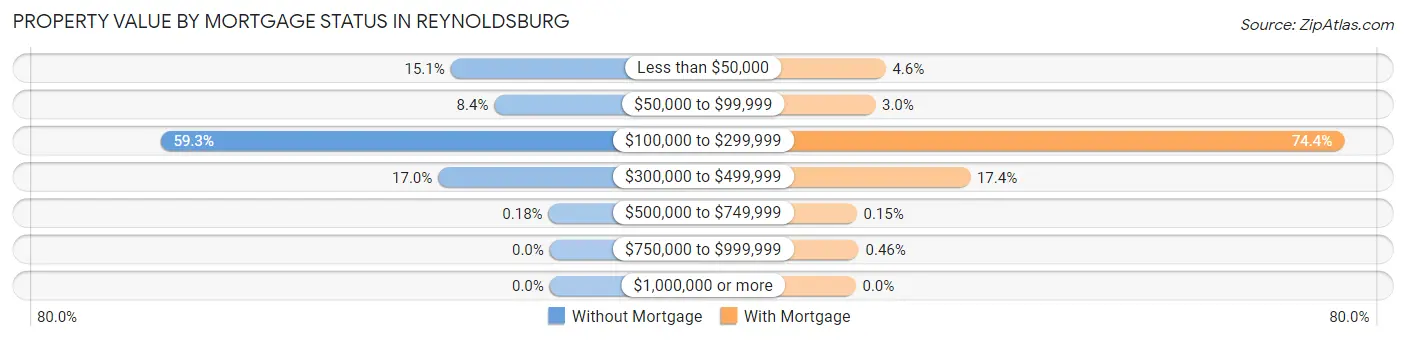
| Property Value | Without Mortgage | With Mortgage |
| Less than $50,000 | 431 (15.1%) | 346 (4.6%) |
| $50,000 to $99,999 | 241 (8.4%) | 225 (3.0%) |
| $100,000 to $299,999 | 1,692 (59.3%) | 5,645 (74.4%) |
| $300,000 to $499,999 | 485 (17.0%) | 1,323 (17.4%) |
| $500,000 to $749,999 | 5 (0.2%) | 11 (0.2%) |
| $750,000 to $999,999 | 0 (0.0%) | 35 (0.5%) |
| $1,000,000 or more | 0 (0.0%) | 0 (0.0%) |
| Total | 2,854 (100.0%) | 7,585 (100.0%) |
Household Income by Mortgage Status in Reynoldsburg
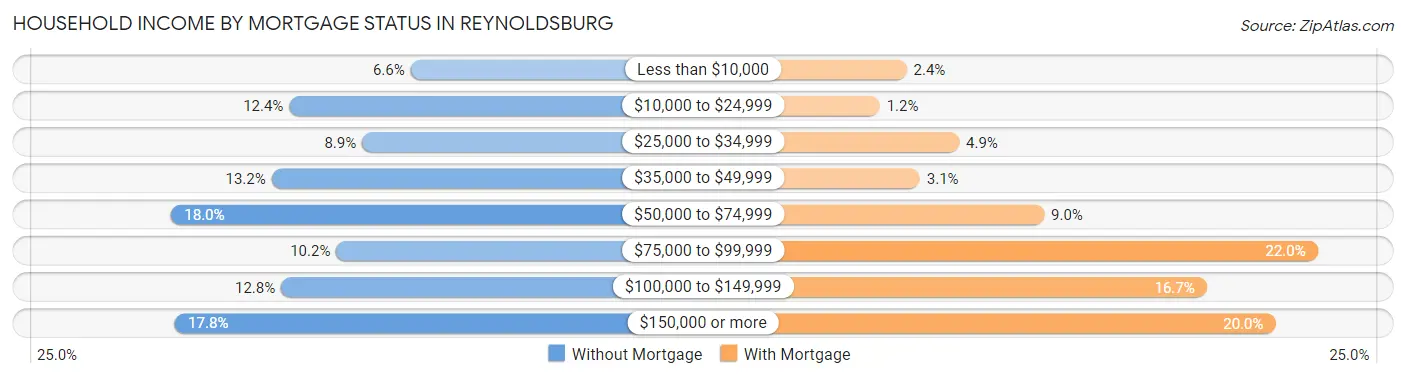
| Household Income | Without Mortgage | With Mortgage |
| Less than $10,000 | 189 (6.6%) | 184 (2.4%) |
| $10,000 to $24,999 | 354 (12.4%) | 87 (1.1%) |
| $25,000 to $34,999 | 255 (8.9%) | 374 (4.9%) |
| $35,000 to $49,999 | 378 (13.2%) | 232 (3.1%) |
| $50,000 to $74,999 | 514 (18.0%) | 681 (9.0%) |
| $75,000 to $99,999 | 290 (10.2%) | 1,669 (22.0%) |
| $100,000 to $149,999 | 365 (12.8%) | 1,268 (16.7%) |
| $150,000 or more | 509 (17.8%) | 1,516 (20.0%) |
| Total | 2,854 (100.0%) | 7,585 (100.0%) |
Property Value to Household Income Ratio in Reynoldsburg
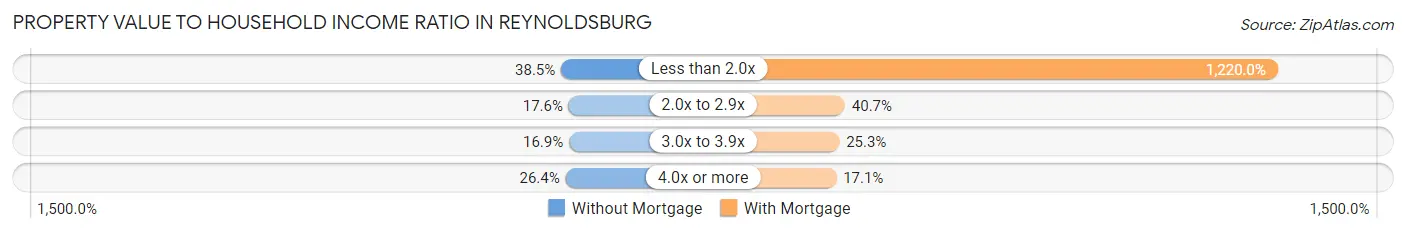
| Value-to-Income Ratio | Without Mortgage | With Mortgage |
| Less than 2.0x | 1,099 (38.5%) | 92,540 (1,220.0%) |
| 2.0x to 2.9x | 502 (17.6%) | 3,083 (40.6%) |
| 3.0x to 3.9x | 481 (16.9%) | 1,920 (25.3%) |
| 4.0x or more | 753 (26.4%) | 1,299 (17.1%) |
| Total | 2,854 (100.0%) | 7,585 (100.0%) |
Real Estate Taxes by Mortgage Status in Reynoldsburg
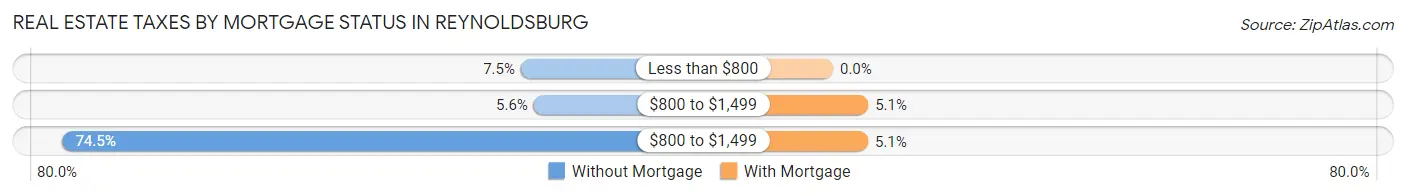
| Property Taxes | Without Mortgage | With Mortgage |
| Less than $800 | 214 (7.5%) | 0 (0.0%) |
| $800 to $1,499 | 160 (5.6%) | 390 (5.1%) |
| $800 to $1,499 | 2,125 (74.5%) | 387 (5.1%) |
| Total | 2,854 (100.0%) | 7,585 (100.0%) |
Health & Disability in Reynoldsburg
Health Insurance Coverage by Age in Reynoldsburg
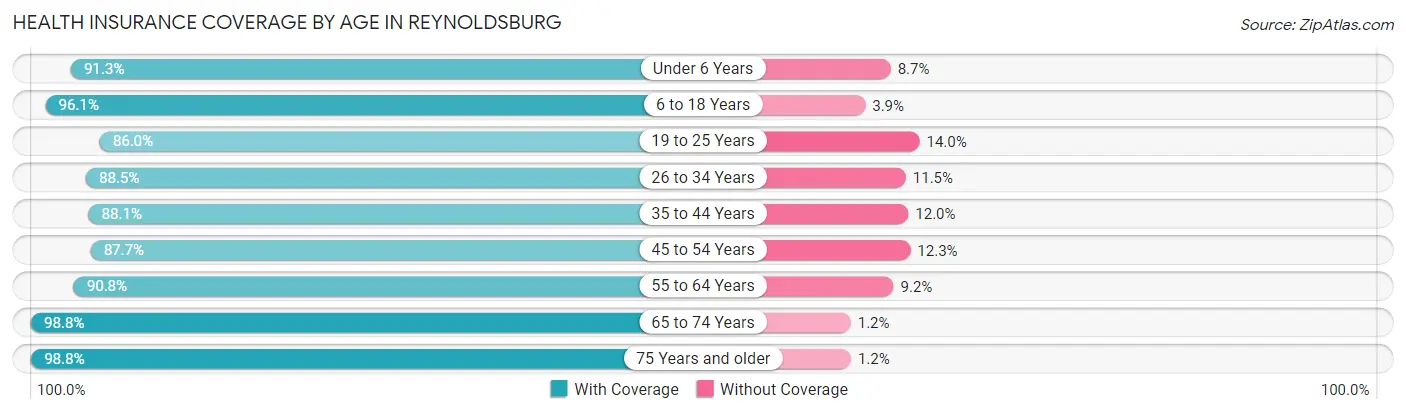
| Age Bracket | With Coverage | Without Coverage |
| Under 6 Years | 2,955 (91.3%) | 280 (8.7%) |
| 6 to 18 Years | 7,007 (96.1%) | 285 (3.9%) |
| 19 to 25 Years | 2,902 (86.0%) | 474 (14.0%) |
| 26 to 34 Years | 4,449 (88.5%) | 577 (11.5%) |
| 35 to 44 Years | 4,670 (88.0%) | 634 (11.9%) |
| 45 to 54 Years | 4,287 (87.7%) | 603 (12.3%) |
| 55 to 64 Years | 4,971 (90.8%) | 503 (9.2%) |
| 65 to 74 Years | 3,604 (98.8%) | 44 (1.2%) |
| 75 Years and older | 2,553 (98.8%) | 32 (1.2%) |
| Total | 37,398 (91.6%) | 3,432 (8.4%) |
Health Insurance Coverage by Citizenship Status in Reynoldsburg
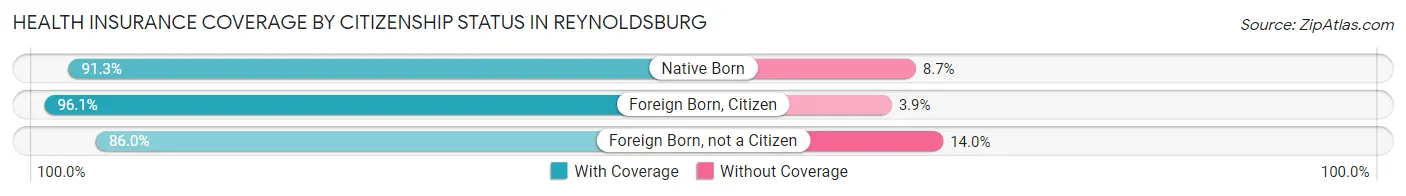
| Citizenship Status | With Coverage | Without Coverage |
| Native Born | 2,955 (91.3%) | 280 (8.7%) |
| Foreign Born, Citizen | 7,007 (96.1%) | 285 (3.9%) |
| Foreign Born, not a Citizen | 2,902 (86.0%) | 474 (14.0%) |
Health Insurance Coverage by Household Income in Reynoldsburg
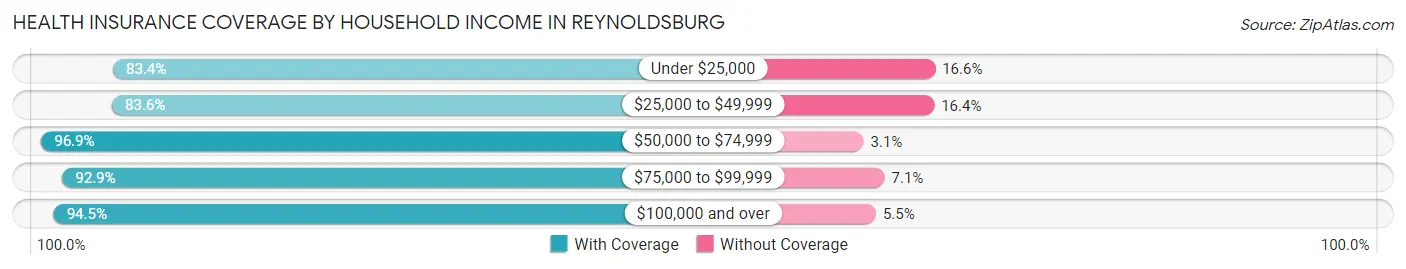
| Household Income | With Coverage | Without Coverage |
| Under $25,000 | 2,966 (83.4%) | 589 (16.6%) |
| $25,000 to $49,999 | 6,412 (83.6%) | 1,256 (16.4%) |
| $50,000 to $74,999 | 6,331 (96.9%) | 205 (3.1%) |
| $75,000 to $99,999 | 7,057 (92.9%) | 538 (7.1%) |
| $100,000 and over | 14,593 (94.5%) | 844 (5.5%) |
Public vs Private Health Insurance Coverage by Age in Reynoldsburg
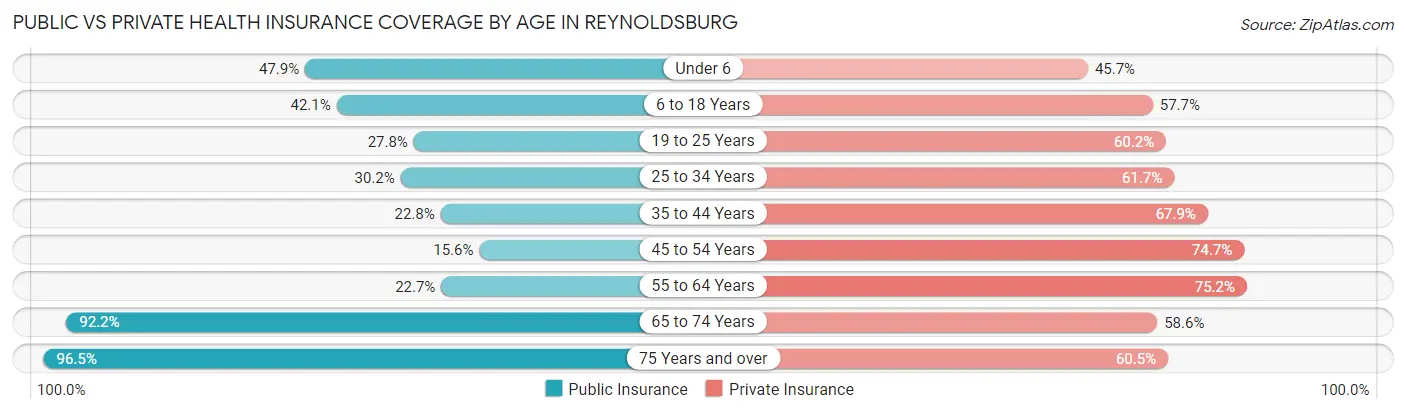
| Age Bracket | Public Insurance | Private Insurance |
| Under 6 | 1,551 (47.9%) | 1,478 (45.7%) |
| 6 to 18 Years | 3,069 (42.1%) | 4,210 (57.7%) |
| 19 to 25 Years | 938 (27.8%) | 2,032 (60.2%) |
| 25 to 34 Years | 1,519 (30.2%) | 3,100 (61.7%) |
| 35 to 44 Years | 1,209 (22.8%) | 3,602 (67.9%) |
| 45 to 54 Years | 763 (15.6%) | 3,652 (74.7%) |
| 55 to 64 Years | 1,241 (22.7%) | 4,115 (75.2%) |
| 65 to 74 Years | 3,365 (92.2%) | 2,136 (58.6%) |
| 75 Years and over | 2,494 (96.5%) | 1,565 (60.5%) |
| Total | 16,149 (39.6%) | 25,890 (63.4%) |
Disability Status by Sex by Age in Reynoldsburg
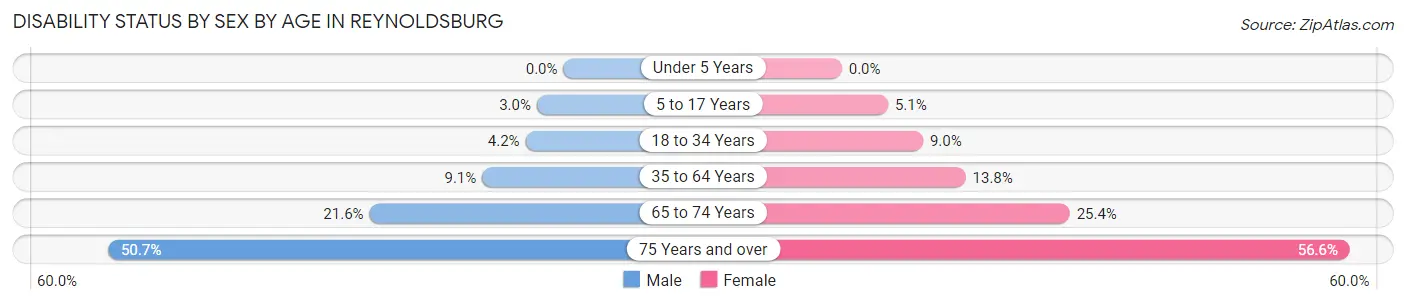
| Age Bracket | Male | Female |
| Under 5 Years | 0 (0.0%) | 0 (0.0%) |
| 5 to 17 Years | 107 (3.0%) | 199 (5.1%) |
| 18 to 34 Years | 189 (4.2%) | 388 (9.0%) |
| 35 to 64 Years | 699 (9.0%) | 1,096 (13.8%) |
| 65 to 74 Years | 330 (21.6%) | 538 (25.4%) |
| 75 Years and over | 462 (50.7%) | 947 (56.6%) |
Disability Class by Sex by Age in Reynoldsburg
Disability Class: Hearing Difficulty
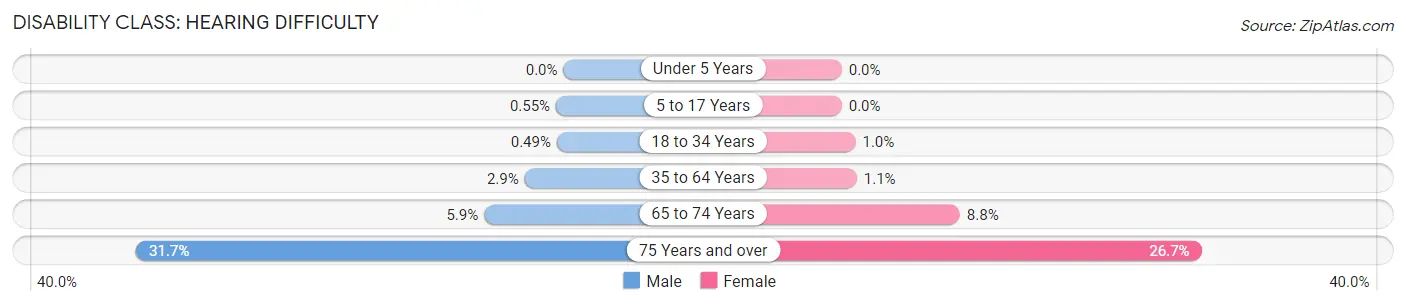
| Age Bracket | Male | Female |
| Under 5 Years | 0 (0.0%) | 0 (0.0%) |
| 5 to 17 Years | 20 (0.5%) | 0 (0.0%) |
| 18 to 34 Years | 22 (0.5%) | 44 (1.0%) |
| 35 to 64 Years | 222 (2.9%) | 89 (1.1%) |
| 65 to 74 Years | 90 (5.9%) | 186 (8.8%) |
| 75 Years and over | 289 (31.7%) | 447 (26.7%) |
Disability Class: Vision Difficulty
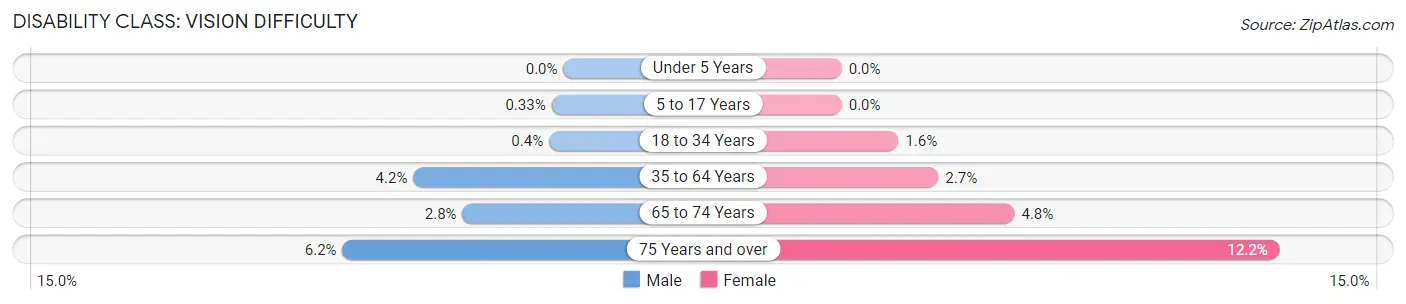
| Age Bracket | Male | Female |
| Under 5 Years | 0 (0.0%) | 0 (0.0%) |
| 5 to 17 Years | 12 (0.3%) | 0 (0.0%) |
| 18 to 34 Years | 18 (0.4%) | 68 (1.6%) |
| 35 to 64 Years | 323 (4.2%) | 214 (2.7%) |
| 65 to 74 Years | 43 (2.8%) | 102 (4.8%) |
| 75 Years and over | 56 (6.1%) | 204 (12.2%) |
Disability Class: Cognitive Difficulty
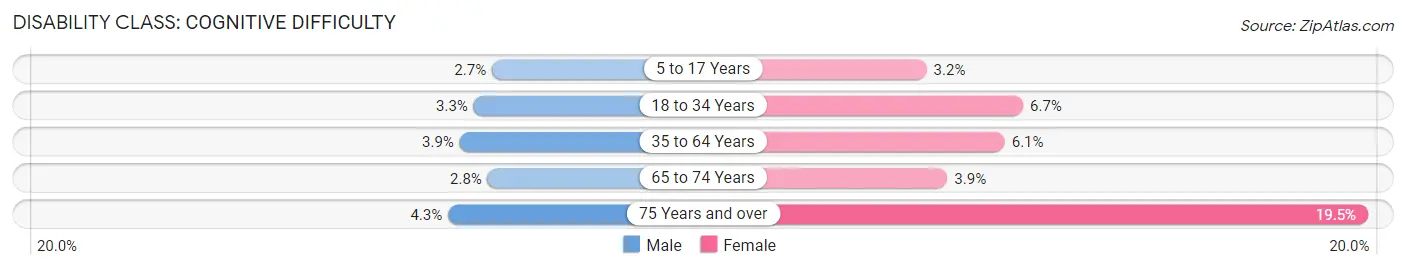
| Age Bracket | Male | Female |
| 5 to 17 Years | 96 (2.6%) | 122 (3.2%) |
| 18 to 34 Years | 149 (3.3%) | 289 (6.7%) |
| 35 to 64 Years | 297 (3.8%) | 481 (6.0%) |
| 65 to 74 Years | 43 (2.8%) | 83 (3.9%) |
| 75 Years and over | 39 (4.3%) | 327 (19.5%) |
Disability Class: Ambulatory Difficulty
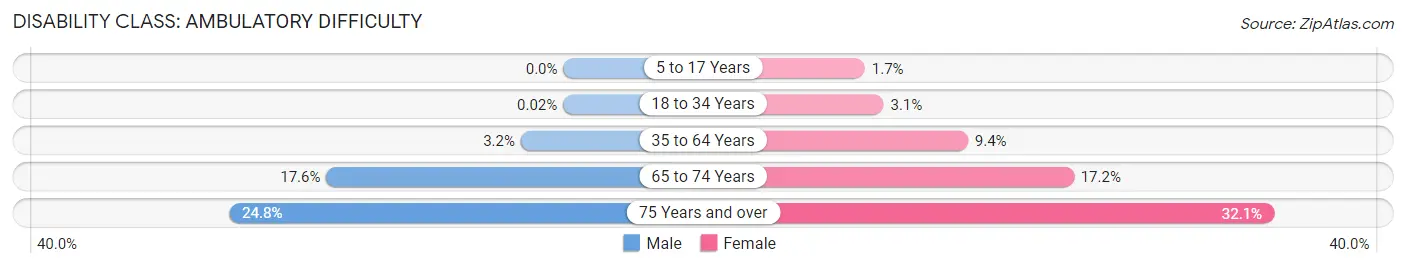
| Age Bracket | Male | Female |
| 5 to 17 Years | 0 (0.0%) | 66 (1.7%) |
| 18 to 34 Years | 1 (0.0%) | 133 (3.1%) |
| 35 to 64 Years | 244 (3.2%) | 744 (9.4%) |
| 65 to 74 Years | 269 (17.6%) | 365 (17.2%) |
| 75 Years and over | 226 (24.8%) | 537 (32.1%) |
Disability Class: Self-Care Difficulty
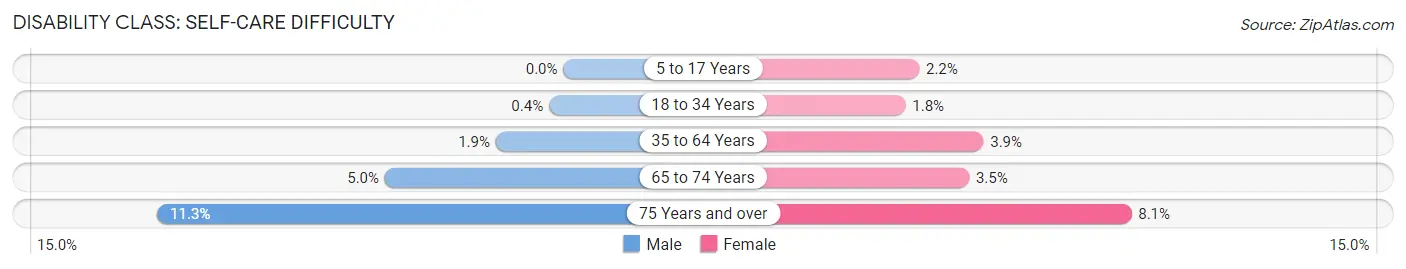
| Age Bracket | Male | Female |
| 5 to 17 Years | 0 (0.0%) | 83 (2.1%) |
| 18 to 34 Years | 18 (0.4%) | 76 (1.8%) |
| 35 to 64 Years | 145 (1.9%) | 313 (3.9%) |
| 65 to 74 Years | 76 (5.0%) | 75 (3.5%) |
| 75 Years and over | 103 (11.3%) | 135 (8.1%) |
Technology Access in Reynoldsburg
Computing Device Access in Reynoldsburg
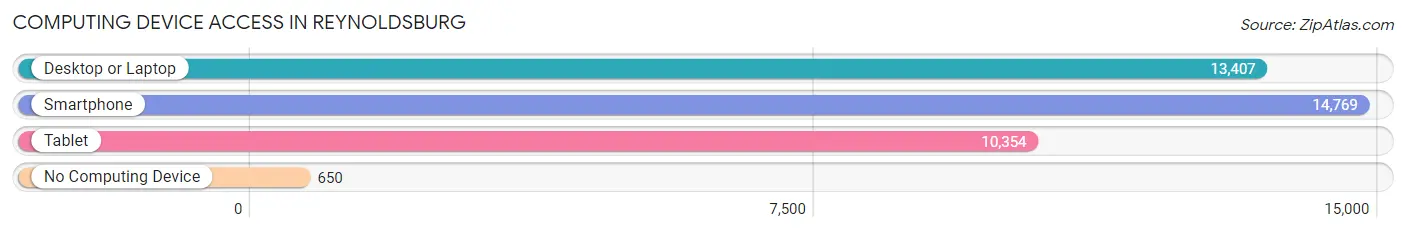
| Device Type | # Households | % Households |
| Desktop or Laptop | 13,407 | 80.9% |
| Smartphone | 14,769 | 89.1% |
| Tablet | 10,354 | 62.5% |
| No Computing Device | 650 | 3.9% |
| Total | 16,577 | 100.0% |
Internet Access in Reynoldsburg
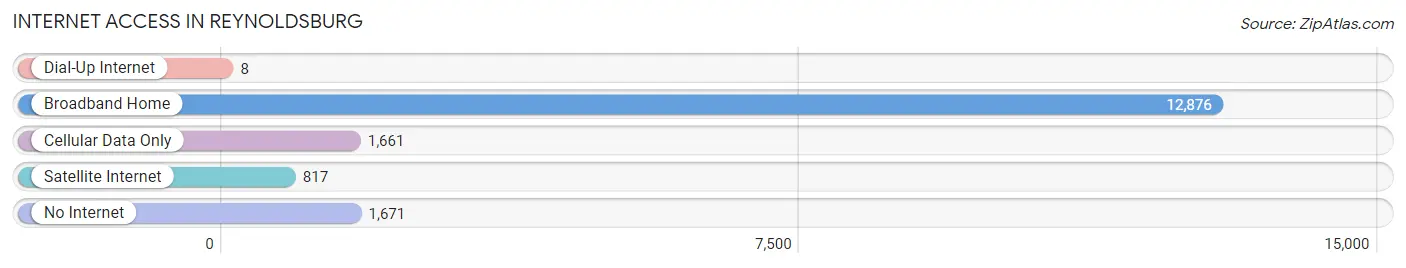
| Internet Type | # Households | % Households |
| Dial-Up Internet | 8 | 0.1% |
| Broadband Home | 12,876 | 77.7% |
| Cellular Data Only | 1,661 | 10.0% |
| Satellite Internet | 817 | 4.9% |
| No Internet | 1,671 | 10.1% |
| Total | 16,577 | 100.0% |
Reynoldsburg Summary
Reynoldsburg, Ohio is a city located in Franklin County, Ohio, United States. It is a suburb of Columbus, the state capital and largest city in Ohio. The population of Reynoldsburg was 35,893 at the 2010 census, making it the 15th largest city in the state.
History
Reynoldsburg was founded in 1831 by John and Sarah Reynolds, who had moved to the area from Pennsylvania. The city was named after the Reynolds family, and the first post office was established in 1832. The city was incorporated in 1838, and the first mayor was elected in 1839.
In the late 19th century, the city was a major center for the production of bricks, and the city's brickyards supplied bricks for many of the buildings in Columbus. The city also had a large number of factories, including a glass factory, a paper mill, and a canning factory.
Geography
Reynoldsburg is located at 39°56'N 82°48'W (39.933, -82.800). According to the United States Census Bureau, the city has a total area of 11.2 square miles (29.0 km2), of which 11.1 square miles (28.7 km2) is land and 0.1 square miles (0.3 km2) is water.
Economy
Reynoldsburg is home to a variety of businesses, including manufacturing, retail, and service industries. The city is home to several large employers, including Honda of America Manufacturing, Inc., which has a large manufacturing plant in the city. Other major employers include the Ohio State University Wexner Medical Center, OhioHealth, and the Ohio Department of Transportation.
Demographics
As of the 2010 census, there were 35,893 people, 14,845 households, and 9,845 families residing in the city. The population density was 3,231.2 people per square mile (1,245.3/km2). There were 15,845 housing units at an average density of 1,423.2 per square mile (549.3/km2). The racial makeup of the city was 75.2% White, 16.3% African American, 0.3% Native American, 3.2% Asian, 0.1% Pacific Islander, 2.2% from other races, and 2.9% from two or more races. Hispanic or Latino of any race were 5.2% of the population.
The median income for a household in the city was $50,945, and the median income for a family was $60,945. Males had a median income of $41,945 versus $30,945 for females. The per capita income for the city was $24,945. About 5.2% of families and 7.2% of the population were below the poverty line, including 9.2% of those under age 18 and 5.2% of those age 65 or over.
Common Questions
What is the Total Population of Reynoldsburg?
Total Population of Reynoldsburg is 40,926.
What is the Total Male Population of Reynoldsburg?
Total Male Population of Reynoldsburg is 19,811.
What is the Total Female Population of Reynoldsburg?
Total Female Population of Reynoldsburg is 21,115.
What is the Ratio of Males per 100 Females in Reynoldsburg?
There are 93.82 Males per 100 Females in Reynoldsburg.
What is the Ratio of Females per 100 Males in Reynoldsburg?
There are 106.58 Females per 100 Males in Reynoldsburg.
What is the Median Population Age in Reynoldsburg?
Median Population Age in Reynoldsburg is 37.6 Years.
What is the Average Family Size in Reynoldsburg
Average Family Size in Reynoldsburg is 3.1 People.
What is the Average Household Size in Reynoldsburg
Average Household Size in Reynoldsburg is 2.5 People.
What is Per Capita Income in Reynoldsburg?
Per Capita income in Reynoldsburg is $35,735.
What is the Median Family Income in Reynoldsburg?
Median Family Income in Reynoldsburg is $87,719.
What is the Median Household income in Reynoldsburg?
Median Household Income in Reynoldsburg is $68,778.
What is Income or Wage Gap in Reynoldsburg?
Income or Wage Gap in Reynoldsburg is 12.4%.
Women in Reynoldsburg earn 87.6 cents for every dollar earned by a man.
What is Family Income Deficit in Reynoldsburg?
Family Income Deficit in Reynoldsburg is $10,144.
Families that are below poverty line in Reynoldsburg earn $10,144 less on average than the poverty threshold level.
What is Inequality or Gini Index in Reynoldsburg?
Inequality or Gini Index in Reynoldsburg is 0.41.
How Large is the Labor Force in Reynoldsburg?
There are 21,606 People in the Labor Forcein in Reynoldsburg.
What is the Percentage of People in the Labor Force in Reynoldsburg?
67.7% of People are in the Labor Force in Reynoldsburg.
What is the Unemployment Rate in Reynoldsburg?
Unemployment Rate in Reynoldsburg is 5.4%.