Cities with the Highest Percentage of Population Employed in Education Instruction & Library in Ohio
RELATED REPORTS & OPTIONS
Education Instruction & Library
Ohio
Compare Cities
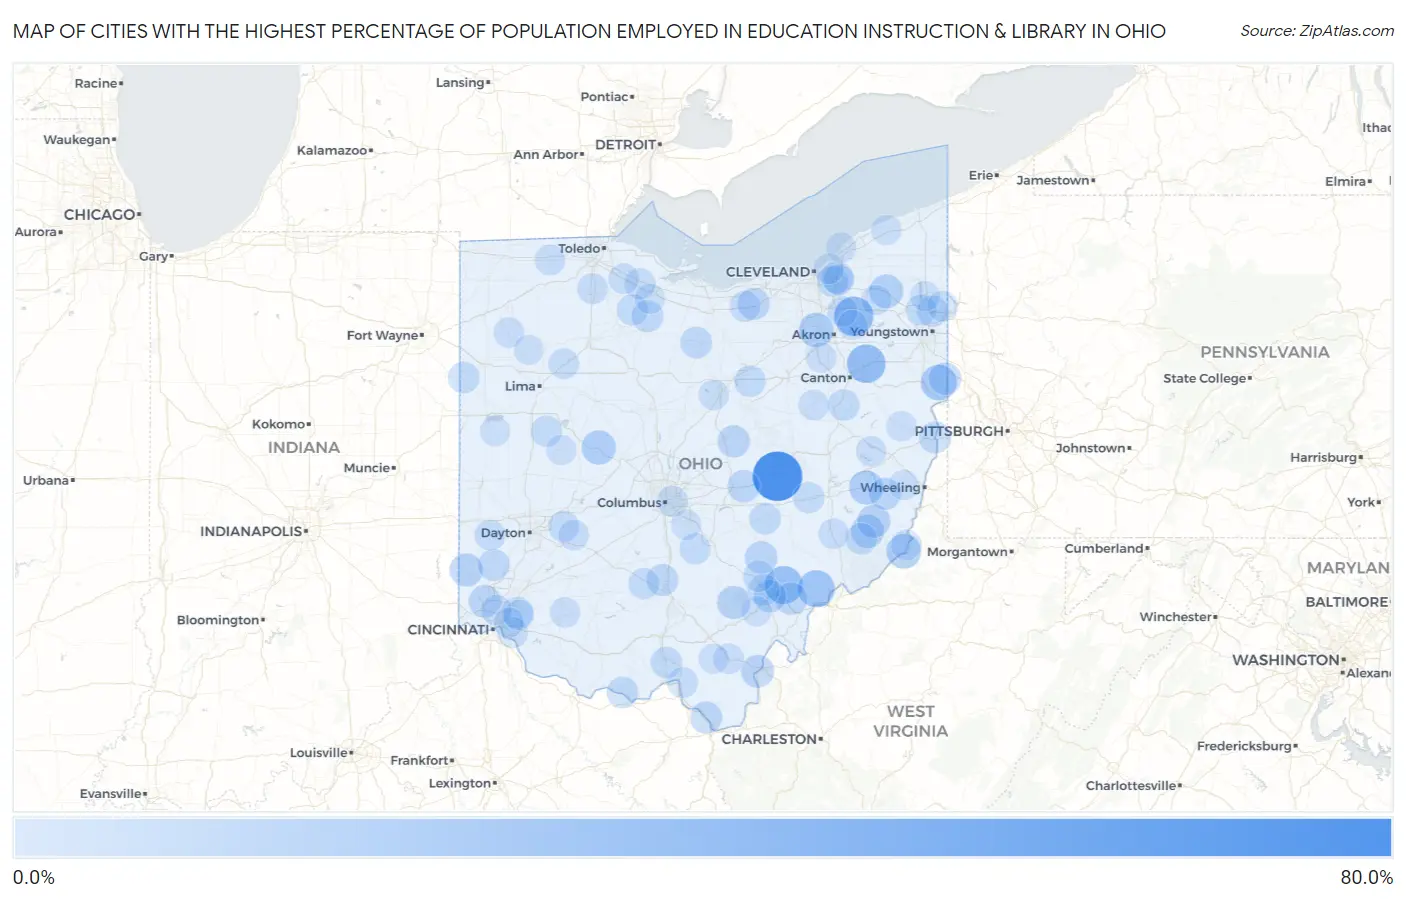
Map of Cities with the Highest Percentage of Population Employed in Education Instruction & Library in Ohio
0.0%
80.0%
Cities with the Highest Percentage of Population Employed in Education Instruction & Library in Ohio
| City | % Employed | vs State | vs National | |
| 1. | Trinway | 69.6% | 5.7%(+64.0)#1 | 6.2%(+63.4)#33 |
| 2. | Sugar Bush Knolls | 37.7% | 5.7%(+32.1)#2 | 6.2%(+31.6)#191 |
| 3. | Harrisburg | 35.2% | 5.7%(+29.6)#3 | 6.2%(+29.1)#238 |
| 4. | Amesville | 33.3% | 5.7%(+27.7)#4 | 6.2%(+27.1)#260 |
| 5. | Vincent | 30.7% | 5.7%(+25.0)#5 | 6.2%(+24.5)#318 |
| 6. | Madison Place | 26.9% | 5.7%(+21.2)#6 | 6.2%(+20.7)#430 |
| 7. | Lake Tomahawk | 26.6% | 5.7%(+20.9)#7 | 6.2%(+20.4)#440 |
| 8. | Sardis | 23.6% | 5.7%(+17.9)#8 | 6.2%(+17.4)#571 |
| 9. | Pigeon Creek | 23.0% | 5.7%(+17.4)#9 | 6.2%(+16.9)#611 |
| 10. | Kingsville | 23.0% | 5.7%(+17.4)#10 | 6.2%(+16.8)#612 |
| 11. | East Liberty | 22.2% | 5.7%(+16.6)#11 | 6.2%(+16.0)#669 |
| 12. | Fairview | 22.2% | 5.7%(+16.6)#12 | 6.2%(+16.0)#671 |
| 13. | Bolton | 21.8% | 5.7%(+16.1)#13 | 6.2%(+15.6)#710 |
| 14. | Parkman | 21.2% | 5.7%(+15.6)#14 | 6.2%(+15.1)#742 |
| 15. | Reno Beach | 20.7% | 5.7%(+15.1)#15 | 6.2%(+14.6)#780 |
| 16. | Zaleski | 19.6% | 5.7%(+13.9)#16 | 6.2%(+13.4)#895 |
| 17. | Oxford | 19.4% | 5.7%(+13.8)#17 | 6.2%(+13.2)#920 |
| 18. | Lewisville | 19.1% | 5.7%(+13.4)#18 | 6.2%(+12.9)#952 |
| 19. | Miltonsburg | 19.0% | 5.7%(+13.4)#19 | 6.2%(+12.9)#965 |
| 20. | Saybrook-On-The-Lake | 18.4% | 5.7%(+12.7)#20 | 6.2%(+12.2)#1,047 |
| 21. | Gallipolis | 18.1% | 5.7%(+12.4)#21 | 6.2%(+11.9)#1,073 |
| 22. | Stewart | 17.9% | 5.7%(+12.2)#22 | 6.2%(+11.7)#1,107 |
| 23. | Negley | 17.6% | 5.7%(+11.9)#23 | 6.2%(+11.4)#1,146 |
| 24. | Hemlock | 17.4% | 5.7%(+11.7)#24 | 6.2%(+11.2)#1,177 |
| 25. | Athens | 17.3% | 5.7%(+11.6)#25 | 6.2%(+11.1)#1,192 |
| 26. | Marne | 17.1% | 5.7%(+11.5)#26 | 6.2%(+10.9)#1,226 |
| 27. | Pleasant Run | 17.1% | 5.7%(+11.5)#27 | 6.2%(+10.9)#1,230 |
| 28. | Gambier | 16.9% | 5.7%(+11.3)#28 | 6.2%(+10.7)#1,269 |
| 29. | Oberlin | 16.5% | 5.7%(+10.8)#29 | 6.2%(+10.3)#1,368 |
| 30. | Bethesda | 16.2% | 5.7%(+10.6)#30 | 6.2%(+10.0)#1,417 |
| 31. | Coal Grove | 16.1% | 5.7%(+10.5)#31 | 6.2%(+9.92)#1,443 |
| 32. | Pottery Addition | 15.6% | 5.7%(+9.93)#32 | 6.2%(+9.40)#1,565 |
| 33. | Andersonville | 15.5% | 5.7%(+9.88)#33 | 6.2%(+9.34)#1,577 |
| 34. | Woodmere | 15.5% | 5.7%(+9.83)#34 | 6.2%(+9.30)#1,594 |
| 35. | Jacksonburg | 15.4% | 5.7%(+9.73)#35 | 6.2%(+9.20)#1,625 |
| 36. | Celeryville | 15.2% | 5.7%(+9.57)#36 | 6.2%(+9.03)#1,665 |
| 37. | Fort Seneca | 15.0% | 5.7%(+9.35)#37 | 6.2%(+8.82)#1,712 |
| 38. | Zoar | 14.9% | 5.7%(+9.20)#38 | 6.2%(+8.67)#1,751 |
| 39. | Wren | 14.6% | 5.7%(+8.95)#39 | 6.2%(+8.42)#1,812 |
| 40. | The Plains | 14.5% | 5.7%(+8.87)#40 | 6.2%(+8.34)#1,832 |
| 41. | Hayesville | 14.4% | 5.7%(+8.78)#41 | 6.2%(+8.25)#1,859 |
| 42. | Ridgewood | 14.3% | 5.7%(+8.63)#42 | 6.2%(+8.10)#1,903 |
| 43. | Miamiville | 14.3% | 5.7%(+8.63)#43 | 6.2%(+8.10)#1,919 |
| 44. | East Fultonham | 14.3% | 5.7%(+8.63)#44 | 6.2%(+8.10)#1,921 |
| 45. | Stafford | 14.3% | 5.7%(+8.63)#45 | 6.2%(+8.10)#1,927 |
| 46. | Rome Stout | 14.3% | 5.7%(+8.63)#46 | 6.2%(+8.10)#1,937 |
| 47. | Lucasville | 14.1% | 5.7%(+8.44)#47 | 6.2%(+7.91)#2,004 |
| 48. | Buchtel | 13.8% | 5.7%(+8.19)#48 | 6.2%(+7.66)#2,078 |
| 49. | Amanda | 13.7% | 5.7%(+8.06)#49 | 6.2%(+7.53)#2,137 |
| 50. | Vienna Center | 13.7% | 5.7%(+8.01)#50 | 6.2%(+7.48)#2,151 |
| 51. | North Randall | 13.5% | 5.7%(+7.87)#51 | 6.2%(+7.34)#2,208 |
| 52. | New Concord | 13.5% | 5.7%(+7.84)#52 | 6.2%(+7.31)#2,220 |
| 53. | Howland Center | 13.4% | 5.7%(+7.78)#53 | 6.2%(+7.25)#2,240 |
| 54. | Kansas | 13.4% | 5.7%(+7.78)#54 | 6.2%(+7.25)#2,244 |
| 55. | Frankfort | 13.4% | 5.7%(+7.72)#55 | 6.2%(+7.19)#2,269 |
| 56. | Yellow Springs | 13.3% | 5.7%(+7.63)#56 | 6.2%(+7.10)#2,316 |
| 57. | Jackson Center | 13.2% | 5.7%(+7.58)#57 | 6.2%(+7.05)#2,330 |
| 58. | Bexley | 13.0% | 5.7%(+7.36)#58 | 6.2%(+6.83)#2,419 |
| 59. | Kipton | 12.8% | 5.7%(+7.14)#59 | 6.2%(+6.61)#2,534 |
| 60. | Lindsey | 12.8% | 5.7%(+7.13)#60 | 6.2%(+6.59)#2,542 |
| 61. | Forestville | 12.4% | 5.7%(+6.77)#61 | 6.2%(+6.24)#2,712 |
| 62. | West Alexandria | 12.3% | 5.7%(+6.65)#62 | 6.2%(+6.12)#2,772 |
| 63. | Woodville | 12.3% | 5.7%(+6.64)#63 | 6.2%(+6.10)#2,776 |
| 64. | Delta | 12.3% | 5.7%(+6.60)#64 | 6.2%(+6.07)#2,790 |
| 65. | Bluffton | 12.2% | 5.7%(+6.55)#65 | 6.2%(+6.02)#2,815 |
| 66. | Bowling Green | 12.2% | 5.7%(+6.53)#66 | 6.2%(+6.00)#2,822 |
| 67. | Orange | 12.2% | 5.7%(+6.52)#67 | 6.2%(+5.99)#2,827 |
| 68. | Yankee Lake | 12.1% | 5.7%(+6.47)#68 | 6.2%(+5.94)#2,856 |
| 69. | Wheelersburg | 12.1% | 5.7%(+6.45)#69 | 6.2%(+5.92)#2,869 |
| 70. | Cedarville | 12.0% | 5.7%(+6.36)#70 | 6.2%(+5.83)#2,913 |
| 71. | Winesburg | 12.0% | 5.7%(+6.32)#71 | 6.2%(+5.79)#2,928 |
| 72. | Miller | 11.9% | 5.7%(+6.28)#72 | 6.2%(+5.75)#2,945 |
| 73. | Centerville Thurman | 11.8% | 5.7%(+6.11)#73 | 6.2%(+5.58)#3,043 |
| 74. | Caldwell | 11.7% | 5.7%(+6.02)#74 | 6.2%(+5.49)#3,097 |
| 75. | Oakwood | 11.6% | 5.7%(+5.91)#75 | 6.2%(+5.38)#3,178 |
| 76. | Fort Mckinley | 11.5% | 5.7%(+5.83)#76 | 6.2%(+5.30)#3,226 |
| 77. | Hannibal | 11.5% | 5.7%(+5.82)#77 | 6.2%(+5.29)#3,232 |
| 78. | Hiram | 11.5% | 5.7%(+5.82)#78 | 6.2%(+5.28)#3,237 |
| 79. | Hudson | 11.4% | 5.7%(+5.75)#79 | 6.2%(+5.22)#3,290 |
| 80. | Wyoming | 11.4% | 5.7%(+5.71)#80 | 6.2%(+5.18)#3,326 |
| 81. | Clinton | 11.3% | 5.7%(+5.67)#81 | 6.2%(+5.13)#3,351 |
| 82. | St Martin | 11.3% | 5.7%(+5.60)#82 | 6.2%(+5.07)#3,414 |
| 83. | Cleveland Heights | 11.2% | 5.7%(+5.56)#83 | 6.2%(+5.03)#3,451 |
| 84. | Lexington | 11.1% | 5.7%(+5.48)#84 | 6.2%(+4.95)#3,508 |
| 85. | Deersville | 11.1% | 5.7%(+5.46)#85 | 6.2%(+4.93)#3,548 |
| 86. | Camp Dennison | 11.0% | 5.7%(+5.40)#86 | 6.2%(+4.87)#3,579 |
| 87. | De Graff | 11.0% | 5.7%(+5.39)#87 | 6.2%(+4.86)#3,586 |
| 88. | Cortland | 11.0% | 5.7%(+5.37)#88 | 6.2%(+4.84)#3,599 |
| 89. | Mariemont | 11.0% | 5.7%(+5.35)#89 | 6.2%(+4.82)#3,622 |
| 90. | Albany | 11.0% | 5.7%(+5.31)#90 | 6.2%(+4.78)#3,643 |
| 91. | Amsterdam | 11.0% | 5.7%(+5.31)#91 | 6.2%(+4.78)#3,650 |
| 92. | Lakeline | 10.9% | 5.7%(+5.26)#92 | 6.2%(+4.73)#3,691 |
| 93. | Kent | 10.9% | 5.7%(+5.25)#93 | 6.2%(+4.72)#3,696 |
| 94. | Oak Hill | 10.9% | 5.7%(+5.23)#94 | 6.2%(+4.70)#3,704 |
| 95. | Madison | 10.9% | 5.7%(+5.23)#95 | 6.2%(+4.70)#3,706 |
| 96. | St Clairsville | 10.8% | 5.7%(+5.19)#96 | 6.2%(+4.66)#3,737 |
| 97. | Ballville | 10.7% | 5.7%(+5.02)#97 | 6.2%(+4.49)#3,862 |
| 98. | Chickasaw | 10.6% | 5.7%(+4.99)#98 | 6.2%(+4.45)#3,895 |
| 99. | Kalida | 10.6% | 5.7%(+4.93)#99 | 6.2%(+4.39)#3,945 |
| 100. | Lithopolis | 10.6% | 5.7%(+4.92)#100 | 6.2%(+4.38)#3,955 |
Common Questions
What are the Top 10 Cities with the Highest Percentage of Population Employed in Education Instruction & Library in Ohio?
Top 10 Cities with the Highest Percentage of Population Employed in Education Instruction & Library in Ohio are:
#1
69.6%
#2
37.7%
#3
35.2%
#4
33.3%
#5
30.7%
#6
26.6%
#7
23.6%
#8
23.0%
#9
22.2%
#10
22.2%
What city has the Highest Percentage of Population Employed in Education Instruction & Library in Ohio?
Trinway has the Highest Percentage of Population Employed in Education Instruction & Library in Ohio with 69.6%.
What is the Percentage of Population Employed in Education Instruction & Library in the State of Ohio?
Percentage of Population Employed in Education Instruction & Library in Ohio is 5.7%.
What is the Percentage of Population Employed in Education Instruction & Library in the United States?
Percentage of Population Employed in Education Instruction & Library in the United States is 6.2%.