Cities with the Highest Percentage of Population Employed in Farming, Fishing & Forestry in Ohio
RELATED REPORTS & OPTIONS
Farming, Fishing & Forestry
Ohio
Compare Cities
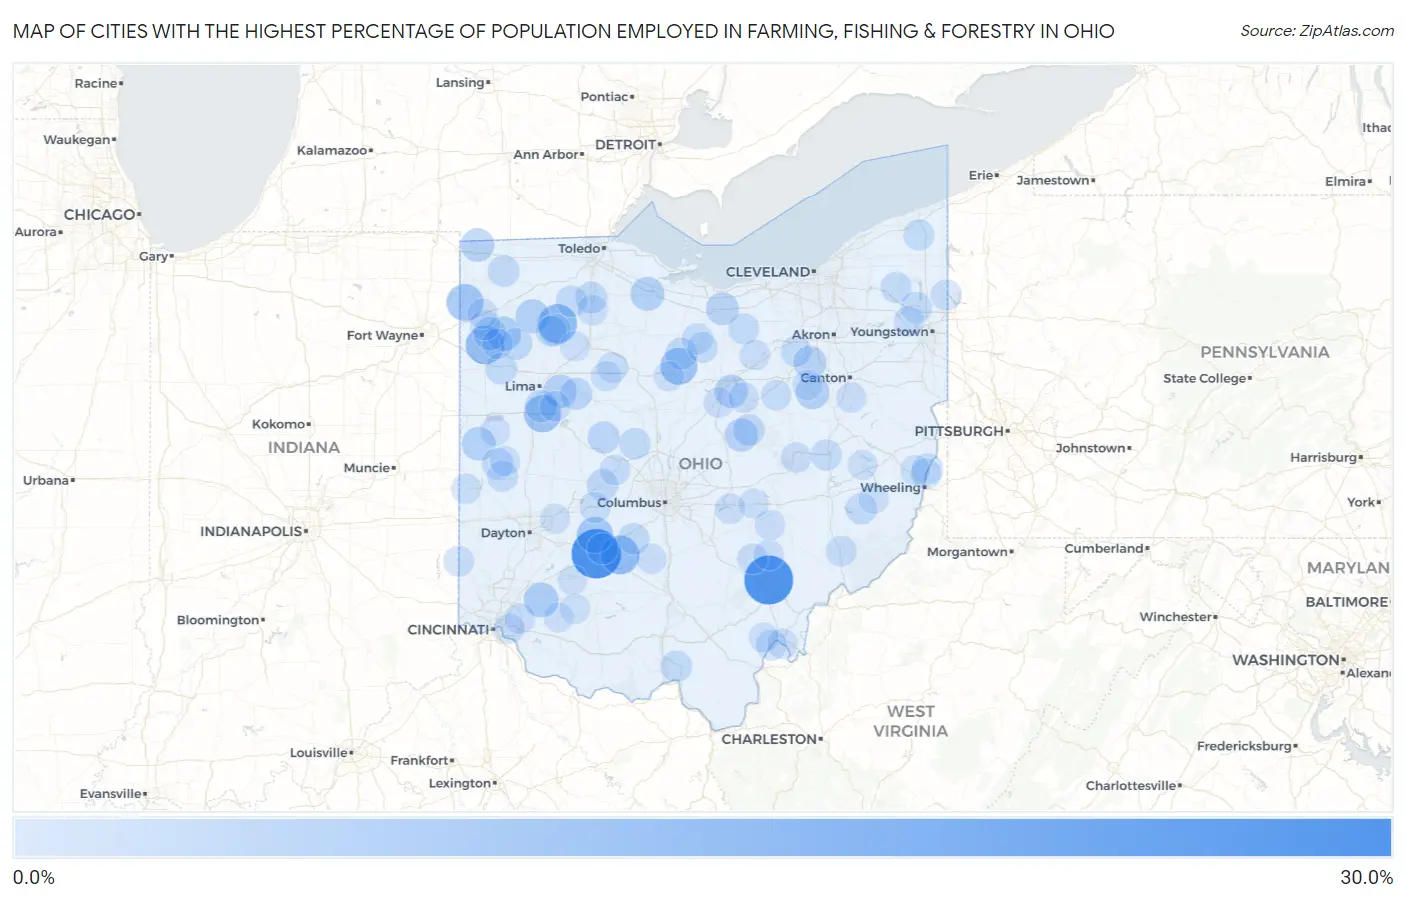
Map of Cities with the Highest Percentage of Population Employed in Farming, Fishing & Forestry in Ohio
0.0%
30.0%
Cities with the Highest Percentage of Population Employed in Farming, Fishing & Forestry in Ohio
| City | % Employed | vs State | vs National | |
| 1. | Ai | 27.3% | 0.29%(+27.0)#1 | 0.61%(+26.7)#271 |
| 2. | Octa | 27.3% | 0.29%(+27.0)#2 | 0.61%(+26.7)#272 |
| 3. | Millfield | 26.4% | 0.29%(+26.1)#3 | 0.61%(+25.8)#293 |
| 4. | Belmore | 13.2% | 0.29%(+12.9)#4 | 0.61%(+12.6)#775 |
| 5. | Bloomingburg | 12.5% | 0.29%(+12.2)#5 | 0.61%(+11.9)#832 |
| 6. | Haviland | 12.3% | 0.29%(+12.1)#6 | 0.61%(+11.7)#840 |
| 7. | St Johns | 10.4% | 0.29%(+10.2)#7 | 0.61%(+9.84)#1,018 |
| 8. | Sulphur Springs | 10.3% | 0.29%(+10.1)#8 | 0.61%(+9.74)#1,027 |
| 9. | Hicksville | 10.2% | 0.29%(+9.94)#9 | 0.61%(+9.63)#1,046 |
| 10. | West Logan | 9.4% | 0.29%(+9.15)#10 | 0.61%(+8.83)#1,160 |
| 11. | South Solon | 9.2% | 0.29%(+8.96)#11 | 0.61%(+8.64)#1,187 |
| 12. | Butlerville | 7.4% | 0.29%(+7.16)#12 | 0.61%(+6.84)#1,558 |
| 13. | Melrose | 7.1% | 0.29%(+6.85)#13 | 0.61%(+6.54)#1,622 |
| 14. | Stony Prairie | 6.3% | 0.29%(+6.05)#14 | 0.61%(+5.73)#1,826 |
| 15. | New Bavaria | 6.2% | 0.29%(+5.96)#15 | 0.61%(+5.64)#1,851 |
| 16. | Burkettsville | 6.1% | 0.29%(+5.85)#16 | 0.61%(+5.53)#1,879 |
| 17. | Mount Eaton | 5.8% | 0.29%(+5.53)#17 | 0.61%(+5.21)#1,986 |
| 18. | Harrod | 5.6% | 0.29%(+5.29)#18 | 0.61%(+4.97)#2,059 |
| 19. | Lake Seneca | 5.6% | 0.29%(+5.27)#19 | 0.61%(+4.95)#2,067 |
| 20. | Lucas | 5.4% | 0.29%(+5.14)#20 | 0.61%(+4.82)#2,135 |
| 21. | Howard | 5.4% | 0.29%(+5.11)#21 | 0.61%(+4.79)#2,153 |
| 22. | Marshallville | 5.1% | 0.29%(+4.80)#22 | 0.61%(+4.48)#2,267 |
| 23. | Broughton | 5.0% | 0.29%(+4.71)#23 | 0.61%(+4.39)#2,309 |
| 24. | Collins | 4.7% | 0.29%(+4.39)#24 | 0.61%(+4.08)#2,451 |
| 25. | Uniopolis | 4.3% | 0.29%(+4.03)#25 | 0.61%(+3.72)#2,638 |
| 26. | West Mansfield | 4.1% | 0.29%(+3.77)#26 | 0.61%(+3.46)#2,785 |
| 27. | Mcguffey | 4.0% | 0.29%(+3.73)#27 | 0.61%(+3.42)#2,810 |
| 28. | New Washington | 3.8% | 0.29%(+3.46)#28 | 0.61%(+3.15)#2,995 |
| 29. | Maria Stein | 3.7% | 0.29%(+3.42)#29 | 0.61%(+3.10)#3,028 |
| 30. | Leipsic | 3.7% | 0.29%(+3.36)#30 | 0.61%(+3.05)#3,074 |
| 31. | Cloverdale | 3.6% | 0.29%(+3.28)#31 | 0.61%(+2.97)#3,157 |
| 32. | Mechanicsburg | 3.4% | 0.29%(+3.15)#32 | 0.61%(+2.83)#3,261 |
| 33. | Portage | 3.4% | 0.29%(+3.13)#33 | 0.61%(+2.81)#3,274 |
| 34. | Danville | 3.4% | 0.29%(+3.10)#34 | 0.61%(+2.78)#3,299 |
| 35. | Mount Sterling | 3.3% | 0.29%(+3.01)#35 | 0.61%(+2.70)#3,371 |
| 36. | Clarktown | 3.2% | 0.29%(+2.96)#36 | 0.61%(+2.64)#3,415 |
| 37. | Middle Point | 3.2% | 0.29%(+2.91)#37 | 0.61%(+2.59)#3,457 |
| 38. | Magnetic Springs | 3.1% | 0.29%(+2.84)#38 | 0.61%(+2.52)#3,528 |
| 39. | Milton Center | 3.1% | 0.29%(+2.84)#39 | 0.61%(+2.52)#3,530 |
| 40. | Stryker | 3.1% | 0.29%(+2.79)#40 | 0.61%(+2.48)#3,568 |
| 41. | Morgandale | 3.0% | 0.29%(+2.75)#41 | 0.61%(+2.43)#3,606 |
| 42. | Batesville | 2.9% | 0.29%(+2.65)#42 | 0.61%(+2.34)#3,703 |
| 43. | Willard | 2.9% | 0.29%(+2.60)#43 | 0.61%(+2.29)#3,750 |
| 44. | Newcomerstown | 2.9% | 0.29%(+2.60)#44 | 0.61%(+2.28)#3,753 |
| 45. | Versailles | 2.9% | 0.29%(+2.59)#45 | 0.61%(+2.27)#3,761 |
| 46. | Sterling | 2.8% | 0.29%(+2.54)#46 | 0.61%(+2.22)#3,828 |
| 47. | Rochester | 2.8% | 0.29%(+2.53)#47 | 0.61%(+2.21)#3,836 |
| 48. | Jeffersonville | 2.7% | 0.29%(+2.40)#48 | 0.61%(+2.08)#3,977 |
| 49. | Rayland | 2.6% | 0.29%(+2.33)#49 | 0.61%(+2.01)#4,063 |
| 50. | West Farmington | 2.6% | 0.29%(+2.28)#50 | 0.61%(+1.96)#4,111 |
| 51. | Jefferson | 2.5% | 0.29%(+2.25)#51 | 0.61%(+1.93)#4,159 |
| 52. | Bradford | 2.5% | 0.29%(+2.23)#52 | 0.61%(+1.91)#4,190 |
| 53. | New Straitsville | 2.3% | 0.29%(+2.06)#53 | 0.61%(+1.74)#4,386 |
| 54. | College Corner | 2.3% | 0.29%(+2.06)#54 | 0.61%(+1.74)#4,395 |
| 55. | Ridgewood | 2.3% | 0.29%(+2.04)#55 | 0.61%(+1.73)#4,412 |
| 56. | Yorkville | 2.3% | 0.29%(+2.00)#56 | 0.61%(+1.68)#4,453 |
| 57. | West Leipsic | 2.3% | 0.29%(+1.98)#57 | 0.61%(+1.67)#4,471 |
| 58. | Orangeville | 2.2% | 0.29%(+1.93)#58 | 0.61%(+1.62)#4,551 |
| 59. | Wharton | 2.2% | 0.29%(+1.89)#59 | 0.61%(+1.57)#4,606 |
| 60. | Turpin Hills | 2.2% | 0.29%(+1.88)#60 | 0.61%(+1.56)#4,619 |
| 61. | Saybrook-On-The-Lake | 2.2% | 0.29%(+1.87)#61 | 0.61%(+1.55)#4,631 |
| 62. | Middleport | 2.1% | 0.29%(+1.85)#62 | 0.61%(+1.53)#4,659 |
| 63. | Shreve | 2.1% | 0.29%(+1.84)#63 | 0.61%(+1.52)#4,666 |
| 64. | South Vienna | 2.1% | 0.29%(+1.83)#64 | 0.61%(+1.51)#4,696 |
| 65. | Plymouth | 2.1% | 0.29%(+1.83)#65 | 0.61%(+1.51)#4,698 |
| 66. | Macksburg | 2.1% | 0.29%(+1.79)#66 | 0.61%(+1.48)#4,741 |
| 67. | Milford Center | 2.1% | 0.29%(+1.78)#67 | 0.61%(+1.46)#4,763 |
| 68. | Corning | 2.0% | 0.29%(+1.74)#68 | 0.61%(+1.42)#4,833 |
| 69. | Thornport | 2.0% | 0.29%(+1.72)#69 | 0.61%(+1.40)#4,867 |
| 70. | Polk | 2.0% | 0.29%(+1.70)#70 | 0.61%(+1.38)#4,888 |
| 71. | Milford | 2.0% | 0.29%(+1.70)#71 | 0.61%(+1.38)#4,890 |
| 72. | Waynesfield | 2.0% | 0.29%(+1.69)#72 | 0.61%(+1.37)#4,906 |
| 73. | Roseville | 2.0% | 0.29%(+1.69)#73 | 0.61%(+1.37)#4,913 |
| 74. | Williamsport | 2.0% | 0.29%(+1.67)#74 | 0.61%(+1.36)#4,928 |
| 75. | Grover Hill | 1.9% | 0.29%(+1.65)#75 | 0.61%(+1.33)#4,971 |
| 76. | Bellville | 1.9% | 0.29%(+1.64)#76 | 0.61%(+1.32)#4,984 |
| 77. | Perrysville | 1.9% | 0.29%(+1.62)#77 | 0.61%(+1.31)#5,005 |
| 78. | East Sparta | 1.9% | 0.29%(+1.61)#78 | 0.61%(+1.30)#5,023 |
| 79. | Cygnet | 1.9% | 0.29%(+1.59)#79 | 0.61%(+1.27)#5,070 |
| 80. | Russia | 1.8% | 0.29%(+1.56)#80 | 0.61%(+1.24)#5,127 |
| 81. | Syracuse | 1.8% | 0.29%(+1.48)#81 | 0.61%(+1.17)#5,234 |
| 82. | Lordstown | 1.8% | 0.29%(+1.48)#82 | 0.61%(+1.16)#5,245 |
| 83. | Paulding | 1.7% | 0.29%(+1.44)#83 | 0.61%(+1.13)#5,309 |
| 84. | Coshocton | 1.7% | 0.29%(+1.44)#84 | 0.61%(+1.12)#5,312 |
| 85. | Forest | 1.7% | 0.29%(+1.36)#85 | 0.61%(+1.05)#5,456 |
| 86. | Palestine | 1.6% | 0.29%(+1.35)#86 | 0.61%(+1.03)#5,486 |
| 87. | Lynchburg | 1.6% | 0.29%(+1.29)#87 | 0.61%(+0.969)#5,614 |
| 88. | Cecil | 1.6% | 0.29%(+1.27)#88 | 0.61%(+0.957)#5,644 |
| 89. | Bucyrus | 1.6% | 0.29%(+1.26)#89 | 0.61%(+0.945)#5,661 |
| 90. | Wilmington | 1.5% | 0.29%(+1.25)#90 | 0.61%(+0.935)#5,676 |
| 91. | Mount Pleasant | 1.5% | 0.29%(+1.25)#91 | 0.61%(+0.933)#5,686 |
| 92. | Gratiot | 1.5% | 0.29%(+1.25)#92 | 0.61%(+0.933)#5,687 |
| 93. | Holiday Valley | 1.5% | 0.29%(+1.24)#93 | 0.61%(+0.921)#5,704 |
| 94. | Fayetteville | 1.5% | 0.29%(+1.19)#94 | 0.61%(+0.876)#5,799 |
| 95. | Rutland | 1.5% | 0.29%(+1.18)#95 | 0.61%(+0.865)#5,819 |
| 96. | Freeport | 1.5% | 0.29%(+1.18)#96 | 0.61%(+0.865)#5,823 |
| 97. | Benton Ridge | 1.4% | 0.29%(+1.14)#97 | 0.61%(+0.823)#5,919 |
| 98. | Chickasaw | 1.4% | 0.29%(+1.13)#98 | 0.61%(+0.813)#5,941 |
| 99. | Kidron | 1.4% | 0.29%(+1.13)#99 | 0.61%(+0.810)#5,945 |
| 100. | Barnesville | 1.4% | 0.29%(+1.13)#100 | 0.61%(+0.809)#5,947 |
Common Questions
What are the Top 10 Cities with the Highest Percentage of Population Employed in Farming, Fishing & Forestry in Ohio?
Top 10 Cities with the Highest Percentage of Population Employed in Farming, Fishing & Forestry in Ohio are:
#1
27.3%
#2
26.4%
#3
13.2%
#4
12.5%
#5
12.3%
#6
10.4%
#7
10.3%
#8
10.2%
#9
9.2%
#10
7.4%
What city has the Highest Percentage of Population Employed in Farming, Fishing & Forestry in Ohio?
Octa has the Highest Percentage of Population Employed in Farming, Fishing & Forestry in Ohio with 27.3%.
What is the Percentage of Population Employed in Farming, Fishing & Forestry in the State of Ohio?
Percentage of Population Employed in Farming, Fishing & Forestry in Ohio is 0.29%.
What is the Percentage of Population Employed in Farming, Fishing & Forestry in the United States?
Percentage of Population Employed in Farming, Fishing & Forestry in the United States is 0.61%.