Cities with the Largest Subsaharan African Community in Ohio
RELATED REPORTS & OPTIONS
Subsaharan African
Ohio
Compare Cities
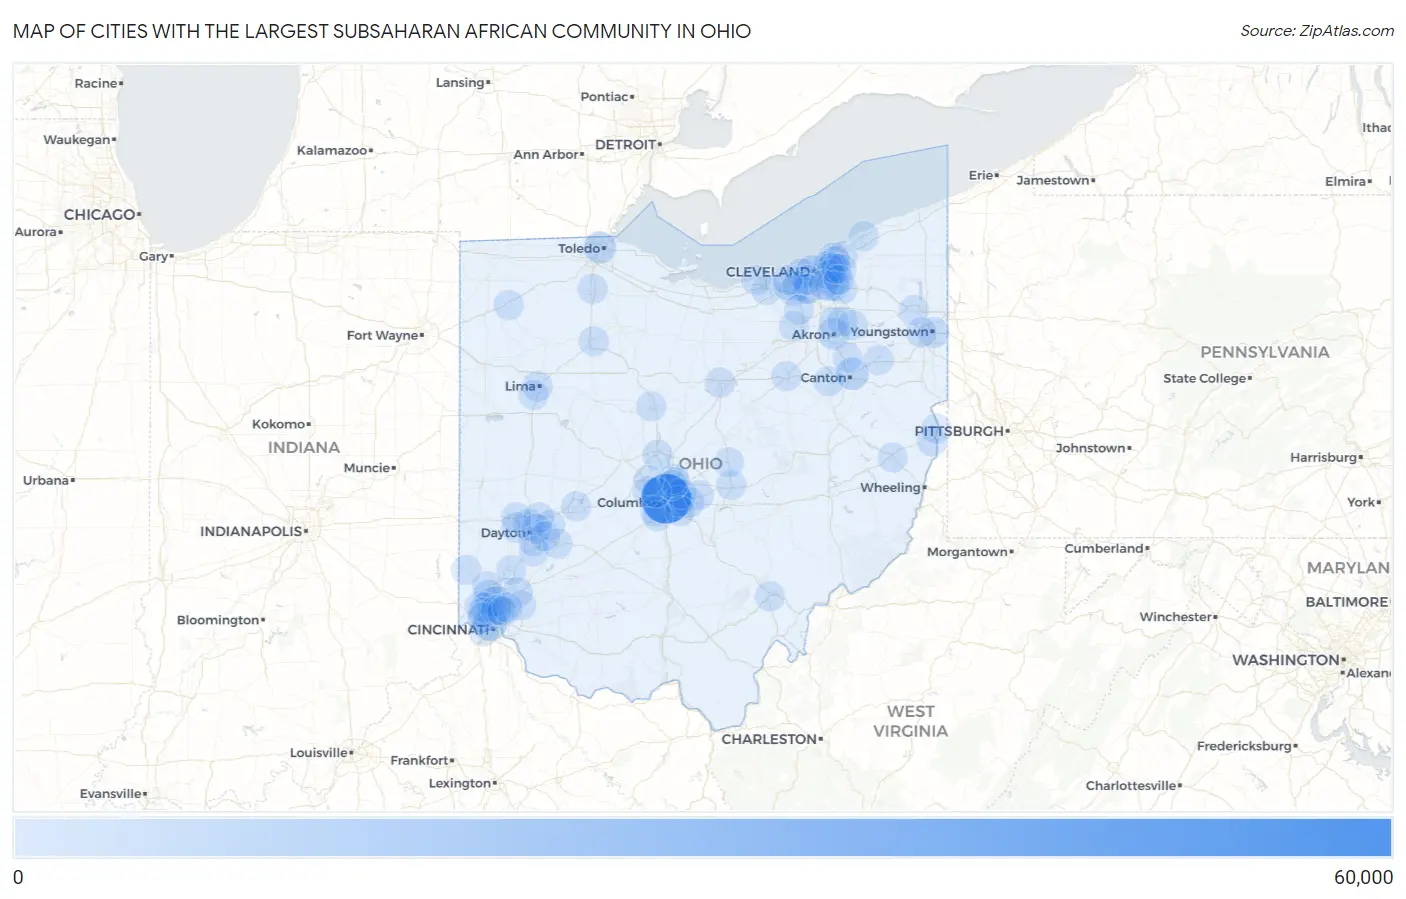
Map of Cities with the Largest Subsaharan African Community in Ohio
0
60,000
Cities with the Largest Subsaharan African Community in Ohio
| City | Subsaharan African | vs State | vs National | |
| 1. | Columbus | 58,804 | 166,068(35.41%)#1 | 4,023,199(1.46%)#3 |
| 2. | Cincinnati | 10,367 | 166,068(6.24%)#2 | 4,023,199(0.26%)#42 |
| 3. | Canton | 7,338 | 166,068(4.42%)#3 | 4,023,199(0.18%)#64 |
| 4. | Cleveland | 6,514 | 166,068(3.92%)#4 | 4,023,199(0.16%)#73 |
| 5. | Toledo | 5,682 | 166,068(3.42%)#5 | 4,023,199(0.14%)#86 |
| 6. | Akron | 4,829 | 166,068(2.91%)#6 | 4,023,199(0.12%)#99 |
| 7. | Dayton | 3,472 | 166,068(2.09%)#7 | 4,023,199(0.09%)#153 |
| 8. | Reynoldsburg | 2,001 | 166,068(1.20%)#8 | 4,023,199(0.05%)#304 |
| 9. | Fairfield | 1,980 | 166,068(1.19%)#9 | 4,023,199(0.05%)#309 |
| 10. | Youngstown | 1,912 | 166,068(1.15%)#10 | 4,023,199(0.05%)#316 |
| 11. | Whitehall | 1,865 | 166,068(1.12%)#11 | 4,023,199(0.05%)#325 |
| 12. | Lima | 1,498 | 166,068(0.90%)#12 | 4,023,199(0.04%)#405 |
| 13. | Euclid | 1,491 | 166,068(0.90%)#13 | 4,023,199(0.04%)#410 |
| 14. | Steubenville | 1,461 | 166,068(0.88%)#14 | 4,023,199(0.04%)#424 |
| 15. | Trotwood | 863 | 166,068(0.52%)#15 | 4,023,199(0.02%)#664 |
| 16. | Forest Park | 851 | 166,068(0.51%)#16 | 4,023,199(0.02%)#673 |
| 17. | Cleveland Heights | 844 | 166,068(0.51%)#17 | 4,023,199(0.02%)#677 |
| 18. | Springdale | 842 | 166,068(0.51%)#18 | 4,023,199(0.02%)#679 |
| 19. | Richmond Heights | 808 | 166,068(0.49%)#19 | 4,023,199(0.02%)#711 |
| 20. | Delaware | 737 | 166,068(0.44%)#20 | 4,023,199(0.02%)#775 |
| 21. | Westerville | 718 | 166,068(0.43%)#21 | 4,023,199(0.02%)#791 |
| 22. | Huber Heights | 715 | 166,068(0.43%)#22 | 4,023,199(0.02%)#797 |
| 23. | Mason | 700 | 166,068(0.42%)#23 | 4,023,199(0.02%)#818 |
| 24. | Lakewood | 683 | 166,068(0.41%)#24 | 4,023,199(0.02%)#828 |
| 25. | East Cleveland | 664 | 166,068(0.40%)#25 | 4,023,199(0.02%)#852 |
| 26. | Massillon | 663 | 166,068(0.40%)#26 | 4,023,199(0.02%)#853 |
| 27. | Austintown | 635 | 166,068(0.38%)#27 | 4,023,199(0.02%)#891 |
| 28. | Kettering | 599 | 166,068(0.36%)#28 | 4,023,199(0.01%)#942 |
| 29. | Warrensville Heights | 569 | 166,068(0.34%)#29 | 4,023,199(0.01%)#983 |
| 30. | Urbancrest | 545 | 166,068(0.33%)#30 | 4,023,199(0.01%)#1,018 |
| 31. | Dry Ridge | 515 | 166,068(0.31%)#31 | 4,023,199(0.01%)#1,062 |
| 32. | Lorain | 514 | 166,068(0.31%)#32 | 4,023,199(0.01%)#1,064 |
| 33. | Bowling Green | 498 | 166,068(0.30%)#33 | 4,023,199(0.01%)#1,088 |
| 34. | Finneytown | 484 | 166,068(0.29%)#34 | 4,023,199(0.01%)#1,113 |
| 35. | Centerville | 481 | 166,068(0.29%)#35 | 4,023,199(0.01%)#1,122 |
| 36. | Gahanna | 474 | 166,068(0.29%)#36 | 4,023,199(0.01%)#1,134 |
| 37. | Solon | 463 | 166,068(0.28%)#37 | 4,023,199(0.01%)#1,160 |
| 38. | South Euclid | 459 | 166,068(0.28%)#38 | 4,023,199(0.01%)#1,165 |
| 39. | Fairborn | 438 | 166,068(0.26%)#39 | 4,023,199(0.01%)#1,217 |
| 40. | Newark | 428 | 166,068(0.26%)#40 | 4,023,199(0.01%)#1,242 |
| 41. | Springfield | 425 | 166,068(0.26%)#41 | 4,023,199(0.01%)#1,249 |
| 42. | Pataskala | 424 | 166,068(0.26%)#42 | 4,023,199(0.01%)#1,252 |
| 43. | Hamilton | 417 | 166,068(0.25%)#43 | 4,023,199(0.01%)#1,259 |
| 44. | Loveland | 407 | 166,068(0.25%)#44 | 4,023,199(0.01%)#1,278 |
| 45. | Northbrook | 396 | 166,068(0.24%)#45 | 4,023,199(0.01%)#1,312 |
| 46. | Berea | 394 | 166,068(0.24%)#46 | 4,023,199(0.01%)#1,317 |
| 47. | Maple Heights | 388 | 166,068(0.23%)#47 | 4,023,199(0.01%)#1,333 |
| 48. | Brook Park | 387 | 166,068(0.23%)#48 | 4,023,199(0.01%)#1,337 |
| 49. | Alliance | 384 | 166,068(0.23%)#49 | 4,023,199(0.01%)#1,345 |
| 50. | Parma | 383 | 166,068(0.23%)#50 | 4,023,199(0.01%)#1,346 |
| 51. | Delshire | 376 | 166,068(0.23%)#51 | 4,023,199(0.01%)#1,365 |
| 52. | Utica | 369 | 166,068(0.22%)#52 | 4,023,199(0.01%)#1,381 |
| 53. | Findlay | 368 | 166,068(0.22%)#53 | 4,023,199(0.01%)#1,383 |
| 54. | Shaker Heights | 364 | 166,068(0.22%)#54 | 4,023,199(0.01%)#1,390 |
| 55. | Cuyahoga Falls | 358 | 166,068(0.22%)#55 | 4,023,199(0.01%)#1,398 |
| 56. | Parma Heights | 357 | 166,068(0.21%)#56 | 4,023,199(0.01%)#1,404 |
| 57. | Elyria | 347 | 166,068(0.21%)#57 | 4,023,199(0.01%)#1,428 |
| 58. | Willoughby Hills | 336 | 166,068(0.20%)#58 | 4,023,199(0.01%)#1,466 |
| 59. | Medina | 326 | 166,068(0.20%)#59 | 4,023,199(0.01%)#1,500 |
| 60. | Painesville | 300 | 166,068(0.18%)#60 | 4,023,199(0.01%)#1,578 |
| 61. | Middletown | 299 | 166,068(0.18%)#61 | 4,023,199(0.01%)#1,582 |
| 62. | White Oak | 270 | 166,068(0.16%)#62 | 4,023,199(0.01%)#1,687 |
| 63. | Marion | 246 | 166,068(0.15%)#63 | 4,023,199(0.01%)#1,791 |
| 64. | Monfort Heights | 243 | 166,068(0.15%)#64 | 4,023,199(0.01%)#1,807 |
| 65. | Huber Ridge | 243 | 166,068(0.15%)#65 | 4,023,199(0.01%)#1,808 |
| 66. | Athens | 234 | 166,068(0.14%)#66 | 4,023,199(0.01%)#1,849 |
| 67. | North Olmsted | 233 | 166,068(0.14%)#67 | 4,023,199(0.01%)#1,856 |
| 68. | Mansfield | 224 | 166,068(0.13%)#68 | 4,023,199(0.01%)#1,904 |
| 69. | Lockland | 222 | 166,068(0.13%)#69 | 4,023,199(0.01%)#1,927 |
| 70. | Brooklyn | 215 | 166,068(0.13%)#70 | 4,023,199(0.01%)#1,962 |
| 71. | Warren | 210 | 166,068(0.13%)#71 | 4,023,199(0.01%)#1,999 |
| 72. | Greentown | 208 | 166,068(0.13%)#72 | 4,023,199(0.01%)#2,014 |
| 73. | Xenia | 196 | 166,068(0.12%)#73 | 4,023,199(0.00%)#2,079 |
| 74. | Wyoming | 193 | 166,068(0.12%)#74 | 4,023,199(0.00%)#2,109 |
| 75. | Minerva Park | 193 | 166,068(0.12%)#75 | 4,023,199(0.00%)#2,110 |
| 76. | Dublin | 190 | 166,068(0.11%)#76 | 4,023,199(0.00%)#2,126 |
| 77. | Defiance | 188 | 166,068(0.11%)#77 | 4,023,199(0.00%)#2,139 |
| 78. | Fort Shawnee | 188 | 166,068(0.11%)#78 | 4,023,199(0.00%)#2,141 |
| 79. | Wooster | 187 | 166,068(0.11%)#79 | 4,023,199(0.00%)#2,148 |
| 80. | Riverside | 185 | 166,068(0.11%)#80 | 4,023,199(0.00%)#2,158 |
| 81. | Bedford Heights | 180 | 166,068(0.11%)#81 | 4,023,199(0.00%)#2,209 |
| 82. | Stow | 179 | 166,068(0.11%)#82 | 4,023,199(0.00%)#2,214 |
| 83. | Westlake | 175 | 166,068(0.11%)#83 | 4,023,199(0.00%)#2,238 |
| 84. | Garfield Heights | 175 | 166,068(0.11%)#84 | 4,023,199(0.00%)#2,239 |
| 85. | Cadiz | 175 | 166,068(0.11%)#85 | 4,023,199(0.00%)#2,244 |
| 86. | Beavercreek | 172 | 166,068(0.10%)#86 | 4,023,199(0.00%)#2,265 |
| 87. | Mayfield Heights | 168 | 166,068(0.10%)#87 | 4,023,199(0.00%)#2,294 |
| 88. | Lyndhurst | 166 | 166,068(0.10%)#88 | 4,023,199(0.00%)#2,313 |
| 89. | Englewood | 163 | 166,068(0.10%)#89 | 4,023,199(0.00%)#2,334 |
| 90. | Orange | 161 | 166,068(0.10%)#90 | 4,023,199(0.00%)#2,358 |
| 91. | Reading | 155 | 166,068(0.09%)#91 | 4,023,199(0.00%)#2,416 |
| 92. | Kent | 150 | 166,068(0.09%)#92 | 4,023,199(0.00%)#2,460 |
| 93. | Blacklick Estates | 150 | 166,068(0.09%)#93 | 4,023,199(0.00%)#2,468 |
| 94. | Oxford | 149 | 166,068(0.09%)#94 | 4,023,199(0.00%)#2,475 |
| 95. | Grove City | 145 | 166,068(0.09%)#95 | 4,023,199(0.00%)#2,506 |
| 96. | Brunswick | 142 | 166,068(0.09%)#96 | 4,023,199(0.00%)#2,544 |
| 97. | Blue Ash | 134 | 166,068(0.08%)#97 | 4,023,199(0.00%)#2,630 |
| 98. | Hilliard | 131 | 166,068(0.08%)#98 | 4,023,199(0.00%)#2,655 |
| 99. | Toronto | 130 | 166,068(0.08%)#99 | 4,023,199(0.00%)#2,684 |
| 100. | Upper Arlington | 128 | 166,068(0.08%)#100 | 4,023,199(0.00%)#2,703 |
Common Questions
What are the Top 10 Cities with the Largest Subsaharan African Community in Ohio?
Top 10 Cities with the Largest Subsaharan African Community in Ohio are:
#1
58,804
#2
10,367
#3
7,338
#4
6,514
#5
5,682
#6
4,829
#7
3,472
#8
2,001
#9
1,980
#10
1,912
What city has the Largest Subsaharan African Community in Ohio?
Columbus has the Largest Subsaharan African Community in Ohio with 58,804.
What is the Total Subsaharan African Population in the State of Ohio?
Total Subsaharan African Population in Ohio is 166,068.
What is the Total Subsaharan African Population in the United States?
Total Subsaharan African Population in the United States is 4,023,199.