Cities with the Highest Percentage of Immigrants from Iran in Ohio
RELATED REPORTS & OPTIONS
Iran
Ohio
Compare Cities
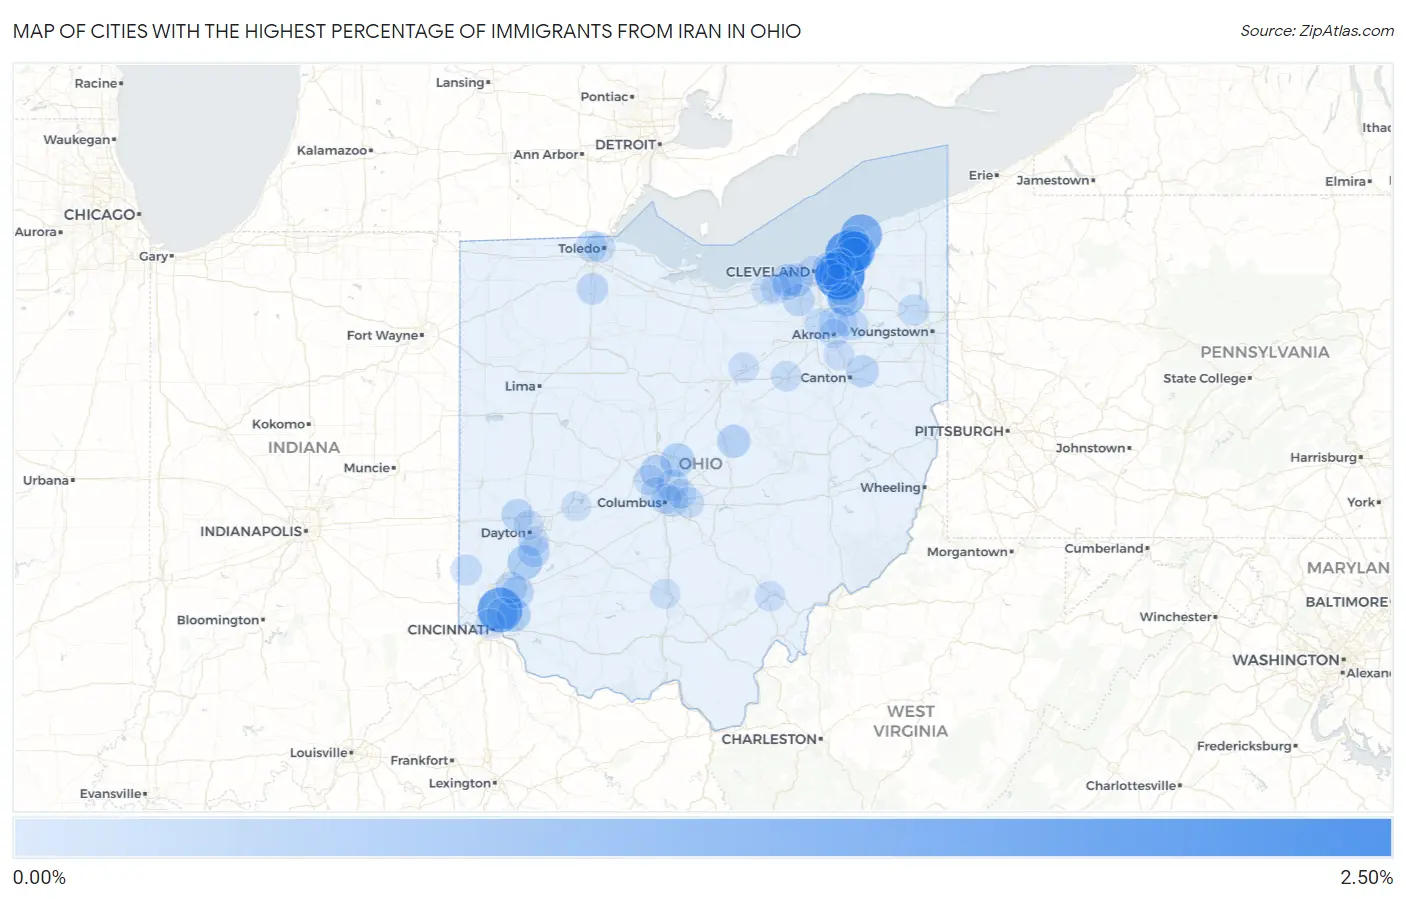
Map of Cities with the Highest Percentage of Immigrants from Iran in Ohio
0.00%
2.50%
Cities with the Highest Percentage of Immigrants from Iran in Ohio
| City | Iran | vs State | vs National | |
| 1. | Pepper Pike | 2.33% | 0.030%(+2.30)#32 | 0.12%(+2.21)#879 |
| 2. | Waite Hill | 1.99% | 0.030%(+1.96)#33 | 0.12%(+1.87)#880 |
| 3. | Lockland | 1.74% | 0.030%(+1.71)#34 | 0.12%(+1.63)#881 |
| 4. | Grand River | 1.33% | 0.030%(+1.30)#58 | 0.12%(+1.21)#1,505 |
| 5. | Kirtland Hills | 1.18% | 0.030%(+1.15)#59 | 0.12%(+1.06)#1,506 |
| 6. | Reminderville | 0.81% | 0.030%(+0.780)#60 | 0.12%(+0.692)#1,507 |
| 7. | Springboro | 0.51% | 0.030%(+0.480)#87 | 0.12%(+0.392)#2,150 |
| 8. | Kirtland | 0.43% | 0.030%(+0.404)#207 | 0.12%(+0.316)#5,091 |
| 9. | Sunbury | 0.43% | 0.030%(+0.403)#208 | 0.12%(+0.315)#5,092 |
| 10. | Solon | 0.42% | 0.030%(+0.390)#209 | 0.12%(+0.302)#5,093 |
| 11. | The Village Of Indian Hill | 0.41% | 0.030%(+0.383)#210 | 0.12%(+0.295)#5,094 |
| 12. | Lyndhurst | 0.38% | 0.030%(+0.350)#211 | 0.12%(+0.262)#5,095 |
| 13. | Fairview Park | 0.36% | 0.030%(+0.326)#212 | 0.12%(+0.238)#5,096 |
| 14. | Beachwood | 0.35% | 0.030%(+0.324)#213 | 0.12%(+0.236)#5,097 |
| 15. | Gambier | 0.35% | 0.030%(+0.320)#214 | 0.12%(+0.232)#5,098 |
| 16. | Cleveland Heights | 0.33% | 0.030%(+0.299)#215 | 0.12%(+0.211)#5,099 |
| 17. | Powell | 0.30% | 0.030%(+0.267)#216 | 0.12%(+0.179)#5,100 |
| 18. | Louisville | 0.27% | 0.030%(+0.244)#217 | 0.12%(+0.155)#5,101 |
| 19. | Westlake | 0.27% | 0.030%(+0.237)#218 | 0.12%(+0.149)#5,102 |
| 20. | Mason | 0.26% | 0.030%(+0.232)#219 | 0.12%(+0.144)#5,103 |
| 21. | Strongsville | 0.24% | 0.030%(+0.215)#220 | 0.12%(+0.127)#5,104 |
| 22. | Clayton | 0.23% | 0.030%(+0.203)#221 | 0.12%(+0.115)#5,105 |
| 23. | Orange | 0.23% | 0.030%(+0.203)#222 | 0.12%(+0.115)#5,106 |
| 24. | Centerville | 0.22% | 0.030%(+0.190)#223 | 0.12%(+0.102)#5,107 |
| 25. | Minerva Park | 0.21% | 0.030%(+0.181)#224 | 0.12%(+0.093)#5,108 |
| 26. | Amberley | 0.21% | 0.030%(+0.179)#225 | 0.12%(+0.091)#5,109 |
| 27. | Four Bridges | 0.20% | 0.030%(+0.169)#226 | 0.12%(+0.081)#5,110 |
| 28. | Bowling Green | 0.18% | 0.030%(+0.149)#227 | 0.12%(+0.061)#5,111 |
| 29. | Ottawa Hills | 0.15% | 0.030%(+0.116)#228 | 0.12%(+0.028)#5,112 |
| 30. | Warren | 0.14% | 0.030%(+0.105)#229 | 0.12%(+0.017)#5,113 |
| 31. | Montrose Ghent | 0.12% | 0.030%(+0.089)#230 | 0.12%(+0.001)#5,114 |
| 32. | Bexley | 0.12% | 0.030%(+0.088)#231 | 0.12%(-0.000)#5,115 |
| 33. | Oxford | 0.12% | 0.030%(+0.088)#232 | 0.12%(-0.000)#5,116 |
| 34. | Kent | 0.099% | 0.030%(+0.069)#233 | 0.12%(-0.019)#5,117 |
| 35. | Upper Arlington | 0.077% | 0.030%(+0.047)#234 | 0.12%(-0.041)#5,118 |
| 36. | Dublin | 0.076% | 0.030%(+0.046)#235 | 0.12%(-0.043)#5,119 |
| 37. | Reynoldsburg | 0.073% | 0.030%(+0.043)#236 | 0.12%(-0.045)#5,120 |
| 38. | Mentor | 0.072% | 0.030%(+0.042)#237 | 0.12%(-0.046)#5,121 |
| 39. | Highland Heights | 0.069% | 0.030%(+0.039)#238 | 0.12%(-0.049)#5,122 |
| 40. | Twinsburg | 0.067% | 0.030%(+0.037)#239 | 0.12%(-0.051)#5,123 |
| 41. | North Ridgeville | 0.062% | 0.030%(+0.032)#240 | 0.12%(-0.056)#5,265 |
| 42. | Wooster | 0.059% | 0.030%(+0.029)#241 | 0.12%(-0.059)#5,266 |
| 43. | Columbus | 0.052% | 0.030%(+0.022)#242 | 0.12%(-0.066)#5,267 |
| 44. | Cleveland | 0.047% | 0.030%(+0.017)#243 | 0.12%(-0.071)#5,268 |
| 45. | Ashland | 0.042% | 0.030%(+0.011)#244 | 0.12%(-0.077)#5,269 |
| 46. | Shaker Heights | 0.041% | 0.030%(+0.011)#245 | 0.12%(-0.077)#5,270 |
| 47. | Green | 0.040% | 0.030%(+0.010)#246 | 0.12%(-0.078)#5,271 |
| 48. | Athens | 0.040% | 0.030%(+0.009)#247 | 0.12%(-0.079)#5,272 |
| 49. | Cuyahoga Falls | 0.035% | 0.030%(+0.005)#248 | 0.12%(-0.083)#5,273 |
| 50. | North Olmsted | 0.031% | 0.030%(+0.001)#249 | 0.12%(-0.087)#5,274 |
| 51. | Gahanna | 0.031% | 0.030%(+0.001)#250 | 0.12%(-0.087)#5,275 |
| 52. | Kettering | 0.026% | 0.030%(-0.004)#251 | 0.12%(-0.092)#5,276 |
| 53. | Cincinnati | 0.025% | 0.030%(-0.005)#252 | 0.12%(-0.093)#5,277 |
| 54. | Toledo | 0.023% | 0.030%(-0.008)#253 | 0.12%(-0.096)#5,278 |
| 55. | Chillicothe | 0.018% | 0.030%(-0.012)#254 | 0.12%(-0.100)#5,346 |
| 56. | Stow | 0.012% | 0.030%(-0.019)#255 | 0.12%(-0.107)#5,347 |
| 57. | Dayton | 0.0087% | 0.030%(-0.021)#256 | 0.12%(-0.109)#5,348 |
| 58. | Springfield | 0.0085% | 0.030%(-0.022)#257 | 0.12%(-0.110)#5,349 |
| 59. | Akron | 0.0047% | 0.030%(-0.025)#258 | 0.12%(-0.113)#5,350 |
| 60. | Elyria | 0.0019% | 0.030%(-0.028)#259 | 0.12%(-0.116)#5,622 |
Common Questions
What are the Top 10 Cities with the Highest Percentage of Immigrants from Iran in Ohio?
Top 10 Cities with the Highest Percentage of Immigrants from Iran in Ohio are:
#1
2.33%
#2
1.99%
#3
1.74%
#4
1.33%
#5
1.18%
#6
0.81%
#7
0.51%
#8
0.43%
#9
0.43%
#10
0.42%
What city has the Highest Percentage of Immigrants from Iran in Ohio?
Pepper Pike has the Highest Percentage of Immigrants from Iran in Ohio with 2.33%.
What is the Percentage of Immigrants from Iran in the State of Ohio?
Percentage of Immigrants from Iran in Ohio is 0.030%.
What is the Percentage of Immigrants from Iran in the United States?
Percentage of Immigrants from Iran in the United States is 0.12%.