Cities with the Highest Percentage of Korean Population in Ohio
RELATED REPORTS & OPTIONS
Korean
Ohio
Compare Cities
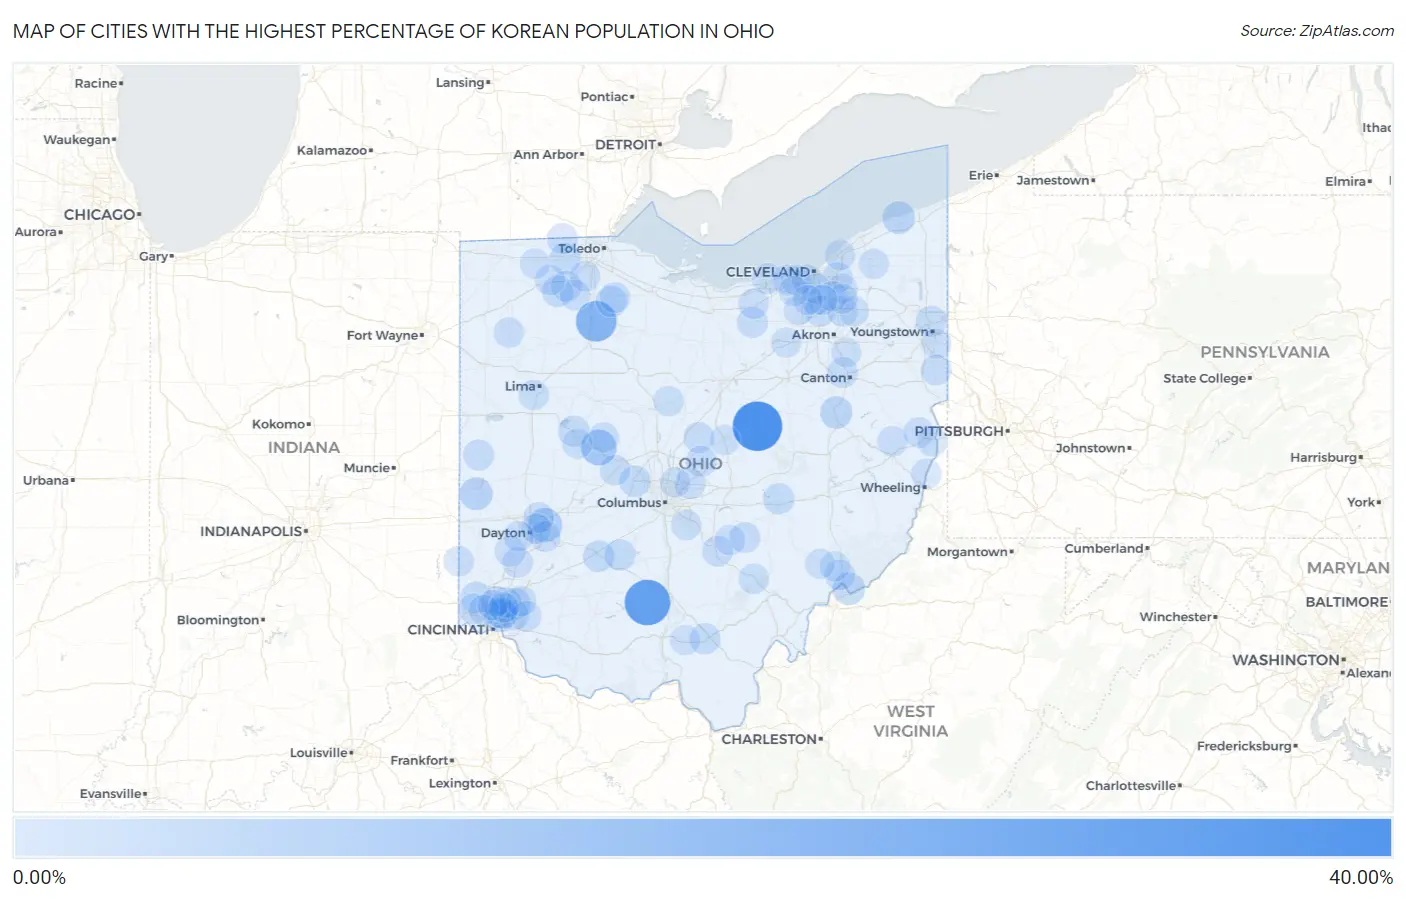
Map of Cities with the Highest Percentage of Korean Population in Ohio
0.00%
40.00%
Cities with the Highest Percentage of Korean Population in Ohio
| City | Korean | vs State | vs National | |
| 1. | Gann Brinkhaven | 36.75% | 0.38%(+36.4)#1 | 1.31%(+35.4)#44 |
| 2. | Bourneville | 29.47% | 0.38%(+29.1)#2 | 1.31%(+28.2)#71 |
| 3. | Bairdstown | 20.18% | 0.38%(+19.8)#3 | 1.31%(+18.9)#126 |
| 4. | East Liberty | 10.89% | 0.38%(+10.5)#4 | 1.31%(+9.58)#247 |
| 5. | Wright Patterson Afb | 8.17% | 0.38%(+7.79)#5 | 1.31%(+6.86)#349 |
| 6. | Maria Stein | 7.19% | 0.38%(+6.82)#6 | 1.31%(+5.88)#420 |
| 7. | Sullivan | 6.80% | 0.38%(+6.43)#7 | 1.31%(+5.49)#448 |
| 8. | Wayne Lakes | 5.68% | 0.38%(+5.31)#8 | 1.31%(+4.37)#580 |
| 9. | Geneva On The Lake | 5.16% | 0.38%(+4.78)#9 | 1.31%(+3.85)#663 |
| 10. | Reno | 4.86% | 0.38%(+4.49)#10 | 1.31%(+3.55)#724 |
| 11. | Parral | 4.48% | 0.38%(+4.11)#11 | 1.31%(+3.17)#796 |
| 12. | Golf Manor | 3.86% | 0.38%(+3.48)#12 | 1.31%(+2.55)#970 |
| 13. | Wayne | 3.43% | 0.38%(+3.05)#13 | 1.31%(+2.12)#1,130 |
| 14. | Milledgeville | 3.37% | 0.38%(+2.99)#14 | 1.31%(+2.06)#1,163 |
| 15. | Sixteen Mile Stand | 3.32% | 0.38%(+2.94)#15 | 1.31%(+2.01)#1,181 |
| 16. | Ross | 3.19% | 0.38%(+2.81)#16 | 1.31%(+1.88)#1,236 |
| 17. | Plain City | 3.10% | 0.38%(+2.72)#17 | 1.31%(+1.79)#1,280 |
| 18. | Mcclure | 3.05% | 0.38%(+2.67)#18 | 1.31%(+1.74)#1,303 |
| 19. | Swanton | 2.95% | 0.38%(+2.57)#19 | 1.31%(+1.64)#1,357 |
| 20. | Huntsville | 2.94% | 0.38%(+2.56)#20 | 1.31%(+1.63)#1,364 |
| 21. | North Zanesville | 2.73% | 0.38%(+2.36)#21 | 1.31%(+1.42)#1,498 |
| 22. | Jackson | 2.73% | 0.38%(+2.35)#22 | 1.31%(+1.42)#1,500 |
| 23. | Bloomingburg | 2.73% | 0.38%(+2.35)#23 | 1.31%(+1.42)#1,505 |
| 24. | Churchill | 2.41% | 0.38%(+2.03)#24 | 1.31%(+1.10)#1,702 |
| 25. | Rossburg | 2.35% | 0.38%(+1.98)#25 | 1.31%(+1.04)#1,747 |
| 26. | Sparta | 2.29% | 0.38%(+1.91)#26 | 1.31%(+0.976)#1,814 |
| 27. | Metamora | 2.24% | 0.38%(+1.86)#27 | 1.31%(+0.930)#1,851 |
| 28. | Sheffield | 2.18% | 0.38%(+1.80)#28 | 1.31%(+0.868)#1,913 |
| 29. | Beavercreek | 2.16% | 0.38%(+1.78)#29 | 1.31%(+0.846)#1,932 |
| 30. | Grand Rapids | 2.13% | 0.38%(+1.75)#30 | 1.31%(+0.820)#1,957 |
| 31. | New Waterford | 2.01% | 0.38%(+1.63)#31 | 1.31%(+0.697)#2,091 |
| 32. | Hartford Croton | 2.00% | 0.38%(+1.62)#32 | 1.31%(+0.690)#2,097 |
| 33. | Sugar Grove | 1.98% | 0.38%(+1.60)#33 | 1.31%(+0.667)#2,119 |
| 34. | Brooklyn | 1.97% | 0.38%(+1.59)#34 | 1.31%(+0.662)#2,128 |
| 35. | Hills And Dales | 1.97% | 0.38%(+1.59)#35 | 1.31%(+0.659)#2,133 |
| 36. | Richfield | 1.94% | 0.38%(+1.56)#36 | 1.31%(+0.626)#2,164 |
| 37. | Huber Heights | 1.87% | 0.38%(+1.50)#37 | 1.31%(+0.565)#2,243 |
| 38. | Arlington Heights | 1.87% | 0.38%(+1.49)#38 | 1.31%(+0.558)#2,256 |
| 39. | Wellington | 1.87% | 0.38%(+1.49)#39 | 1.31%(+0.557)#2,260 |
| 40. | Junction City | 1.86% | 0.38%(+1.48)#40 | 1.31%(+0.551)#2,273 |
| 41. | Taylor Creek | 1.86% | 0.38%(+1.48)#41 | 1.31%(+0.547)#2,279 |
| 42. | Milford Center | 1.84% | 0.38%(+1.46)#42 | 1.31%(+0.528)#2,301 |
| 43. | Devola | 1.84% | 0.38%(+1.46)#43 | 1.31%(+0.526)#2,305 |
| 44. | Bremen | 1.78% | 0.38%(+1.40)#44 | 1.31%(+0.466)#2,386 |
| 45. | The Village Of Indian Hill | 1.75% | 0.38%(+1.37)#45 | 1.31%(+0.442)#2,431 |
| 46. | College Corner | 1.69% | 0.38%(+1.32)#46 | 1.31%(+0.385)#2,519 |
| 47. | Franklin | 1.67% | 0.38%(+1.29)#47 | 1.31%(+0.361)#2,561 |
| 48. | Westlake | 1.66% | 0.38%(+1.28)#48 | 1.31%(+0.350)#2,579 |
| 49. | Weston | 1.66% | 0.38%(+1.28)#49 | 1.31%(+0.346)#2,582 |
| 50. | Oberlin | 1.65% | 0.38%(+1.27)#50 | 1.31%(+0.338)#2,594 |
| 51. | Bradner | 1.63% | 0.38%(+1.25)#51 | 1.31%(+0.318)#2,636 |
| 52. | Woodmere | 1.61% | 0.38%(+1.23)#52 | 1.31%(+0.301)#2,666 |
| 53. | Hudson | 1.60% | 0.38%(+1.22)#53 | 1.31%(+0.285)#2,686 |
| 54. | Yorkville | 1.56% | 0.38%(+1.19)#54 | 1.31%(+0.254)#2,743 |
| 55. | Germantown | 1.56% | 0.38%(+1.18)#55 | 1.31%(+0.246)#2,763 |
| 56. | Jewett | 1.54% | 0.38%(+1.17)#56 | 1.31%(+0.234)#2,786 |
| 57. | Amberley | 1.49% | 0.38%(+1.11)#57 | 1.31%(+0.181)#2,883 |
| 58. | New Albany | 1.48% | 0.38%(+1.11)#58 | 1.31%(+0.173)#2,899 |
| 59. | Riverside | 1.45% | 0.38%(+1.07)#59 | 1.31%(+0.136)#2,971 |
| 60. | Brunswick | 1.44% | 0.38%(+1.07)#60 | 1.31%(+0.135)#2,975 |
| 61. | Broadview Heights | 1.44% | 0.38%(+1.07)#61 | 1.31%(+0.133)#2,980 |
| 62. | Richmond | 1.44% | 0.38%(+1.06)#62 | 1.31%(+0.131)#2,983 |
| 63. | Haskins | 1.44% | 0.38%(+1.06)#63 | 1.31%(+0.131)#2,985 |
| 64. | Sharonville | 1.43% | 0.38%(+1.06)#64 | 1.31%(+0.123)#3,003 |
| 65. | Liberty Center | 1.43% | 0.38%(+1.05)#65 | 1.31%(+0.117)#3,015 |
| 66. | Fairview Park | 1.41% | 0.38%(+1.03)#66 | 1.31%(+0.102)#3,049 |
| 67. | Springdale | 1.40% | 0.38%(+1.02)#67 | 1.31%(+0.091)#3,067 |
| 68. | Steubenville | 1.40% | 0.38%(+1.02)#68 | 1.31%(+0.088)#3,073 |
| 69. | Mount Repose | 1.36% | 0.38%(+0.981)#69 | 1.31%(+0.049)#3,159 |
| 70. | Caledonia | 1.35% | 0.38%(+0.973)#70 | 1.31%(+0.041)#3,182 |
| 71. | Loveland Park | 1.32% | 0.38%(+0.938)#71 | 1.31%(+0.006)#3,256 |
| 72. | Oakwood | 1.30% | 0.38%(+0.917)#72 | 1.31%(-0.015)#3,309 |
| 73. | Fort Shawnee | 1.29% | 0.38%(+0.908)#73 | 1.31%(-0.024)#3,335 |
| 74. | Streetsboro | 1.28% | 0.38%(+0.900)#74 | 1.31%(-0.032)#3,348 |
| 75. | Groesbeck | 1.28% | 0.38%(+0.899)#75 | 1.31%(-0.033)#3,350 |
| 76. | Wickliffe | 1.26% | 0.38%(+0.886)#76 | 1.31%(-0.046)#3,377 |
| 77. | Lithopolis | 1.25% | 0.38%(+0.872)#77 | 1.31%(-0.060)#3,401 |
| 78. | West Mansfield | 1.25% | 0.38%(+0.869)#78 | 1.31%(-0.063)#3,406 |
| 79. | Drexel | 1.25% | 0.38%(+0.868)#79 | 1.31%(-0.065)#3,410 |
| 80. | Nelsonville | 1.24% | 0.38%(+0.864)#80 | 1.31%(-0.068)#3,417 |
| 81. | Greenhills | 1.22% | 0.38%(+0.837)#81 | 1.31%(-0.095)#3,470 |
| 82. | Bellefontaine | 1.21% | 0.38%(+0.834)#82 | 1.31%(-0.099)#3,477 |
| 83. | Lowell | 1.19% | 0.38%(+0.808)#83 | 1.31%(-0.124)#3,538 |
| 84. | Beverly | 1.16% | 0.38%(+0.780)#84 | 1.31%(-0.152)#3,608 |
| 85. | Westfield Center | 1.14% | 0.38%(+0.765)#85 | 1.31%(-0.167)#3,647 |
| 86. | Aquilla | 1.13% | 0.38%(+0.750)#86 | 1.31%(-0.182)#3,683 |
| 87. | Solon | 1.12% | 0.38%(+0.740)#87 | 1.31%(-0.192)#3,705 |
| 88. | Seven Hills | 1.10% | 0.38%(+0.726)#88 | 1.31%(-0.206)#3,738 |
| 89. | Northfield | 1.10% | 0.38%(+0.722)#89 | 1.31%(-0.210)#3,755 |
| 90. | Beaver | 1.08% | 0.38%(+0.702)#90 | 1.31%(-0.230)#3,817 |
| 91. | Berea | 1.06% | 0.38%(+0.679)#91 | 1.31%(-0.253)#3,890 |
| 92. | Twinsburg | 1.05% | 0.38%(+0.669)#92 | 1.31%(-0.263)#3,915 |
| 93. | Brecksville | 1.04% | 0.38%(+0.657)#93 | 1.31%(-0.275)#3,950 |
| 94. | Evendale | 1.01% | 0.38%(+0.636)#94 | 1.31%(-0.296)#4,020 |
| 95. | Huber Ridge | 1.00% | 0.38%(+0.622)#95 | 1.31%(-0.310)#4,070 |
| 96. | Wauseon | 0.99% | 0.38%(+0.608)#96 | 1.31%(-0.324)#4,105 |
| 97. | Mount Vernon | 0.98% | 0.38%(+0.601)#97 | 1.31%(-0.331)#4,141 |
| 98. | North Royalton | 0.94% | 0.38%(+0.560)#98 | 1.31%(-0.372)#4,263 |
| 99. | Uniontown | 0.94% | 0.38%(+0.558)#99 | 1.31%(-0.374)#4,276 |
| 100. | Poland | 0.93% | 0.38%(+0.555)#100 | 1.31%(-0.377)#4,289 |
Common Questions
What are the Top 10 Cities with the Highest Percentage of Korean Population in Ohio?
Top 10 Cities with the Highest Percentage of Korean Population in Ohio are:
#1
36.75%
#2
29.47%
#3
20.18%
#4
10.89%
#5
8.17%
#6
5.68%
#7
5.16%
#8
4.86%
#9
4.48%
#10
3.86%
What city has the Highest Percentage of Korean Population in Ohio?
Gann Brinkhaven has the Highest Percentage of Korean Population in Ohio with 36.75%.
What is the Percentage of Korean Population in the State of Ohio?
Percentage of Korean Population in Ohio is 0.38%.
What is the Percentage of Korean Population in the United States?
Percentage of Korean Population in the United States is 1.31%.