The Village of Indian Hill, OH
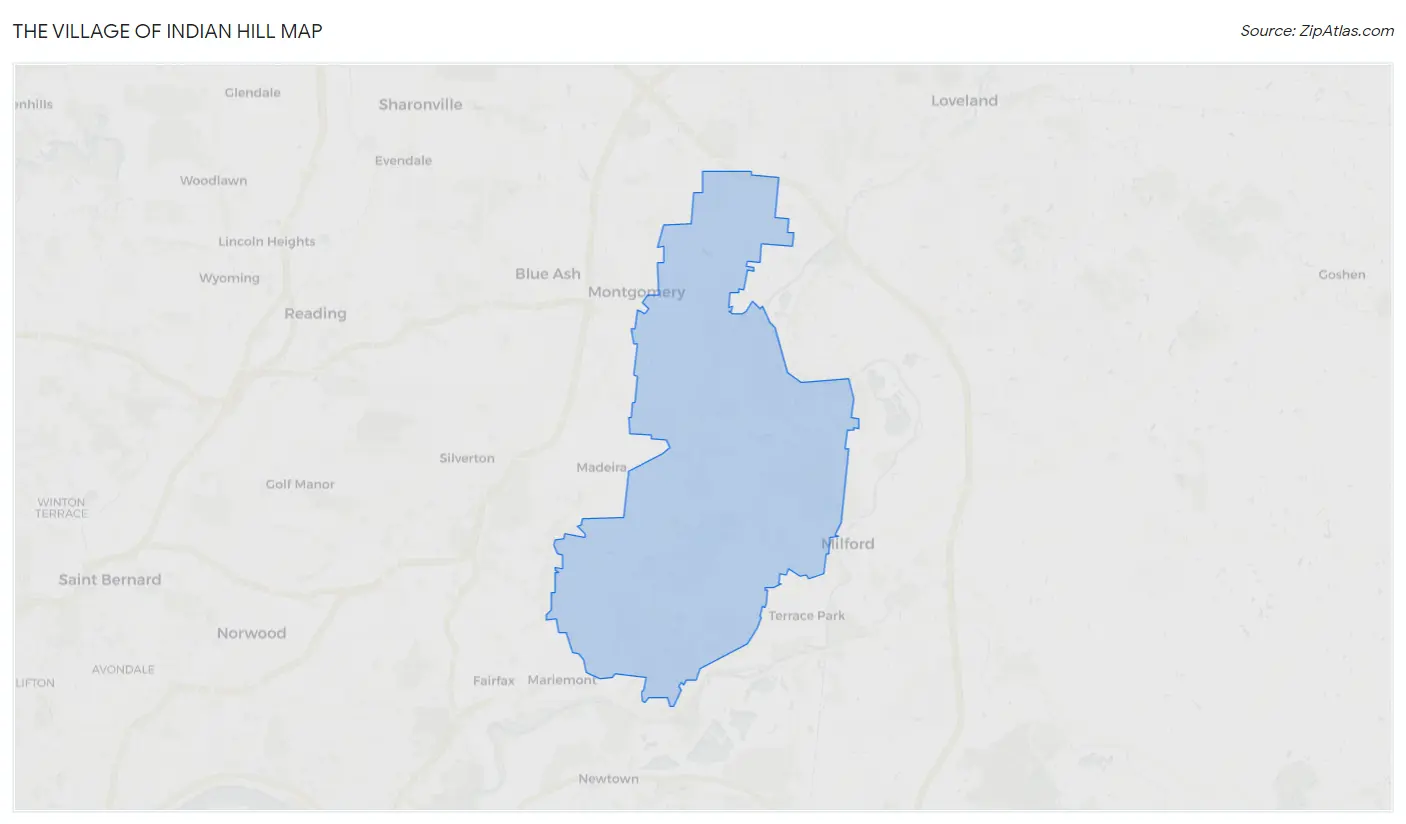
The Village of Indian Hill Map
The Village of Indian Hill Overview
6,051
TOTAL POPULATION
2,983
MALE POPULATION
3,068
FEMALE POPULATION
97.23
MALES / 100 FEMALES
102.85
FEMALES / 100 MALES
55.2
MEDIAN AGE
2.6
AVG FAMILY SIZE
2.5
AVG HOUSEHOLD SIZE
$153,530
PER CAPITA INCOME
$247,938
AVG FAMILY INCOME
$218,073
AVG HOUSEHOLD INCOME
73.0%
WAGE / INCOME GAP [ % ]
27.0¢/ $1
WAGE / INCOME GAP [ $ ]
0.51
INEQUALITY / GINI INDEX
2,642
LABOR FORCE [ PEOPLE ]
54.6%
PERCENT IN LABOR FORCE
2.6%
UNEMPLOYMENT RATE
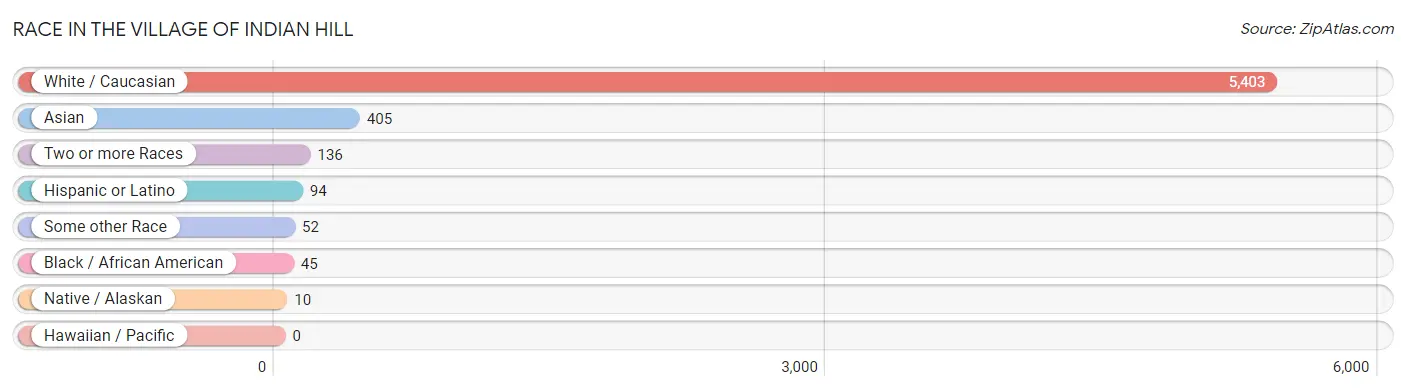
Race in The Village of Indian Hill
The most populous races in The Village of Indian Hill are White / Caucasian (5,403 | 89.3%), Asian (405 | 6.7%), and Two or more Races (136 | 2.2%).
| Race | # Population | % Population |
| Asian | 405 | 6.7% |
| Black / African American | 45 | 0.7% |
| Hawaiian / Pacific | 0 | 0.0% |
| Hispanic or Latino | 94 | 1.5% |
| Native / Alaskan | 10 | 0.2% |
| White / Caucasian | 5,403 | 89.3% |
| Two or more Races | 136 | 2.2% |
| Some other Race | 52 | 0.9% |
| Total | 6,051 | 100.0% |
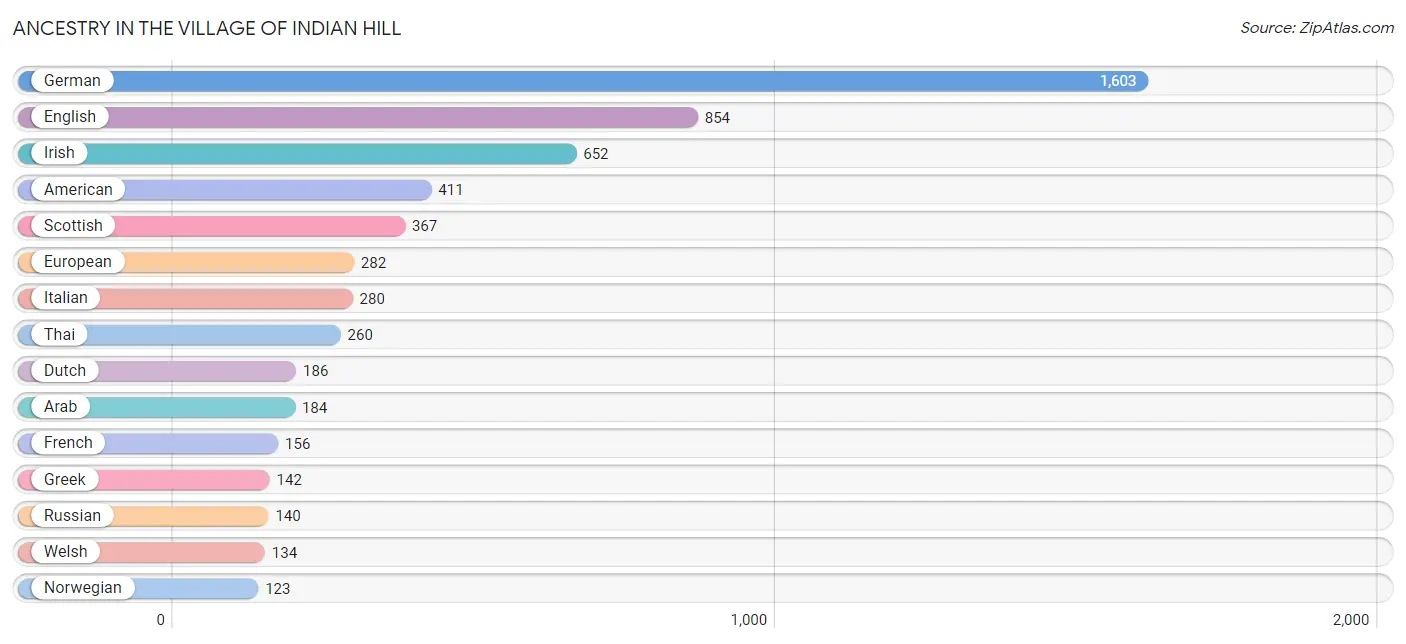
Ancestry in The Village of Indian Hill
The most populous ancestries reported in The Village of Indian Hill are German (1,603 | 26.5%), English (854 | 14.1%), Irish (652 | 10.8%), American (411 | 6.8%), and Scottish (367 | 6.1%), together accounting for 64.2% of all The Village of Indian Hill residents.
| Ancestry | # Population | % Population |
| American | 411 | 6.8% |
| Arab | 184 | 3.0% |
| Austrian | 2 | 0.0% |
| Bhutanese | 22 | 0.4% |
| Cherokee | 2 | 0.0% |
| Chippewa | 16 | 0.3% |
| Croatian | 46 | 0.8% |
| Cuban | 42 | 0.7% |
| Czech | 14 | 0.2% |
| Danish | 10 | 0.2% |
| Dutch | 186 | 3.1% |
| Eastern European | 54 | 0.9% |
| English | 854 | 14.1% |
| European | 282 | 4.7% |
| Filipino | 31 | 0.5% |
| Finnish | 29 | 0.5% |
| French | 156 | 2.6% |
| German | 1,603 | 26.5% |
| Greek | 142 | 2.4% |
| Indian (Asian) | 16 | 0.3% |
| Iranian | 25 | 0.4% |
| Irish | 652 | 10.8% |
| Italian | 280 | 4.6% |
| Jordanian | 20 | 0.3% |
| Korean | 106 | 1.8% |
| Lebanese | 11 | 0.2% |
| Lithuanian | 18 | 0.3% |
| Mexican | 38 | 0.6% |
| Norwegian | 123 | 2.0% |
| Polish | 37 | 0.6% |
| Romanian | 8 | 0.1% |
| Russian | 140 | 2.3% |
| Scandinavian | 25 | 0.4% |
| Scotch-Irish | 70 | 1.2% |
| Scottish | 367 | 6.1% |
| Slovak | 19 | 0.3% |
| Slovene | 15 | 0.3% |
| Spaniard | 14 | 0.2% |
| Swedish | 21 | 0.4% |
| Syrian | 20 | 0.3% |
| Thai | 260 | 4.3% |
| Turkish | 14 | 0.2% |
| Welsh | 134 | 2.2% | View All 43 Rows |
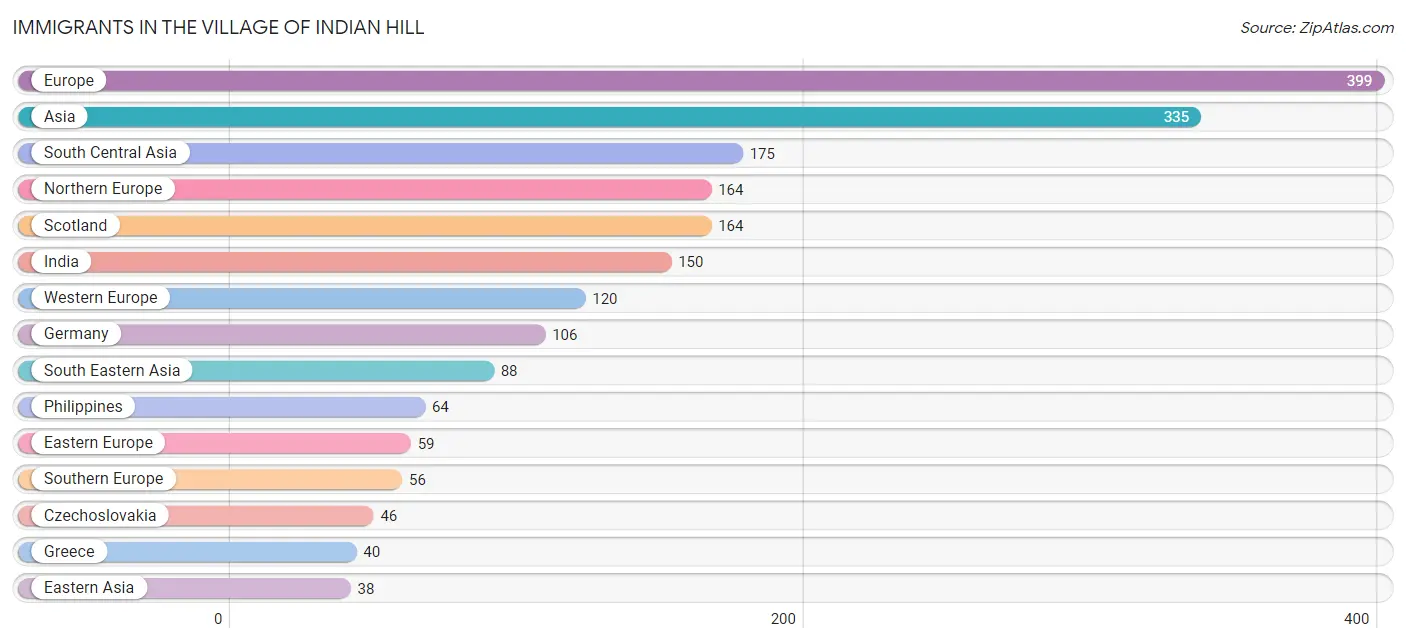
Immigrants in The Village of Indian Hill
The most numerous immigrant groups reported in The Village of Indian Hill came from Europe (399 | 6.6%), Asia (335 | 5.5%), South Central Asia (175 | 2.9%), Northern Europe (164 | 2.7%), and Scotland (164 | 2.7%), together accounting for 20.4% of all The Village of Indian Hill residents.
| Immigration Origin | # Population | % Population |
| Africa | 33 | 0.5% |
| Asia | 335 | 5.5% |
| Canada | 10 | 0.2% |
| China | 31 | 0.5% |
| Czechoslovakia | 46 | 0.8% |
| Eastern Africa | 33 | 0.5% |
| Eastern Asia | 38 | 0.6% |
| Eastern Europe | 59 | 1.0% |
| Europe | 399 | 6.6% |
| Germany | 106 | 1.8% |
| Greece | 40 | 0.7% |
| India | 150 | 2.5% |
| Iran | 25 | 0.4% |
| Japan | 7 | 0.1% |
| Jordan | 20 | 0.3% |
| Netherlands | 14 | 0.2% |
| Northern Europe | 164 | 2.7% |
| Philippines | 64 | 1.1% |
| Russia | 13 | 0.2% |
| Scotland | 164 | 2.7% |
| Singapore | 24 | 0.4% |
| South Central Asia | 175 | 2.9% |
| South Eastern Asia | 88 | 1.5% |
| Southern Europe | 56 | 0.9% |
| Spain | 16 | 0.3% |
| Taiwan | 31 | 0.5% |
| Turkey | 14 | 0.2% |
| Western Asia | 34 | 0.6% |
| Western Europe | 120 | 2.0% | View All 29 Rows |
Sex and Age in The Village of Indian Hill
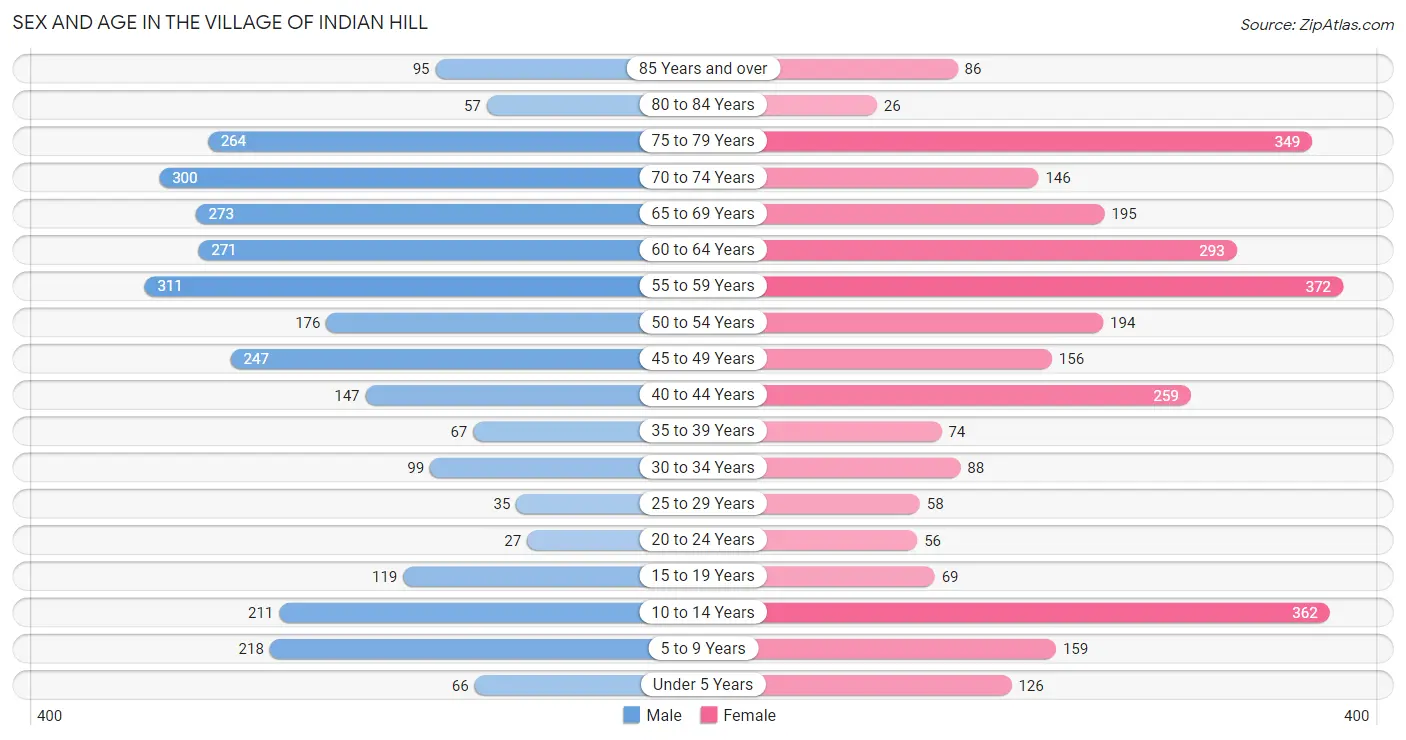
Sex and Age in The Village of Indian Hill
The most populous age groups in The Village of Indian Hill are 55 to 59 Years (311 | 10.4%) for men and 55 to 59 Years (372 | 12.1%) for women.
| Age Bracket | Male | Female |
| Under 5 Years | 66 (2.2%) | 126 (4.1%) |
| 5 to 9 Years | 218 (7.3%) | 159 (5.2%) |
| 10 to 14 Years | 211 (7.1%) | 362 (11.8%) |
| 15 to 19 Years | 119 (4.0%) | 69 (2.2%) |
| 20 to 24 Years | 27 (0.9%) | 56 (1.8%) |
| 25 to 29 Years | 35 (1.2%) | 58 (1.9%) |
| 30 to 34 Years | 99 (3.3%) | 88 (2.9%) |
| 35 to 39 Years | 67 (2.2%) | 74 (2.4%) |
| 40 to 44 Years | 147 (4.9%) | 259 (8.4%) |
| 45 to 49 Years | 247 (8.3%) | 156 (5.1%) |
| 50 to 54 Years | 176 (5.9%) | 194 (6.3%) |
| 55 to 59 Years | 311 (10.4%) | 372 (12.1%) |
| 60 to 64 Years | 271 (9.1%) | 293 (9.6%) |
| 65 to 69 Years | 273 (9.1%) | 195 (6.4%) |
| 70 to 74 Years | 300 (10.1%) | 146 (4.8%) |
| 75 to 79 Years | 264 (8.8%) | 349 (11.4%) |
| 80 to 84 Years | 57 (1.9%) | 26 (0.9%) |
| 85 Years and over | 95 (3.2%) | 86 (2.8%) |
| Total | 2,983 (100.0%) | 3,068 (100.0%) |
Families and Households in The Village of Indian Hill
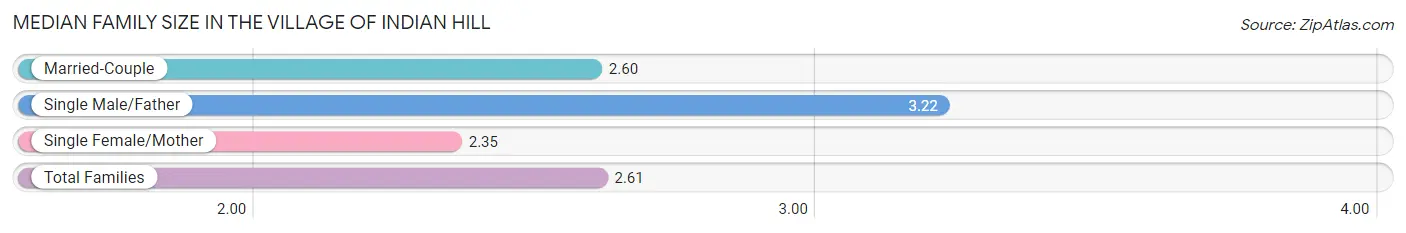
Median Family Size in The Village of Indian Hill
The median family size in The Village of Indian Hill is 2.61 persons per family, with single male/father families (64 | 2.9%) accounting for the largest median family size of 3.22 persons per family. On the other hand, single female/mother families (78 | 3.6%) represent the smallest median family size with 2.35 persons per family.
| Family Type | # Families | Family Size |
| Married-Couple | 2,049 (93.5%) | 2.60 |
| Single Male/Father | 64 (2.9%) | 3.22 |
| Single Female/Mother | 78 (3.6%) | 2.35 |
| Total Families | 2,191 (100.0%) | 2.61 |
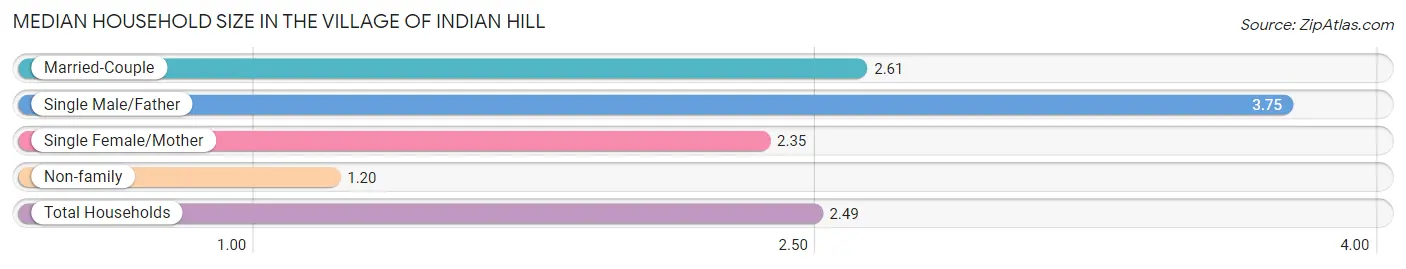
Median Household Size in The Village of Indian Hill
The median household size in The Village of Indian Hill is 2.49 persons per household, with single male/father households (64 | 2.6%) accounting for the largest median household size of 3.75 persons per household. non-family households (230 | 9.5%) represent the smallest median household size with 1.20 persons per household.
| Household Type | # Households | Household Size |
| Married-Couple | 2,049 (84.6%) | 2.61 |
| Single Male/Father | 64 (2.6%) | 3.75 |
| Single Female/Mother | 78 (3.2%) | 2.35 |
| Non-family | 230 (9.5%) | 1.20 |
| Total Households | 2,421 (100.0%) | 2.49 |
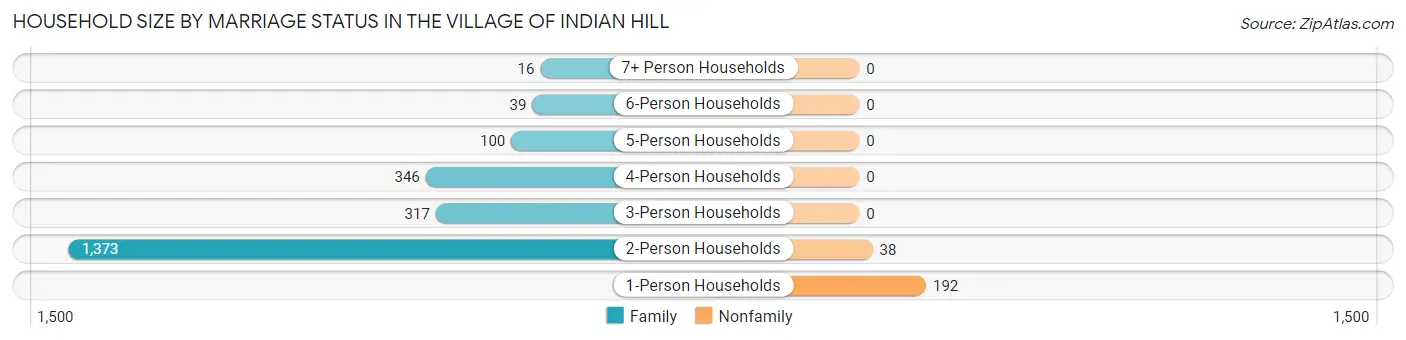
Household Size by Marriage Status in The Village of Indian Hill
Out of a total of 2,421 households in The Village of Indian Hill, 2,191 (90.5%) are family households, while 230 (9.5%) are nonfamily households. The most numerous type of family households are 2-person households, comprising 1,373, and the most common type of nonfamily households are 1-person households, comprising 192.
| Household Size | Family Households | Nonfamily Households |
| 1-Person Households | - | 192 (7.9%) |
| 2-Person Households | 1,373 (56.7%) | 38 (1.6%) |
| 3-Person Households | 317 (13.1%) | 0 (0.0%) |
| 4-Person Households | 346 (14.3%) | 0 (0.0%) |
| 5-Person Households | 100 (4.1%) | 0 (0.0%) |
| 6-Person Households | 39 (1.6%) | 0 (0.0%) |
| 7+ Person Households | 16 (0.7%) | 0 (0.0%) |
| Total | 2,191 (90.5%) | 230 (9.5%) |
Female Fertility in The Village of Indian Hill
Fertility by Age in The Village of Indian Hill
Average fertility rate in The Village of Indian Hill is 106.0 births per 1,000 women. Women in the age bracket of 20 to 34 years have the highest fertility rate with 158.0 births per 1,000 women. Women in the age bracket of 35 to 50 years acount for 61.5% of all women with births.
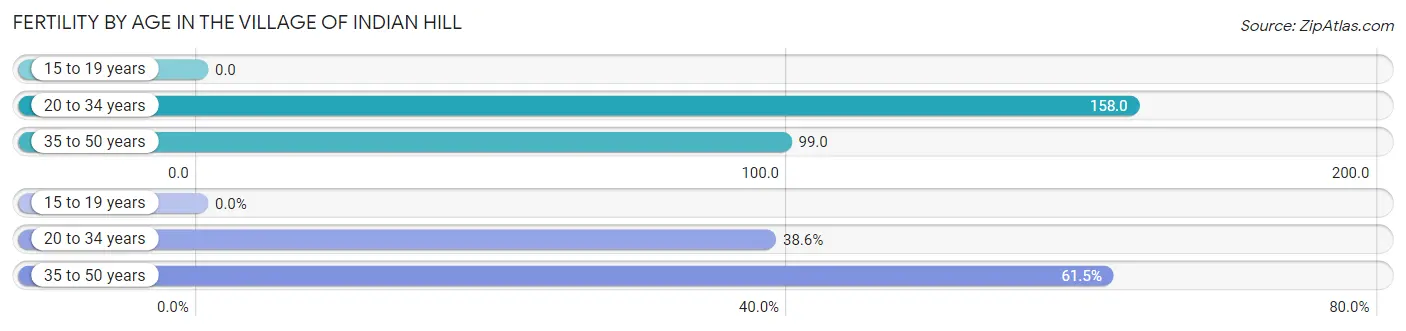
| Age Bracket | Women with Births | Births / 1,000 Women |
| 15 to 19 years | 0 (0.0%) | 0.0 |
| 20 to 34 years | 32 (38.6%) | 158.0 |
| 35 to 50 years | 51 (61.5%) | 99.0 |
| Total | 83 (100.0%) | 106.0 |
Fertility by Age by Marriage Status in The Village of Indian Hill
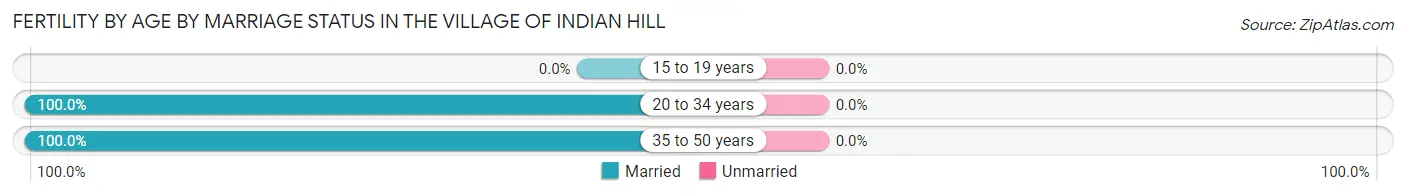
| Age Bracket | Married | Unmarried |
| 15 to 19 years | 0 (0.0%) | 0 (0.0%) |
| 20 to 34 years | 32 (100.0%) | 0 (0.0%) |
| 35 to 50 years | 51 (100.0%) | 0 (0.0%) |
| Total | 83 (100.0%) | 0 (0.0%) |
Fertility by Education in The Village of Indian Hill
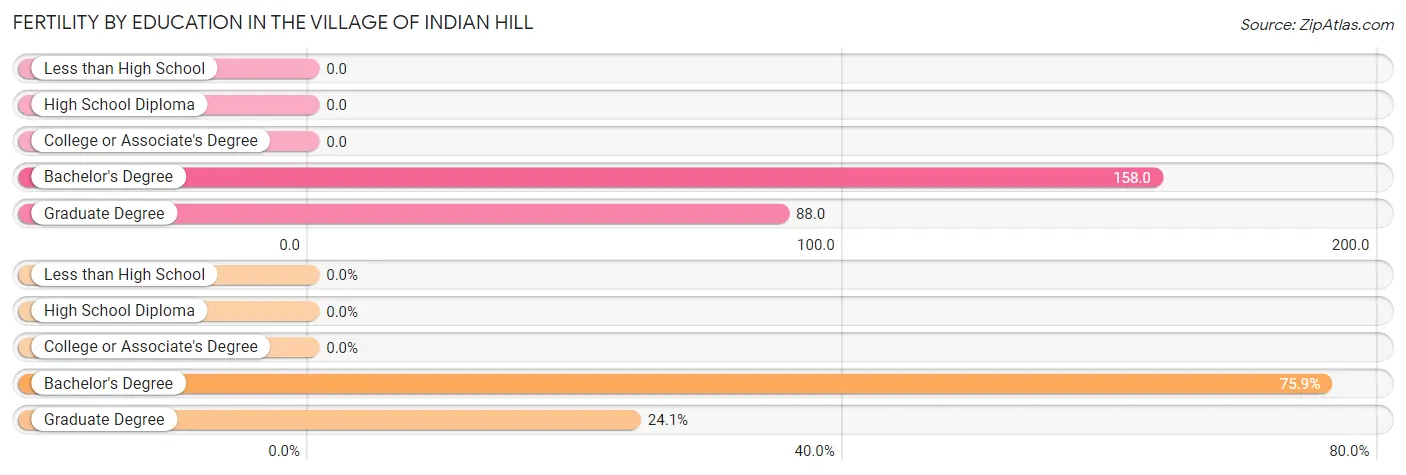
| Educational Attainment | Women with Births | Births / 1,000 Women |
| Less than High School | 0 (0.0%) | 0.0 |
| High School Diploma | 0 (0.0%) | 0.0 |
| College or Associate's Degree | 0 (0.0%) | 0.0 |
| Bachelor's Degree | 63 (75.9%) | 158.0 |
| Graduate Degree | 20 (24.1%) | 88.0 |
| Total | 83 (100.0%) | 106.0 |
Fertility by Education by Marriage Status in The Village of Indian Hill
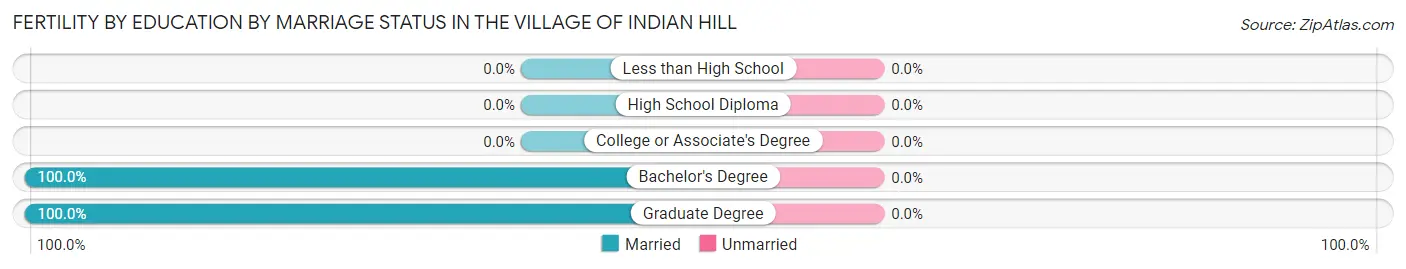
| Educational Attainment | Married | Unmarried |
| Less than High School | 0 (0.0%) | 0 (0.0%) |
| High School Diploma | 0 (0.0%) | 0 (0.0%) |
| College or Associate's Degree | 0 (0.0%) | 0 (0.0%) |
| Bachelor's Degree | 63 (100.0%) | 0 (0.0%) |
| Graduate Degree | 20 (100.0%) | 0 (0.0%) |
| Total | 83 (100.0%) | 0 (0.0%) |
Income in The Village of Indian Hill
Income Overview in The Village of Indian Hill
Per Capita Income in The Village of Indian Hill is $153,530, while median incomes of families and households are $247,938 and $218,073 respectively.
| Characteristic | Number | Measure |
| Per Capita Income | 6,051 | $153,530 |
| Median Family Income | 2,191 | $247,938 |
| Mean Family Income | 2,191 | $424,240 |
| Median Household Income | 2,421 | $218,073 |
| Mean Household Income | 2,421 | $399,251 |
| Income Deficit | 2,191 | $0 |
| Wage / Income Gap (%) | 6,051 | 73.05% |
| Wage / Income Gap ($) | 6,051 | 26.95¢ per $1 |
| Gini / Inequality Index | 6,051 | 0.51 |
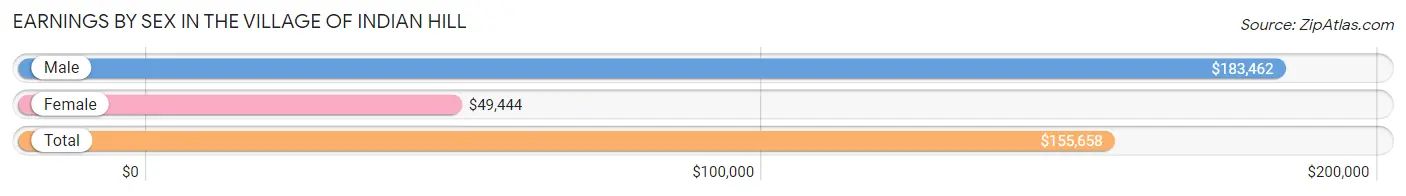
Earnings by Sex in The Village of Indian Hill
Average Earnings in The Village of Indian Hill are $155,658, $183,462 for men and $49,444 for women, a difference of 73.1%.
| Sex | Number | Average Earnings |
| Male | 1,770 (62.9%) | $183,462 |
| Female | 1,042 (37.1%) | $49,444 |
| Total | 2,812 (100.0%) | $155,658 |
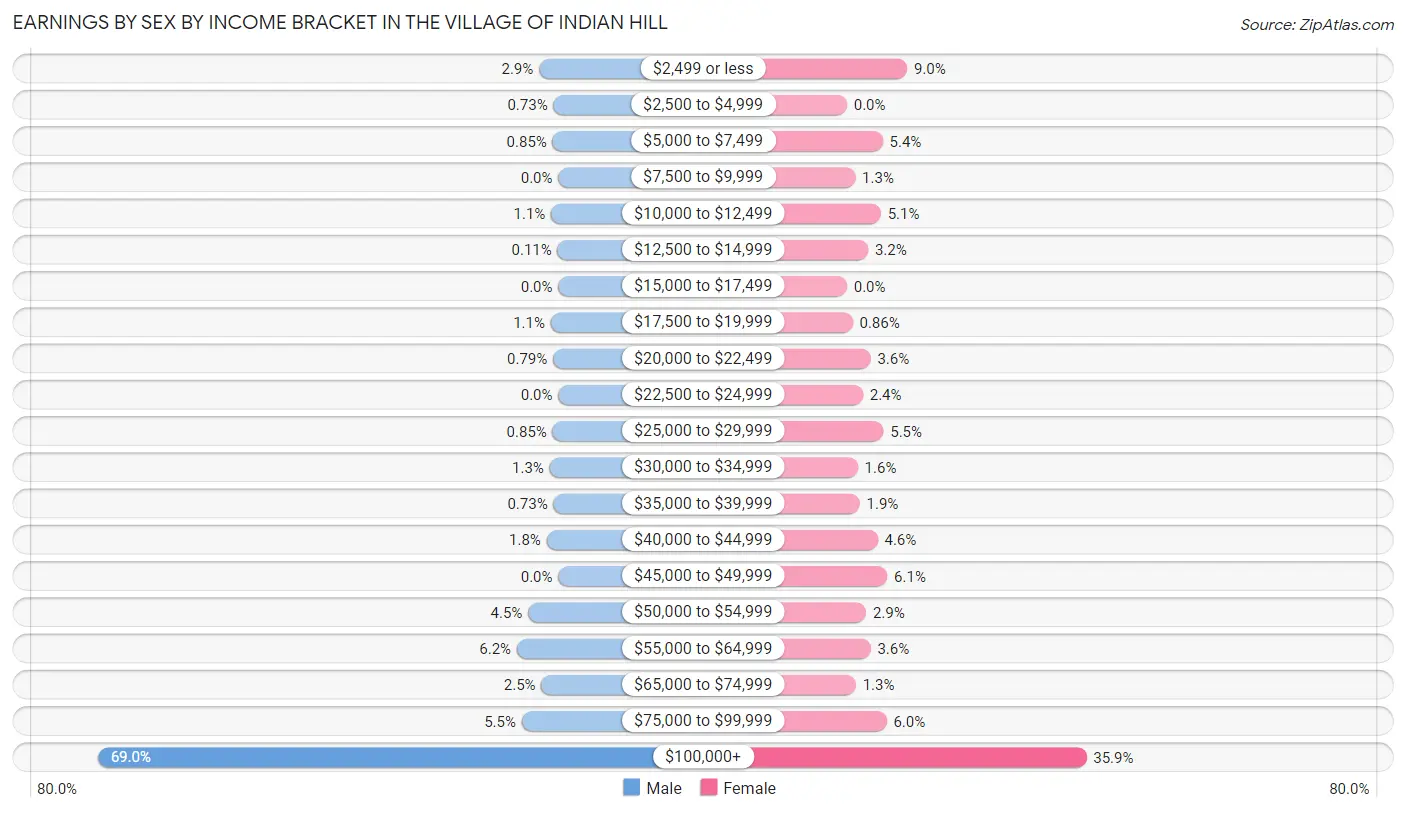
Earnings by Sex by Income Bracket in The Village of Indian Hill
The most common earnings brackets in The Village of Indian Hill are $100,000+ for men (1,222 | 69.0%) and $100,000+ for women (374 | 35.9%).
| Income | Male | Female |
| $2,499 or less | 51 (2.9%) | 94 (9.0%) |
| $2,500 to $4,999 | 13 (0.7%) | 0 (0.0%) |
| $5,000 to $7,499 | 15 (0.9%) | 56 (5.4%) |
| $7,500 to $9,999 | 0 (0.0%) | 13 (1.3%) |
| $10,000 to $12,499 | 19 (1.1%) | 53 (5.1%) |
| $12,500 to $14,999 | 2 (0.1%) | 33 (3.2%) |
| $15,000 to $17,499 | 0 (0.0%) | 0 (0.0%) |
| $17,500 to $19,999 | 20 (1.1%) | 9 (0.9%) |
| $20,000 to $22,499 | 14 (0.8%) | 37 (3.5%) |
| $22,500 to $24,999 | 0 (0.0%) | 25 (2.4%) |
| $25,000 to $29,999 | 15 (0.9%) | 57 (5.5%) |
| $30,000 to $34,999 | 23 (1.3%) | 17 (1.6%) |
| $35,000 to $39,999 | 13 (0.7%) | 20 (1.9%) |
| $40,000 to $44,999 | 31 (1.8%) | 48 (4.6%) |
| $45,000 to $49,999 | 0 (0.0%) | 63 (6.0%) |
| $50,000 to $54,999 | 80 (4.5%) | 30 (2.9%) |
| $55,000 to $64,999 | 110 (6.2%) | 37 (3.5%) |
| $65,000 to $74,999 | 45 (2.5%) | 14 (1.3%) |
| $75,000 to $99,999 | 97 (5.5%) | 62 (5.9%) |
| $100,000+ | 1,222 (69.0%) | 374 (35.9%) |
| Total | 1,770 (100.0%) | 1,042 (100.0%) |
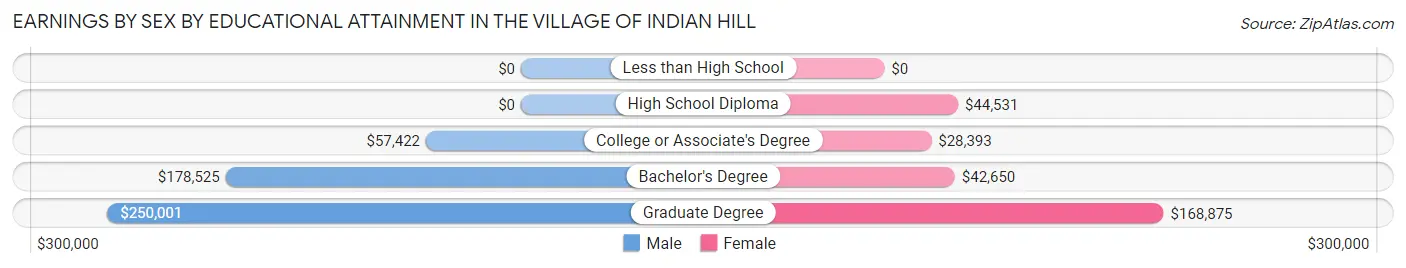
Earnings by Sex by Educational Attainment in The Village of Indian Hill
Average earnings in The Village of Indian Hill are $207,566 for men and $62,083 for women, a difference of 70.1%. Men with an educational attainment of graduate degree enjoy the highest average annual earnings of $250,001, while those with college or associate's degree education earn the least with $57,422. Women with an educational attainment of graduate degree earn the most with the average annual earnings of $168,875, while those with college or associate's degree education have the smallest earnings of $28,393.
| Educational Attainment | Male Income | Female Income |
| Less than High School | - | - |
| High School Diploma | - | - |
| College or Associate's Degree | $57,422 | $28,393 |
| Bachelor's Degree | $178,525 | $42,650 |
| Graduate Degree | $250,001 | $168,875 |
| Total | $207,566 | $62,083 |
Family Income in The Village of Indian Hill
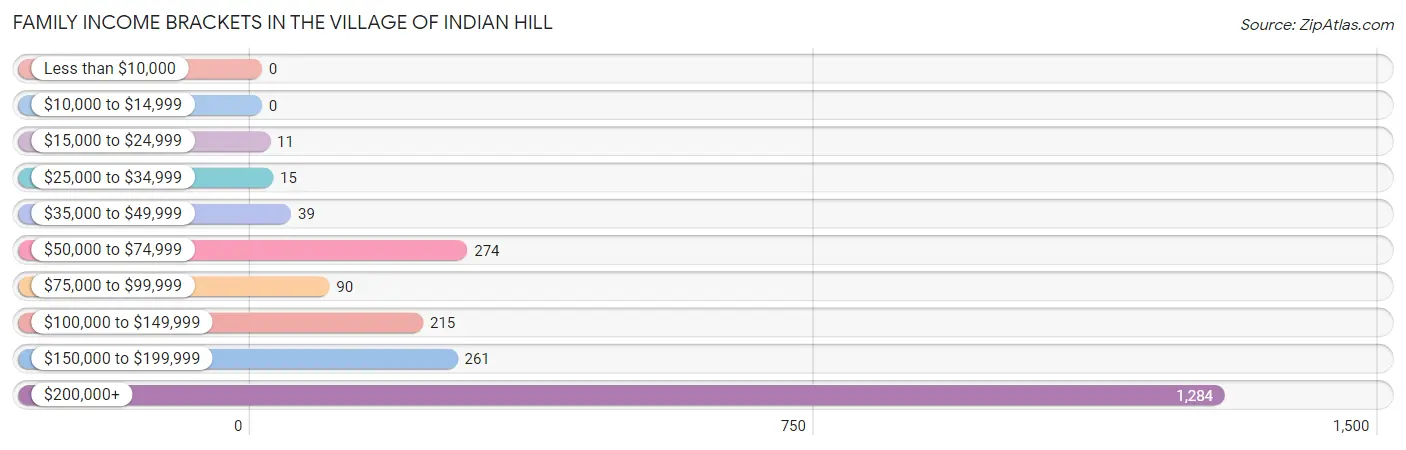
Family Income Brackets in The Village of Indian Hill
According to the The Village of Indian Hill family income data, there are 1,284 families falling into the $200,000+ income range, which is the most common income bracket and makes up 58.6% of all families.
| Income Bracket | # Families | % Families |
| Less than $10,000 | 0 | 0.0% |
| $10,000 to $14,999 | 0 | 0.0% |
| $15,000 to $24,999 | 11 | 0.5% |
| $25,000 to $34,999 | 15 | 0.7% |
| $35,000 to $49,999 | 39 | 1.8% |
| $50,000 to $74,999 | 274 | 12.5% |
| $75,000 to $99,999 | 90 | 4.1% |
| $100,000 to $149,999 | 215 | 9.8% |
| $150,000 to $199,999 | 261 | 11.9% |
| $200,000+ | 1,284 | 58.6% |
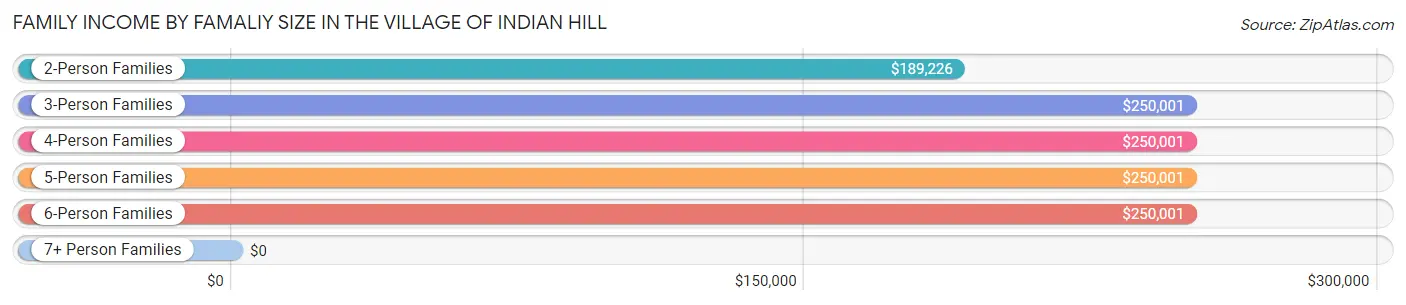
Family Income by Famaliy Size in The Village of Indian Hill
3-person families (316 | 14.4%) account for the highest median family income in The Village of Indian Hill with $250,001 per family, while 2-person families (1,401 | 63.9%) have the highest median income of $94,613 per family member.
| Income Bracket | # Families | Median Income |
| 2-Person Families | 1,401 (63.9%) | $189,226 |
| 3-Person Families | 316 (14.4%) | $250,001 |
| 4-Person Families | 319 (14.6%) | $250,001 |
| 5-Person Families | 100 (4.6%) | $250,001 |
| 6-Person Families | 39 (1.8%) | $250,001 |
| 7+ Person Families | 16 (0.7%) | $0 |
| Total | 2,191 (100.0%) | $247,938 |
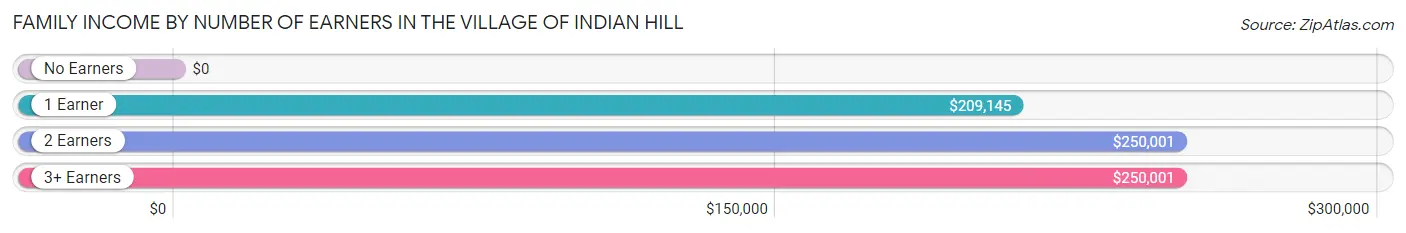
Family Income by Number of Earners in The Village of Indian Hill
| Number of Earners | # Families | Median Income |
| No Earners | 515 (23.5%) | $0 |
| 1 Earner | 799 (36.5%) | $209,145 |
| 2 Earners | 717 (32.7%) | $250,001 |
| 3+ Earners | 160 (7.3%) | $250,001 |
| Total | 2,191 (100.0%) | $247,938 |
Household Income in The Village of Indian Hill
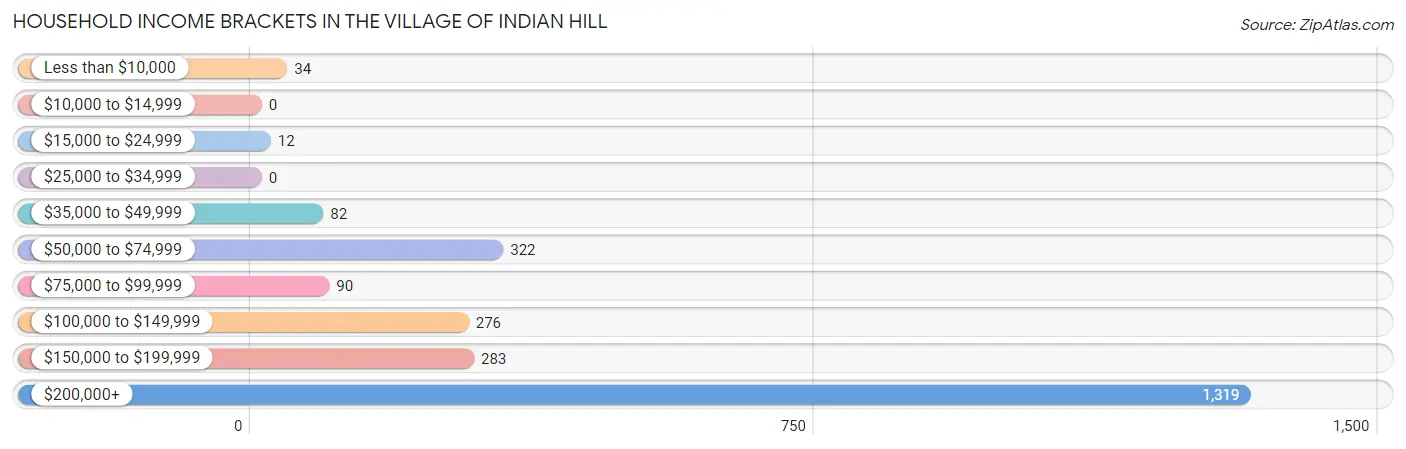
Household Income Brackets in The Village of Indian Hill
With 1,319 households falling in the category, the $200,000+ income range is the most frequent in The Village of Indian Hill, accounting for 54.5% of all households.
| Income Bracket | # Households | % Households |
| Less than $10,000 | 34 | 1.4% |
| $10,000 to $14,999 | 0 | 0.0% |
| $15,000 to $24,999 | 12 | 0.5% |
| $25,000 to $34,999 | 0 | 0.0% |
| $35,000 to $49,999 | 82 | 3.4% |
| $50,000 to $74,999 | 322 | 13.3% |
| $75,000 to $99,999 | 90 | 3.7% |
| $100,000 to $149,999 | 276 | 11.4% |
| $150,000 to $199,999 | 283 | 11.7% |
| $200,000+ | 1,319 | 54.5% |
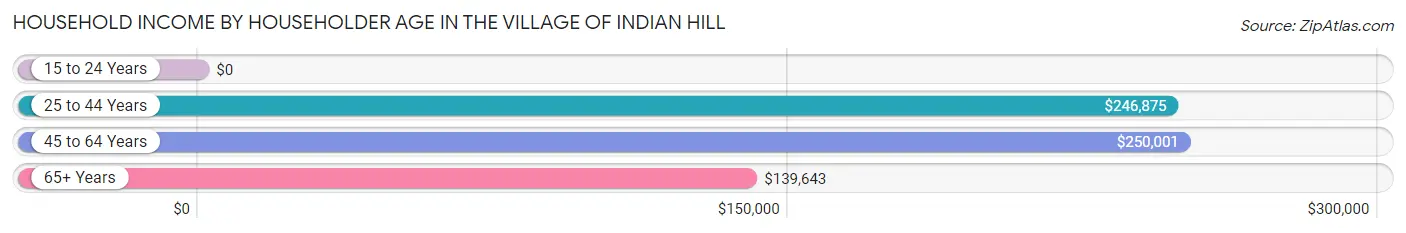
Household Income by Householder Age in The Village of Indian Hill
The median household income in The Village of Indian Hill is $218,073, with the highest median household income of $250,001 found in the 45 to 64 years age bracket for the primary householder. A total of 1,090 households (45.0%) fall into this category.
| Income Bracket | # Households | Median Income |
| 15 to 24 Years | 0 (0.0%) | $0 |
| 25 to 44 Years | 371 (15.3%) | $246,875 |
| 45 to 64 Years | 1,090 (45.0%) | $250,001 |
| 65+ Years | 960 (39.7%) | $139,643 |
| Total | 2,421 (100.0%) | $218,073 |
Poverty in The Village of Indian Hill
Income Below Poverty by Sex and Age in The Village of Indian Hill
With 0.7% poverty level for males and 1.8% for females among the residents of The Village of Indian Hill, 18 to 24 year old males and 18 to 24 year old females are the most vulnerable to poverty, with 2 males (4.4%) and 4 females (7.1%) in their respective age groups living below the poverty level.
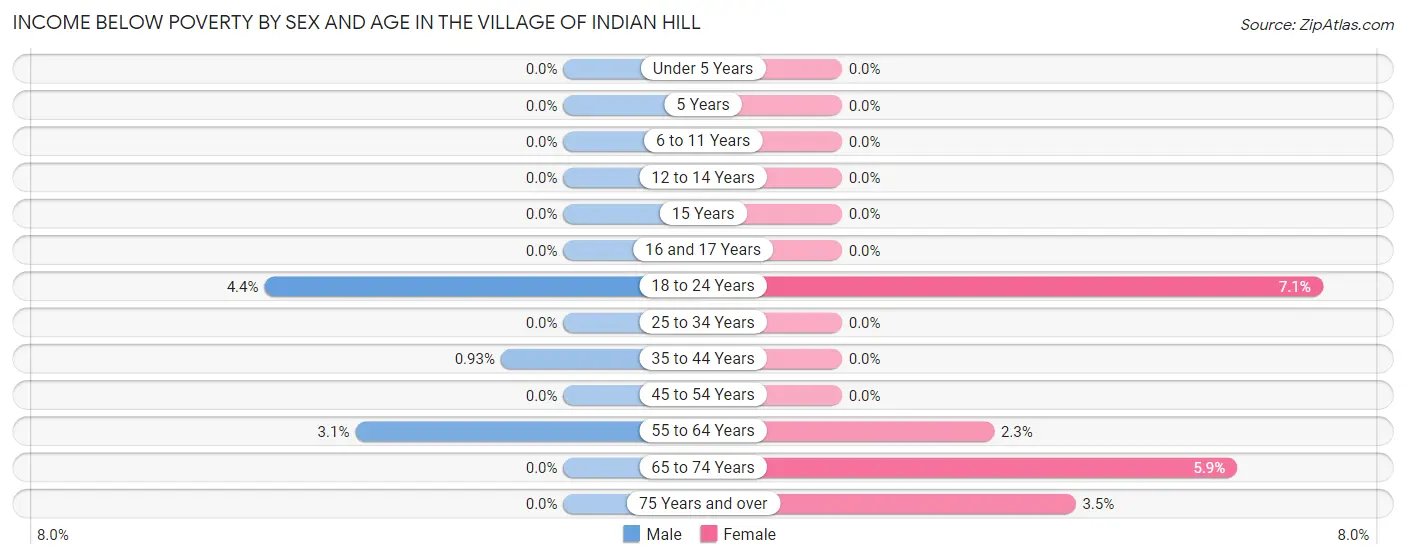
| Age Bracket | Male | Female |
| Under 5 Years | 0 (0.0%) | 0 (0.0%) |
| 5 Years | 0 (0.0%) | 0 (0.0%) |
| 6 to 11 Years | 0 (0.0%) | 0 (0.0%) |
| 12 to 14 Years | 0 (0.0%) | 0 (0.0%) |
| 15 Years | 0 (0.0%) | 0 (0.0%) |
| 16 and 17 Years | 0 (0.0%) | 0 (0.0%) |
| 18 to 24 Years | 2 (4.4%) | 4 (7.1%) |
| 25 to 34 Years | 0 (0.0%) | 0 (0.0%) |
| 35 to 44 Years | 2 (0.9%) | 0 (0.0%) |
| 45 to 54 Years | 0 (0.0%) | 0 (0.0%) |
| 55 to 64 Years | 18 (3.1%) | 15 (2.3%) |
| 65 to 74 Years | 0 (0.0%) | 20 (5.9%) |
| 75 Years and over | 0 (0.0%) | 16 (3.5%) |
| Total | 22 (0.7%) | 55 (1.8%) |
Income Above Poverty by Sex and Age in The Village of Indian Hill
According to the poverty statistics in The Village of Indian Hill, males aged under 5 years and females aged under 5 years are the age groups that are most secure financially, with 100.0% of males and 100.0% of females in these age groups living above the poverty line.
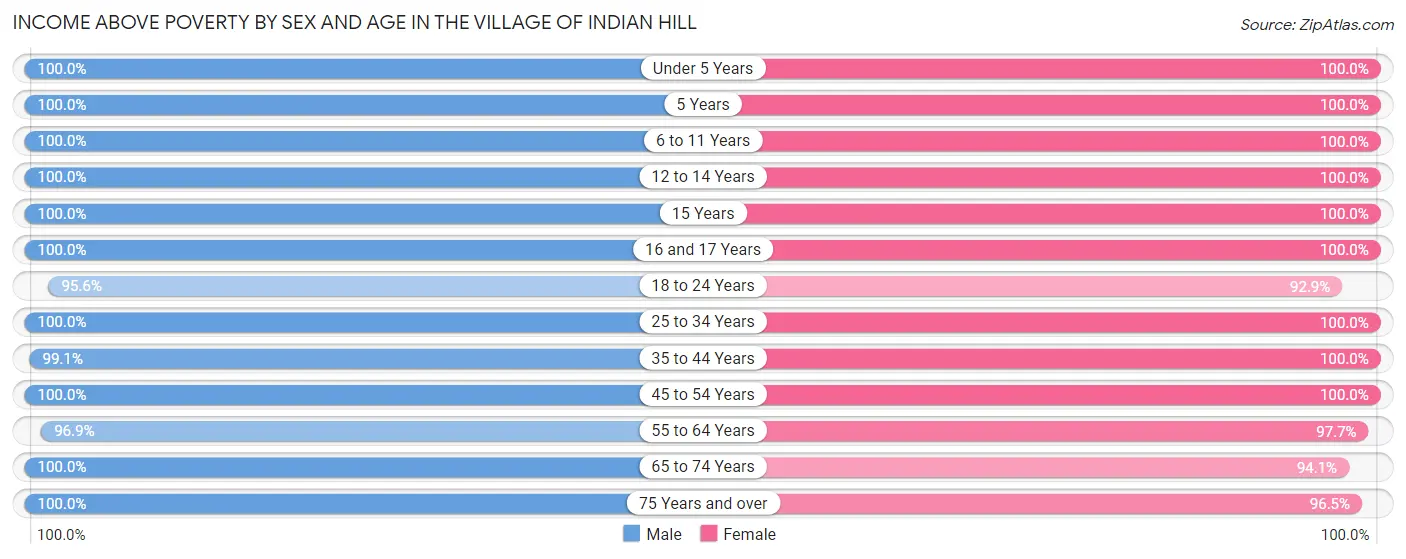
| Age Bracket | Male | Female |
| Under 5 Years | 66 (100.0%) | 126 (100.0%) |
| 5 Years | 17 (100.0%) | 30 (100.0%) |
| 6 to 11 Years | 315 (100.0%) | 242 (100.0%) |
| 12 to 14 Years | 97 (100.0%) | 249 (100.0%) |
| 15 Years | 28 (100.0%) | 42 (100.0%) |
| 16 and 17 Years | 73 (100.0%) | 27 (100.0%) |
| 18 to 24 Years | 43 (95.6%) | 52 (92.9%) |
| 25 to 34 Years | 134 (100.0%) | 146 (100.0%) |
| 35 to 44 Years | 212 (99.1%) | 333 (100.0%) |
| 45 to 54 Years | 423 (100.0%) | 350 (100.0%) |
| 55 to 64 Years | 564 (96.9%) | 650 (97.7%) |
| 65 to 74 Years | 573 (100.0%) | 321 (94.1%) |
| 75 Years and over | 416 (100.0%) | 445 (96.5%) |
| Total | 2,961 (99.3%) | 3,013 (98.2%) |
Income Below Poverty Among Married-Couple Families in The Village of Indian Hill
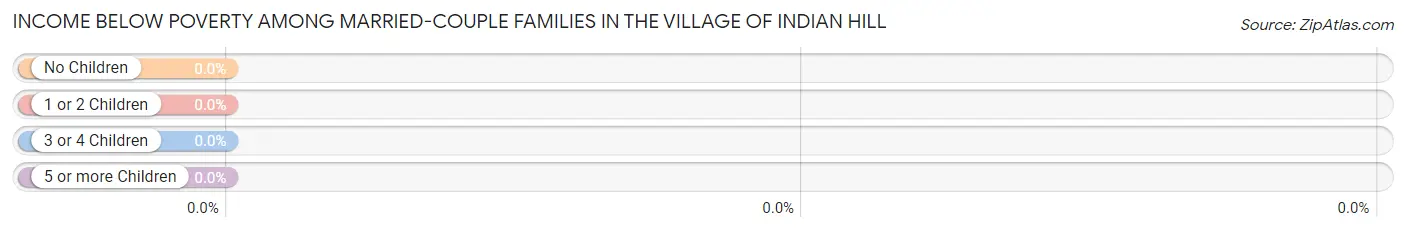
| Children | Above Poverty | Below Poverty |
| No Children | 1,478 (100.0%) | 0 (0.0%) |
| 1 or 2 Children | 449 (100.0%) | 0 (0.0%) |
| 3 or 4 Children | 106 (100.0%) | 0 (0.0%) |
| 5 or more Children | 16 (100.0%) | 0 (0.0%) |
| Total | 2,049 (100.0%) | 0 (0.0%) |
Income Below Poverty Among Single-Parent Households in The Village of Indian Hill
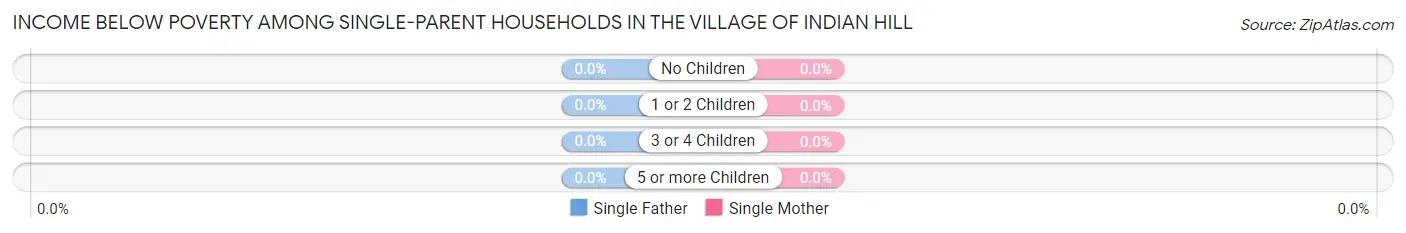
| Children | Single Father | Single Mother |
| No Children | 0 (0.0%) | 0 (0.0%) |
| 1 or 2 Children | 0 (0.0%) | 0 (0.0%) |
| 3 or 4 Children | 0 (0.0%) | 0 (0.0%) |
| 5 or more Children | 0 (0.0%) | 0 (0.0%) |
| Total | 0 (0.0%) | 0 (0.0%) |
Income Below Poverty Among Married-Couple vs Single-Parent Households in The Village of Indian Hill
| Children | Married-Couple Families | Single-Parent Households |
| No Children | 0 (0.0%) | 0 (0.0%) |
| 1 or 2 Children | 0 (0.0%) | 0 (0.0%) |
| 3 or 4 Children | 0 (0.0%) | 0 (0.0%) |
| 5 or more Children | 0 (0.0%) | 0 (0.0%) |
| Total | 0 (0.0%) | 0 (0.0%) |
Employment Characteristics in The Village of Indian Hill
Employment by Class of Employer in The Village of Indian Hill
Among the 2,561 employed individuals in The Village of Indian Hill, private company employees (1,504 | 58.7%), self-employed (incorporated) (420 | 16.4%), and not-for-profit organizations (294 | 11.5%) make up the most common classes of employment.
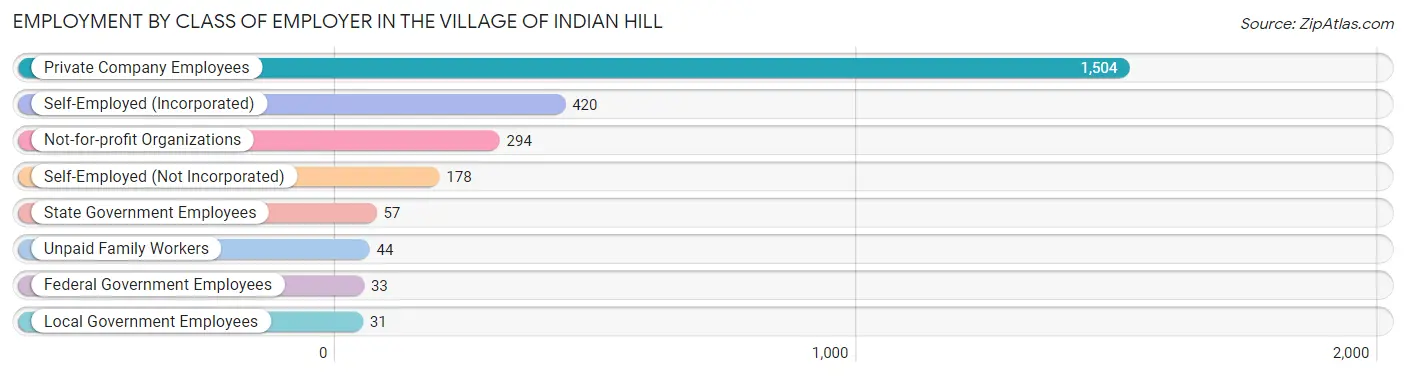
| Employer Class | # Employees | % Employees |
| Private Company Employees | 1,504 | 58.7% |
| Self-Employed (Incorporated) | 420 | 16.4% |
| Self-Employed (Not Incorporated) | 178 | 7.0% |
| Not-for-profit Organizations | 294 | 11.5% |
| Local Government Employees | 31 | 1.2% |
| State Government Employees | 57 | 2.2% |
| Federal Government Employees | 33 | 1.3% |
| Unpaid Family Workers | 44 | 1.7% |
| Total | 2,561 | 100.0% |
Employment Status by Age in The Village of Indian Hill
According to the labor force statistics for The Village of Indian Hill, out of the total population over 16 years of age (4,839), 54.6% or 2,642 individuals are in the labor force, with 2.6% or 69 of them unemployed. The age group with the highest labor force participation rate is 25 to 29 years, with 100.0% or 93 individuals in the labor force. Within the labor force, the 30 to 34 years age range has the highest percentage of unemployed individuals, with 11.6% or 16 of them being unemployed.
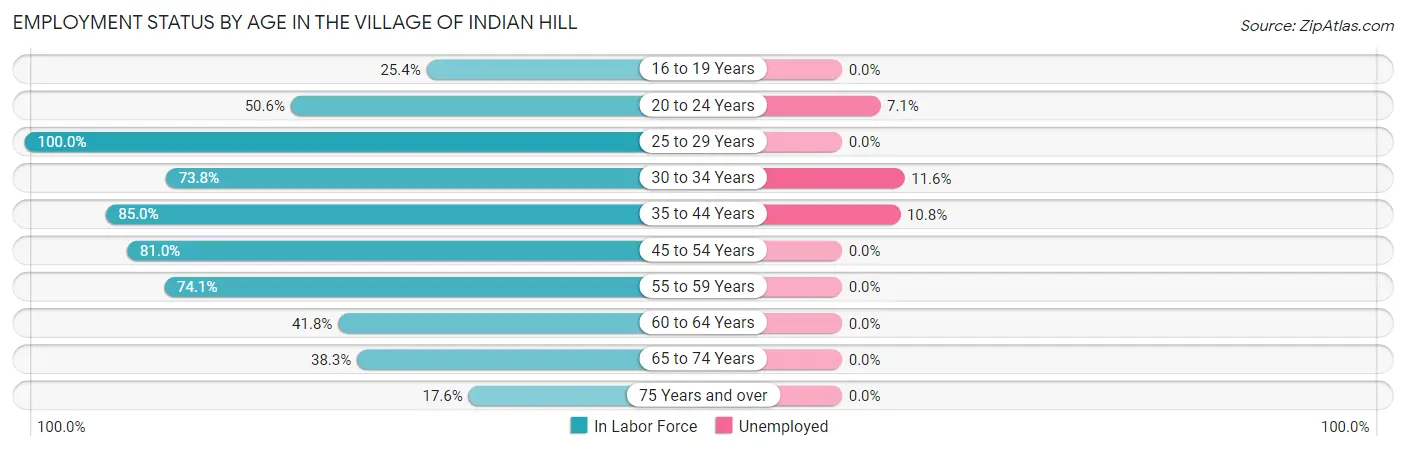
| Age Bracket | In Labor Force | Unemployed |
| 16 to 19 Years | 30 (25.4%) | 0 (0.0%) |
| 20 to 24 Years | 42 (50.6%) | 3 (7.1%) |
| 25 to 29 Years | 93 (100.0%) | 0 (0.0%) |
| 30 to 34 Years | 138 (73.8%) | 16 (11.6%) |
| 35 to 44 Years | 465 (85.0%) | 50 (10.8%) |
| 45 to 54 Years | 626 (81.0%) | 0 (0.0%) |
| 55 to 59 Years | 506 (74.1%) | 0 (0.0%) |
| 60 to 64 Years | 236 (41.8%) | 0 (0.0%) |
| 65 to 74 Years | 350 (38.3%) | 0 (0.0%) |
| 75 Years and over | 154 (17.6%) | 0 (0.0%) |
| Total | 2,642 (54.6%) | 69 (2.6%) |
Employment Status by Educational Attainment in The Village of Indian Hill
According to labor force statistics for The Village of Indian Hill, 72.5% of individuals (2,064) out of the total population between 25 and 64 years of age (2,847) are in the labor force, with 3.2% or 66 of them being unemployed. The group with the highest labor force participation rate are those with the educational attainment of high school diploma, with 86.7% or 85 individuals in the labor force. Within the labor force, individuals with bachelor's degree or higher education have the highest percentage of unemployment, with 3.6% or 66 of them being unemployed.
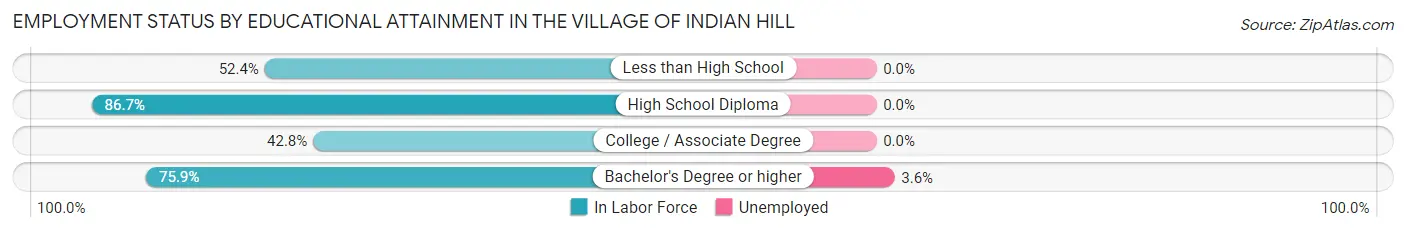
| Educational Attainment | In Labor Force | Unemployed |
| Less than High School | 22 (52.4%) | 0 (0.0%) |
| High School Diploma | 85 (86.7%) | 0 (0.0%) |
| College / Associate Degree | 127 (42.8%) | 0 (0.0%) |
| Bachelor's Degree or higher | 1,829 (75.9%) | 87 (3.6%) |
| Total | 2,064 (72.5%) | 91 (3.2%) |
Employment Occupations by Sex in The Village of Indian Hill
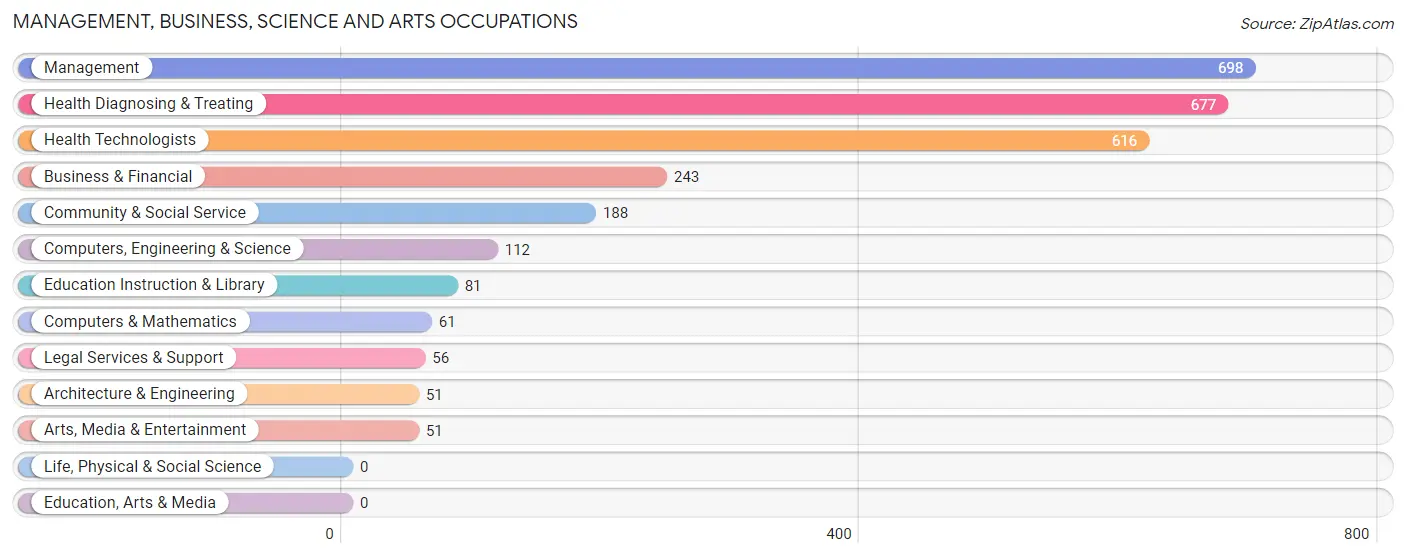
Management, Business, Science and Arts Occupations
The most common Management, Business, Science and Arts occupations in The Village of Indian Hill are Management (698 | 27.2%), Health Diagnosing & Treating (677 | 26.3%), Health Technologists (616 | 24.0%), Business & Financial (243 | 9.5%), and Community & Social Service (188 | 7.3%).
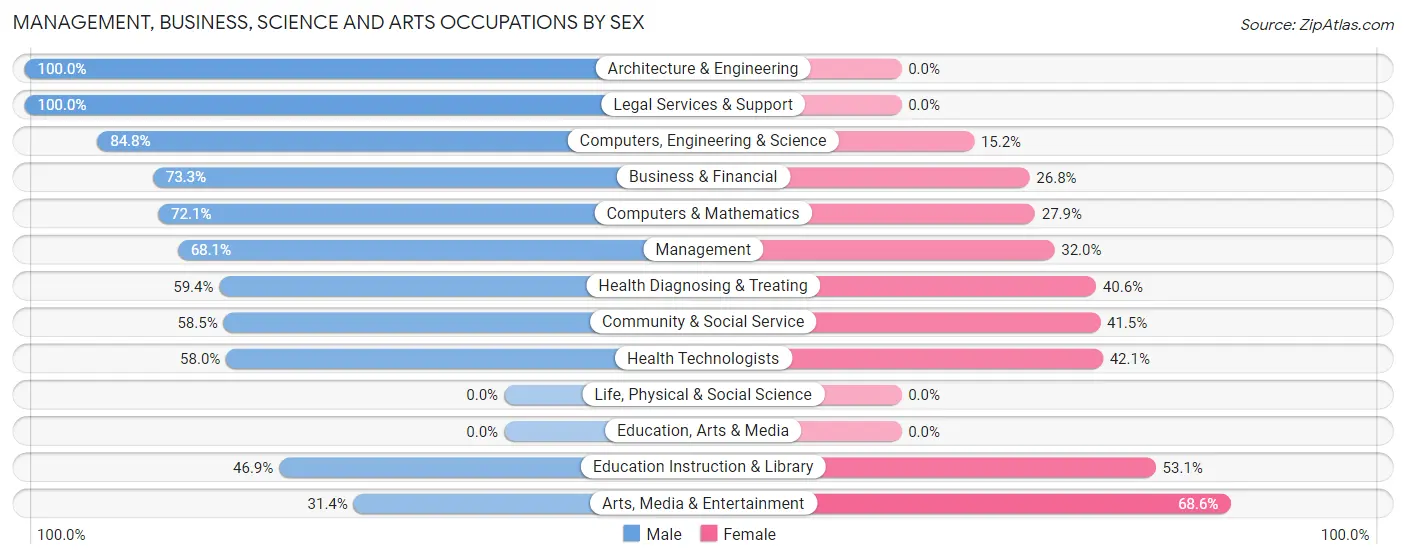
Management, Business, Science and Arts Occupations by Sex
Within the Management, Business, Science and Arts occupations in The Village of Indian Hill, the most male-oriented occupations are Architecture & Engineering (100.0%), Legal Services & Support (100.0%), and Computers, Engineering & Science (84.8%), while the most female-oriented occupations are Arts, Media & Entertainment (68.6%), Education Instruction & Library (53.1%), and Health Technologists (42.0%).
| Occupation | Male | Female |
| Management | 475 (68.0%) | 223 (32.0%) |
| Business & Financial | 178 (73.3%) | 65 (26.8%) |
| Computers, Engineering & Science | 95 (84.8%) | 17 (15.2%) |
| Computers & Mathematics | 44 (72.1%) | 17 (27.9%) |
| Architecture & Engineering | 51 (100.0%) | 0 (0.0%) |
| Life, Physical & Social Science | 0 (0.0%) | 0 (0.0%) |
| Community & Social Service | 110 (58.5%) | 78 (41.5%) |
| Education, Arts & Media | 0 (0.0%) | 0 (0.0%) |
| Legal Services & Support | 56 (100.0%) | 0 (0.0%) |
| Education Instruction & Library | 38 (46.9%) | 43 (53.1%) |
| Arts, Media & Entertainment | 16 (31.4%) | 35 (68.6%) |
| Health Diagnosing & Treating | 402 (59.4%) | 275 (40.6%) |
| Health Technologists | 357 (58.0%) | 259 (42.0%) |
| Total (Category) | 1,260 (65.7%) | 658 (34.3%) |
| Total (Overall) | 1,632 (63.5%) | 939 (36.5%) |
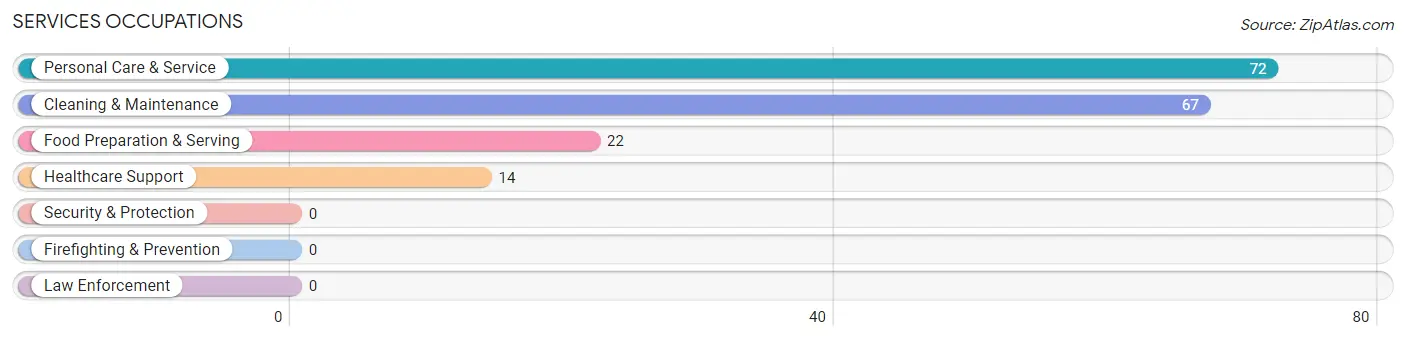
Services Occupations
The most common Services occupations in The Village of Indian Hill are Personal Care & Service (72 | 2.8%), Cleaning & Maintenance (67 | 2.6%), Food Preparation & Serving (22 | 0.9%), and Healthcare Support (14 | 0.5%).
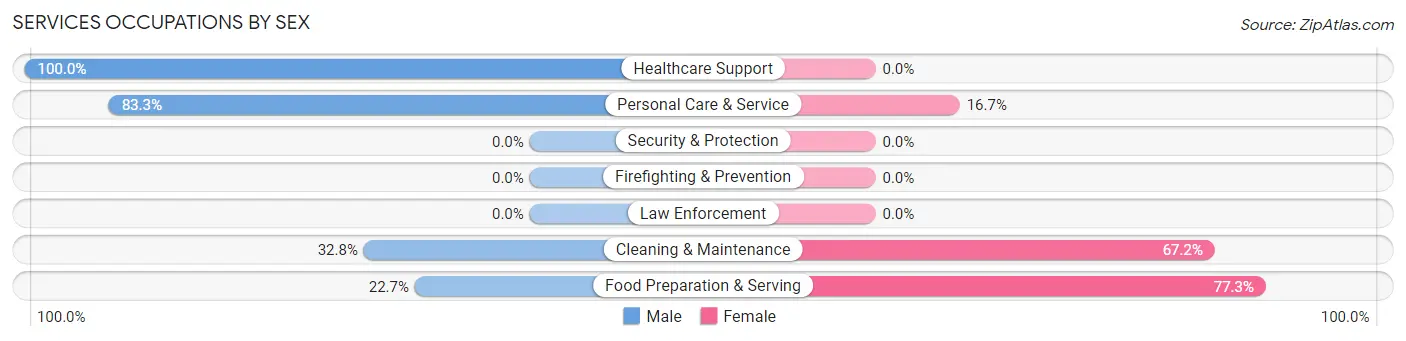
Services Occupations by Sex
Within the Services occupations in The Village of Indian Hill, the most male-oriented occupations are Healthcare Support (100.0%), Personal Care & Service (83.3%), and Cleaning & Maintenance (32.8%), while the most female-oriented occupations are Food Preparation & Serving (77.3%), Cleaning & Maintenance (67.2%), and Personal Care & Service (16.7%).
| Occupation | Male | Female |
| Healthcare Support | 14 (100.0%) | 0 (0.0%) |
| Security & Protection | 0 (0.0%) | 0 (0.0%) |
| Firefighting & Prevention | 0 (0.0%) | 0 (0.0%) |
| Law Enforcement | 0 (0.0%) | 0 (0.0%) |
| Food Preparation & Serving | 5 (22.7%) | 17 (77.3%) |
| Cleaning & Maintenance | 22 (32.8%) | 45 (67.2%) |
| Personal Care & Service | 60 (83.3%) | 12 (16.7%) |
| Total (Category) | 101 (57.7%) | 74 (42.3%) |
| Total (Overall) | 1,632 (63.5%) | 939 (36.5%) |
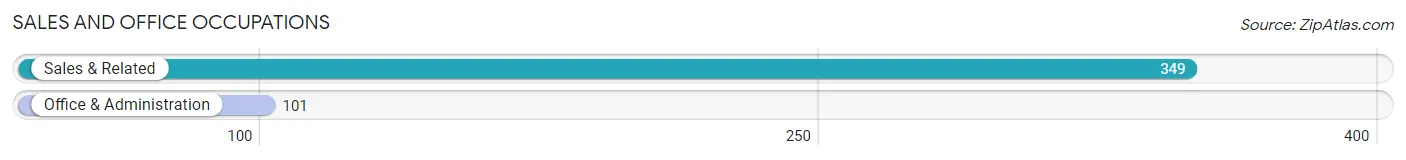
Sales and Office Occupations
The most common Sales and Office occupations in The Village of Indian Hill are Sales & Related (349 | 13.6%), and Office & Administration (101 | 3.9%).
Sales and Office Occupations by Sex
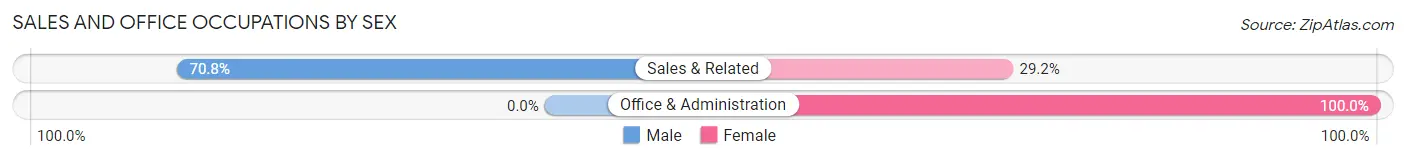
| Occupation | Male | Female |
| Sales & Related | 247 (70.8%) | 102 (29.2%) |
| Office & Administration | 0 (0.0%) | 101 (100.0%) |
| Total (Category) | 247 (54.9%) | 203 (45.1%) |
| Total (Overall) | 1,632 (63.5%) | 939 (36.5%) |
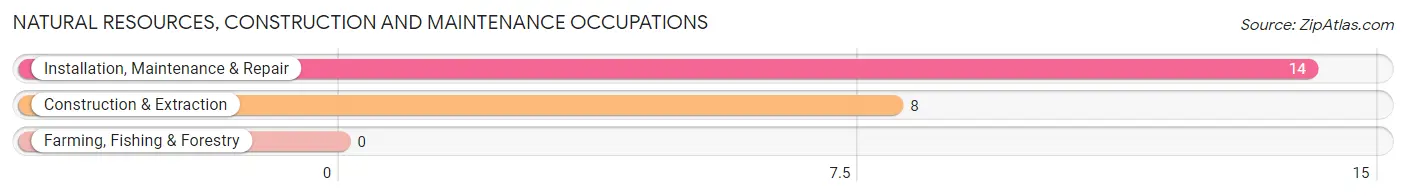
Natural Resources, Construction and Maintenance Occupations
The most common Natural Resources, Construction and Maintenance occupations in The Village of Indian Hill are Installation, Maintenance & Repair (14 | 0.5%), and Construction & Extraction (8 | 0.3%).
Natural Resources, Construction and Maintenance Occupations by Sex
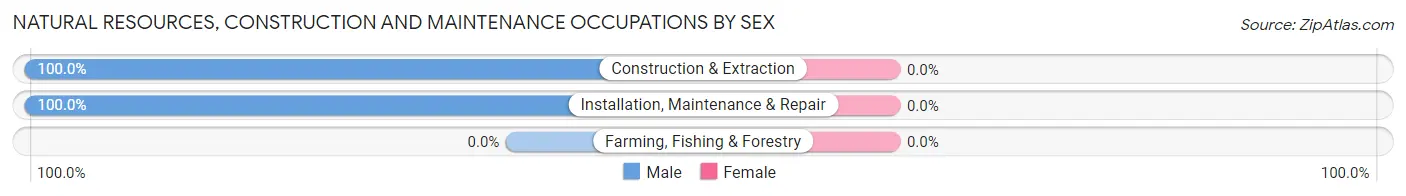
| Occupation | Male | Female |
| Farming, Fishing & Forestry | 0 (0.0%) | 0 (0.0%) |
| Construction & Extraction | 8 (100.0%) | 0 (0.0%) |
| Installation, Maintenance & Repair | 14 (100.0%) | 0 (0.0%) |
| Total (Category) | 22 (100.0%) | 0 (0.0%) |
| Total (Overall) | 1,632 (63.5%) | 939 (36.5%) |
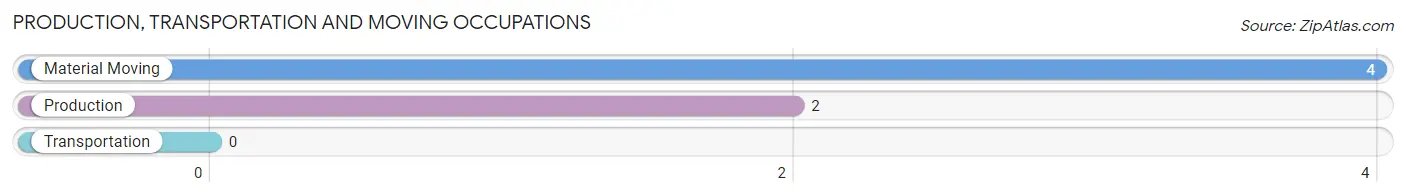
Production, Transportation and Moving Occupations
The most common Production, Transportation and Moving occupations in The Village of Indian Hill are Material Moving (4 | 0.2%), and Production (2 | 0.1%).
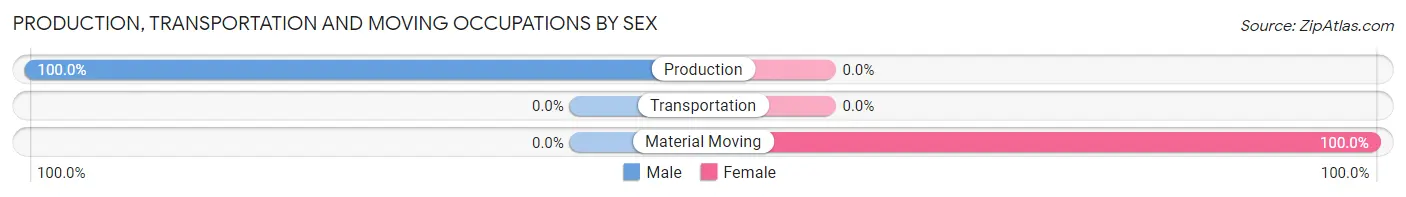
Production, Transportation and Moving Occupations by Sex
| Occupation | Male | Female |
| Production | 2 (100.0%) | 0 (0.0%) |
| Transportation | 0 (0.0%) | 0 (0.0%) |
| Material Moving | 0 (0.0%) | 4 (100.0%) |
| Total (Category) | 2 (33.3%) | 4 (66.7%) |
| Total (Overall) | 1,632 (63.5%) | 939 (36.5%) |
Employment Industries by Sex in The Village of Indian Hill
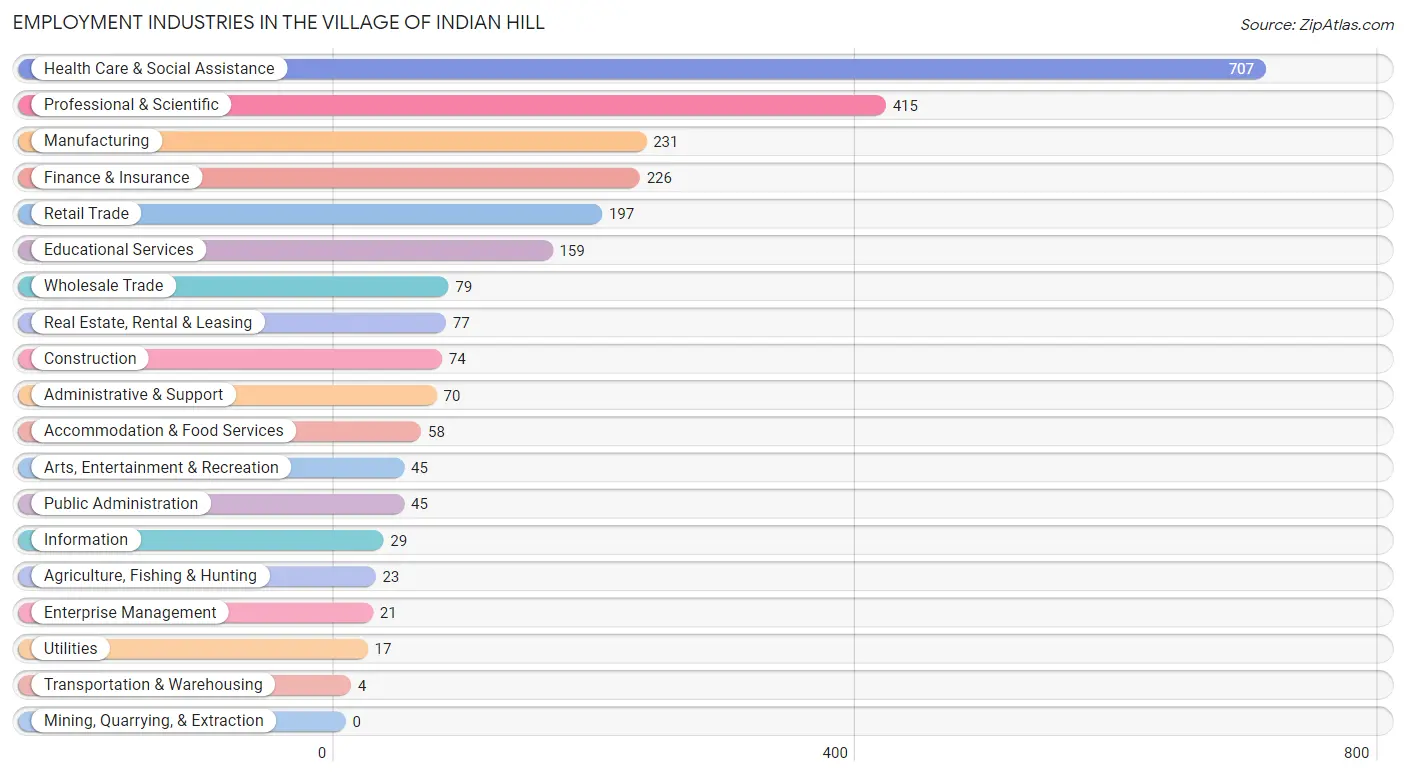
Employment Industries in The Village of Indian Hill
The major employment industries in The Village of Indian Hill include Health Care & Social Assistance (707 | 27.5%), Professional & Scientific (415 | 16.1%), Manufacturing (231 | 9.0%), Finance & Insurance (226 | 8.8%), and Retail Trade (197 | 7.7%).
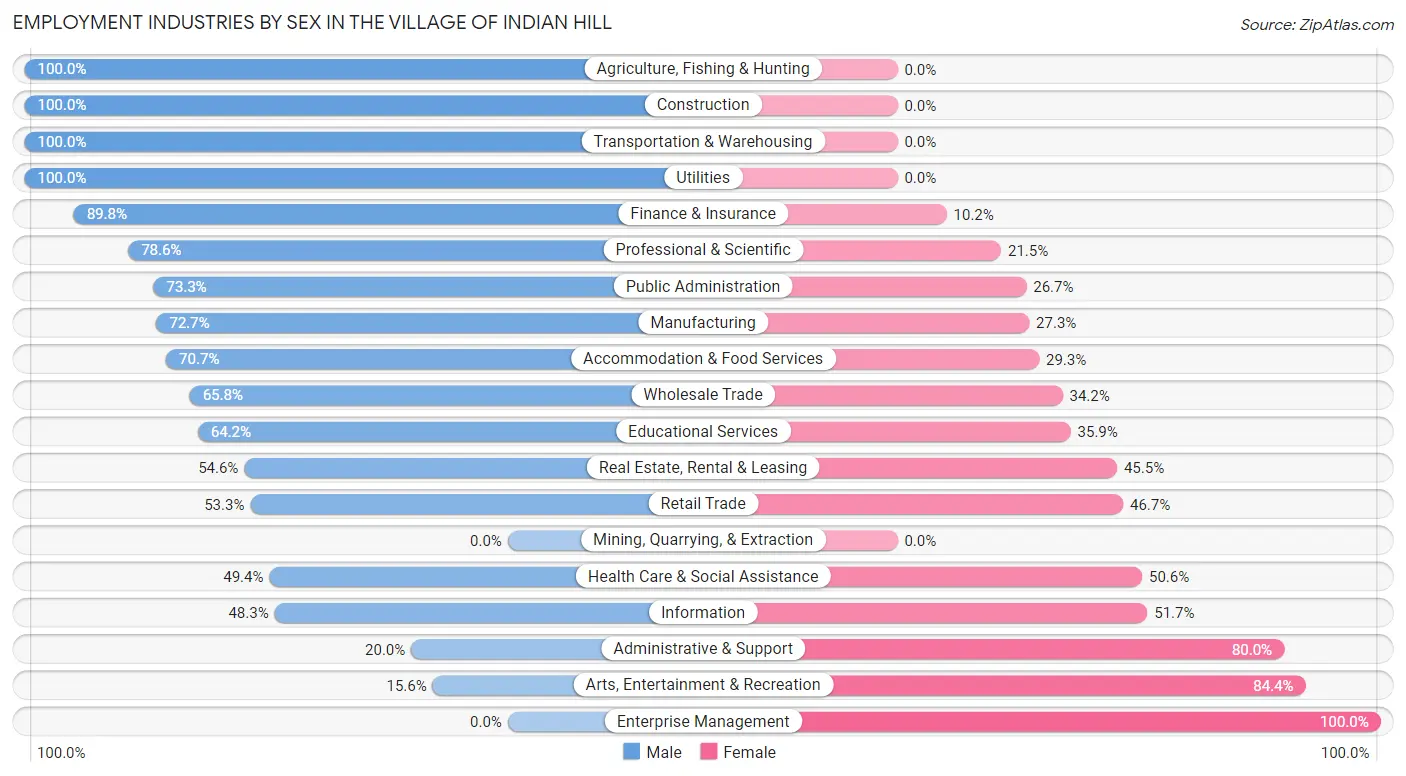
Employment Industries by Sex in The Village of Indian Hill
The The Village of Indian Hill industries that see more men than women are Agriculture, Fishing & Hunting (100.0%), Construction (100.0%), and Transportation & Warehousing (100.0%), whereas the industries that tend to have a higher number of women are Enterprise Management (100.0%), Arts, Entertainment & Recreation (84.4%), and Administrative & Support (80.0%).
| Industry | Male | Female |
| Agriculture, Fishing & Hunting | 23 (100.0%) | 0 (0.0%) |
| Mining, Quarrying, & Extraction | 0 (0.0%) | 0 (0.0%) |
| Construction | 74 (100.0%) | 0 (0.0%) |
| Manufacturing | 168 (72.7%) | 63 (27.3%) |
| Wholesale Trade | 52 (65.8%) | 27 (34.2%) |
| Retail Trade | 105 (53.3%) | 92 (46.7%) |
| Transportation & Warehousing | 4 (100.0%) | 0 (0.0%) |
| Utilities | 17 (100.0%) | 0 (0.0%) |
| Information | 14 (48.3%) | 15 (51.7%) |
| Finance & Insurance | 203 (89.8%) | 23 (10.2%) |
| Real Estate, Rental & Leasing | 42 (54.5%) | 35 (45.5%) |
| Professional & Scientific | 326 (78.5%) | 89 (21.4%) |
| Enterprise Management | 0 (0.0%) | 21 (100.0%) |
| Administrative & Support | 14 (20.0%) | 56 (80.0%) |
| Educational Services | 102 (64.1%) | 57 (35.8%) |
| Health Care & Social Assistance | 349 (49.4%) | 358 (50.6%) |
| Arts, Entertainment & Recreation | 7 (15.6%) | 38 (84.4%) |
| Accommodation & Food Services | 41 (70.7%) | 17 (29.3%) |
| Public Administration | 33 (73.3%) | 12 (26.7%) |
| Total | 1,632 (63.5%) | 939 (36.5%) |
Education in The Village of Indian Hill
School Enrollment in The Village of Indian Hill
The most common levels of schooling among the 1,328 students in The Village of Indian Hill are middle school (474 | 35.7%), elementary school (347 | 26.1%), and high school (225 | 16.9%).
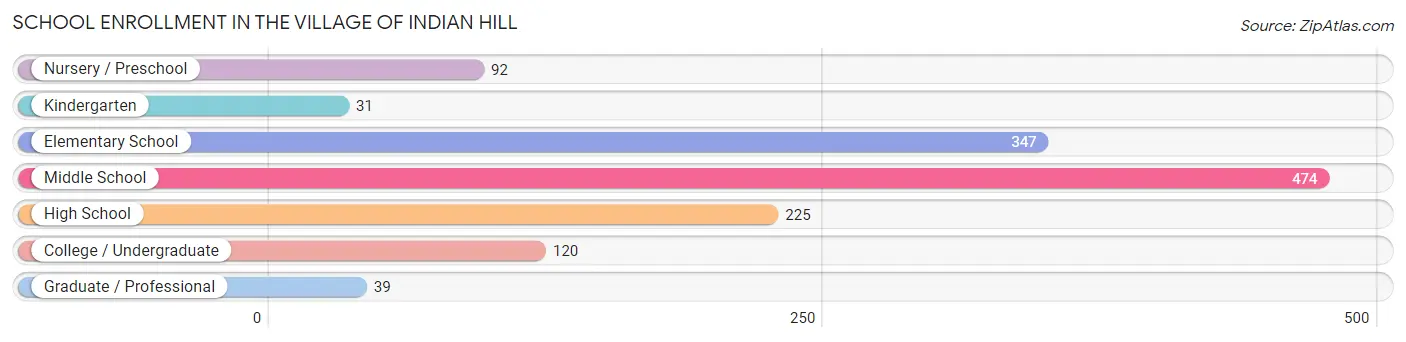
| School Level | # Students | % Students |
| Nursery / Preschool | 92 | 6.9% |
| Kindergarten | 31 | 2.3% |
| Elementary School | 347 | 26.1% |
| Middle School | 474 | 35.7% |
| High School | 225 | 16.9% |
| College / Undergraduate | 120 | 9.0% |
| Graduate / Professional | 39 | 2.9% |
| Total | 1,328 | 100.0% |
School Enrollment by Age by Funding Source in The Village of Indian Hill
Out of a total of 1,328 students who are enrolled in schools in The Village of Indian Hill, 428 (32.2%) attend a private institution, while the remaining 900 (67.8%) are enrolled in public schools. The age group of 3 to 4 year olds has the highest likelihood of being enrolled in private schools, with 45 (100.0% in the age bracket) enrolled. Conversely, the age group of 25 to 34 year olds has the lowest likelihood of being enrolled in a private school, with 32 (100.0% in the age bracket) attending a public institution.
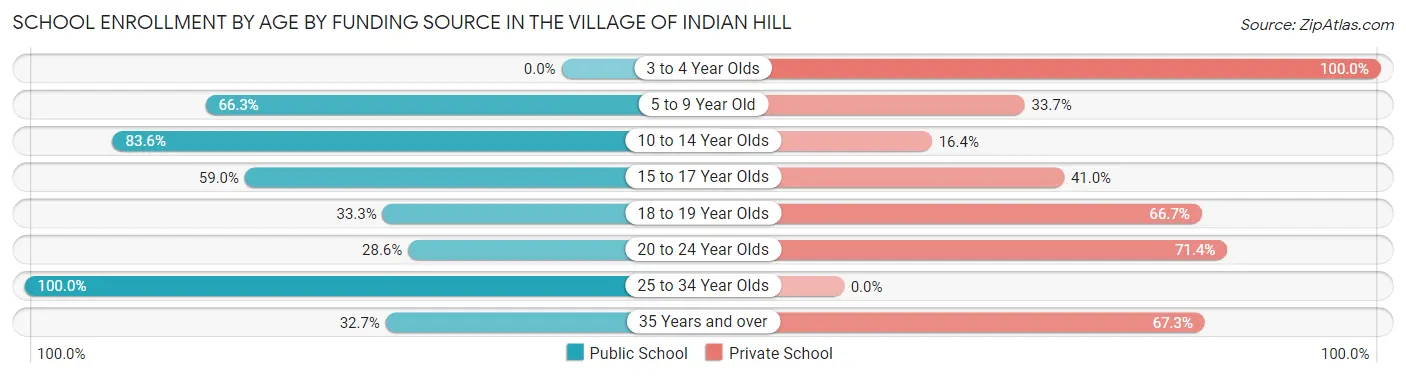
| Age Bracket | Public School | Private School |
| 3 to 4 Year Olds | 0 (0.0%) | 45 (100.0%) |
| 5 to 9 Year Old | 250 (66.3%) | 127 (33.7%) |
| 10 to 14 Year Olds | 479 (83.6%) | 94 (16.4%) |
| 15 to 17 Year Olds | 92 (59.0%) | 64 (41.0%) |
| 18 to 19 Year Olds | 6 (33.3%) | 12 (66.7%) |
| 20 to 24 Year Olds | 4 (28.6%) | 10 (71.4%) |
| 25 to 34 Year Olds | 32 (100.0%) | 0 (0.0%) |
| 35 Years and over | 37 (32.7%) | 76 (67.3%) |
| Total | 900 (67.8%) | 428 (32.2%) |
Educational Attainment by Field of Study in The Village of Indian Hill
Business (903 | 23.8%), bio, nature & agricultural (375 | 9.9%), engineering (332 | 8.8%), science & technology (321 | 8.5%), and liberal arts & history (314 | 8.3%) are the most common fields of study among 3,787 individuals in The Village of Indian Hill who have obtained a bachelor's degree or higher.
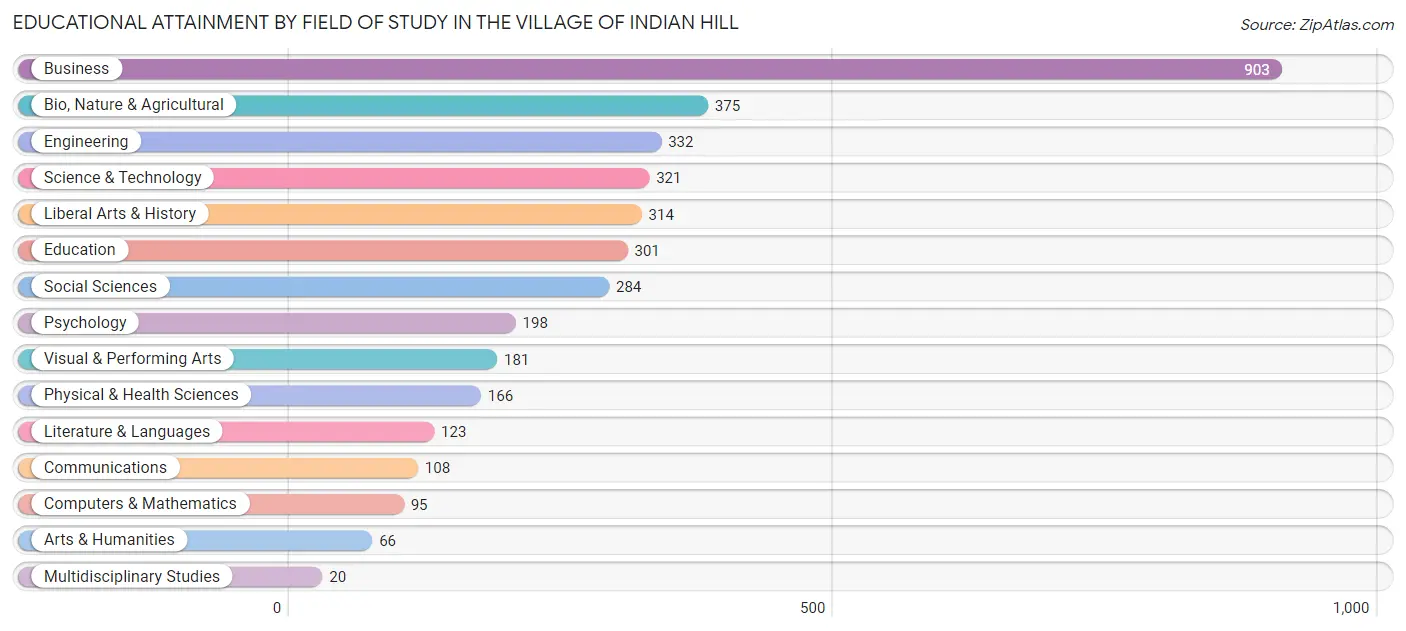
| Field of Study | # Graduates | % Graduates |
| Computers & Mathematics | 95 | 2.5% |
| Bio, Nature & Agricultural | 375 | 9.9% |
| Physical & Health Sciences | 166 | 4.4% |
| Psychology | 198 | 5.2% |
| Social Sciences | 284 | 7.5% |
| Engineering | 332 | 8.8% |
| Multidisciplinary Studies | 20 | 0.5% |
| Science & Technology | 321 | 8.5% |
| Business | 903 | 23.8% |
| Education | 301 | 8.0% |
| Literature & Languages | 123 | 3.3% |
| Liberal Arts & History | 314 | 8.3% |
| Visual & Performing Arts | 181 | 4.8% |
| Communications | 108 | 2.9% |
| Arts & Humanities | 66 | 1.7% |
| Total | 3,787 | 100.0% |
Transportation & Commute in The Village of Indian Hill
Vehicle Availability by Sex in The Village of Indian Hill
The most prevalent vehicle ownership categories in The Village of Indian Hill are males with 2 vehicles (729, accounting for 45.0%) and females with 2 vehicles (345, making up 78.0%).
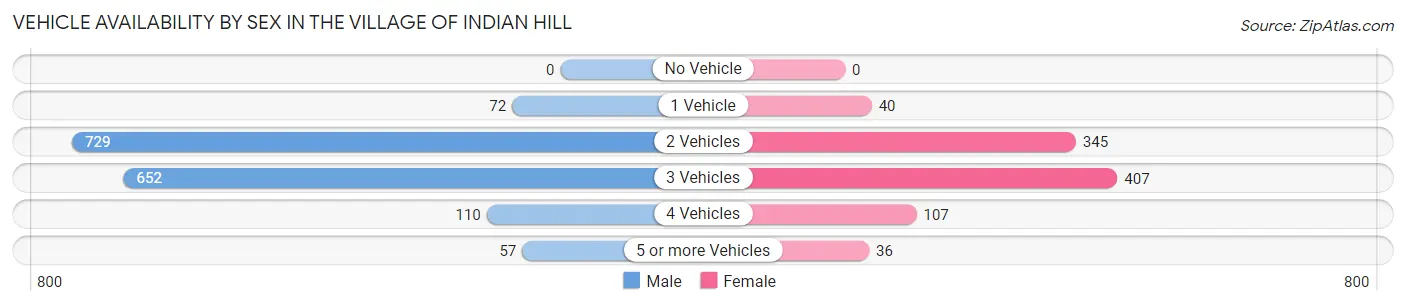
| Vehicles Available | Male | Female |
| No Vehicle | 0 (0.0%) | 0 (0.0%) |
| 1 Vehicle | 72 (4.4%) | 40 (4.3%) |
| 2 Vehicles | 729 (45.0%) | 345 (36.9%) |
| 3 Vehicles | 652 (40.3%) | 407 (43.5%) |
| 4 Vehicles | 110 (6.8%) | 107 (11.4%) |
| 5 or more Vehicles | 57 (3.5%) | 36 (3.8%) |
| Total | 1,620 (100.0%) | 935 (100.0%) |
Commute Time in The Village of Indian Hill
The most frequently occuring commute durations in The Village of Indian Hill are 20 to 24 minutes (517 commuters, 24.5%), 15 to 19 minutes (309 commuters, 14.6%), and 25 to 29 minutes (286 commuters, 13.5%).
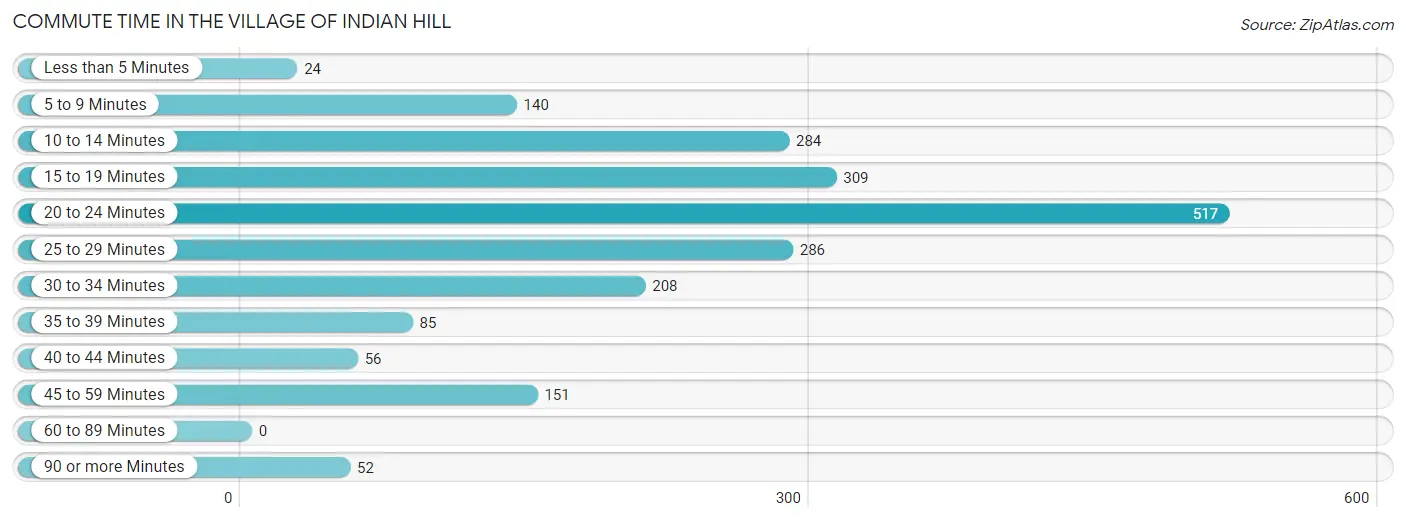
| Commute Time | # Commuters | % Commuters |
| Less than 5 Minutes | 24 | 1.1% |
| 5 to 9 Minutes | 140 | 6.6% |
| 10 to 14 Minutes | 284 | 13.5% |
| 15 to 19 Minutes | 309 | 14.6% |
| 20 to 24 Minutes | 517 | 24.5% |
| 25 to 29 Minutes | 286 | 13.5% |
| 30 to 34 Minutes | 208 | 9.9% |
| 35 to 39 Minutes | 85 | 4.0% |
| 40 to 44 Minutes | 56 | 2.6% |
| 45 to 59 Minutes | 151 | 7.1% |
| 60 to 89 Minutes | 0 | 0.0% |
| 90 or more Minutes | 52 | 2.5% |
Commute Time by Sex in The Village of Indian Hill
The most common commute times in The Village of Indian Hill are 20 to 24 minutes (334 commuters, 25.5%) for males and 20 to 24 minutes (183 commuters, 22.9%) for females.
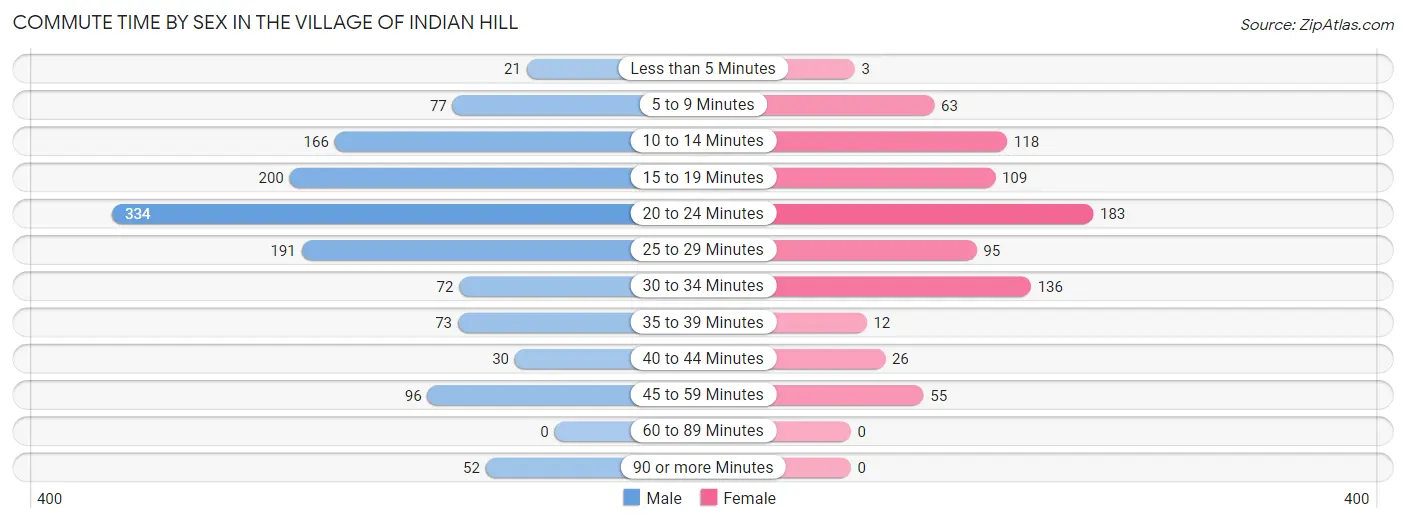
| Commute Time | Male | Female |
| Less than 5 Minutes | 21 (1.6%) | 3 (0.4%) |
| 5 to 9 Minutes | 77 (5.9%) | 63 (7.9%) |
| 10 to 14 Minutes | 166 (12.7%) | 118 (14.7%) |
| 15 to 19 Minutes | 200 (15.2%) | 109 (13.6%) |
| 20 to 24 Minutes | 334 (25.5%) | 183 (22.9%) |
| 25 to 29 Minutes | 191 (14.6%) | 95 (11.9%) |
| 30 to 34 Minutes | 72 (5.5%) | 136 (17.0%) |
| 35 to 39 Minutes | 73 (5.6%) | 12 (1.5%) |
| 40 to 44 Minutes | 30 (2.3%) | 26 (3.3%) |
| 45 to 59 Minutes | 96 (7.3%) | 55 (6.9%) |
| 60 to 89 Minutes | 0 (0.0%) | 0 (0.0%) |
| 90 or more Minutes | 52 (4.0%) | 0 (0.0%) |
Time of Departure to Work by Sex in The Village of Indian Hill
The most frequent times of departure to work in The Village of Indian Hill are 7:00 AM to 7:29 AM (265, 20.2%) for males and 8:00 AM to 8:29 AM (247, 30.9%) for females.
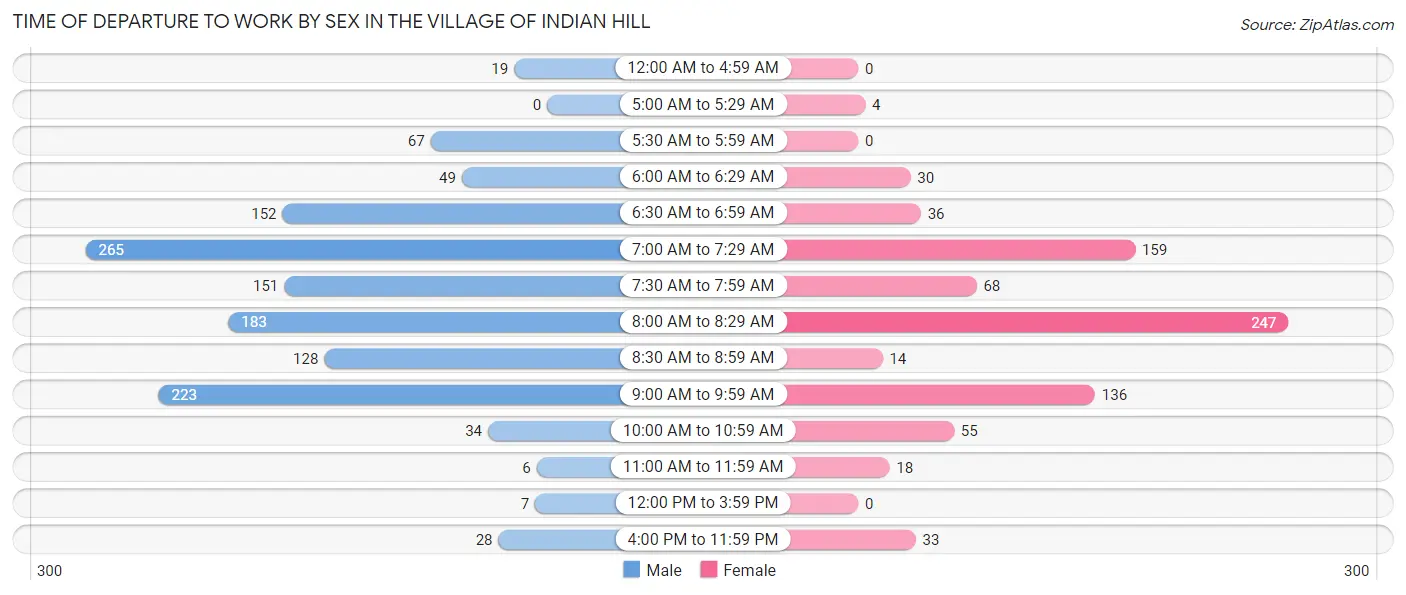
| Time of Departure | Male | Female |
| 12:00 AM to 4:59 AM | 19 (1.5%) | 0 (0.0%) |
| 5:00 AM to 5:29 AM | 0 (0.0%) | 4 (0.5%) |
| 5:30 AM to 5:59 AM | 67 (5.1%) | 0 (0.0%) |
| 6:00 AM to 6:29 AM | 49 (3.7%) | 30 (3.7%) |
| 6:30 AM to 6:59 AM | 152 (11.6%) | 36 (4.5%) |
| 7:00 AM to 7:29 AM | 265 (20.2%) | 159 (19.9%) |
| 7:30 AM to 7:59 AM | 151 (11.5%) | 68 (8.5%) |
| 8:00 AM to 8:29 AM | 183 (14.0%) | 247 (30.9%) |
| 8:30 AM to 8:59 AM | 128 (9.8%) | 14 (1.8%) |
| 9:00 AM to 9:59 AM | 223 (17.0%) | 136 (17.0%) |
| 10:00 AM to 10:59 AM | 34 (2.6%) | 55 (6.9%) |
| 11:00 AM to 11:59 AM | 6 (0.5%) | 18 (2.2%) |
| 12:00 PM to 3:59 PM | 7 (0.5%) | 0 (0.0%) |
| 4:00 PM to 11:59 PM | 28 (2.1%) | 33 (4.1%) |
| Total | 1,312 (100.0%) | 800 (100.0%) |
Housing Occupancy in The Village of Indian Hill
Occupancy by Ownership in The Village of Indian Hill
Of the total 2,421 dwellings in The Village of Indian Hill, owner-occupied units account for 2,360 (97.5%), while renter-occupied units make up 61 (2.5%).
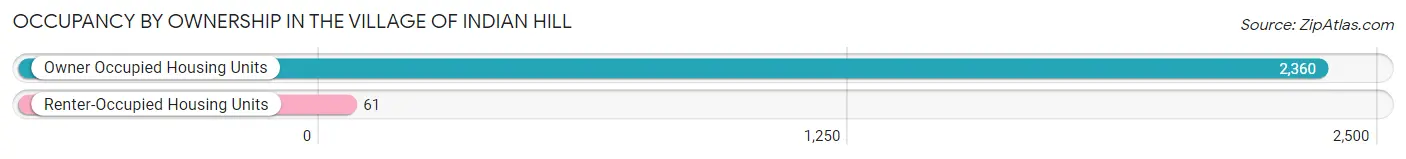
| Occupancy | # Housing Units | % Housing Units |
| Owner Occupied Housing Units | 2,360 | 97.5% |
| Renter-Occupied Housing Units | 61 | 2.5% |
| Total Occupied Housing Units | 2,421 | 100.0% |
Occupancy by Household Size in The Village of Indian Hill
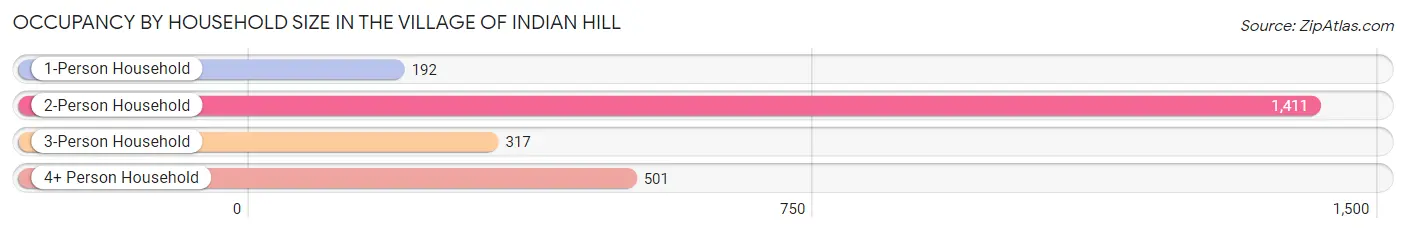
| Household Size | # Housing Units | % Housing Units |
| 1-Person Household | 192 | 7.9% |
| 2-Person Household | 1,411 | 58.3% |
| 3-Person Household | 317 | 13.1% |
| 4+ Person Household | 501 | 20.7% |
| Total Housing Units | 2,421 | 100.0% |
Occupancy by Ownership by Household Size in The Village of Indian Hill
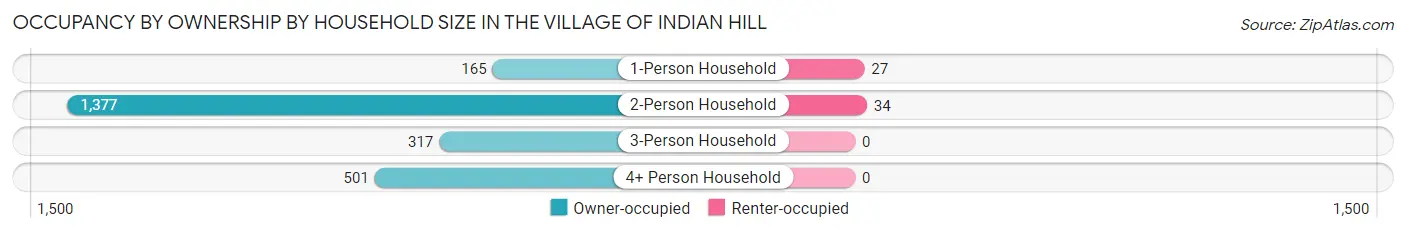
| Household Size | Owner-occupied | Renter-occupied |
| 1-Person Household | 165 (85.9%) | 27 (14.1%) |
| 2-Person Household | 1,377 (97.6%) | 34 (2.4%) |
| 3-Person Household | 317 (100.0%) | 0 (0.0%) |
| 4+ Person Household | 501 (100.0%) | 0 (0.0%) |
| Total Housing Units | 2,360 (97.5%) | 61 (2.5%) |
Occupancy by Educational Attainment in The Village of Indian Hill
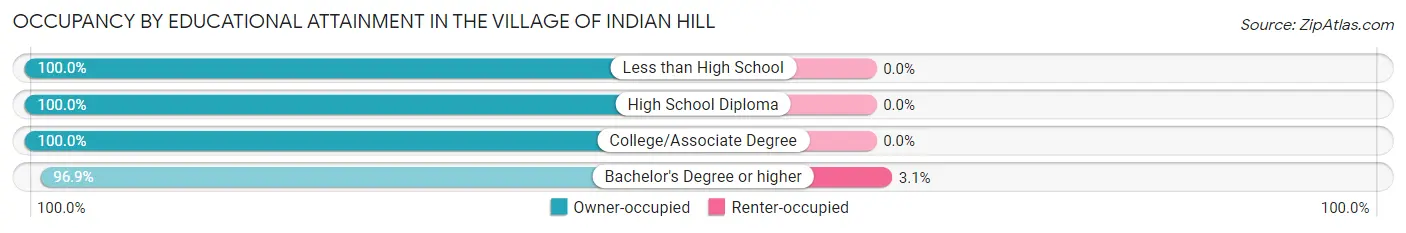
| Household Size | Owner-occupied | Renter-occupied |
| Less than High School | 20 (100.0%) | 0 (0.0%) |
| High School Diploma | 162 (100.0%) | 0 (0.0%) |
| College/Associate Degree | 280 (100.0%) | 0 (0.0%) |
| Bachelor's Degree or higher | 1,898 (96.9%) | 61 (3.1%) |
Occupancy by Age of Householder in The Village of Indian Hill
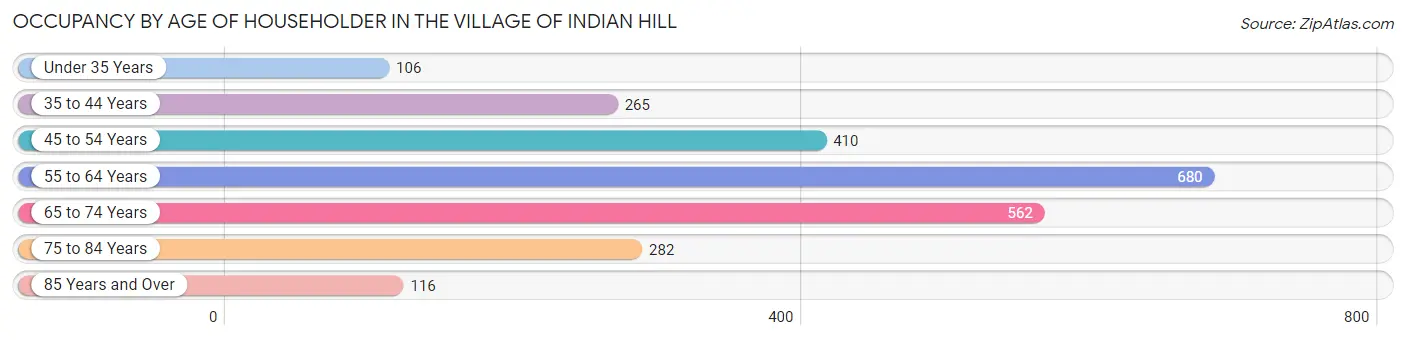
| Age Bracket | # Households | % Households |
| Under 35 Years | 106 | 4.4% |
| 35 to 44 Years | 265 | 11.0% |
| 45 to 54 Years | 410 | 16.9% |
| 55 to 64 Years | 680 | 28.1% |
| 65 to 74 Years | 562 | 23.2% |
| 75 to 84 Years | 282 | 11.7% |
| 85 Years and Over | 116 | 4.8% |
| Total | 2,421 | 100.0% |
Housing Finances in The Village of Indian Hill
Median Income by Occupancy in The Village of Indian Hill
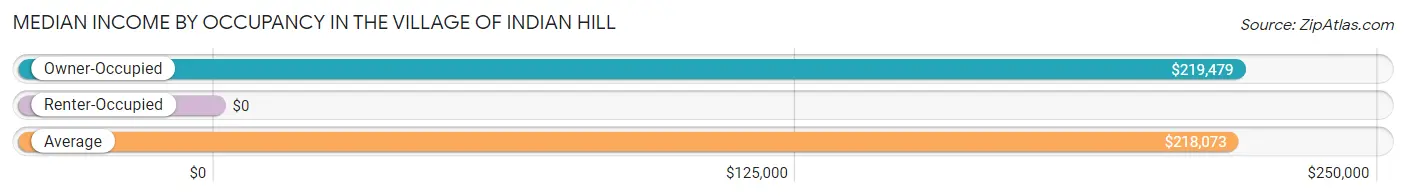
| Occupancy Type | # Households | Median Income |
| Owner-Occupied | 2,360 (97.5%) | $219,479 |
| Renter-Occupied | 61 (2.5%) | $0 |
| Average | 2,421 (100.0%) | $218,073 |
Occupancy by Householder Income Bracket in The Village of Indian Hill
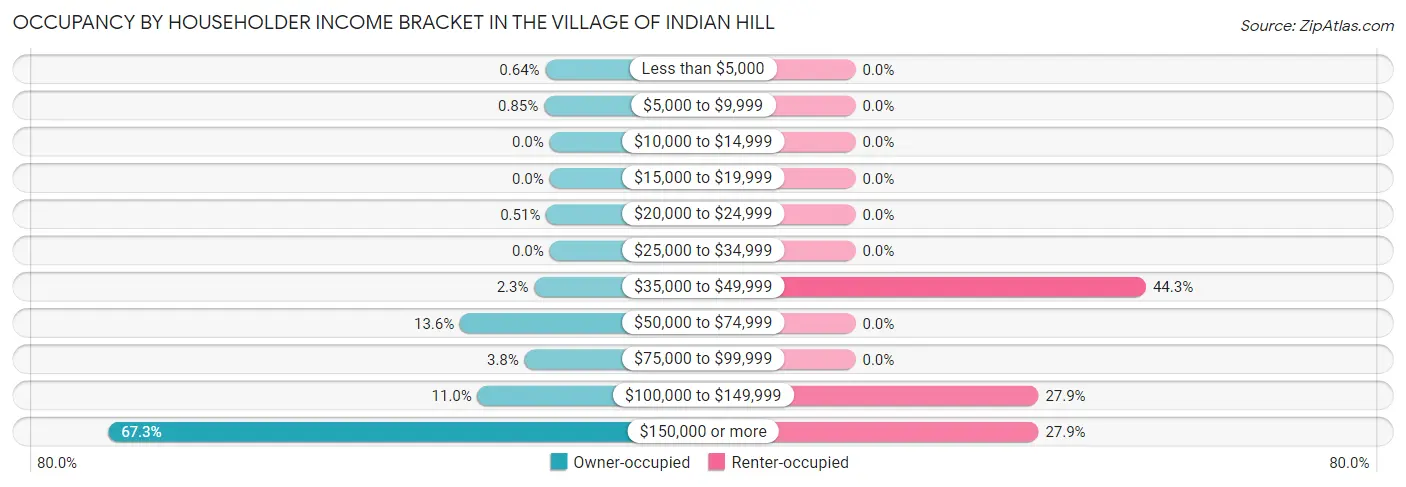
| Income Bracket | Owner-occupied | Renter-occupied |
| Less than $5,000 | 15 (0.6%) | 0 (0.0%) |
| $5,000 to $9,999 | 20 (0.9%) | 0 (0.0%) |
| $10,000 to $14,999 | 0 (0.0%) | 0 (0.0%) |
| $15,000 to $19,999 | 0 (0.0%) | 0 (0.0%) |
| $20,000 to $24,999 | 12 (0.5%) | 0 (0.0%) |
| $25,000 to $34,999 | 0 (0.0%) | 0 (0.0%) |
| $35,000 to $49,999 | 55 (2.3%) | 27 (44.3%) |
| $50,000 to $74,999 | 322 (13.6%) | 0 (0.0%) |
| $75,000 to $99,999 | 90 (3.8%) | 0 (0.0%) |
| $100,000 to $149,999 | 259 (11.0%) | 17 (27.9%) |
| $150,000 or more | 1,587 (67.2%) | 17 (27.9%) |
| Total | 2,360 (100.0%) | 61 (100.0%) |
Monthly Housing Cost Tiers in The Village of Indian Hill
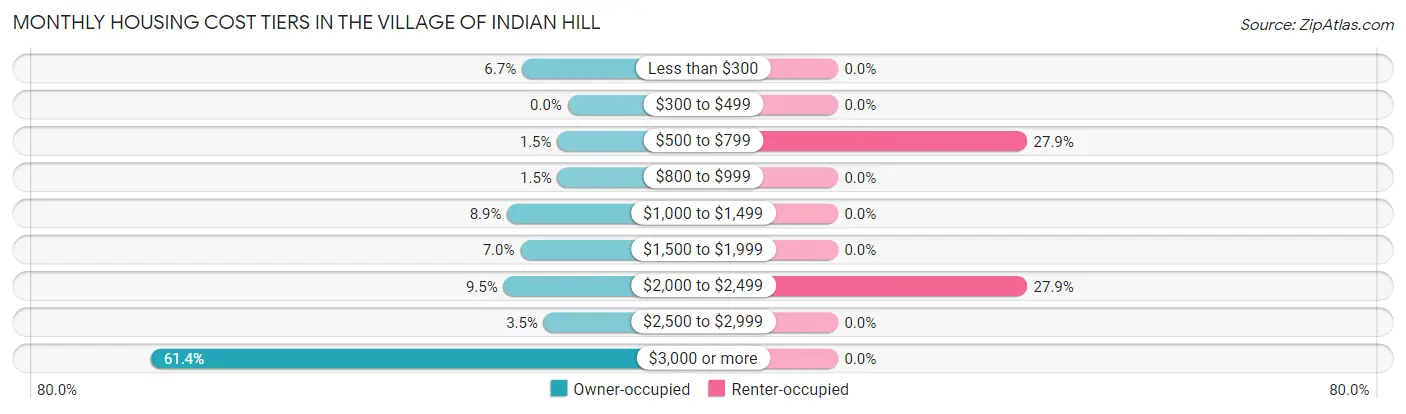
| Monthly Cost | Owner-occupied | Renter-occupied |
| Less than $300 | 159 (6.7%) | 0 (0.0%) |
| $300 to $499 | 0 (0.0%) | 0 (0.0%) |
| $500 to $799 | 36 (1.5%) | 17 (27.9%) |
| $800 to $999 | 35 (1.5%) | 0 (0.0%) |
| $1,000 to $1,499 | 210 (8.9%) | 0 (0.0%) |
| $1,500 to $1,999 | 165 (7.0%) | 0 (0.0%) |
| $2,000 to $2,499 | 223 (9.5%) | 17 (27.9%) |
| $2,500 to $2,999 | 83 (3.5%) | 0 (0.0%) |
| $3,000 or more | 1,449 (61.4%) | 0 (0.0%) |
| Total | 2,360 (100.0%) | 61 (100.0%) |
Physical Housing Characteristics in The Village of Indian Hill
Housing Structures in The Village of Indian Hill
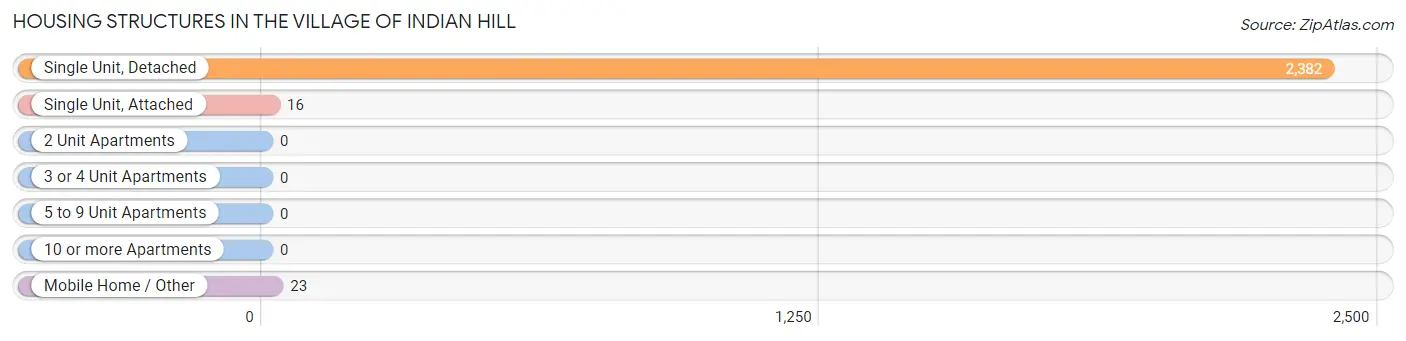
| Structure Type | # Housing Units | % Housing Units |
| Single Unit, Detached | 2,382 | 98.4% |
| Single Unit, Attached | 16 | 0.7% |
| 2 Unit Apartments | 0 | 0.0% |
| 3 or 4 Unit Apartments | 0 | 0.0% |
| 5 to 9 Unit Apartments | 0 | 0.0% |
| 10 or more Apartments | 0 | 0.0% |
| Mobile Home / Other | 23 | 0.9% |
| Total | 2,421 | 100.0% |
Housing Structures by Occupancy in The Village of Indian Hill
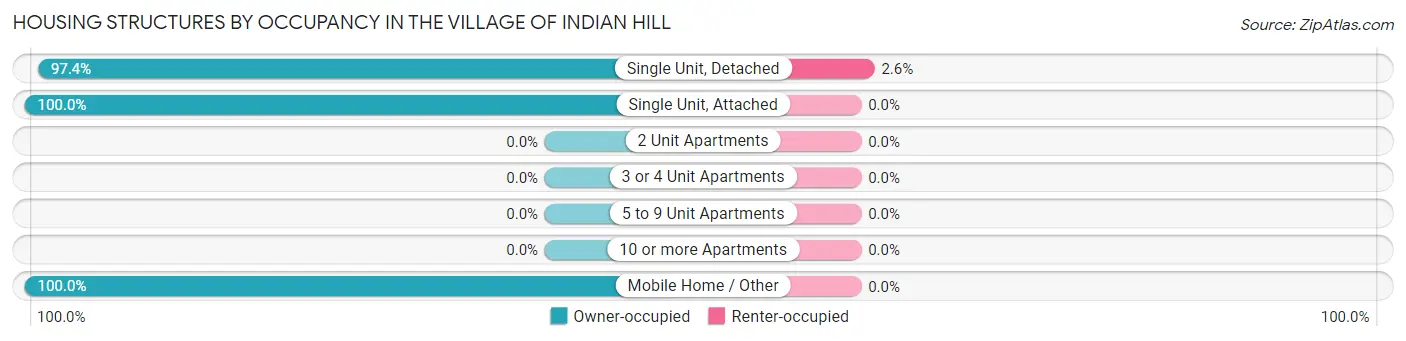
| Structure Type | Owner-occupied | Renter-occupied |
| Single Unit, Detached | 2,321 (97.4%) | 61 (2.6%) |
| Single Unit, Attached | 16 (100.0%) | 0 (0.0%) |
| 2 Unit Apartments | 0 (0.0%) | 0 (0.0%) |
| 3 or 4 Unit Apartments | 0 (0.0%) | 0 (0.0%) |
| 5 to 9 Unit Apartments | 0 (0.0%) | 0 (0.0%) |
| 10 or more Apartments | 0 (0.0%) | 0 (0.0%) |
| Mobile Home / Other | 23 (100.0%) | 0 (0.0%) |
| Total | 2,360 (97.5%) | 61 (2.5%) |
Housing Structures by Number of Rooms in The Village of Indian Hill
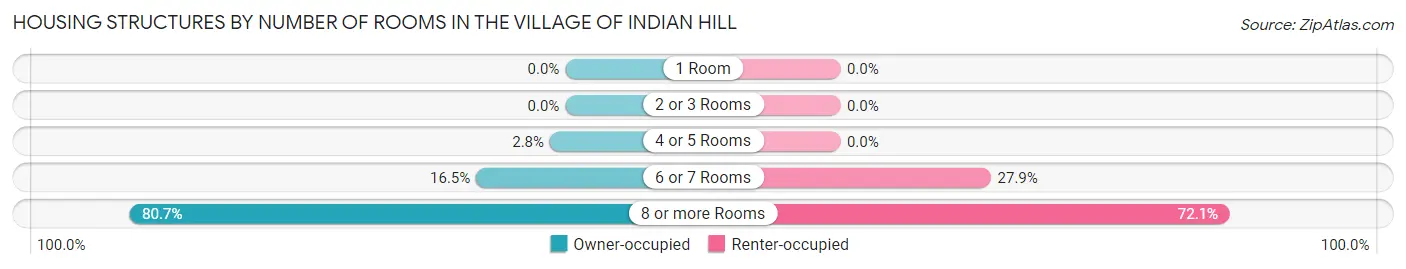
| Number of Rooms | Owner-occupied | Renter-occupied |
| 1 Room | 0 (0.0%) | 0 (0.0%) |
| 2 or 3 Rooms | 0 (0.0%) | 0 (0.0%) |
| 4 or 5 Rooms | 67 (2.8%) | 0 (0.0%) |
| 6 or 7 Rooms | 389 (16.5%) | 17 (27.9%) |
| 8 or more Rooms | 1,904 (80.7%) | 44 (72.1%) |
| Total | 2,360 (100.0%) | 61 (100.0%) |
Housing Structure by Heating Type in The Village of Indian Hill
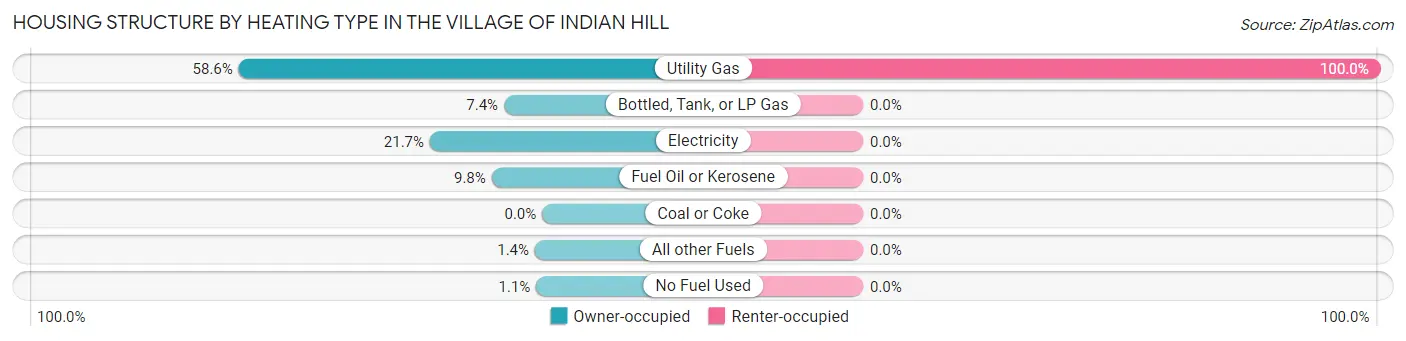
| Heating Type | Owner-occupied | Renter-occupied |
| Utility Gas | 1,384 (58.6%) | 61 (100.0%) |
| Bottled, Tank, or LP Gas | 174 (7.4%) | 0 (0.0%) |
| Electricity | 512 (21.7%) | 0 (0.0%) |
| Fuel Oil or Kerosene | 230 (9.8%) | 0 (0.0%) |
| Coal or Coke | 0 (0.0%) | 0 (0.0%) |
| All other Fuels | 33 (1.4%) | 0 (0.0%) |
| No Fuel Used | 27 (1.1%) | 0 (0.0%) |
| Total | 2,360 (100.0%) | 61 (100.0%) |
Household Vehicle Usage in The Village of Indian Hill
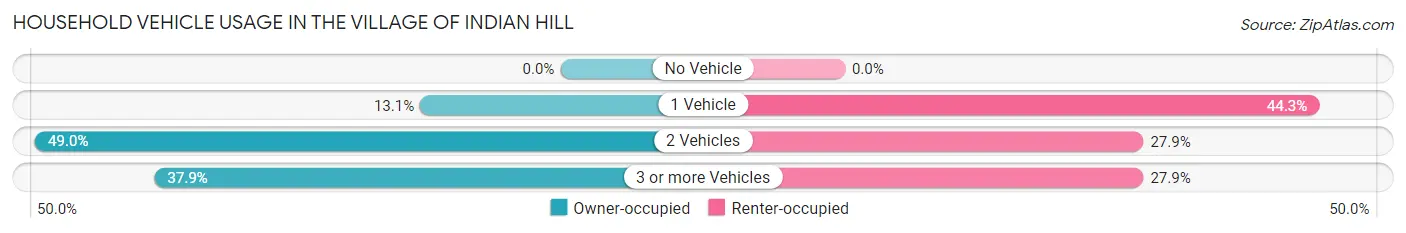
| Vehicles per Household | Owner-occupied | Renter-occupied |
| No Vehicle | 0 (0.0%) | 0 (0.0%) |
| 1 Vehicle | 309 (13.1%) | 27 (44.3%) |
| 2 Vehicles | 1,157 (49.0%) | 17 (27.9%) |
| 3 or more Vehicles | 894 (37.9%) | 17 (27.9%) |
| Total | 2,360 (100.0%) | 61 (100.0%) |
Real Estate & Mortgages in The Village of Indian Hill
Real Estate and Mortgage Overview in The Village of Indian Hill
| Characteristic | Without Mortgage | With Mortgage |
| Housing Units | 746 | 1,614 |
| Median Property Value | $925,500 | $1,174,500 |
| Median Household Income | $188,750 | $1,188 |
| Monthly Housing Costs | $1,473 | $1,428 |
| Real Estate Taxes | $10,001 | $0 |
Property Value by Mortgage Status in The Village of Indian Hill
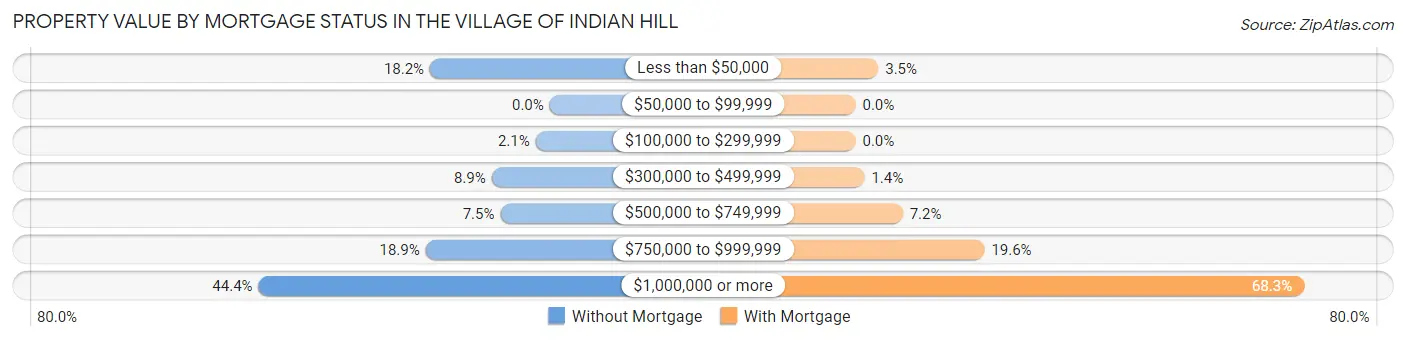
| Property Value | Without Mortgage | With Mortgage |
| Less than $50,000 | 136 (18.2%) | 56 (3.5%) |
| $50,000 to $99,999 | 0 (0.0%) | 0 (0.0%) |
| $100,000 to $299,999 | 16 (2.1%) | 0 (0.0%) |
| $300,000 to $499,999 | 66 (8.8%) | 22 (1.4%) |
| $500,000 to $749,999 | 56 (7.5%) | 116 (7.2%) |
| $750,000 to $999,999 | 141 (18.9%) | 317 (19.6%) |
| $1,000,000 or more | 331 (44.4%) | 1,103 (68.3%) |
| Total | 746 (100.0%) | 1,614 (100.0%) |
Household Income by Mortgage Status in The Village of Indian Hill
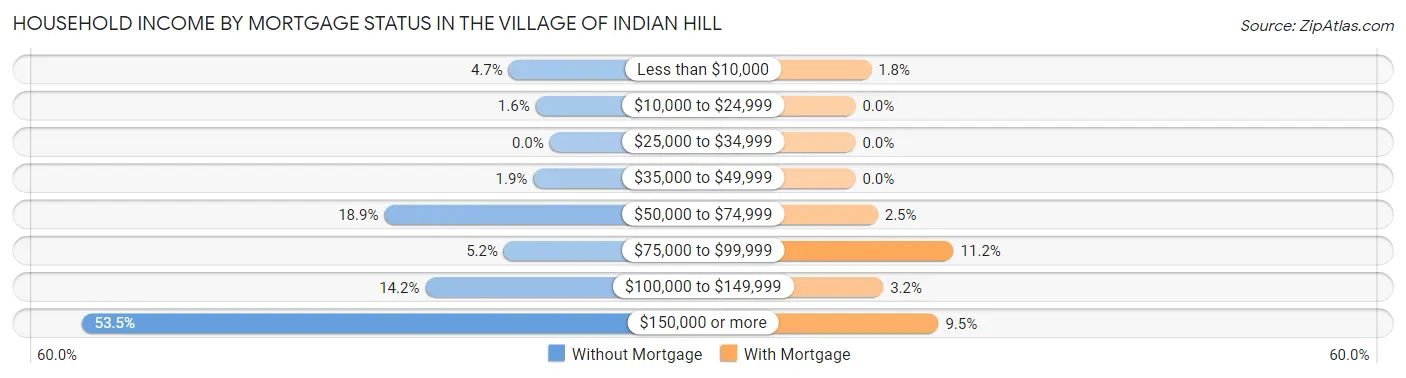
| Household Income | Without Mortgage | With Mortgage |
| Less than $10,000 | 35 (4.7%) | 29 (1.8%) |
| $10,000 to $24,999 | 12 (1.6%) | 0 (0.0%) |
| $25,000 to $34,999 | 0 (0.0%) | 0 (0.0%) |
| $35,000 to $49,999 | 14 (1.9%) | 0 (0.0%) |
| $50,000 to $74,999 | 141 (18.9%) | 41 (2.5%) |
| $75,000 to $99,999 | 39 (5.2%) | 181 (11.2%) |
| $100,000 to $149,999 | 106 (14.2%) | 51 (3.2%) |
| $150,000 or more | 399 (53.5%) | 153 (9.5%) |
| Total | 746 (100.0%) | 1,614 (100.0%) |
Property Value to Household Income Ratio in The Village of Indian Hill
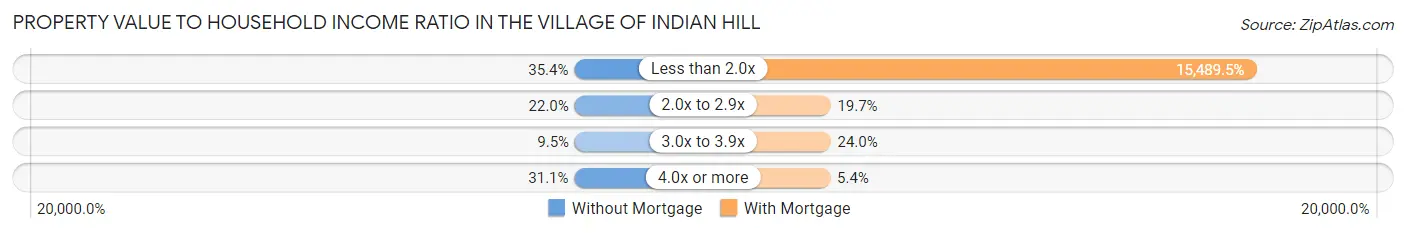
| Value-to-Income Ratio | Without Mortgage | With Mortgage |
| Less than 2.0x | 264 (35.4%) | 250,001 (15,489.5%) |
| 2.0x to 2.9x | 164 (22.0%) | 318 (19.7%) |
| 3.0x to 3.9x | 71 (9.5%) | 387 (24.0%) |
| 4.0x or more | 232 (31.1%) | 87 (5.4%) |
| Total | 746 (100.0%) | 1,614 (100.0%) |
Real Estate Taxes by Mortgage Status in The Village of Indian Hill
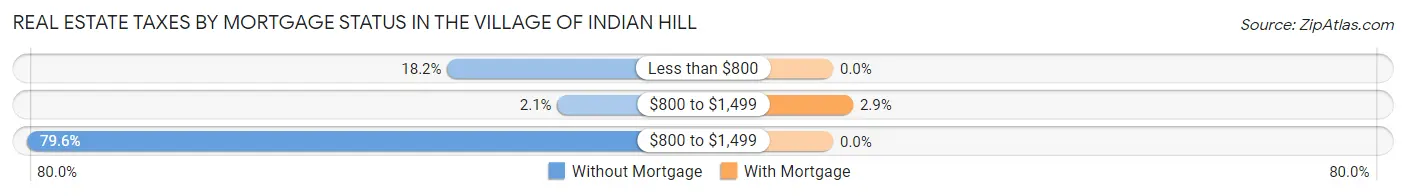
| Property Taxes | Without Mortgage | With Mortgage |
| Less than $800 | 136 (18.2%) | 0 (0.0%) |
| $800 to $1,499 | 16 (2.1%) | 47 (2.9%) |
| $800 to $1,499 | 594 (79.6%) | 0 (0.0%) |
| Total | 746 (100.0%) | 1,614 (100.0%) |
Health & Disability in The Village of Indian Hill
Health Insurance Coverage by Age in The Village of Indian Hill
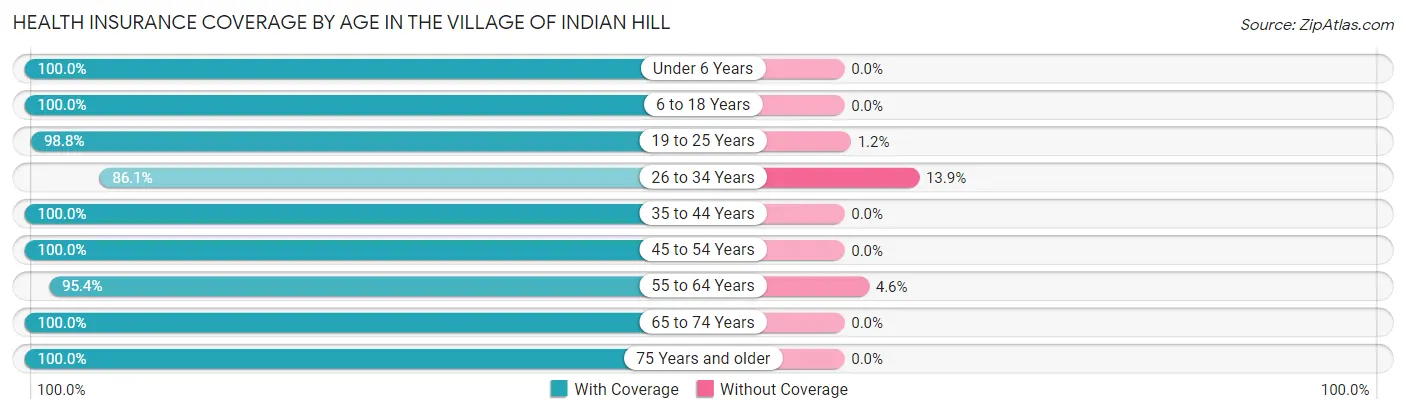
| Age Bracket | With Coverage | Without Coverage |
| Under 6 Years | 239 (100.0%) | 0 (0.0%) |
| 6 to 18 Years | 1,091 (100.0%) | 0 (0.0%) |
| 19 to 25 Years | 82 (98.8%) | 1 (1.2%) |
| 26 to 34 Years | 241 (86.1%) | 39 (13.9%) |
| 35 to 44 Years | 547 (100.0%) | 0 (0.0%) |
| 45 to 54 Years | 773 (100.0%) | 0 (0.0%) |
| 55 to 64 Years | 1,190 (95.4%) | 57 (4.6%) |
| 65 to 74 Years | 914 (100.0%) | 0 (0.0%) |
| 75 Years and older | 877 (100.0%) | 0 (0.0%) |
| Total | 5,954 (98.4%) | 97 (1.6%) |
Health Insurance Coverage by Citizenship Status in The Village of Indian Hill
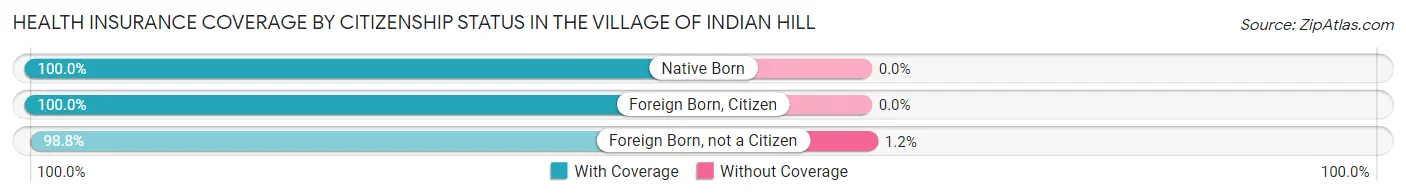
| Citizenship Status | With Coverage | Without Coverage |
| Native Born | 239 (100.0%) | 0 (0.0%) |
| Foreign Born, Citizen | 1,091 (100.0%) | 0 (0.0%) |
| Foreign Born, not a Citizen | 82 (98.8%) | 1 (1.2%) |
Health Insurance Coverage by Household Income in The Village of Indian Hill
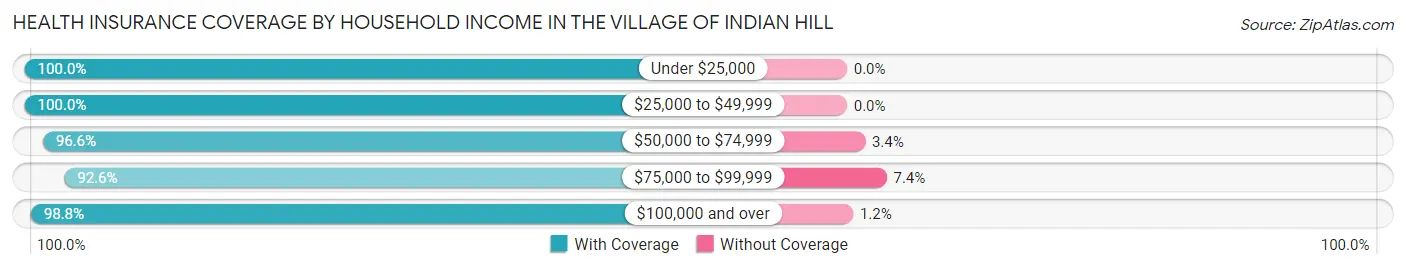
| Household Income | With Coverage | Without Coverage |
| Under $25,000 | 60 (100.0%) | 0 (0.0%) |
| $25,000 to $49,999 | 173 (100.0%) | 0 (0.0%) |
| $50,000 to $74,999 | 652 (96.6%) | 23 (3.4%) |
| $75,000 to $99,999 | 199 (92.6%) | 16 (7.4%) |
| $100,000 and over | 4,858 (98.8%) | 57 (1.2%) |
Public vs Private Health Insurance Coverage by Age in The Village of Indian Hill
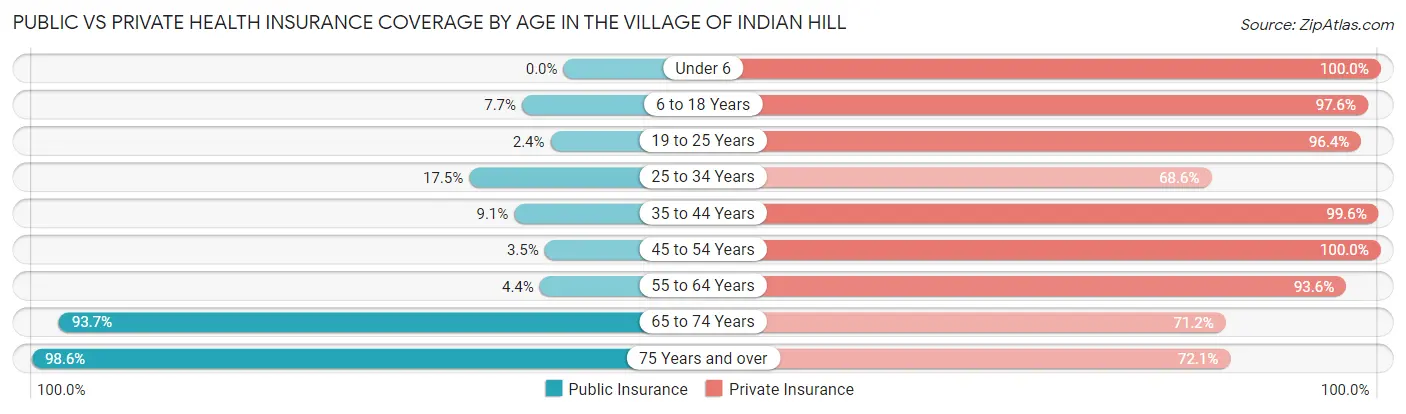
| Age Bracket | Public Insurance | Private Insurance |
| Under 6 | 0 (0.0%) | 239 (100.0%) |
| 6 to 18 Years | 84 (7.7%) | 1,065 (97.6%) |
| 19 to 25 Years | 2 (2.4%) | 80 (96.4%) |
| 25 to 34 Years | 49 (17.5%) | 192 (68.6%) |
| 35 to 44 Years | 50 (9.1%) | 545 (99.6%) |
| 45 to 54 Years | 27 (3.5%) | 773 (100.0%) |
| 55 to 64 Years | 55 (4.4%) | 1,167 (93.6%) |
| 65 to 74 Years | 856 (93.6%) | 651 (71.2%) |
| 75 Years and over | 865 (98.6%) | 632 (72.1%) |
| Total | 1,988 (32.9%) | 5,344 (88.3%) |
Disability Status by Sex by Age in The Village of Indian Hill
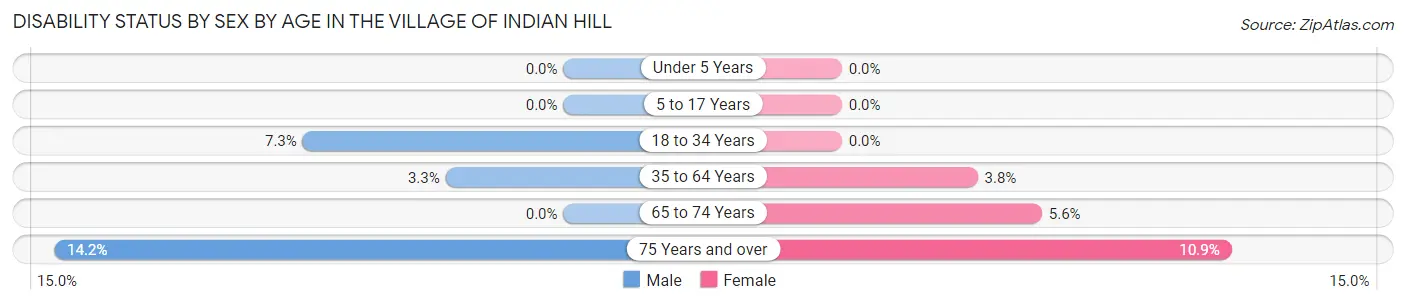
| Age Bracket | Male | Female |
| Under 5 Years | 0 (0.0%) | 0 (0.0%) |
| 5 to 17 Years | 0 (0.0%) | 0 (0.0%) |
| 18 to 34 Years | 13 (7.3%) | 0 (0.0%) |
| 35 to 64 Years | 40 (3.3%) | 51 (3.8%) |
| 65 to 74 Years | 0 (0.0%) | 19 (5.6%) |
| 75 Years and over | 59 (14.2%) | 50 (10.8%) |
Disability Class by Sex by Age in The Village of Indian Hill
Disability Class: Hearing Difficulty
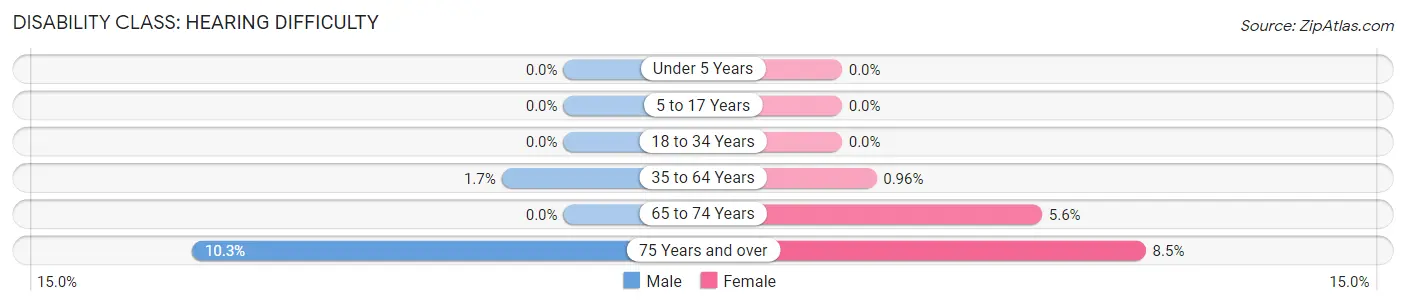
| Age Bracket | Male | Female |
| Under 5 Years | 0 (0.0%) | 0 (0.0%) |
| 5 to 17 Years | 0 (0.0%) | 0 (0.0%) |
| 18 to 34 Years | 0 (0.0%) | 0 (0.0%) |
| 35 to 64 Years | 21 (1.7%) | 13 (1.0%) |
| 65 to 74 Years | 0 (0.0%) | 19 (5.6%) |
| 75 Years and over | 43 (10.3%) | 39 (8.5%) |
Disability Class: Vision Difficulty
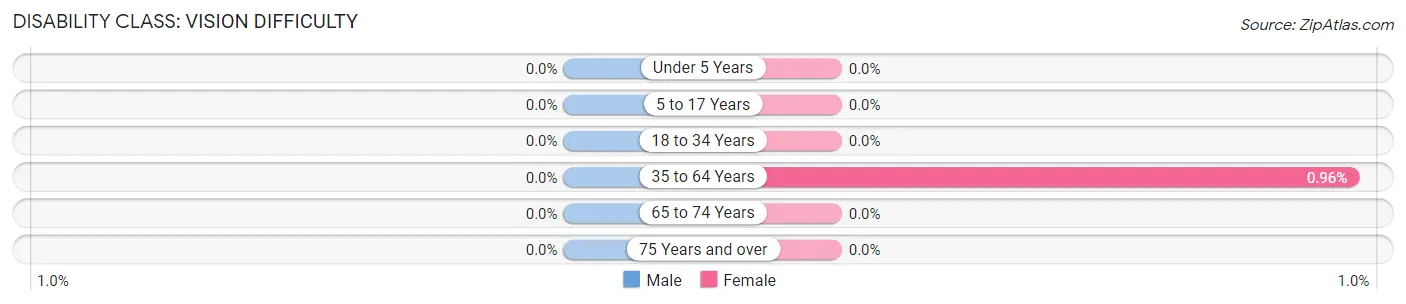
| Age Bracket | Male | Female |
| Under 5 Years | 0 (0.0%) | 0 (0.0%) |
| 5 to 17 Years | 0 (0.0%) | 0 (0.0%) |
| 18 to 34 Years | 0 (0.0%) | 0 (0.0%) |
| 35 to 64 Years | 0 (0.0%) | 13 (1.0%) |
| 65 to 74 Years | 0 (0.0%) | 0 (0.0%) |
| 75 Years and over | 0 (0.0%) | 0 (0.0%) |
Disability Class: Cognitive Difficulty
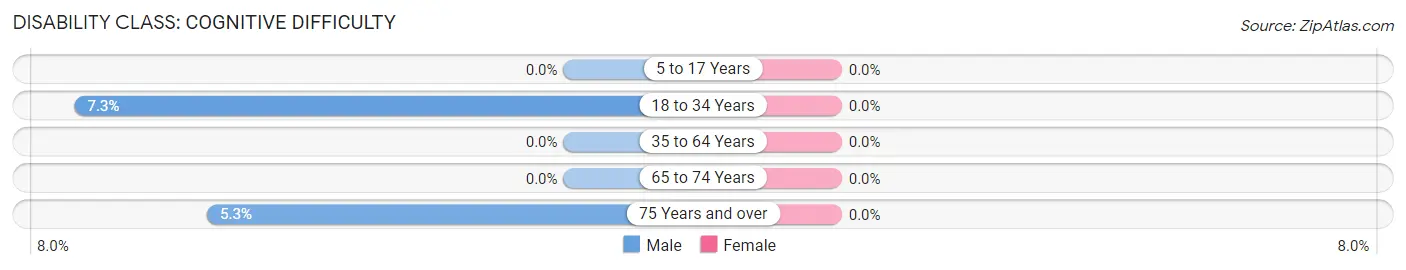
| Age Bracket | Male | Female |
| 5 to 17 Years | 0 (0.0%) | 0 (0.0%) |
| 18 to 34 Years | 13 (7.3%) | 0 (0.0%) |
| 35 to 64 Years | 0 (0.0%) | 0 (0.0%) |
| 65 to 74 Years | 0 (0.0%) | 0 (0.0%) |
| 75 Years and over | 22 (5.3%) | 0 (0.0%) |
Disability Class: Ambulatory Difficulty
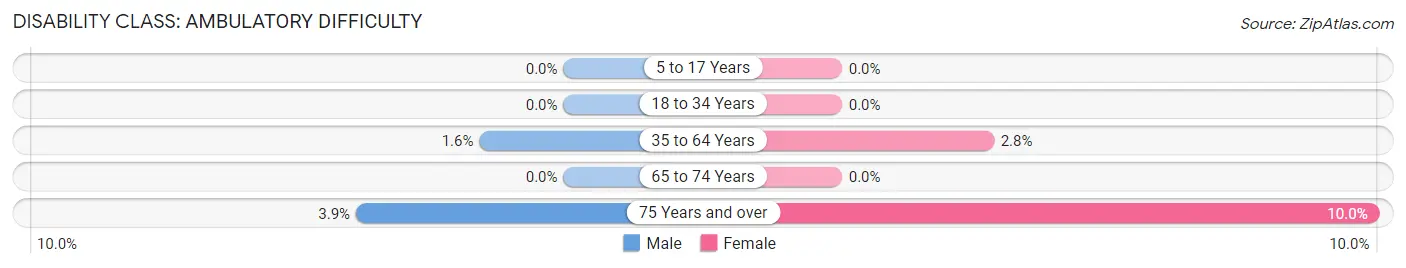
| Age Bracket | Male | Female |
| 5 to 17 Years | 0 (0.0%) | 0 (0.0%) |
| 18 to 34 Years | 0 (0.0%) | 0 (0.0%) |
| 35 to 64 Years | 19 (1.6%) | 38 (2.8%) |
| 65 to 74 Years | 0 (0.0%) | 0 (0.0%) |
| 75 Years and over | 16 (3.8%) | 46 (10.0%) |
Disability Class: Self-Care Difficulty
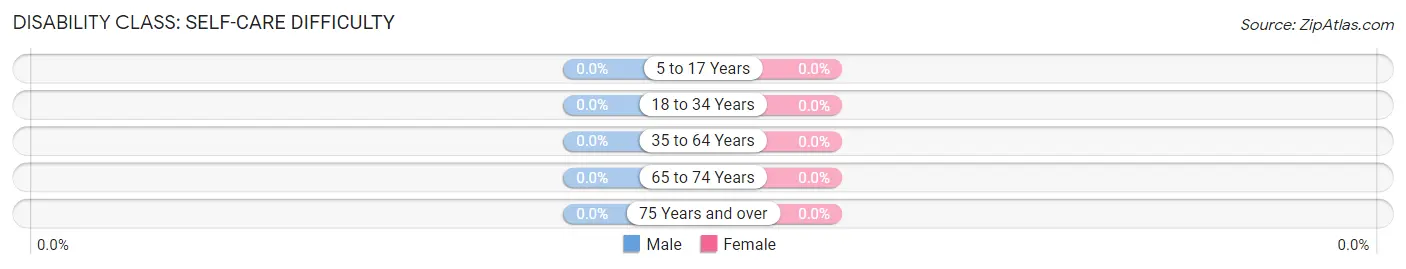
| Age Bracket | Male | Female |
| 5 to 17 Years | 0 (0.0%) | 0 (0.0%) |
| 18 to 34 Years | 0 (0.0%) | 0 (0.0%) |
| 35 to 64 Years | 0 (0.0%) | 0 (0.0%) |
| 65 to 74 Years | 0 (0.0%) | 0 (0.0%) |
| 75 Years and over | 0 (0.0%) | 0 (0.0%) |
Technology Access in The Village of Indian Hill
Computing Device Access in The Village of Indian Hill
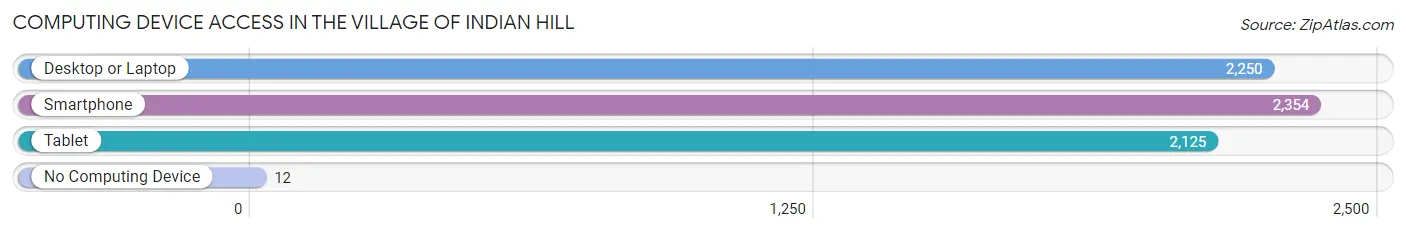
| Device Type | # Households | % Households |
| Desktop or Laptop | 2,250 | 92.9% |
| Smartphone | 2,354 | 97.2% |
| Tablet | 2,125 | 87.8% |
| No Computing Device | 12 | 0.5% |
| Total | 2,421 | 100.0% |
Internet Access in The Village of Indian Hill
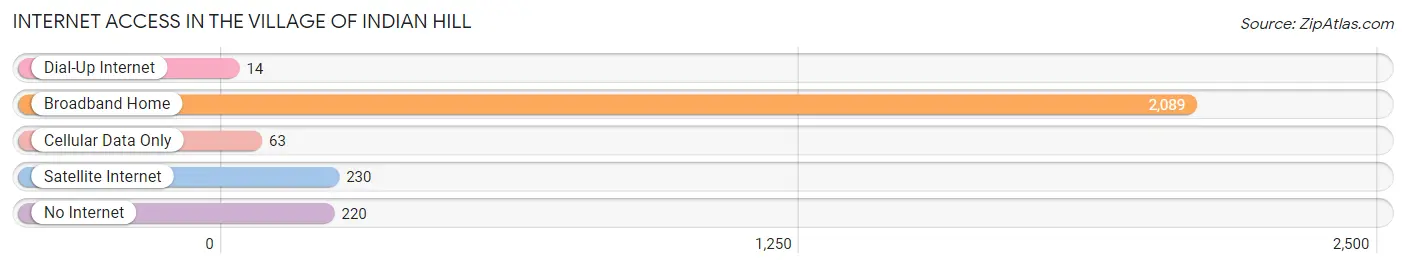
| Internet Type | # Households | % Households |
| Dial-Up Internet | 14 | 0.6% |
| Broadband Home | 2,089 | 86.3% |
| Cellular Data Only | 63 | 2.6% |
| Satellite Internet | 230 | 9.5% |
| No Internet | 220 | 9.1% |
| Total | 2,421 | 100.0% |
The Village of Indian Hill Summary
The Village of Indian Hill is a small, affluent suburb of Cincinnati, Ohio located in Hamilton County. It is situated on the eastern side of the Little Miami River, and is bordered by the cities of Madeira, Montgomery, and Sycamore Township. The village is home to approximately 5,800 residents, and is known for its excellent schools, low crime rate, and high quality of life.
History
The area now known as Indian Hill was originally inhabited by the Shawnee Native American tribe. The first European settlers arrived in the area in the late 1700s, and the village was officially incorporated in 1941. The village was named after the nearby Indian Hill, which was a sacred burial ground for the Shawnee.
Geography
Indian Hill is located in the eastern part of Hamilton County, Ohio. It is situated on the eastern side of the Little Miami River, and is bordered by the cities of Madeira, Montgomery, and Sycamore Township. The village covers an area of approximately 8.5 square miles, and is home to approximately 5,800 residents.
Economy
The economy of Indian Hill is largely based on the service industry, with many residents employed in professional and managerial positions. The village is also home to several small businesses, including restaurants, retail stores, and professional services. The median household income in Indian Hill is $200,000, making it one of the wealthiest communities in the state of Ohio.
Demographics
As of the 2010 census, the population of Indian Hill was 5,800. The racial makeup of the village was 94.3% White, 1.3% African American, 0.2% Native American, 2.7% Asian, and 1.5% from other races. The median age of residents was 45.7 years, and the median household income was $200,000.
Conclusion
The Village of Indian Hill is a small, affluent suburb of Cincinnati, Ohio located in Hamilton County. It is known for its excellent schools, low crime rate, and high quality of life. The economy of Indian Hill is largely based on the service industry, with many residents employed in professional and managerial positions. The village is also home to several small businesses, including restaurants, retail stores, and professional services. The population of Indian Hill is 5,800, and the median household income is $200,000.
Common Questions
What is the Total Population of The Village of Indian Hill?
Total Population of The Village of Indian Hill is 6,051.
What is the Total Male Population of The Village of Indian Hill?
Total Male Population of The Village of Indian Hill is 2,983.
What is the Total Female Population of The Village of Indian Hill?
Total Female Population of The Village of Indian Hill is 3,068.
What is the Ratio of Males per 100 Females in The Village of Indian Hill?
There are 97.23 Males per 100 Females in The Village of Indian Hill.
What is the Ratio of Females per 100 Males in The Village of Indian Hill?
There are 102.85 Females per 100 Males in The Village of Indian Hill.
What is the Median Population Age in The Village of Indian Hill?
Median Population Age in The Village of Indian Hill is 55.2 Years.
What is the Average Family Size in The Village of Indian Hill
Average Family Size in The Village of Indian Hill is 2.6 People.
What is the Average Household Size in The Village of Indian Hill
Average Household Size in The Village of Indian Hill is 2.5 People.
What is Per Capita Income in The Village of Indian Hill?
Per Capita income in The Village of Indian Hill is $153,530.
What is the Median Family Income in The Village of Indian Hill?
Median Family Income in The Village of Indian Hill is $247,938.
What is the Median Household income in The Village of Indian Hill?
Median Household Income in The Village of Indian Hill is $218,073.
What is Income or Wage Gap in The Village of Indian Hill?
Income or Wage Gap in The Village of Indian Hill is 73.0%.
Women in The Village of Indian Hill earn 27.0 cents for every dollar earned by a man.
What is Inequality or Gini Index in The Village of Indian Hill?
Inequality or Gini Index in The Village of Indian Hill is 0.51.
How Large is the Labor Force in The Village of Indian Hill?
There are 2,642 People in the Labor Forcein in The Village of Indian Hill.
What is the Percentage of People in the Labor Force in The Village of Indian Hill?
54.6% of People are in the Labor Force in The Village of Indian Hill.
What is the Unemployment Rate in The Village of Indian Hill?
Unemployment Rate in The Village of Indian Hill is 2.6%.